
Abstract
Background:
Nocturnal hypoglycemia is a common complication in people with diabetes. The use of continuous glucose monitoring (CGM) has reduced the frequency of hypoglycemia and improved its clinical characterization; however, available CGM data mostly focus on overall or diurnal hypoglycemia in people with type 1 diabetes (T1D). This real-world study compared the frequency and duration of nocturnal versus diurnal hypoglycemia in people with T1D or type 2 diabetes (T2D) and evaluated the subsequent impact of nocturnal hypoglycemia on daytime glucose profiles.
Methods:
Between January 2010 and September 2023, CGM data during the first month of use were collected retrospectively from people with T1D (n = 3696) or T2D (n = 441) using multiple daily insulin injections. Hypoglycemic events were identified as CGM readings: <70 mg/dL or <54 mg/dL for at least 15 min. The incidence and duration of hypoglycemic events were calculated for diurnal and nocturnal periods. The effect of nocturnal hypoglycemic events on glycemia the following day was assessed.
Results:
Nocturnal hypoglycemia occurred less frequently than diurnal events in both persons with T1D (median [interquartile range, IQR] 0.54 [0.0, 1.5] vs. 2.25 [0.64, 5.25] events per week) and those with T2D (median [IQR] 0 [0.0, 0.52] vs. 0.30 [0.0, 1.21] events per week). In T1D, nocturnal hypoglycemia events had a 65-min median duration compared with 40 min for diurnal events (P < 0.001). Similar trends were observed in T2D, with nocturnal hypoglycemia events lasting 57 min versus 40 min diurnally (P < 0.001). Significant changes in multiple glycemic parameters were observed during days following nocturnal hypoglycemic events versus days following nights without hypoglycemia. These findings suggest a heightened risk of morning hypoglycemia following nocturnal hypoglycemia.
Conclusion:
These results showed that nocturnal hypoglycemia is characterized by longer duration and slower recovery than daytime hypoglycemia, with significant effects on next-day glycemic control, which emphasizes the need for improved prevention strategies.
Introduction
Hypoglycemia remains a common complication in people with diabetes and is often an important limiting factor in their glycemic management. Although more frequent among people with type 1 diabetes (T1D) treated with insulin, people with type 2 diabetes (T2D) are also at risk of hypoglycemia. In a recent systematic review and meta-analysis, the incidence rate of hypoglycemia ranged from 14.5 to 42,890 episodes per 1000 person-years for individuals with T1D and from 0.072 to 16,360 episodes per 1000-person years for individuals with T2D. 1
Although diurnal hypoglycemia and nocturnal hypoglycemia have the same causative factors, nocturnal hypoglycemia presents a particular problem because of the challenges associated with its recognition, prevention, and treatment. 2 Clinical manifestations of nocturnal hypoglycemia include sleep disturbances (through a direct impact on sleep quality and, indirectly, due to anxiety or glucose alarms during the night), morning headache, fatigue, anxiety, mood changes, and an increased risk of cardiovascular events and all-cause mortality.2–4 In addition to its physiological effects, nocturnal hypoglycemia also imposes a significant psychological and socioeconomic burden on people with diabetes, with a different impact on quality of life to diurnal hypoglycemia. 2
Fear of hypoglycemia, including nocturnal hypoglycemia, is common in people with T1D and T2D, and it may lead to compensatory behaviors to avoid future episodes. Such behaviors include reducing insulin doses, missing injections, or snacking continually to maintain higher blood glucose levels, all of which can negatively impact diabetes self-management and glycemic outcomes.5–8
The impact of these effects of nocturnal hypoglycemia on the daily lives, personal relationships, and emotional well-being of family members and partners is also well documented. 9 Nocturnal hypoglycemia is associated with increased health care costs required to treat hypoglycemic events, as well as personal financial costs associated with loss of performance and reduced productivity due to difficulties concentrating or absence from work or school.2,10
The introduction of continuous glucose monitoring (CGM) has allowed closer, more accurate monitoring of patients’ glucose levels, thereby improving disease management and providing important insights into the incidence, severity, and duration of hypoglycemic events. 11 Available CGM data predominantly focus on overall or diurnal hypoglycemia in people with T1D, with fewer data available on nocturnal hypoglycemia in T2D.12–17
A recent retrospective analysis of an observational, multicenter clinical study evaluated nocturnal hypoglycemic events in a population with T1D treated with multiple daily insulin (MDI) injection therapy in conjunction with CGM. 18 This analysis showed that nocturnal hypoglycemic events were common in the study population, with characteristics that differed significantly (e.g., a longer duration) from the characteristics of diurnal hypoglycemic events. 18 Nocturnal hypoglycemic events were also reported to have a strong impact on glycemic control the following day, leading to a decrease in morning glucose levels. 18
To complement and build on these clinical findings and to expand the data to people with T2D, thus helping to inform routine clinical practice, we conducted a real-world data (RWD) study to characterize the incidence and time course of hypoglycemic events in adults with T1D and T2D using CGM and MDI in a real-world setting. Consideration was given to the difference between nocturnal and diurnal events and to the relationship between the occurrence of nocturnal hypoglycemic events and glucose levels the following day.
Materials and Methods
Study population
All data used in this study were collected through the production backend of the mySugr® mobile application (mySugr GmbH, Vienna, Austria). The study included people who were actively using the mySugr application and had accepted the electronic consent for data processing that allowed usage of their data for research purposes; data were anonymized prior to study analysis. In addition, for inclusion, people needed to have completed the voluntary diabetes diagnosis field in the application, have a diagnosis of T1D or T2D, and be on an insulin therapy, including rapid-acting insulin. This included all people with T1D and people with T2D who had at least one logbook entry with rapid-acting insulin. At least 80% CGM coverage during the first month of CGM data imported into the mySugr application was also required, and, from these data, we only included days that individually had at least 80% CGM coverage.
CGM data processing
Gaps in CGM data that were shorter than 30 min were filled using linear interpolation.18–20 CGM measurements with a rate of change >10 mg/dL/min were removed since such changes were not considered to be physiologically plausible.
Identification of hypoglycemic events
As per international consensus, 21 hypoglycemic events were categorized as glucose levels below 70 mg/dL (3.9 mmol/L). Events where glucose levels fell below 54 mg/dL (3.0 mmol/L) were also captured and analyzed. Based on these definitions, every event below 54 mg/dL was also counted as an event below 70 mg/dL, with the possibility of multiple <54 mg/dL events occurring within a <70 mg/dL event. To avoid spurious event calling, we required at least four consecutive CGM readings below the respective threshold to start a hypoglycemic event and at least four consecutive CGM readings above or at the threshold to stop the event, in alignment with Eichenlaub et al. 18 The minimum duration of a hypoglycemic event was 15 min. Depending on the start time of the hypoglycemic events, they were categorized as either nocturnal (0:00–05:59) or diurnal (06:00–23:59).
Statistical analysis
Data from the first month of CGM use were included in the analysis. The incidence of nocturnal and diurnal hypoglycemic events was presented as mean and median occurrences of events together with the standard deviation (SD) and the interquartile range (IQR), separated into <54 and <70 mg/dL events. Incidences were normalized by week and per 100 h to make the diurnal and nocturnal incidences comparable. Normalization was performed per exposure time for each of the intervals, that is, separately for the nocturnal and diurnal periods.
Time below 54 mg/dL, time below range, time in range, and time above range were calculated as the percentage of CGM readings <54 mg/dL (3.0 mmol/L), <70 mg/dL (3.9 mmol/L), 70–180 mg/dL (3.9–10.0 mmol/L), and >180 mg/dL (10.0 mmol/L), respectively, out of all available CGM readings for each person separately.
Glycemic variability was assessed using the coefficient of variation (CV) calculated as the ratio between the SD and the mean value of the available CGM readings as a percentage.
Time <54 mg/dL, time below range, time in range, and time above range were calculated from CGM readings assigned to the corresponding time periods for both nocturnal and diurnal periods. Person-specific CVs during the overall, nocturnal, and diurnal periods were calculated as the mean of daily CVs, thus reflecting glycemic variability within days, as well as within nocturnal and diurnal periods.
All metrics were first calculated per patient and then averaged over all patients. For count metrics such as incidence, this involved summation of all events and then division by the number of patients. For other metrics such as average CGM values, values were first aggregated per patient to ensure each patient is weighted equivalently (i.e., to prevent patients with more CGM values from over-representation in the final metric). A Mann–Whitney U test was used to compare the incidence of weekly hypoglycemic events during the daytime and nighttime. This test was used instead of a t-test because it is more appropriate for data, such as hypoglycemic events, which are not normally distributed. 18 The duration of hypoglycemic events was also calculated, as well as the median time courses of CGM levels before, during, and after hypoglycemic events. A Mann–Whitney U test was used to compare the duration of nocturnal and diurnal general and level 2 events.
The impact of nocturnal hypoglycemic events on next-day glucose levels was examined. Glycemic metrics of daily mean blood glucose, CV, and proportions of measurements in and out of range were compared between days that followed, and days that did not follow, a nocturnal hypoglycemic event, using both descriptive statistics (median and IQR) and a Mann–Whitney U test. The impact of diurnal hypoglycemic events on next-night glucose levels was also examined using the same methodology.
Results
Population
A total population of 4137 people with T1D or T2D were included, of whom 3696 lived with T1D and 441 lived with T2D. Table 1 summarizes the baseline characteristics of the study population. People with T1D and T2D were well matched for number of years with diabetes and glucose management indicator. As expected, those with T2D were older than those with T1D (mean [SD] age: 38.55 [16.16] vs. 58.07 [13.89] years). In accordance with the inclusion criteria, all were treated with bolus insulin injections. People included in both groups had a mean of approximately 24 days with study data.
Baseline Characteristics of the Study Population
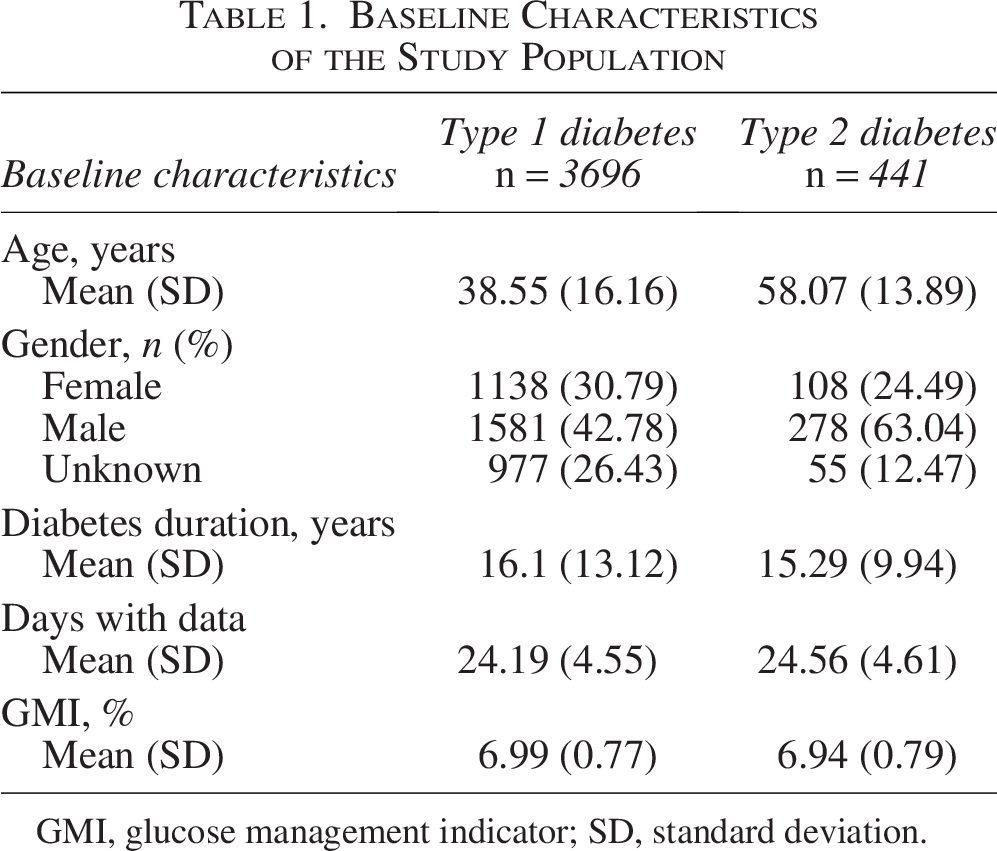
GMI, glucose management indicator; SD, standard deviation.
Incidence of hypoglycemic events
People with T1D had a median [IQR] of 3.11 [0.95, 6.71] (mean [SD] 4.66 [4.96]) hypoglycemic events per week (Table 2). The incidence of nocturnal hypoglycemic events was significantly lower than the incidence of general diurnal hypoglycemic events (median [IQR] 0.54 [0.0, 1.5] vs. 2.25 [0.64, 5.25] events per week [P < 0.01], mean [SD] 1.03 [1.28] vs. 3.63 [4.07]). Hypoglycemic events <54 mg/dL were recorded at a median [IQR] frequency of 0.27 [0.0, 1.25] (mean [SD] 1.08 [2.02]) events per week among those with T1D, with a median of 0 [0.0, 0.37] nocturnal and 0 [0.0, 0.78] diurnal events per week (mean [SD] 0.33 [0.68] and 0.75 [1.55] respectively, Table 3). The difference in nocturnal and diurnal incidence was also visible when normalizing the incidence rates to the different lengths of the nocturnal and diurnal time periods (per 100 h) for all hypoglycemic events (P < 0.001) and for those <54 mg/dL (P = 0.008; Tables 2 and 3).
Incidence of Hypoglycemic Events (Glucose <70 mg/dL) in People with Type 1 and Type 2 Diabetes
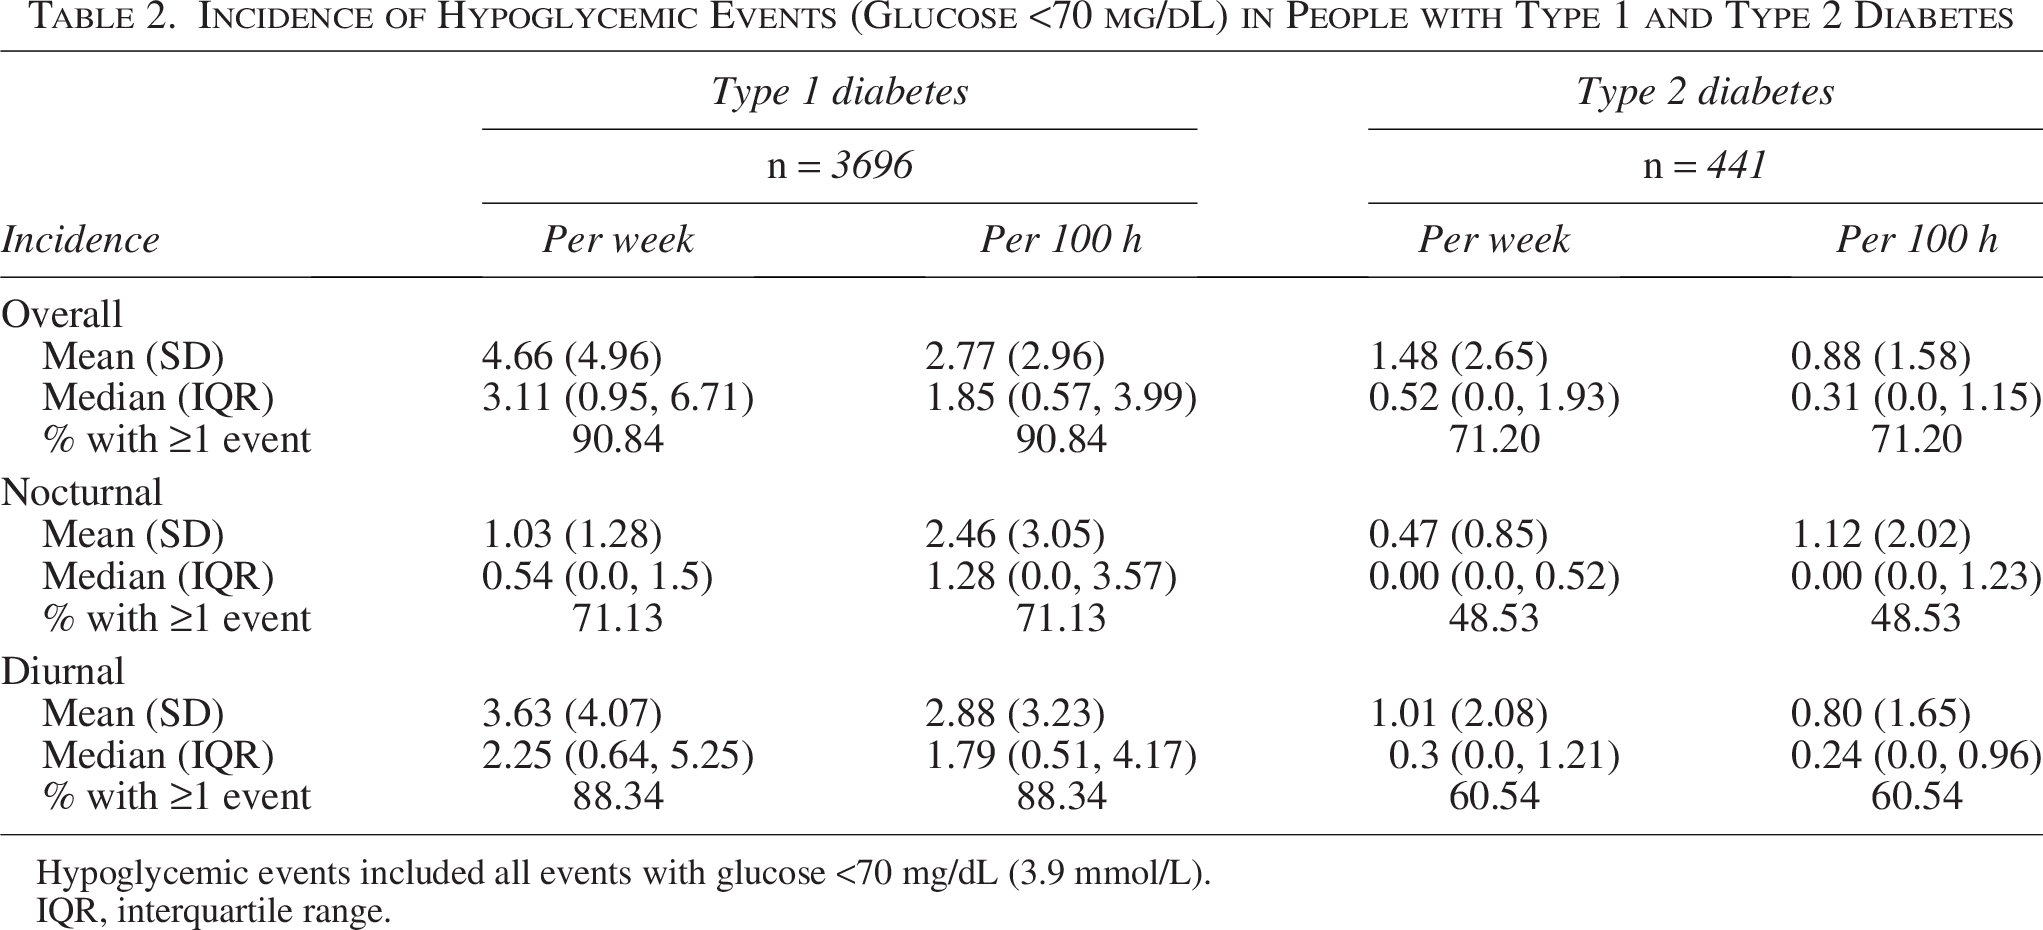
Hypoglycemic events included all events with glucose <70 mg/dL (3.9 mmol/L).
IQR, interquartile range.
Incidence of Glycemic Events (Glucose <54 mg/dL) in People with Type 1 and Type 2 Diabetes
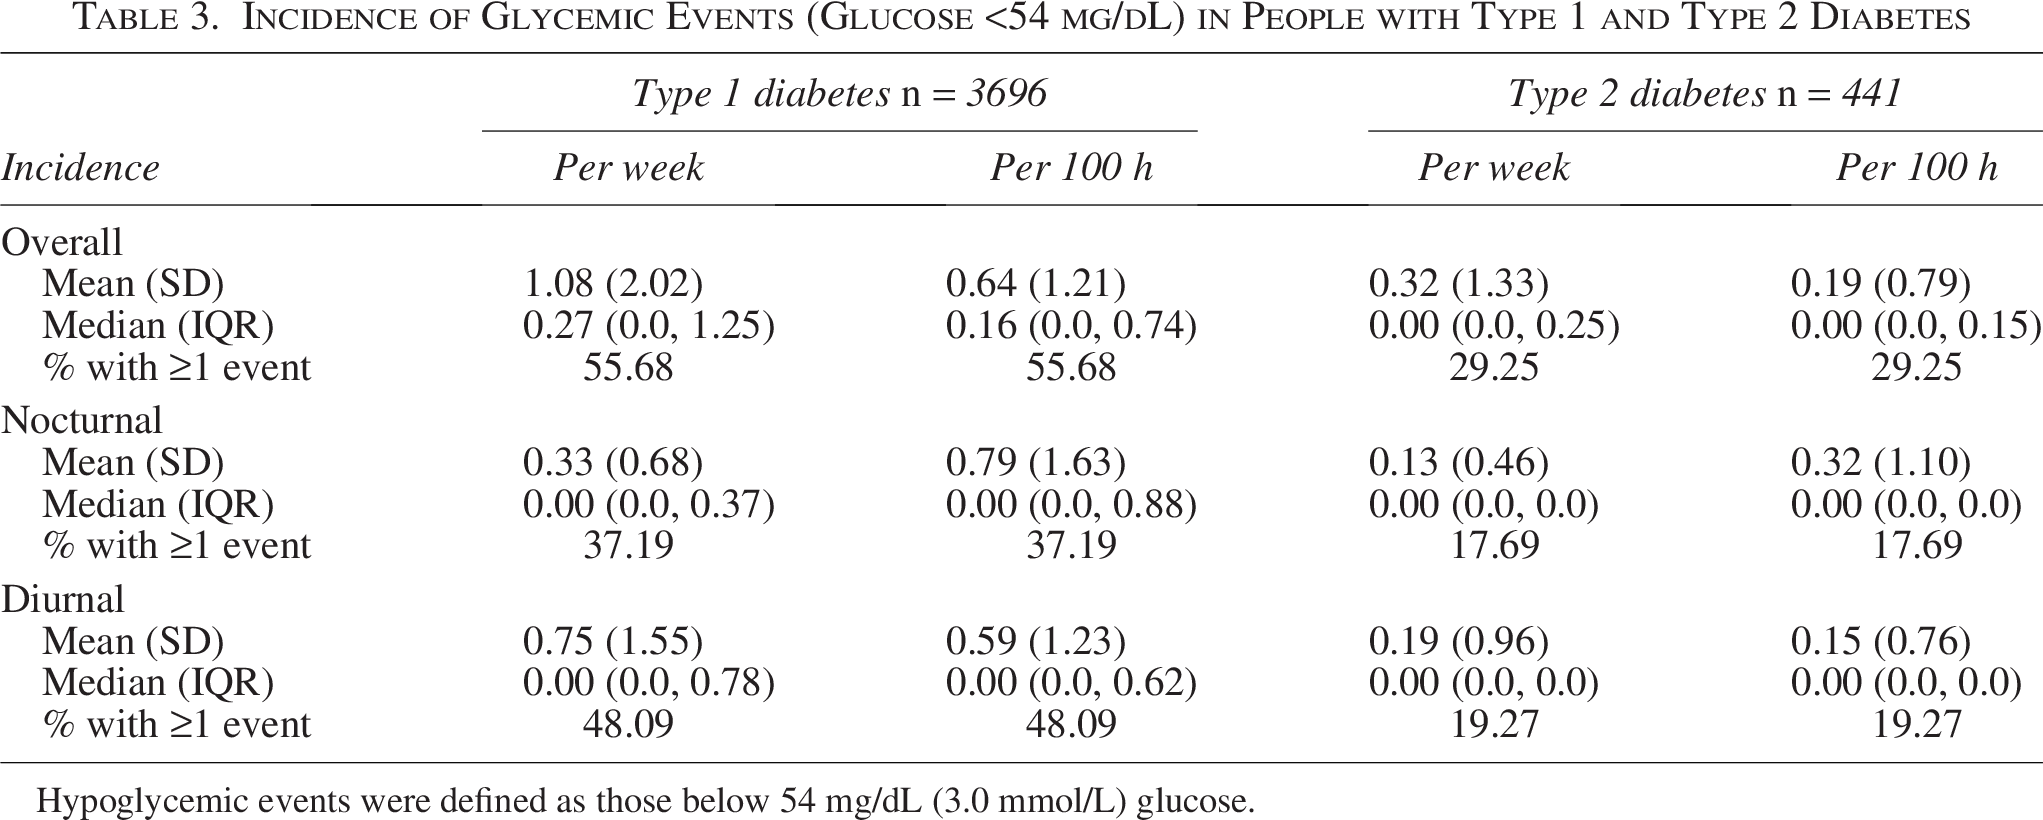
Hypoglycemic events were defined as those below 54 mg/dL (3.0 mmol/L) glucose.
People with T2D had a low incidence of hypoglycemic events, with a median [IQR] of 0.52 [0.0,1.93] (mean [SD] 1.48 [2.65]) events per week (Table 2) and significantly fewer nocturnal than diurnal hypoglycemic events per week (median [IQR] 0 [0.00, 0.52] vs. 0.30 [0.0,1.21] per week [P < 0.001], mean [SD] 0.47 [0.85] vs. 1.01 [2.08]).
Interestingly, when normalizing the incident rate to the different lengths of the diurnal and nocturnal periods, we were not able to detect significant differences for those with T2D (all hypoglycemic events, P = 0.99; events <54 mg/dL, P = 0.78), suggesting that the difference in nocturnal and diurnal hypoglycemia incidence for people with T2D may not be as pronounced as for T1D (Table 2). Indeed, the nocturnal mean hypoglycemia incidence rate per 100 h for those with T2D was higher than the mean diurnal incidence rate (mean [SD] of 1.12 [2.02] vs. 0.80 [1.65]). Hypoglycemic events <54 mg/dL were recorded at a median (IQR) incidence of 0 (0.0, 0.25) events per week among people with T2D.
For people with T1D, the median time spent in hypoglycemia was 1.5% during the nocturnal period and 1.7% during the diurnal period. For those with T2D, the median time spent in hypoglycemia was 0.38% and 0.27% during the nocturnal and diurnal periods, respectively (Supplementary Table S1).
Characteristics of hypoglycemic events
The duration of a hypoglycemic event was longer at night than during the day by approximately 25 min for people with T1D (median [IQR] 65 [40, 107] vs. 40 [30, 55] min, P < 0.001) and by approximately 17 min for people with T2D (median [IQR] 57 [30, 89] vs. 40 [28, 60] min, P < 0.001). For hypoglycemic events <54 mg/dL, we also observed a significantly increased duration during the night versus the day for T1D (median [IQR] 55 [33,95] vs. 35 [25, 49] min, P < 0.001), whereas, for T2D, we observed an increased median duration, but this was not statistically significant (median [IQR] 55 [35, 90] vs. 45 [28, 71] min).
The frequency of nocturnal hypoglycemia events increased sharply after midnight and was highest between midnight (00:00) and 02:00. Of all hypoglycemia events, 7.9% and 13.0% occurred between midnight and 02:00 in people with T1D and T2D, respectively (Fig. 1).
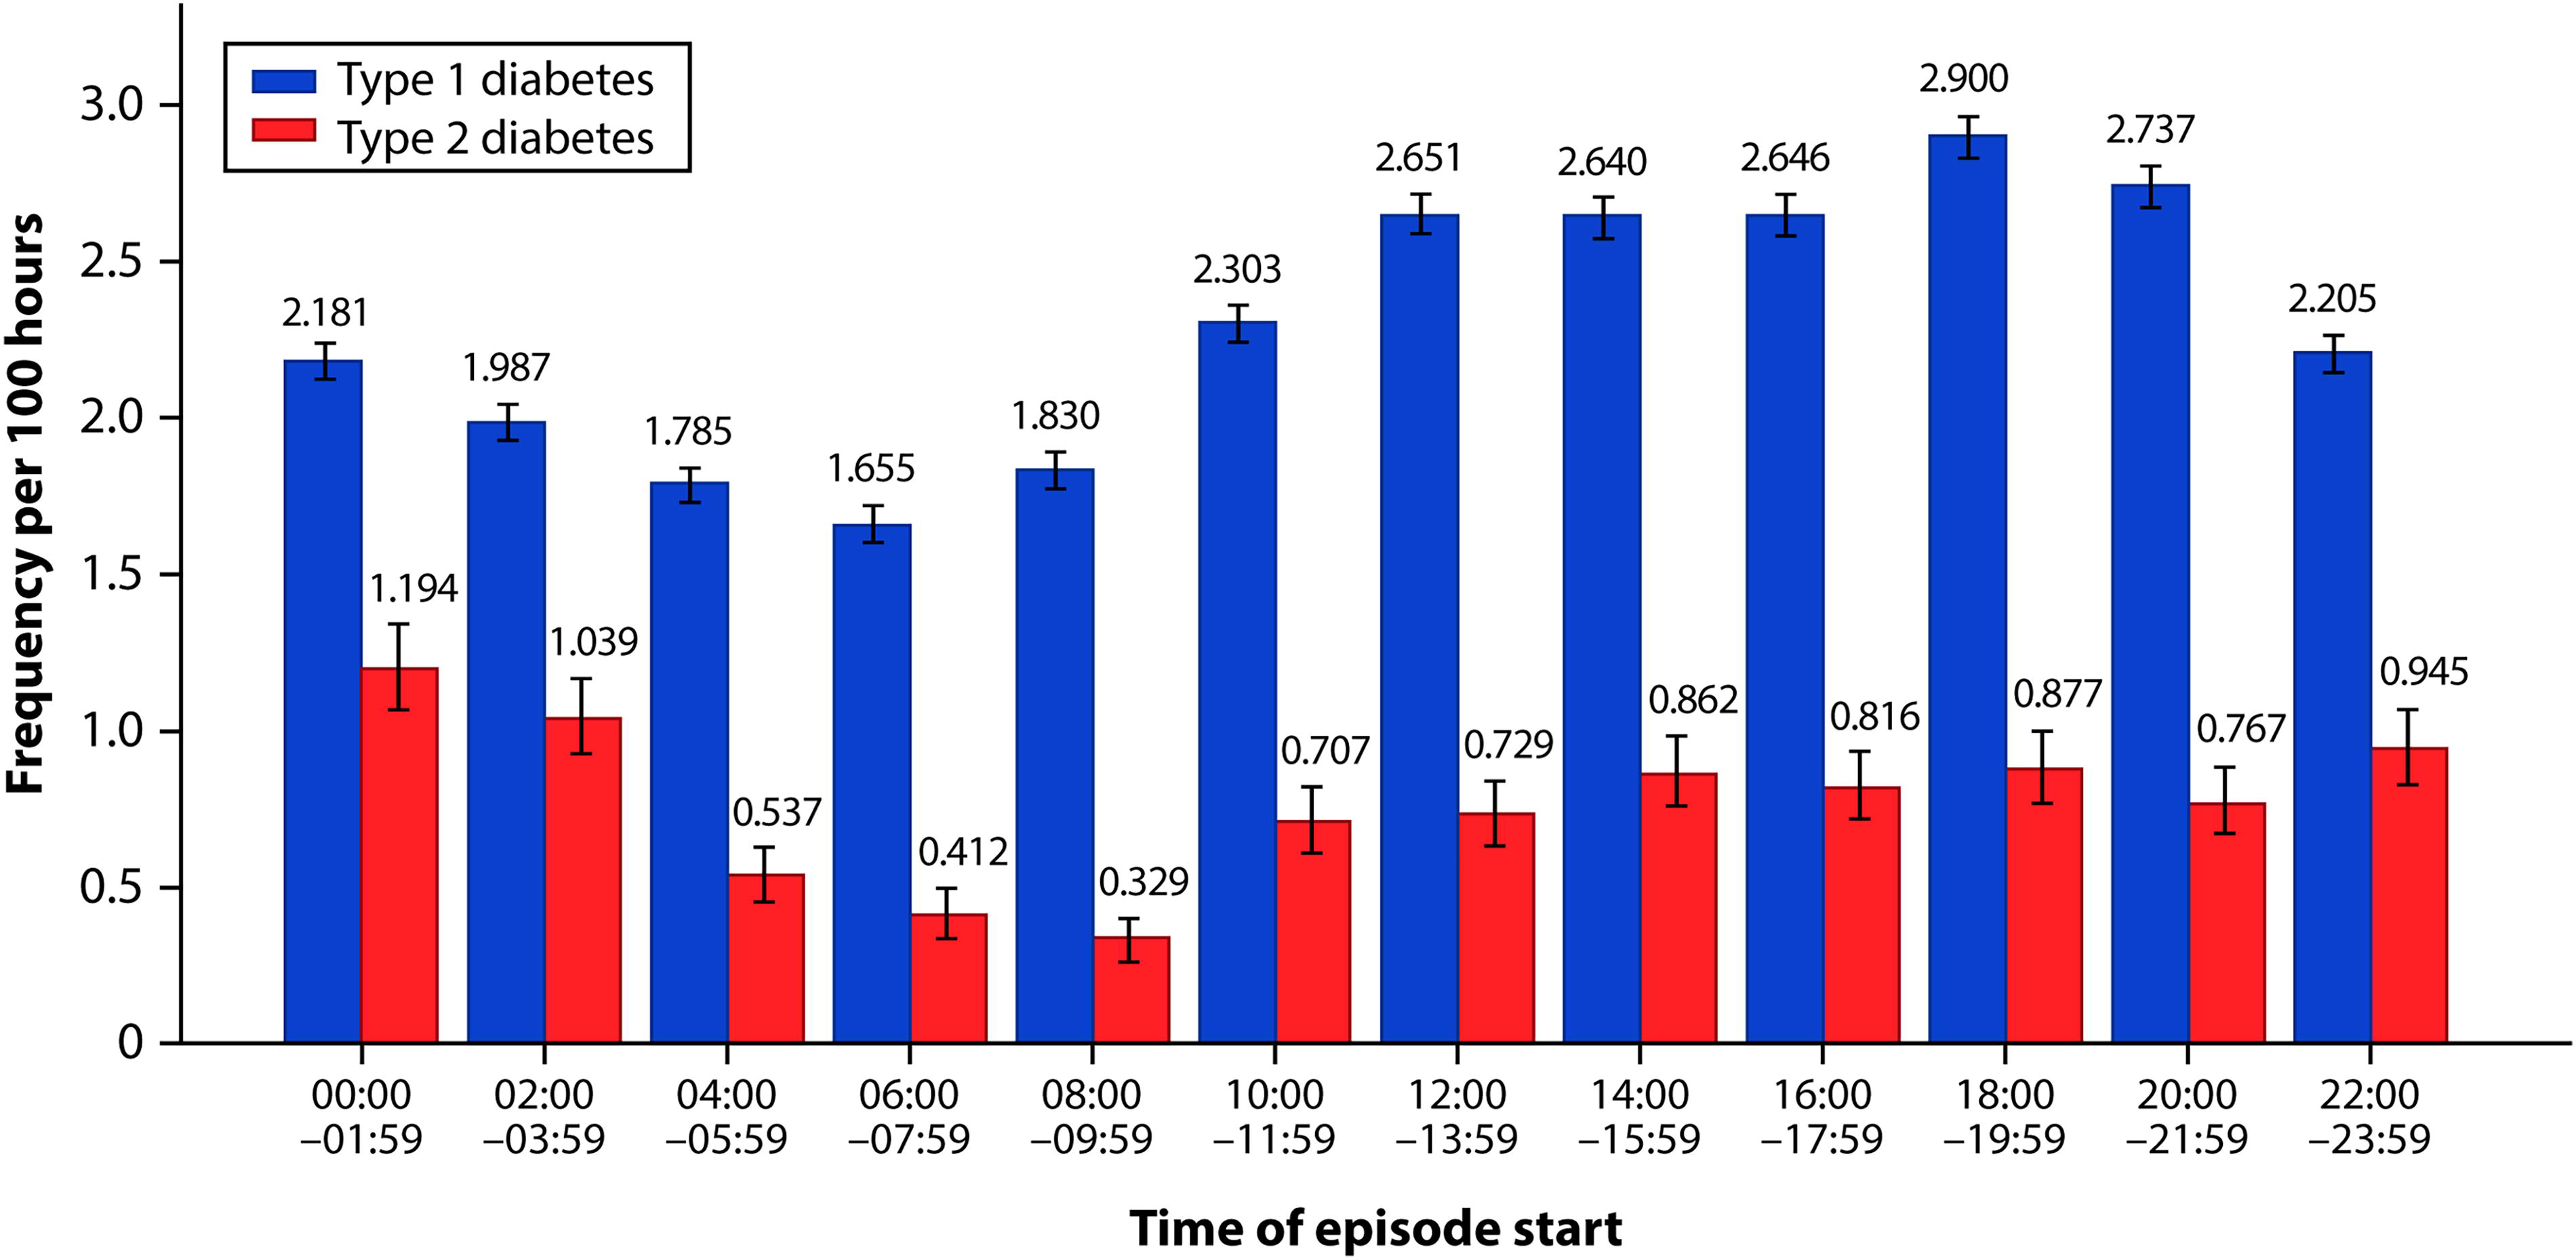
Frequency per 100 h of hypoglycemic events (<70 mg/dL) by start time in people with type 1 or type 2 diabetes. Error bars show 95% confidence intervals assuming a Poisson distribution.
Time profiles of diurnal hypoglycemic events
The median time profiles of nocturnal and diurnal events for people with T1D and T2D are shown in Figure 2. Regardless of the type of hypoglycemic event (<70 mg/dL or <54 mg/dL), diurnal hypoglycemic events had a steeper onset and recovery, whereas for nocturnal hypoglycemic events, onset and recovery were more gradual and prolonged.
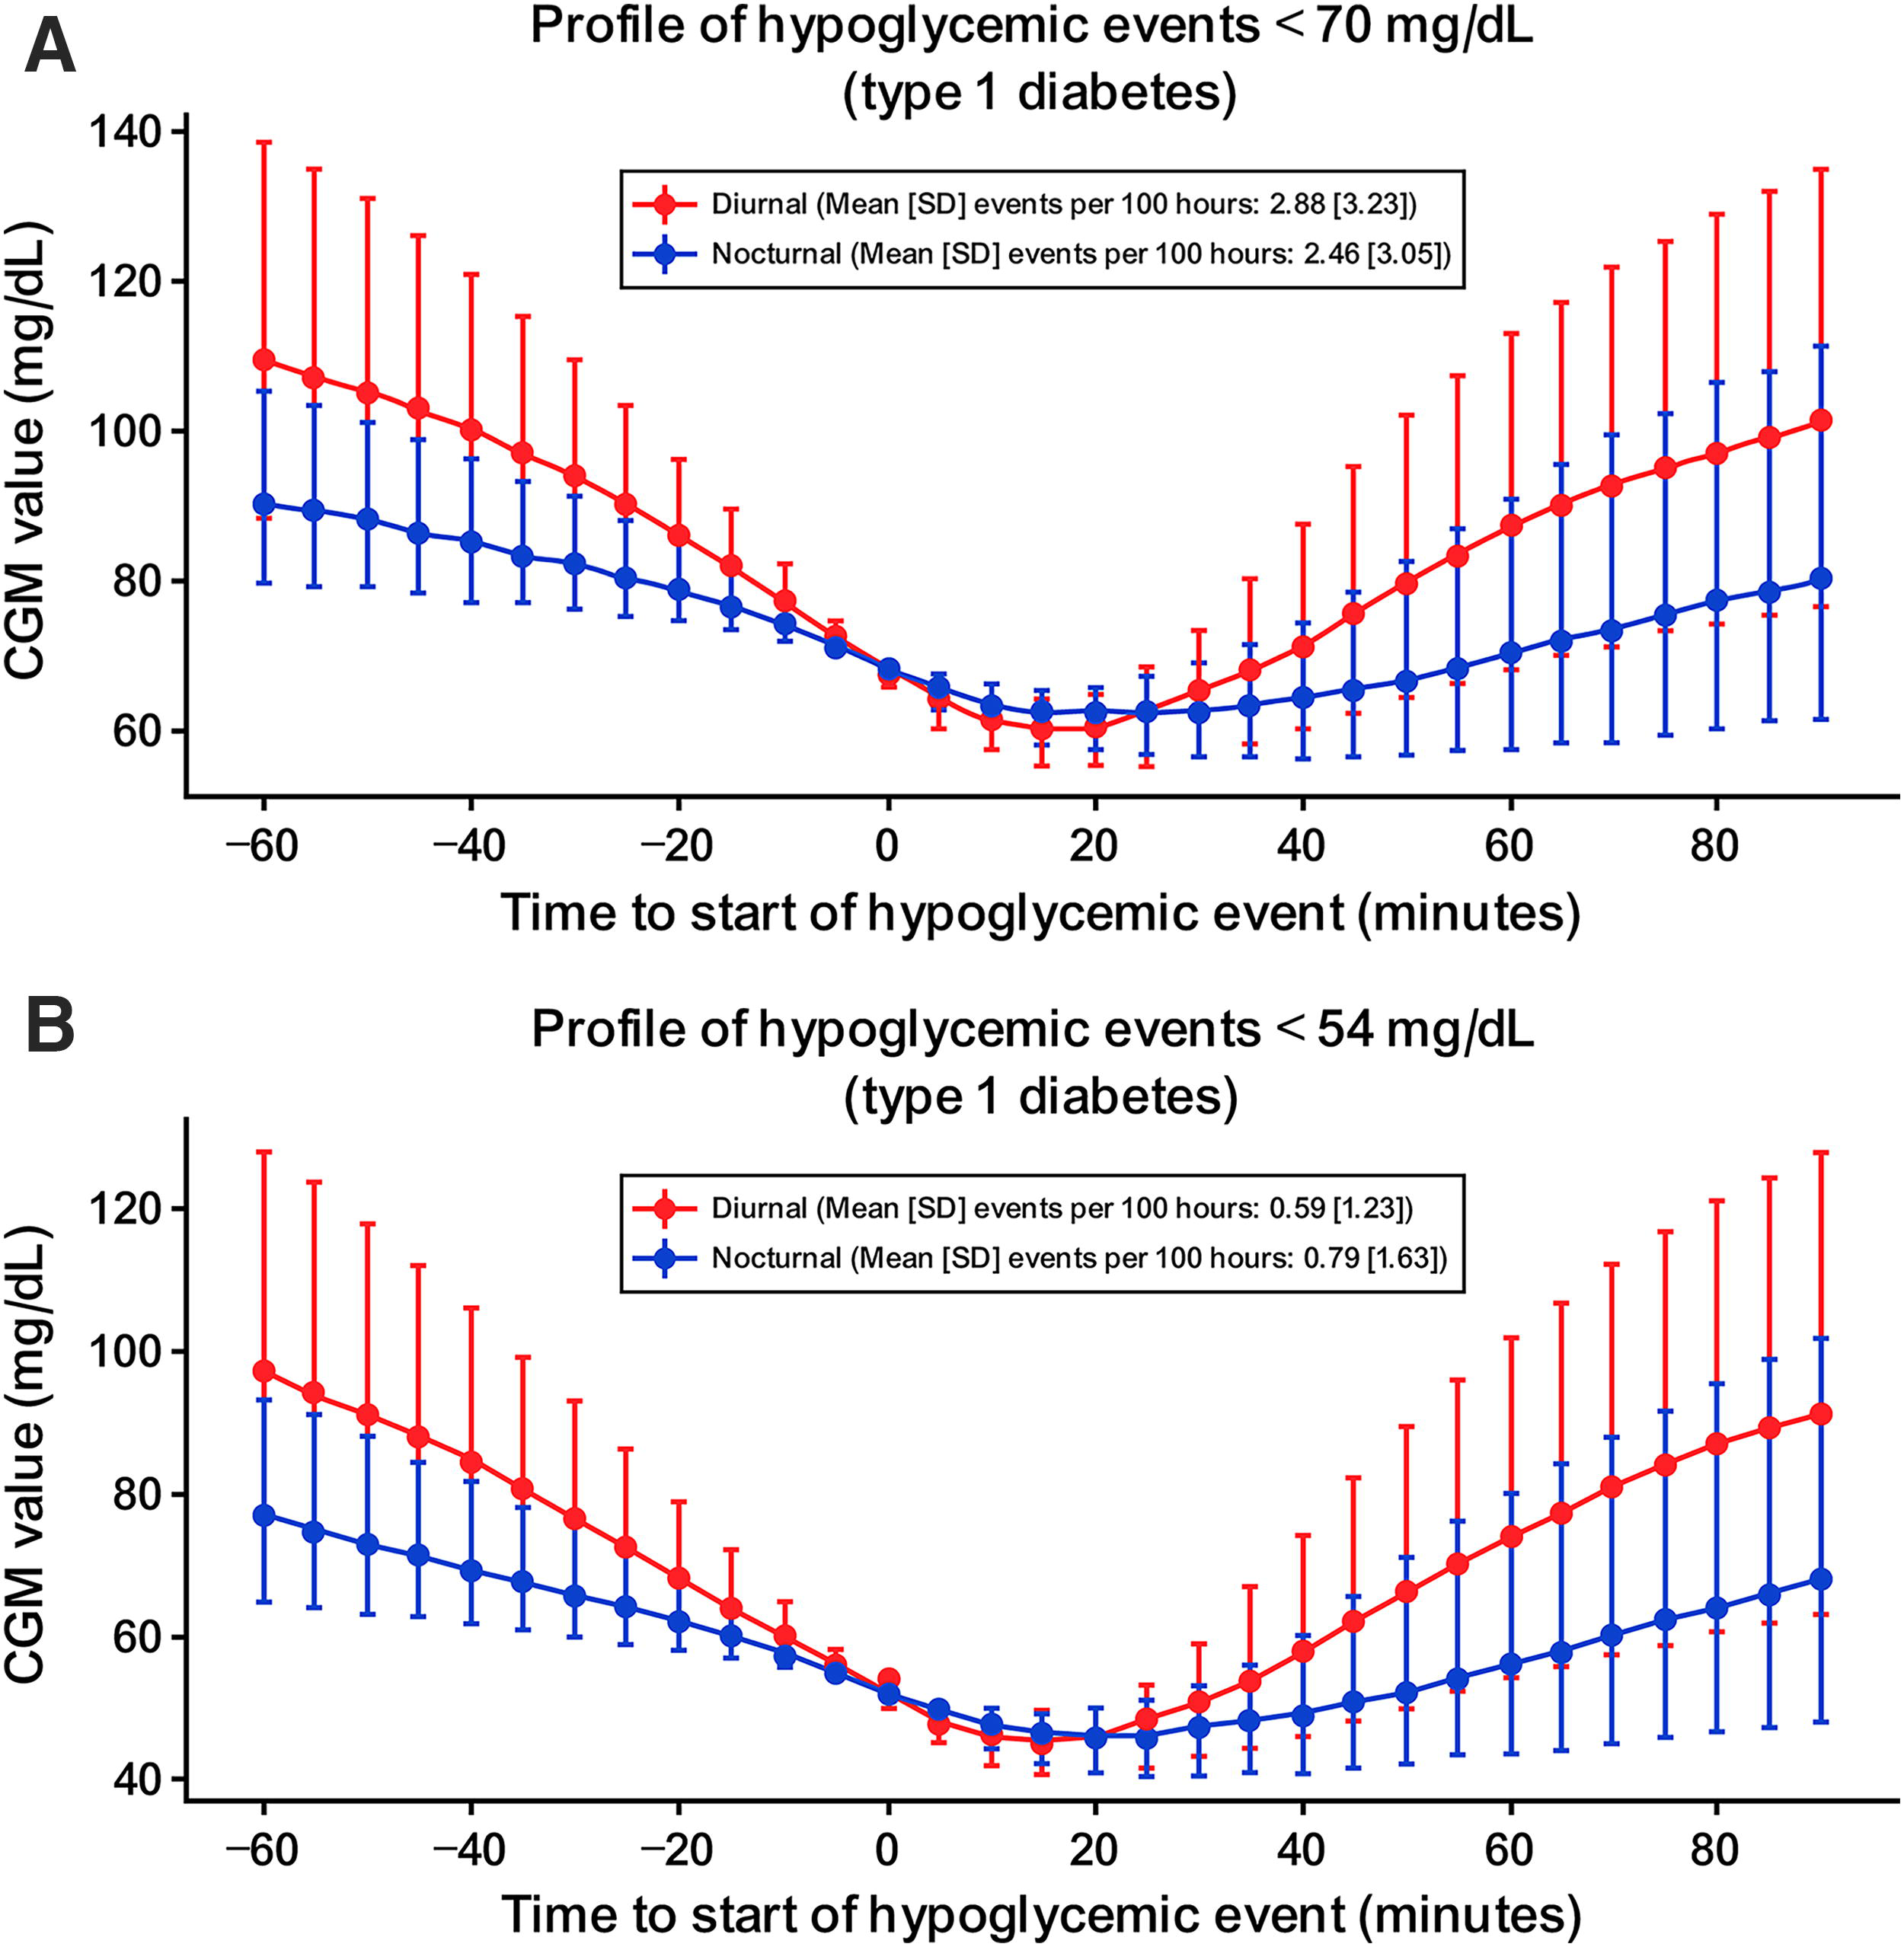
Median (interquartile range) glucose profiles by day and by severity of hypoglycemia.
Effect of hypoglycemic events on glucose levels during subsequent days or night
For days following nights that contained at least one hypoglycemic event, there were significant changes in all glycemic parameters analyzed for those with T1D and T2D. Mean glucose was lower after nights with nocturnal hypoglycemic events for both people with T1D or T2D (P ≤ 0.0001; Tables 4 and 5). The CV increased after nights with any hypoglycemic event for both those with T1D (P < 0.0001 for both events) and T2D (P ≤ 0.01; Tables 4 and 5). Time in range increased after nights with <70 mg/dL hypoglycemic events for both people with T1D and T2D (Tables 4 and 5; (P < 0.01 and P < 0.001, respectively), but it decreased for people with T1D after <54 mg/dL hypoglycemic events (P < 0.001). Time above range decreased after nights with any hypoglycemic event for people with T1D and T2D (Tables 4 and 5; P < 0.001 for all comparisons). For people with T1D, time below range increased after nights with any hypoglycemic event, whereas time <54 mg/dL only increased after nocturnal events <54 mg/dL (see Tables 4 and 5 for exact P values). Among people with T2D, only time below range significantly increased after nocturnal <54 mg/dL events (P < 0.0001). Some changes in glucose profiles during nights following diurnal hypoglycemic events were also observed, although the pattern differed to that seen in days following nocturnal events (Supplementary Tables S2 and S3). Specifically, the CV decreased subsequent to days with any hypoglycemic event, for those with T1D (P = 0.02) or T2D (P < 0.0001). In addition, for the night subsequent to a diurnal hypoglycemic event, the mean glucose was lower and the percentage time above range was lower compared with people without a hypoglycemic event. This was observed in both the T1D and T2D groups but was more pronounced in people with T2D. Time below range during the night was largely unaffected by a prior diurnal hypoglycemic event.
Diurnal Glycemic Metrics on Days with or Without Nocturnal Hypoglycemic Events (Glucose <70 mg/dL) in People with Type 1 Diabetes and Type 2 Diabetes
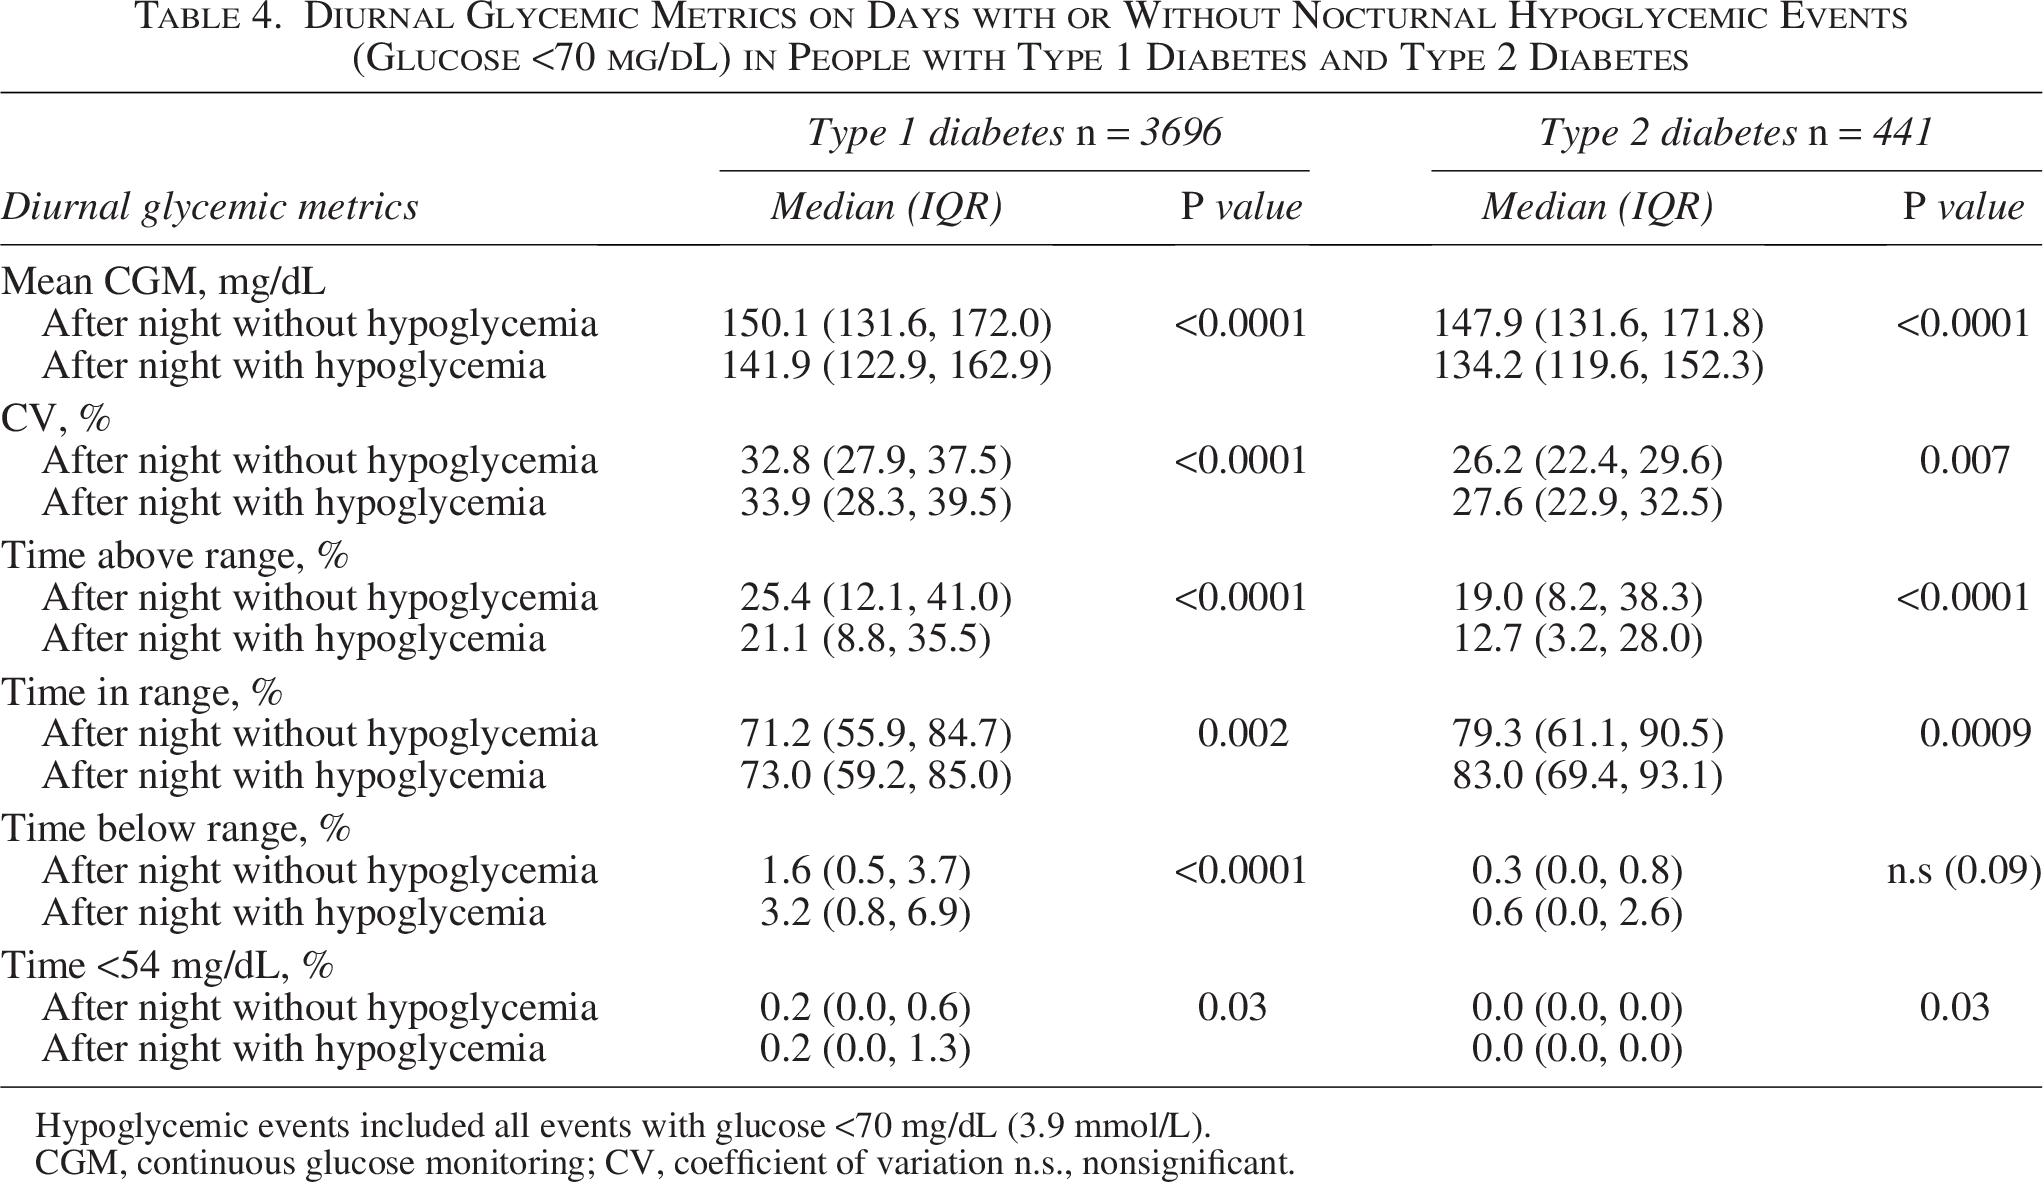
Hypoglycemic events included all events with glucose <70 mg/dL (3.9 mmol/L).
CGM, continuous glucose monitoring; CV, coefficient of variation n.s., nonsignificant.
Diurnal Glycemic Metrics on Days with or Without Nocturnal Hypoglycemic Events (Glucose <54 mg/dL) in People with Type 1 Diabetes and Type 2 Diabetes
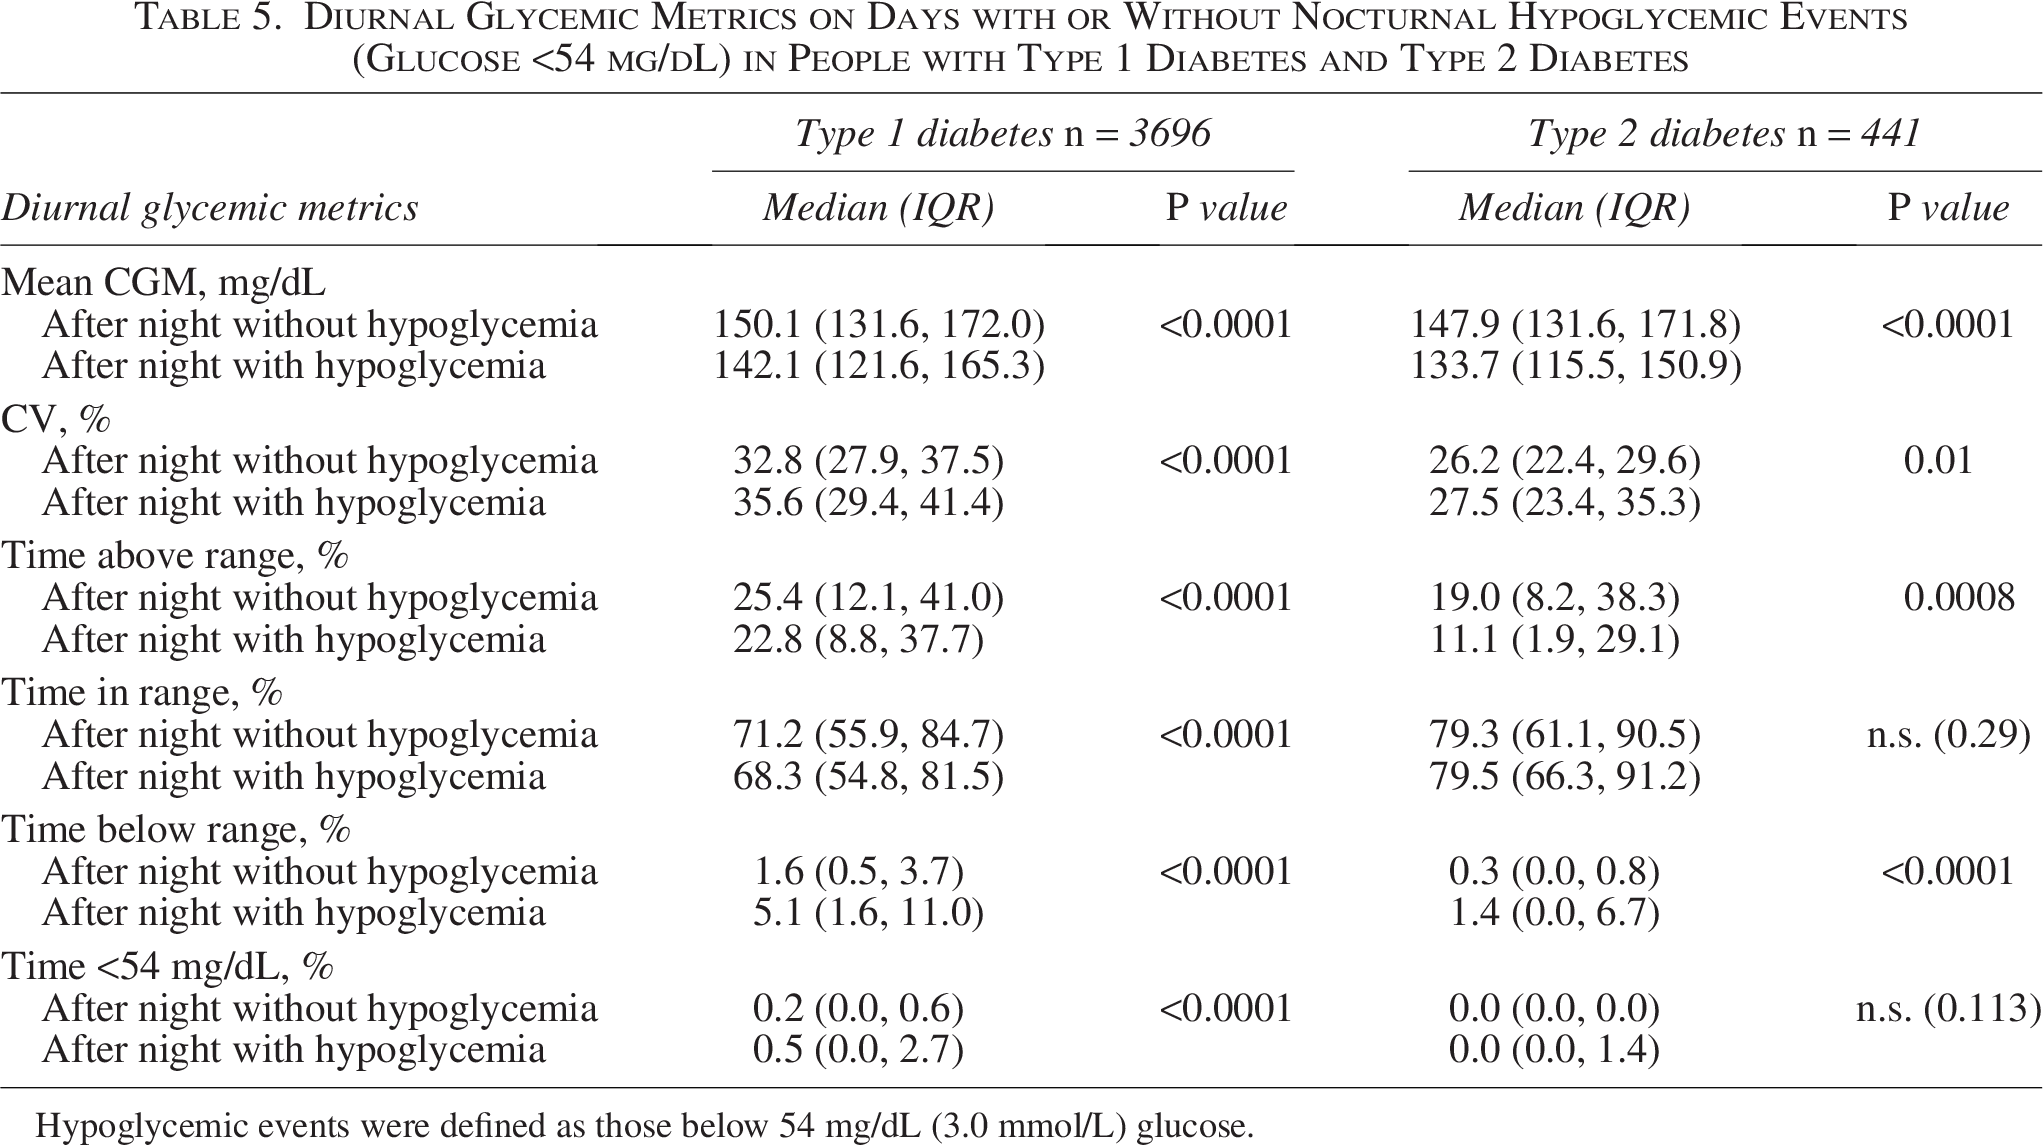
Hypoglycemic events were defined as those below 54 mg/dL (3.0 mmol/L) glucose.
Discussion
This RWD study assessed the characteristics and consequences of nocturnal hypoglycemia in people with T1D or T2D receiving MDI therapy with CGM. These RWD are consistent with the results of a recent, retrospective observational analysis of nocturnal hypoglycemic events in a population with T1D treated with MDI with CGM, 18 and they provide additional insight into the occurrence of nocturnal hypoglycemia in people with T2D in a real-world setting.
Overall, hypoglycemic events were less frequent in people with T2D than in people with T1D. In general, hypoglycemic events were less common during the night than during the day, but, conversely, severe hypoglycemic events (<54 mg/dL) were more likely to occur during the night. This may perhaps be explained by individuals quickly recognizing hypoglycemia during the day and taking counter measures before glucose levels fall below 54 mg/dL. During the night, counter measures may be applied too late to prevent more severe hypoglycemia from occurring. Nocturnal hypoglycemia episodes had a longer duration than diurnal hypoglycemia episodes in both people with T1D and T2D, and the highest incidence of nocturnal events occurred between midnight (00:00) and 02:00. Among people with T1D, the duration of <54 mg/dL hypoglycemic events was significantly longer during the night compared with the day. A similar trend was observed in people with T2D, but this did not reach statistical significance.
Both <70 mg/dL and <54 mg/dL diurnal hypoglycemic events had a steeper onset and recovery than nocturnal hypoglycemic events, which were more gradual and prolonged. This could have implications for patients being able to estimate whether a nocturnal hypoglycemic episode might occur within the next hour applying current CGM technology and using an actual glucose value and trend arrow; for example, a glucose value <90 mg/dL may indicate the possibility of a hypoglycemic episode occurring within the hour.
This RWD study also looked at the effect of nocturnal hypoglycemic events on glycemia the following day. For nights with at least one hypoglycemic event, there was a significant reduction in time in range, time above range, and mean blood glucose, and a significant increase in time below range and time <54 mg/dL during the following day compared with nights without a hypoglycemic event. Conversely, experiencing a diurnal hypoglycemic event was not associated with a significant increase in time below range and time below 54 mg/dL, potentially because people were more likely to respond to, and correct, hypoglycemia during the day.
For many years, nocturnal hypoglycemia was believed to result in rebound hyperglycemia the following morning. This somewhat controversial phenomenon, termed the Somogyi effect, suggested that hypoglycemia led to the activation of counter-regulatory hormones (such as adrenaline, corticosteroid, growth hormone, and glucagon) and results in the activation of gluconeogenesis and subsequent hyperglycemia. 18 However, data from this study and others22,23 suggest that the Somogyi effect may in fact be rare, and that people with T1D or T2D who experience nocturnal hypoglycemia are actually at risk of sustaining a double hypoglycemic burden as they may be susceptible to a further hypoglycemic episode the following morning. The mechanism that underlies the increased risk of a hypoglycemic episode during the morning following a nocturnal hypoglycemic episode is currently undetermined. However, it may be related to diminished sleep quality, which is known to impact glucose control.3,24 Nocturnal hypoglycemia may also disturb an individual’s routine management of diabetes during the day and lead to fluctuating glucose levels as patients try to correct hypo- and hyperglycemic episodes. Specifically, managing meals and activity levels may be harder after a nocturnal hypoglycemic episode as the person cannot rely on their usual routine of how much insulin is needed before a meal or how much carbohydrate they should consume before, during, or after exercise.
Unawareness of hypoglycemia remains a significant problem at night (e.g., because of a lower and slower response than during the day), and it highlights the shortcomings of current safeguards against hypoglycemic episodes (i.e., threshold alarms that do not wake people up or that can be silenced to minimize overnight disturbance). 25 To address this, more effective nocturnal hypoglycemia prevention is needed rather than the current reactive mode of action.
Artificial intelligence-enabled glucose prediction tools offer the potential to notify patients in advance when they are at elevated risk of nocturnal hypoglycemia. Nocturnal hypoglycemia prediction, using an algorithm based on a large data set, has been shown to perform well and holds strong potential to improve nocturnal glucose control. 26 Additionally, a tool that can predict nocturnal hypoglycemia (Accu-Chek® SmartGuide CGM solution 27 ) has been shown to have good accuracy, sensitivity, and specificity when evaluated in silico using clinical and RWD sets that included data from individuals with T1D and T2D on MDI or insulin pump therapy. 28 Although the sensitivity for detecting low glucose levels overnight was only 55% (indicating that nearly half of all cases would be missed), a clear impact on nocturnal hypoglycemia was shown through in silico simulator testing, with a mean reduction in nocturnal hypoglycemia by 37% from baseline. 27 This is because advance notice allows patients to take proactive measures while still awake, which reduces the likelihood of being disturbed during the night. Conversely, the high specificity of these predictions could result in patients taking fewer compensatory actions, thereby improving overall glycemic control and providing confidence as a result of improved control of their therapy and disease.
A major strength of these data lies in the fact that they are based on real-world settings; as such, they provide insight into the challenges and unmet needs presented by nocturnal hypoglycemia in people with diabetes in real-life scenarios. The analysis also includes data on nocturnal hypoglycemia from people with T2D, a group that is often not studied owing to a previous focus on CGM for T1D. Limitations of the study include the inherent limitations associated with the collection of RWD and the absence of a sample size calculation. In addition, the data were collected across a 14-year period, during which considerable changes in insulin therapy and CGM technology occurred. This may make it more difficult to compare data collected from earlier versus more recent devices and may introduce potential measurement bias. Specifically, the differences in incidence between nocturnal and diurnal hypoglycemia observed in these studies may be attributed to the use of different glucose monitoring devices, which could have slightly differing levels of accuracy, especially in the low glucose range. There is also a risk of overpowering given the large sample size, which can result in findings that are statistically significant but clinically negligible. To date, a controlled, well-defined population for the accurate measurement and characterization of hypoglycemic events and downstream effects was lacking. Therefore, taking into consideration the RWD described here, in combination with the data obtained from the previously published observational study conducted by Eichenlaub et al., 18 the findings of the current study are valuable in their provision of a more comprehensive, clearer picture.
Conclusions
In this RWD study, nocturnal hypoglycemia presented distinct challenges when compared with diurnal events, including being of a longer duration, being associated with a slower recovery, and exerting significant effects on next-day glycemic control. These findings highlight the need for enhanced preventive strategies, particularly given the heightened risk of recurrent hypoglycemia in the morning, as well as the negative impact of nocturnal hypoglycemia on sleep quality, which is important for the well-being and sustained health of people living with diabetes.
Authors’ Contributions
J.Z., M.M., D.T., B.R., and T.G. developed the ideation of the article and the real-world data study design. J.Z., B.R., and M.M. performed the statistical analyses. J.Z., M.M., D.T., B.R., and T.G. contributed to the data interpretation, read, and critically reviewed the article.
Footnotes
Acknowledgments
The authors thank Annette Moritz, a Roche employee, for the medical and scientific review of the article. Medical writing support was provided by Juliette Gray of Springer Health+, which was funded by Roche Diabetes Care GmbH, in accordance with the Good Publication Practice 2022 guidelines.
Author Disclosure Statement
All authors declare financial competing interests and are employees of Roche, and may hold stock in Roche, at the time of writing the article. All authors declare no nonfinancial competing interest. Accu-Chek and mySugr are trademarks of Roche. All other product names and trademarks are the property of their respective owners.
Funding Information
This study was funded by Roche Diabetes Care GmbH and received no external funding.
Data Sharing Statement
Correspondence and requests for materials should be addressed to M.M. (
Supplemental Material
References
Supplementary Material
Please find the following supplemental material available below.
For Open Access articles published under a Creative Commons License, all supplemental material carries the same license as the article it is associated with.
For non-Open Access articles published, all supplemental material carries a non-exclusive license, and permission requests for re-use of supplemental material or any part of supplemental material shall be sent directly to the copyright owner as specified in the copyright notice associated with the article.