
Abstract
Objective:
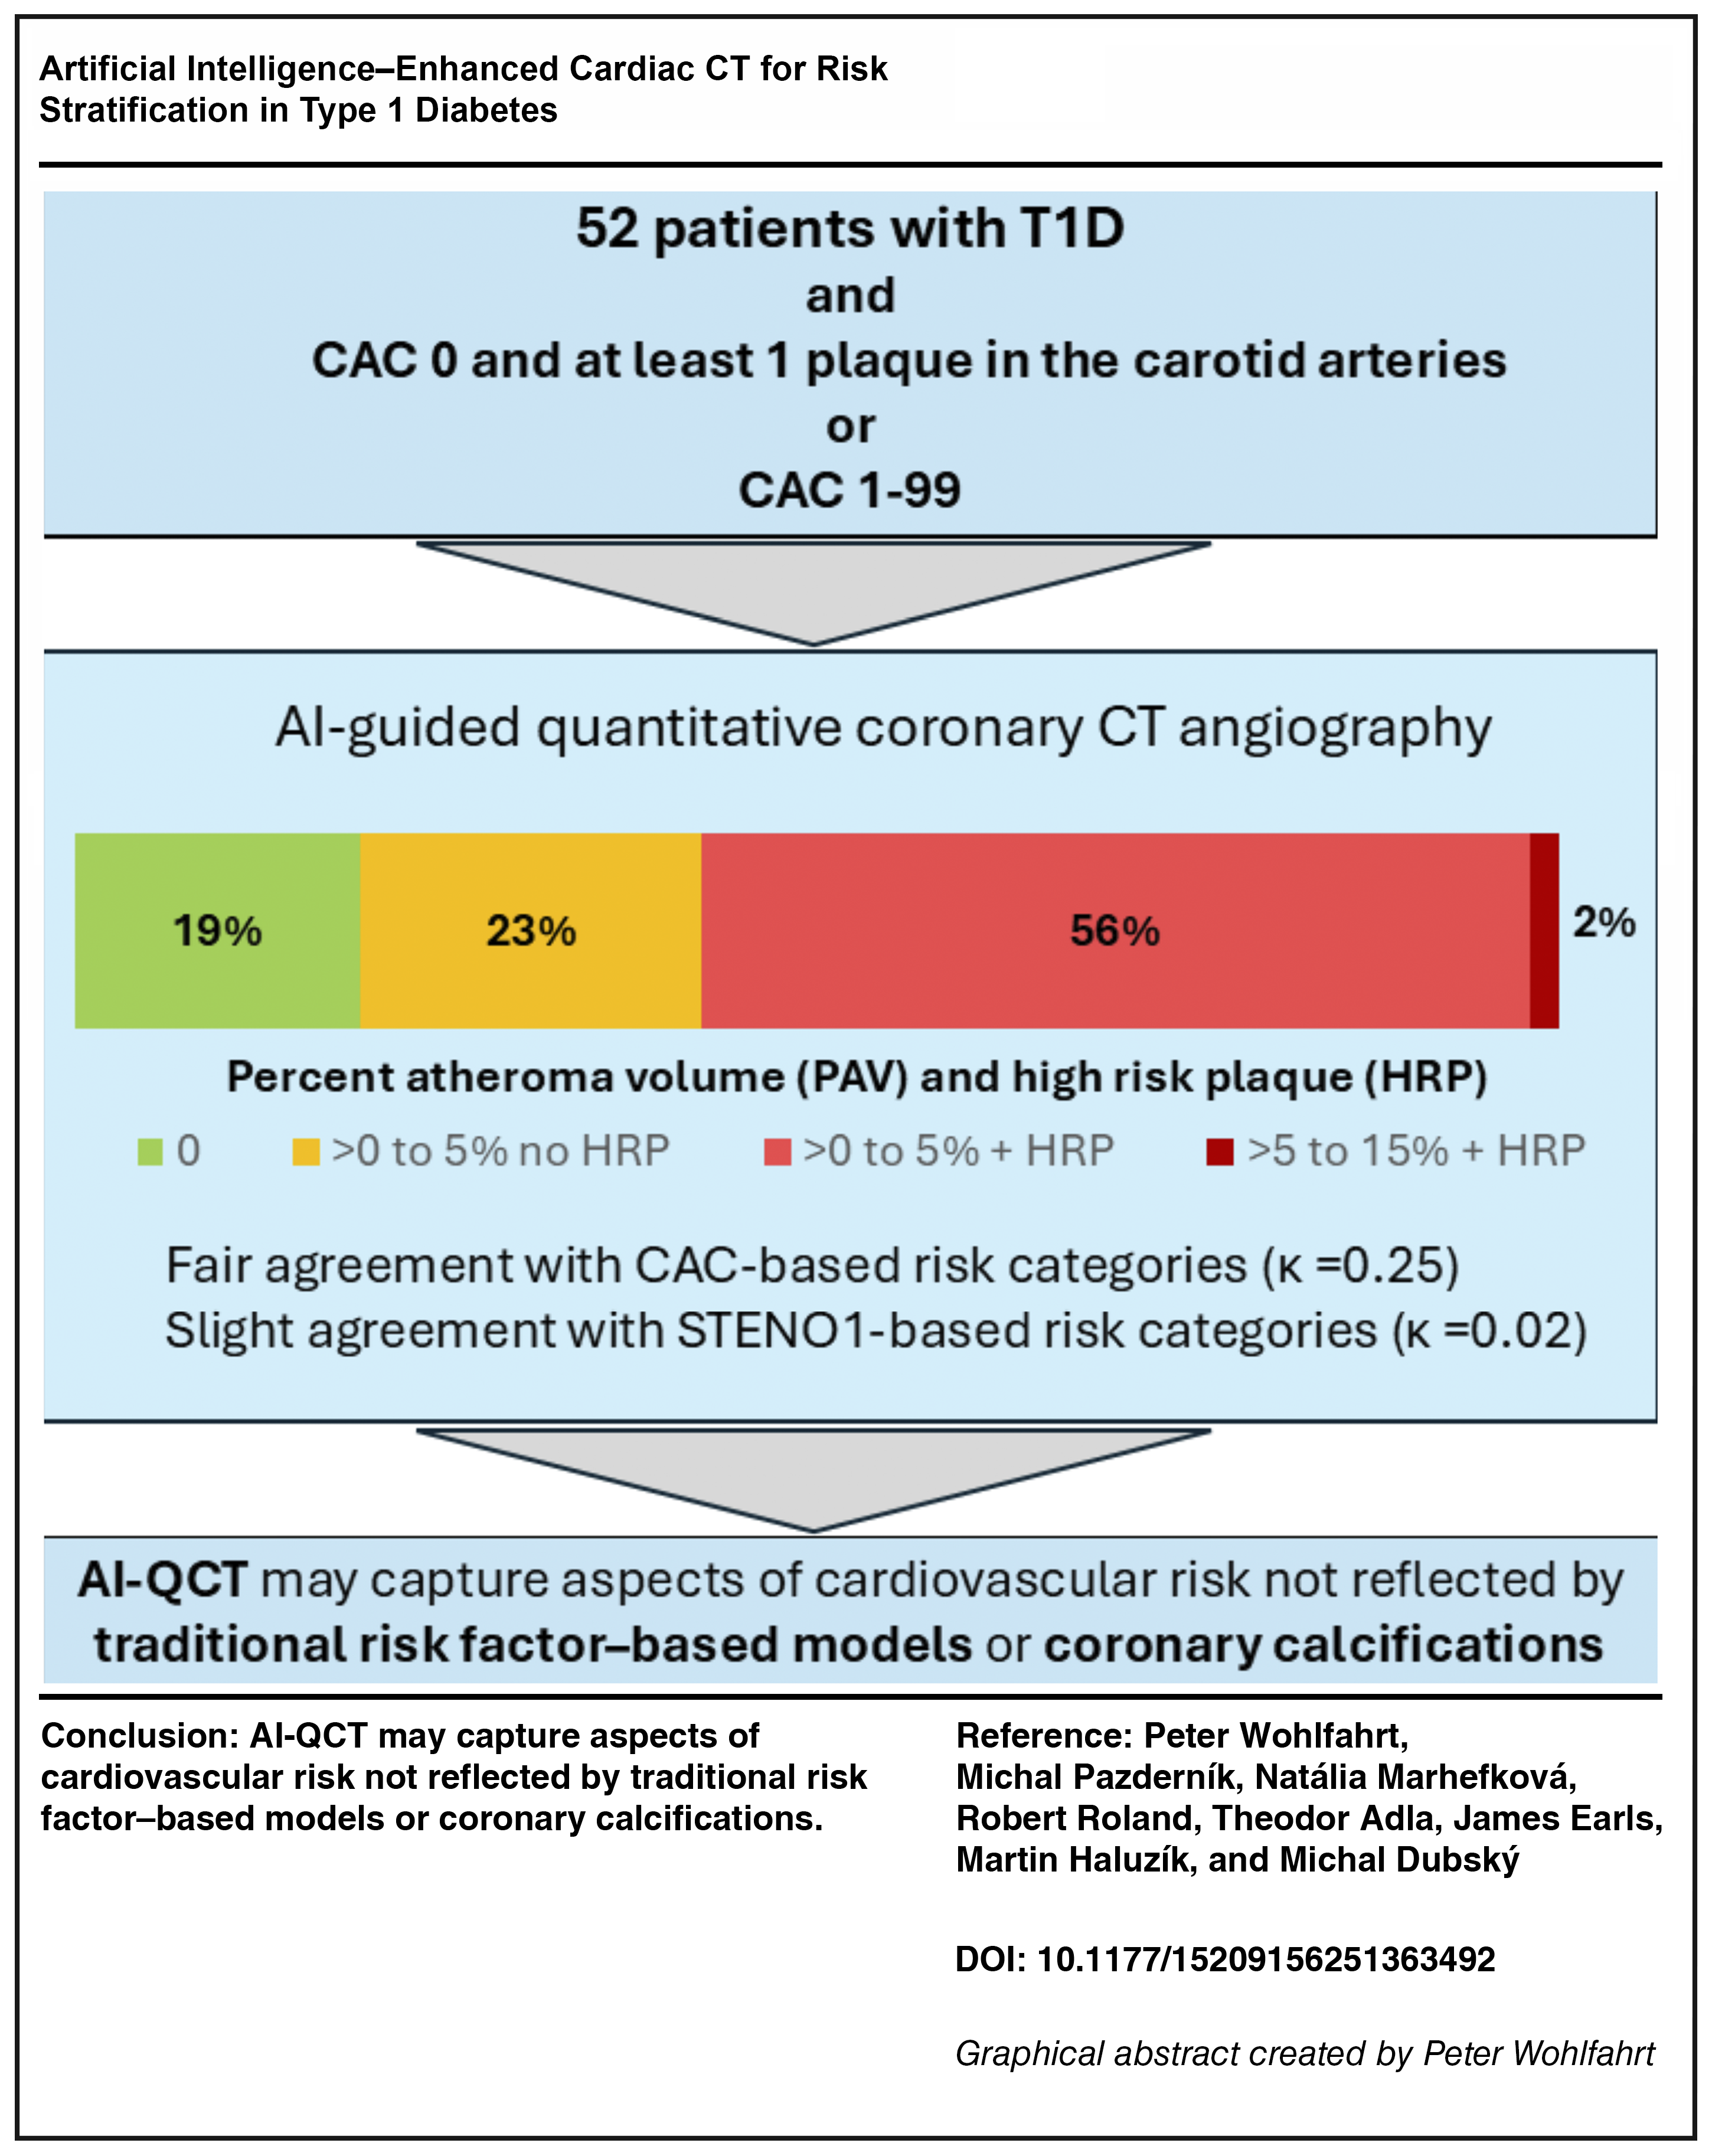
Cardiovascular risk stratification based on traditional risk factors lacks precision at the individual level. While coronary artery calcium (CAC) scoring enhances risk prediction by detecting calcified atherosclerotic plaques, it may underestimate risk in individuals with noncalcified plaques—a pattern common in younger type 1 diabetes (T1D) patients. Understanding the prevalence of noncalcified atherosclerosis in T1D is crucial for developing more effective screening strategies. Therefore, this study aimed to assess the burden of clinically significant atherosclerosis in T1D patients with CAC <100 using artificial intelligence (AI)-guided quantitative coronary computed tomographic angiography (AI-QCT).
Methods:
This study enrolled T1D patients aged ≥30 years with disease duration ≥10 years and no manifest or symptomatic atherosclerotic cardiovascular disease (ASCVD). CAC and carotid ultrasound were assessed in all participants. AI-QCT was performed in patients with CAC 0 and at least one plaque in the carotid arteries or those with CAC 1–99.
Results:
Among the 167 participants (mean age 52 ± 10 years; 44% women; T1D duration 29 ± 11 years), 93 (56%) had CAC = 0, 46 (28%) had CAC 1–99, 8 (5%) had CAC 100–299, and 20 (12%) had CAC ≥300. AI-QCT was performed in a subset of 52 patients. Only 11 (21%) had no evidence of coronary artery disease. Significant coronary stenosis was identified in 17% of patients, and 30 (73%) presented with at least one high-risk plaque. Compared with CAC-based risk categories, AI-QCT reclassified 58% of patients, and 21% compared with the STENO1 risk categories. There was only fair agreement between AI-QCT and CAC (κ = 0.25), and a slight agreement between AI-QCT and STENO1 risk categories (κ = 0.02).
Conclusion:
AI-QCT may reveal subclinical atherosclerotic burden and high-risk features that remain undetected by traditional risk models or CAC. These findings challenge the assumption that a low CAC score equates to a low cardiovascular risk in T1D.
Introduction
Atherosclerotic cardiovascular disease (ASCVD) is the leading cause of death in individuals with type 1 diabetes (T1D). Compared with the general population, men with T1D face an almost fourfold increase in ASCVD risk, while women face an eightfold increase, resulting in a reduced life expectancy of at least 11 years. 1 Due to the early onset of T1D, ASCVD risk exceeds that of individuals with type 2 diabetes (T2D) and often manifests at a younger age. Notably, ASCVD risk in T1D spans a broad spectrum from low to very high, necessitating accurate individual-level risk stratification to guide the intensity of preventive interventions. However, since T1D accounts for only 5%–10% of all diabetes cases, ASCVD risk stratification in this population is less developed than in T2D.
Traditional risk factors have been used to predict ASCVD risk in T1D. While these models can predict the risk on a population level, they often misclassify patients on the individual level. Consequently, current guidelines assign only a Class IIb recommendation, mainly due to the lack of supporting evidence. 2 The STENO1 risk engine, a commonly used tool in T1D, incorporates traditional risk factors such as age, sex, diabetes duration, glycemic control (HbA1c), systolic blood pressure, low-density lipoprotein (LDL) cholesterol, glomerular filtration rate, albuminuria, smoking status, and physical activity.
Recently, the Lancet Commission proposed a fundamental shift in the understanding of coronary artery disease, moving away from a paradigm centered on late-stage epicardial obstruction and myocardial ischemia, toward early detection of nonobstructive atherosclerotic plaque and proactive prevention. 3 Detecting subclinical atherosclerosis offers a promising approach for personalizing preventive strategies. Among noninvasive tools, coronary artery calcium (CAC) scoring is widely regarded as a sensitive method for risk stratification in T2D. 4 Primary prevention strategies, such as intensive LDL cholesterol lowering and the initiation of aspirin therapy in patients with CAC >100, have been recommended. 5 However, CAC scoring is limited to identifying advanced calcified plaques and fails to detect early-stage, noncalcified atherosclerosis. Studies have shown that 15%–20% of patients with acute coronary syndromes present with a CAC score of 0, emphasizing the need to assess noncalcified plaques for effective risk stratification.6,7
Coronary computed tomographic angiography (CCTA) allows visualization of both calcified and noncalcified plaques. Originally used to detect significant coronary artery stenoses, CCTA has since evolved into a tool capable of characterizing coronary plaque morphology and composition, thus improving ASCVD risk assessment.
One such prognostic feature is nonobstructive coronary artery disease (CAD), which, despite lacking hemodynamic significance, is associated with a 1.5 to 7.5-fold increased risk of major adverse cardiovascular events (MACE) compared with normal CCTA findings.8–10 Another hallmark of ASCVD is the presence of high-risk plaques (HRPs), defined as low-density noncalcified plaques with positive remodeling.11–13 HRPs are strongly associated with MACE risk, increasing the risk by a factor of 9.2. 14 In addition to qualitative assessments, CCTA allows for the quantification of coronary plaque burden through percent atheroma volume (PAV)—a metric calculated as the ratio of plaque volume to total vessel volume. 15 PAV offers a comprehensive evaluation of disease severity. The SCOT-HEART study identified total plaque burden as the strongest predictor of myocardial infarction risk. 16
Artificial intelligence (AI)-guided quantitative coronary computed tomography angiography (AI-QCT) further refines plaque detection and characterization, and has been shown to predict MACE independently of traditional clinical risk factors and CAC scores. Furthermore, in predicting cardiovascular outcomes, AI-QCT analysis is superior to human expert interpretation. 15
These advances underscore the utility of AI-QCT in diagnosing coronary stenosis and improving ASCVD risk stratification, thereby supporting more personalized prevention strategies. Given the high prevalence of noncalcified plaques in younger T1D patients, we hypothesized that CCTA could uncover subclinical coronary atherosclerosis in patients classified as low-to-moderate risk by CAC. However, studies on the prevalence of noncalcified plaques in the T1D population are lacking, which limits the widespread application of AI-QCT as a screening strategy. Pilot data on the prevalence of AI-QCT-derived prognostic markers in the T1D population are necessary to inform the design of a sufficiently powered study.
Thus, the primary aim of this study was to assess the prevalence of clinically significant AI-QCT features in T1D patients with CAC <100. In addition, we sought to explore the association between conventional clinical risk factors and AI-QCT findings to refine patient selection for advanced imaging.
Methods
Study design
As part of an effort to improve risk stratification in T1D, we established a prospective registry titled CORDIA. This registry enrolls T1D patients followed at a large tertiary center. Inclusion criteria include an age of 30 years or greater and a duration of T1D of 10 years or longer. Exclusion criteria are a history of CAD, peripheral arterial disease, or stroke; symptoms suggestive of CAD or heart failure (e.g., chest pain, dyspnea); and target organ damage defined as estimated glomerular filtration rate <60 mL/min/1.73 m2, albumin-to-creatinine ratio >30 mg/g, or microvascular complications in three distinct organ systems (e.g., microalbuminuria, retinopathy, neuropathy).
The Ethics Committees of IKEM and Thomayer’s Hospital approved the study protocol. All patients provided written informed consent. The study adhered to all applicable regulatory requirements, ICH-GCP guidelines, and the Declaration of Helsinki.
Data availability statement
Anonymized data are available from the corresponding author upon reasonable request.
Study protocol
Stage 1: CAC
All participants underwent clinical examination, laboratory assessment, CAC scoring, and carotid ultrasound to detect atherosclerotic changes. Atherosclerotic plaque in the carotid arteries was defined by the intima-media thickening ≥1.5 mm. The 10-year ASCVD risk was calculated using the STENO1 risk engine using the online calculator (www.sdcc.dk/T1riskengine). 17 According to ESC guidelines, STENO1 risk categories were defined as low (<5%), moderate (5 to <10%), high (10 to <20%), and very high (≥20%). 2
Stage 2: CCTA
Because a substantial proportion of T1D patients are at low risk and may not benefit from CCTA examinations, we excluded patients with CAC 0 and no atherosclerotic plaque in the carotid arteries from this step. Thus, only patients with CAC scores of 1–99 and those with CAC = 0 and at least one carotid plaque were referred for CCTA. Imaging was performed using a ≥64-slice scanner (Siemens Somatom Sensation64, Forchheim, Germany).
Stage 3: AI-QCT
CCTA images were analyzed using FDA-cleared AI-based software (Cleerly Inc.). 18 This platform employs convolutional neural networks for image quality assessment, coronary segmentation and labeling, lumen wall evaluation, vessel contouring, and plaque characterization. Several prior studies have supported the method’s validity.15,18–21
The software identifies centerlines, lumen boundaries, and outer vessel walls across multiple image phases, selecting the four most optimal datasets for analysis. Coronary segments with a diameter >1.5 mm were included. Plaques were defined as any tissue >1 mm2 within the coronary artery wall, distinct from the vessel lumen, perivascular fat, or adjacent tissues. Stenoses were classified according to the CAD-RADS 2.0 guidelines. 22
Plaque volumes were measured and categorized by Hounsfield unit (HU) values: low-density noncalcified plaque (<30 HU), noncalcified plaque (−30 to 350 HU), and calcified plaque (>350 HU). PAV was computed as plaque volume relative to total vessel volume. PAV staging was as follows: Stage 0 (PAV = 0), Stage 1 (>0%–5%), Stage 2 (>5%–15%), and Stage 3 (>15%).15,23
Arterial remodeling was calculated as lesion diameter/reference diameter. Positive remodeling was defined as a ratio ≥1.1. The coexistence of low-density non-calcified plaque and positive remodeling defined HRPs. 10
Risk stratification based on AI-QCT
Risk categories were defined based on prior literature.14,15 Patients with PAV = 0 were classified as low risk; PAV >0%–5% without HRP as moderate risk; and PAV >0%–5% with HRP or PAV >5% as high risk.
Statistical analysis
Continuous variables are presented as means with standard deviations (SD) or medians with interquartile ranges (IQR), as appropriate. Categorical variables are summarized as counts and percentages.
Differences across the four CAC categories were assessed using one-way ANOVA, the Kruskal–Wallis test, or the Chi-square test, depending on data distribution and measurement level. Post hoc comparisons between groups were conducted with Bonferroni correction.
For comparisons between the two CAC groups, we used the Student’s t-test for normally distributed continuous variables, the Mann–Whitney U test for non-normally distributed continuous variables, and the Chi-square test for categorical variables. Spearman correlation was applied to evaluate associations between atherosclerotic burden and clinical variables.
To compare cardiovascular risk classification between the STENO-1 model and AI-QCT, we calculated the proportion of patients with discordant risk categories. Agreement between STENO-1, CAD-RADS 2, and AI-QCT risk estimates was assessed using linearly weighted Cohen’s kappa. To enable direct comparison, we harmonized risk categories across methods by grouping patients with minimal-to-moderate non-obstructive and moderate stenosis into a single “moderate-risk” category. Similarly, patients with a STENO-1 estimated risk >10% were classified as “high-risk.”
All analyses were performed using SPSS version 25.0 (IBM Corp., Armonk, NY). Two-sided P-values <0.05 were considered statistically significant.
Results
Stage 1: CAC
Between January 2023 and July 2024, we examined 167 patients with T1D (mean age 51.6 ± 9.5 years; 44.3% women; mean T1D duration 29.1 ± 10.6 years). CAC scores were distributed as follows: 93 (55.7%) had CAC 0, 46 patients (27.5%) CAC 1–99, 8 (4.8%) CAC 100–299, and 20 (12.0%) CAC ≥300. Patient characteristics by CAC groups are shown in Supplementary Table S1. Individuals with a higher CAC were older, had longer DM duration, were more often male, and had a higher intensity of lipid-lowering therapy as compared with individuals with a CAC of 0.
Stage 2: CCTA
To further evaluate CAD prevalence in individuals categorized as having low-moderate ASCVD risk by CAC (CAC <100), we performed the CCTA examination. For this examination, we selected 52 patients with CAC 0 and at least one atherosclerotic plaque in the carotid arteries as evaluated by carotid sonography (n = 19), or patients with CAC 1–99 (n = 33). Demographic characteristics of these 52 patients are shown in Table 1. The mean age of these 52 patients was 54 ± 7 years, with 21 (40.4%) being women, and a mean duration of T1D of 31 ± 11 years. According to the STENO1 engine, four patients (7.7%) were categorized as moderate risk (ASCVD risk 5 to <10%), 27 (51.9%) high risk (ASCVD risk 10 to <20%), and 21 (40.4%) very high risk (ASCVD risk ≥20%).
Demographics by Coronary Artery Calcium Score
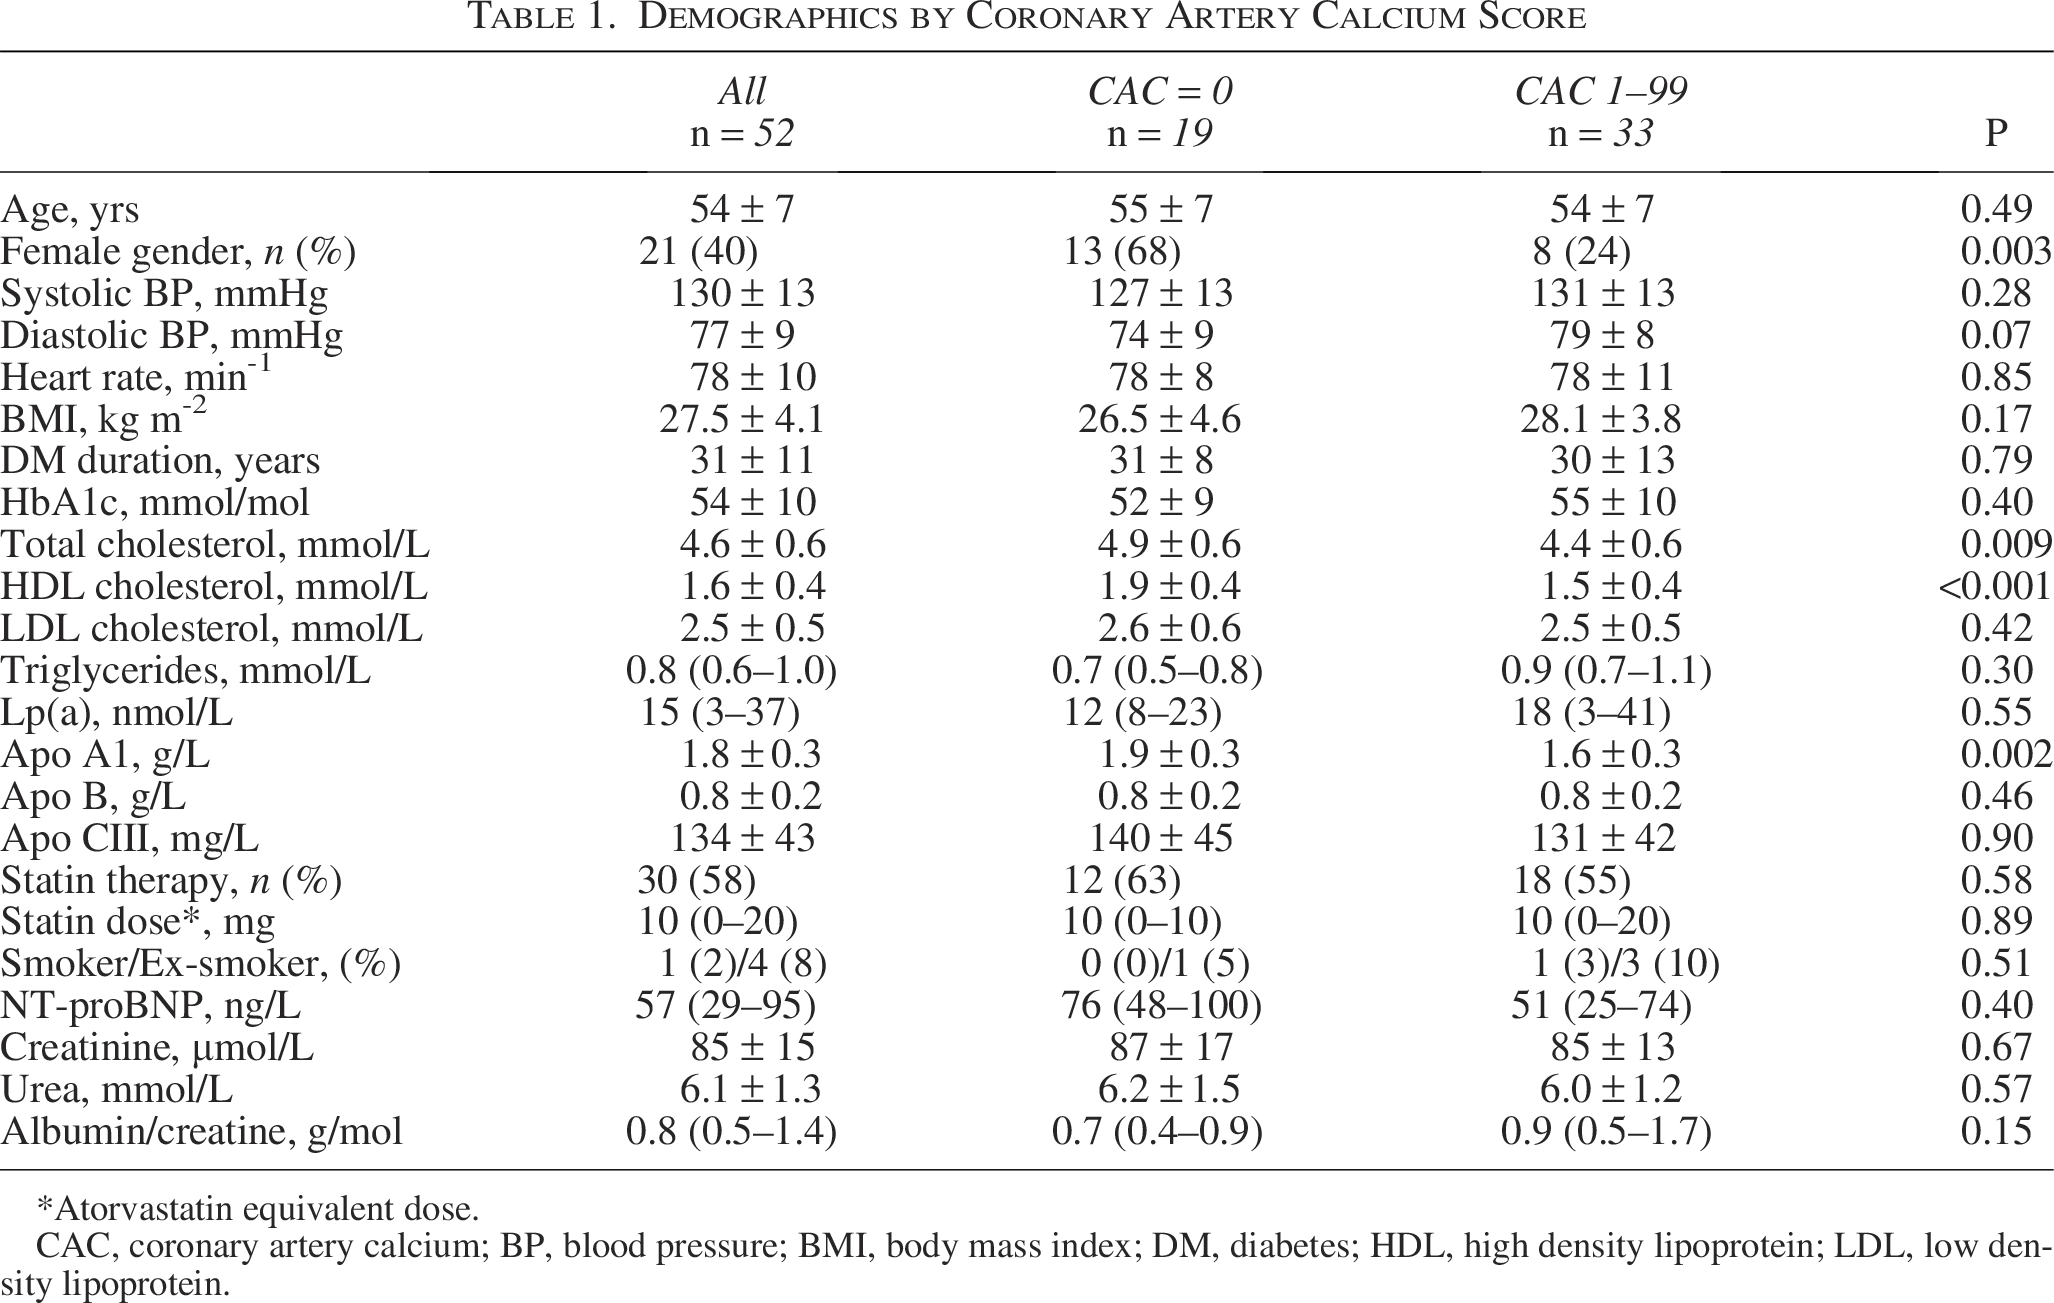
*Atorvastatin equivalent dose.
CAC, coronary artery calcium; BP, blood pressure; BMI, body mass index; DM, diabetes; HDL, high density lipoprotein; LDL, low density lipoprotein.
According to the CADS-RADS2 classification, 11 patients (21.2%) had an absence of CAD (Stage 0), while 17 (32.7%) had minimal nonobstructive CAD (Stage 1), 14 (26.9%) had mild-nonobstructive CAD (Stage 2), 1 (1.9%) had moderate stenosis (Stage 3), and 9 (17.3%) had severe stenosis (Stage 4A).
The CCTA-based CADS-RADS2 classification reclassified CAC-based categories. Only 58% of patients with CAC 0 had no CAD, while 11% had severe stenosis. Among patients with CAC 1 to 99, 21% had severe coronary stenosis (Table 2). As evaluated by linear weighted kappa (κ = 0.45), there was only a moderate agreement between CADS-RADS2 and CAC risk categories.
CADS-RADS2 Categories by STENO1 Risk Categories (Panel A) and Coronary Artery Calcium Score (Panel B)
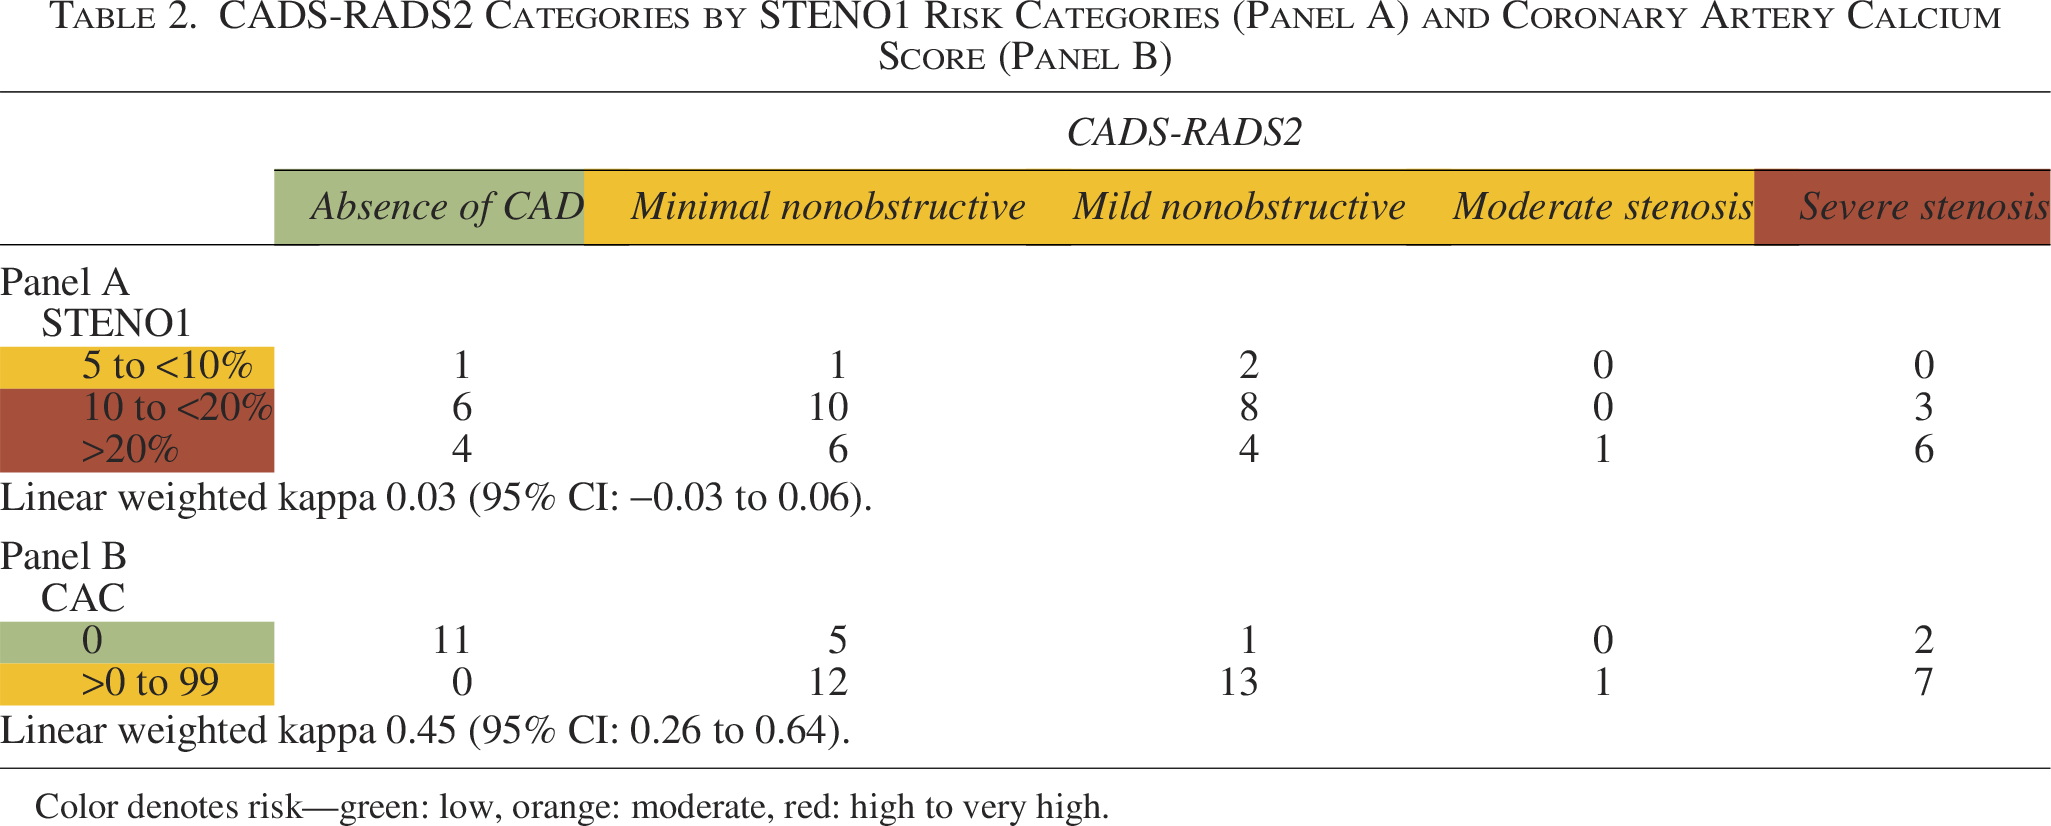
Color denotes risk—green: low, orange: moderate, red: high to very high.
Stage 3: AI-QCT
The AI-QCT analysis of PAV revealed that 41 (78.8%) patients had PAV levels in the >0%−5% range, and 1 (1.9%) patient had PAV in the 5%–15% range. Of these 42 patients with PAV >0, 30 (71.4%) had at least one HRP, with eight patients having two HRPs and four patients having three HRPs. Figure 1 illustrates an example of CCTA and AI-QCT analysis in a patient with CAC 0.
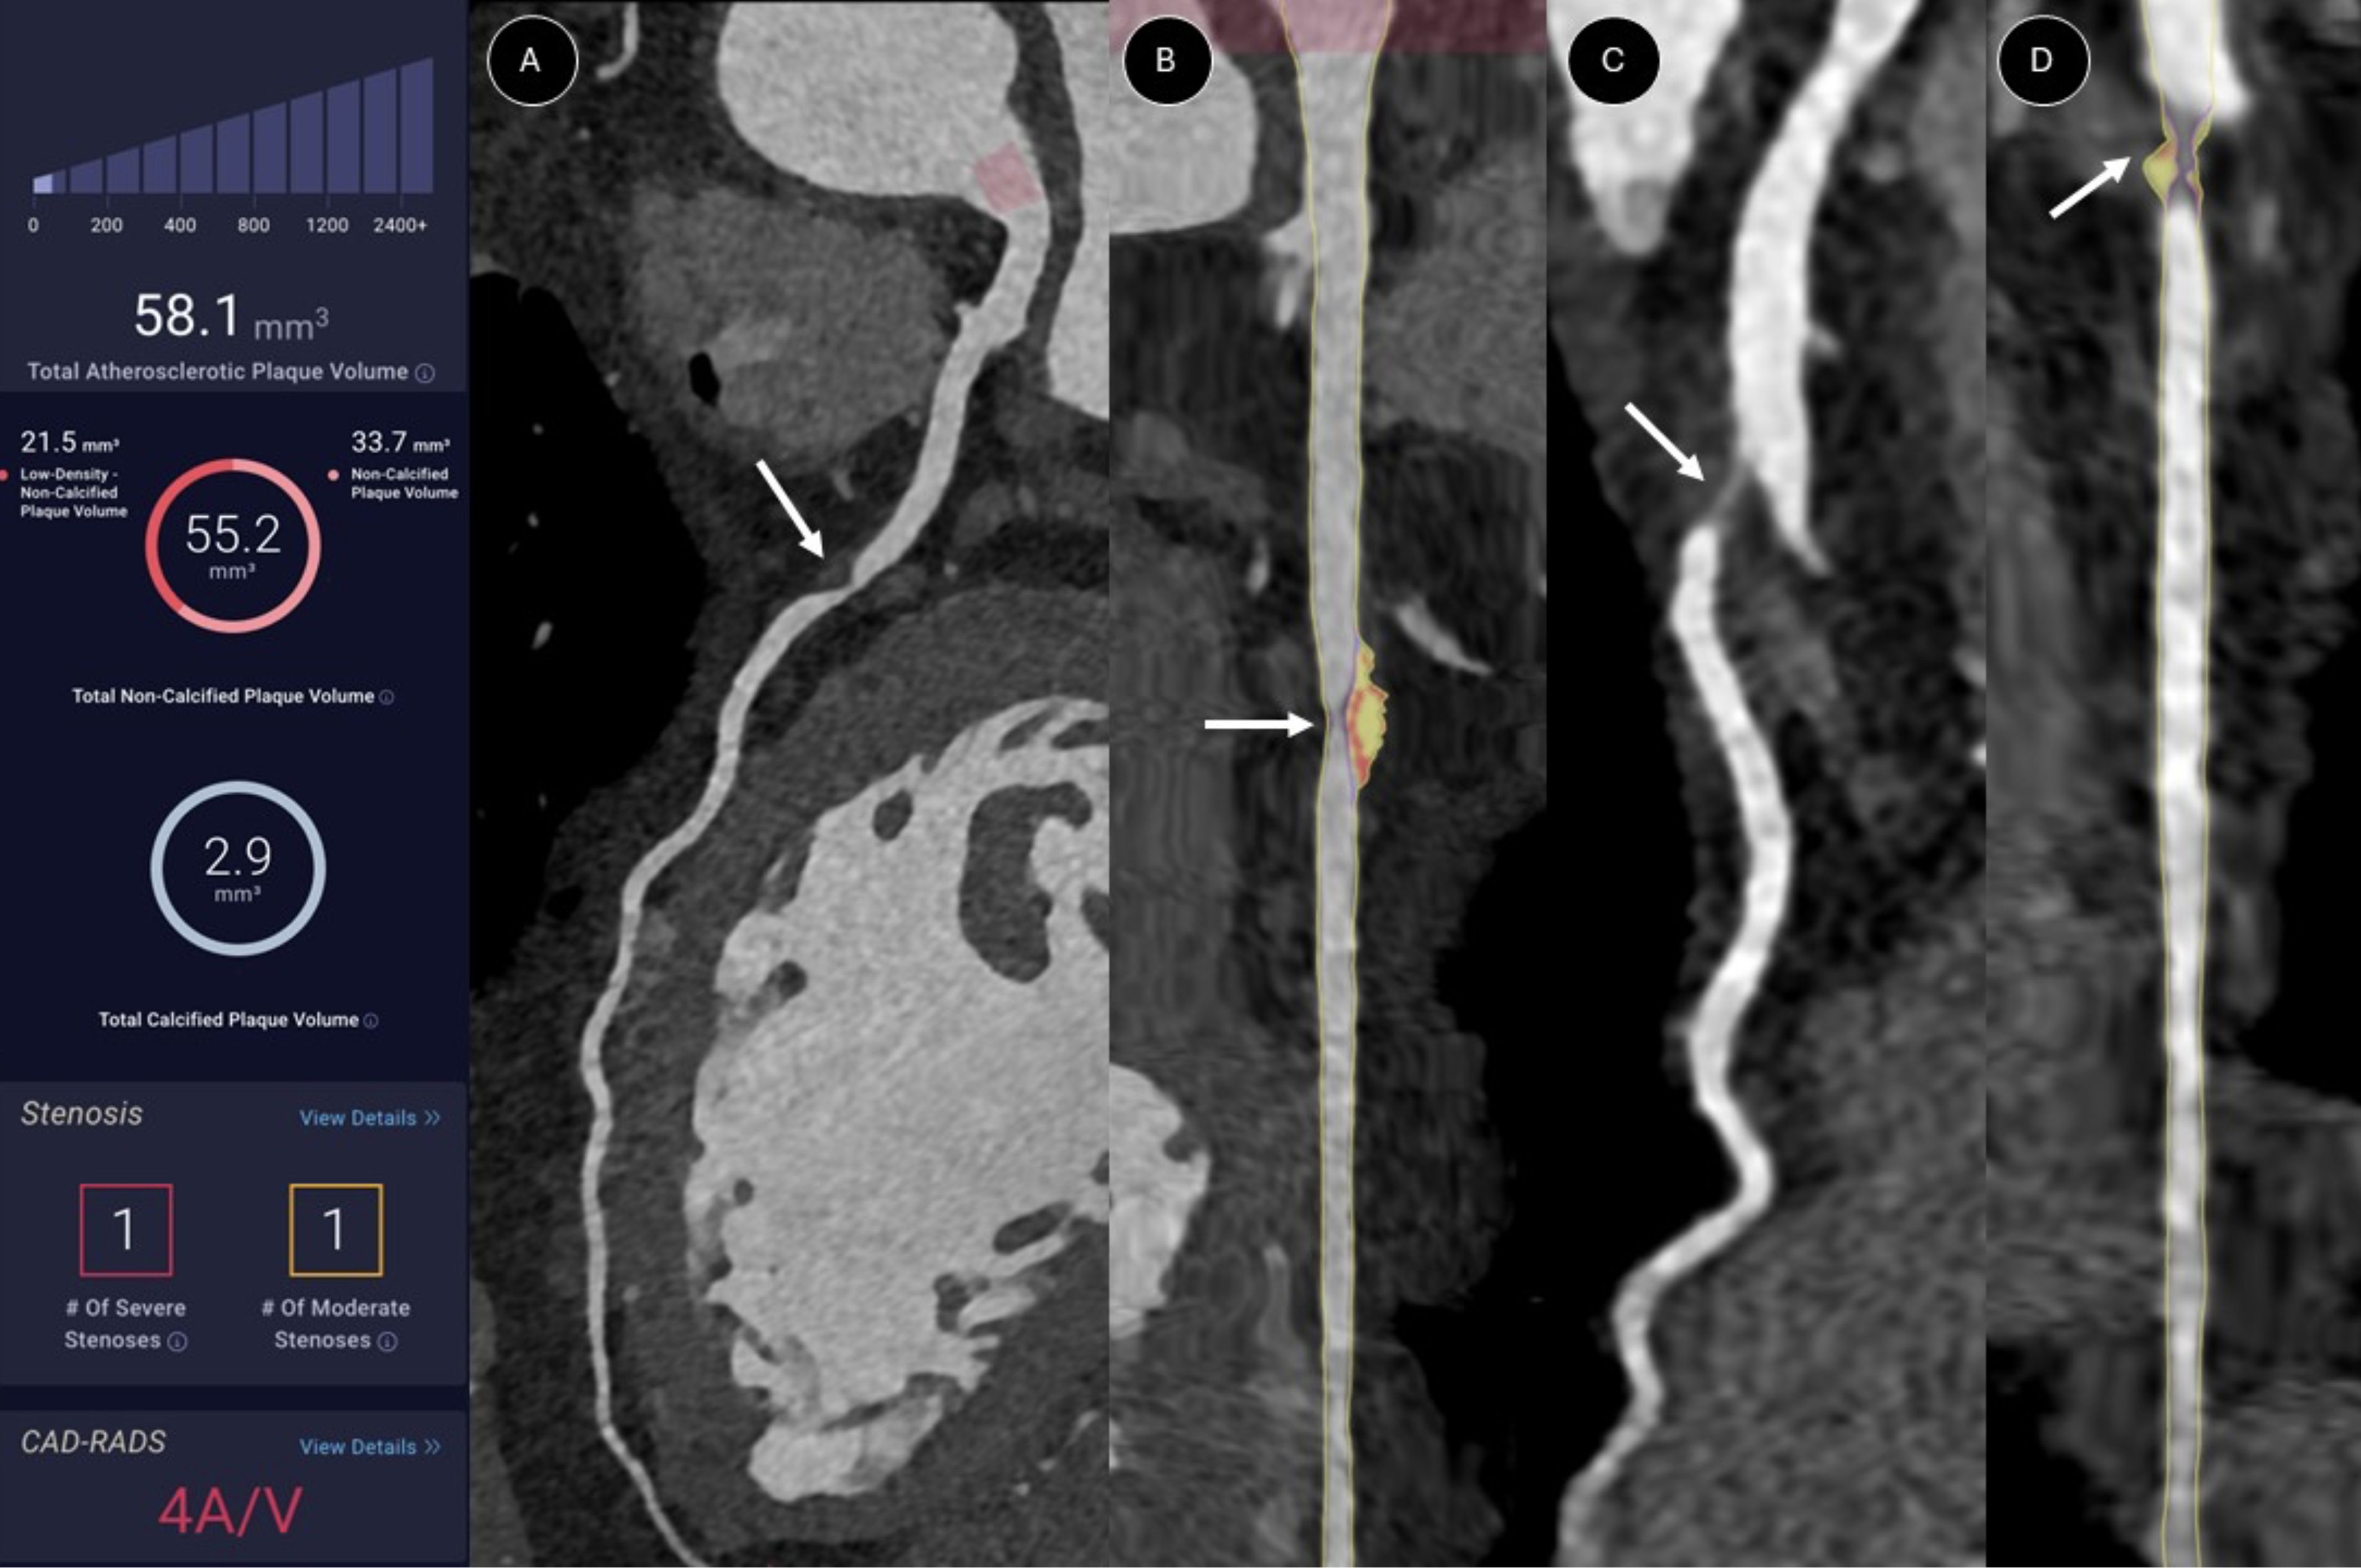
Comparison of coronary computed tomographic angiography (CCTA) and AI-QCT analysis. A 56-year-old female patient with a T1D duration of 43 years and a coronary artery calcium score of 0.
Compared with CAC, the AI-QCT examination reclassified six patients with CAC 0 and 24 patients with CAC 1–99 as high-risk, totaling 57.7% of reclassified patients (Table 3). As evaluated by linear weighted kappa (κ = 0.25), there was only a fair agreement between AI-QCT and CAC risk categories.
Categories by Percent Atheroma Volume and High-Risk Plaque Presence by STENO1 Categories (Panel A) and Coronary Artery Calcium Score (Panel B)
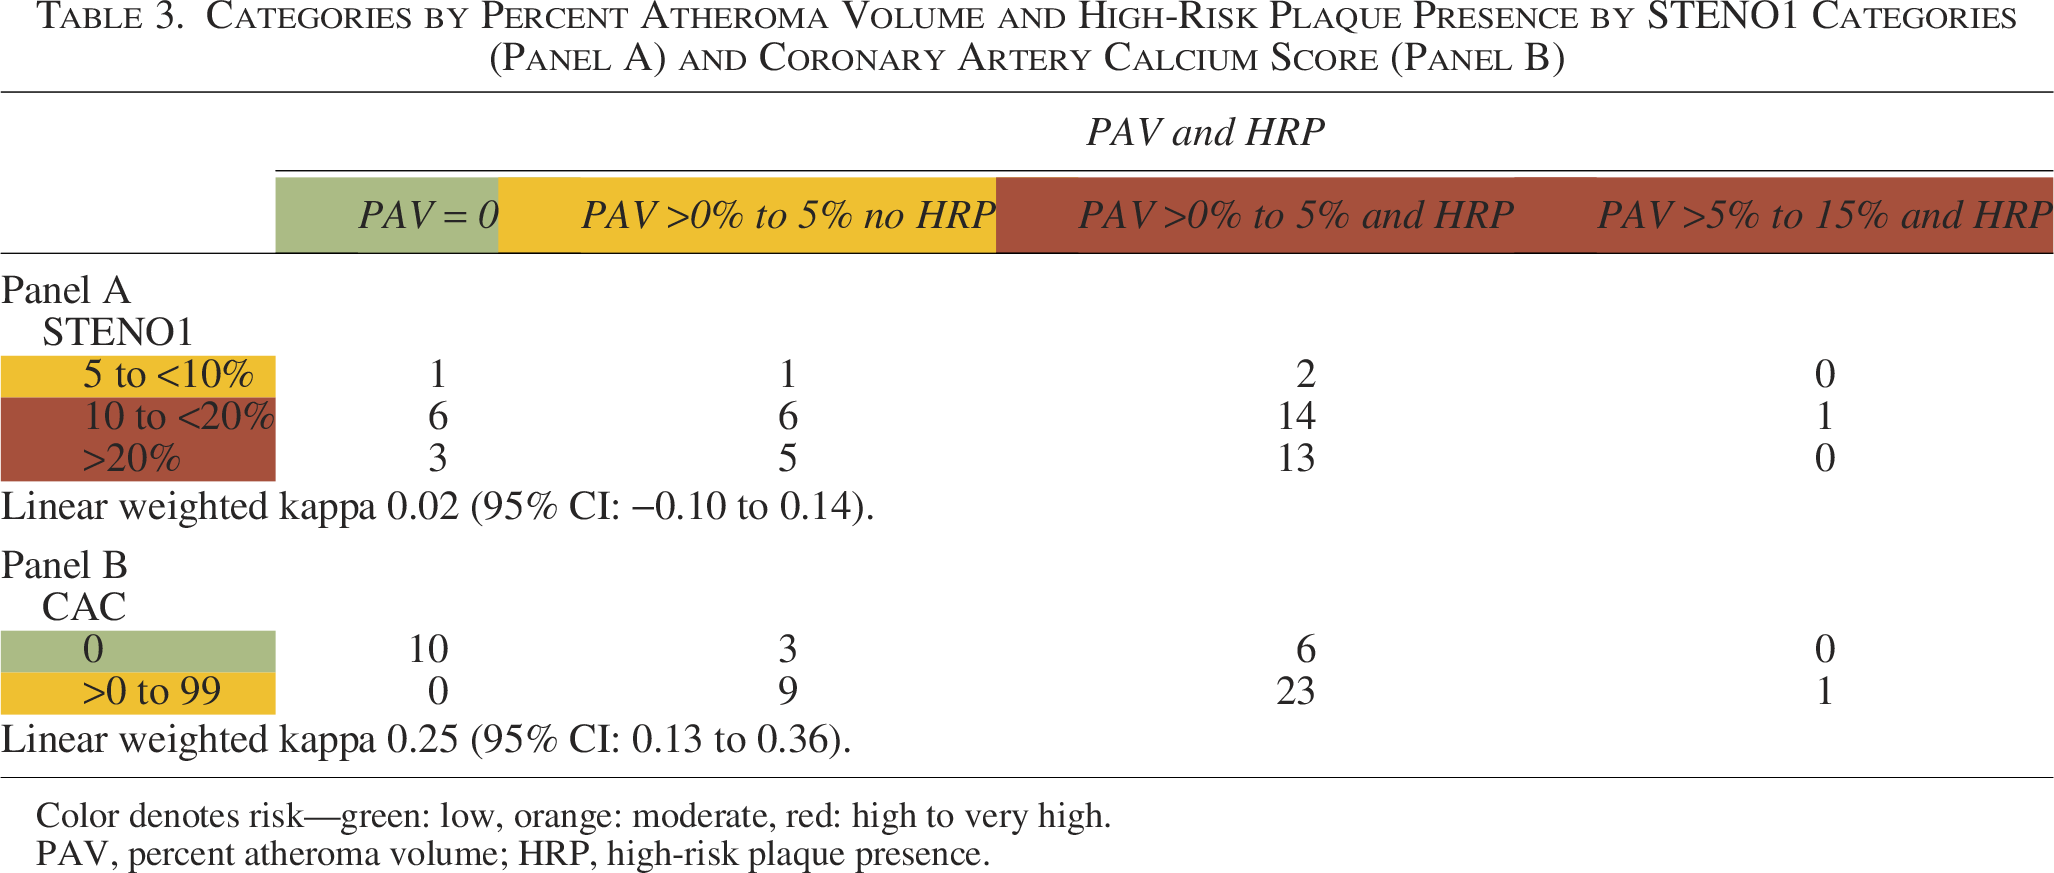
Color denotes risk—green: low, orange: moderate, red: high to very high.
PAV, percent atheroma volume; HRP, high-risk plaque presence.
The AI-QCT also reclassified patients across the STENO1 risk categories. Among those initially categorized as STENO1 moderate risk (n = 4), two patients exhibited a PAV in the >0%–5% range along with HRP, warranting reclassification into a higher-risk category. Within the STENO1 high-risk group (n = 27), six patients (22.2%) had a PAV of 0, as did three patients (14.3%) in the STENO1 very high-risk group (n = 21), indicating potential overestimation of risk in these individuals. Overall, AI-QCT reclassified two moderate-risk patients into a higher-risk group and nine high- or very high-risk patients into a lower-risk group, resulting in a total reclassification rate of 21.2% (Table 3). The linear weighted kappa between STENO1 and AI-QCT risk stratification was 0.02, indicating only slight agreement between methods. This divergence in risk stratification suggests that AI-QCT may capture aspects of cardiovascular risk that are not reflected in traditional risk factor-based models.
Clinical factors associated with AI-QCT variables
To identify patients who may benefit most from AI-QCT, we evaluated the associations between clinical risk factors and AI-QCT-derived measures of coronary atherosclerosis. However, there was no association between PAV and age, DM duration, LDL, or Apo-B level (Table 4). Furthermore, the STENO1 risk engine was not associated with any features of the coronary atherosclerosis burden. Only HDL cholesterol and ApoA1 levels were associated with PAV and noncalcified plaque volume. The negative association between age and both noncalcified and low-density plaque volume presumably reflected a higher prevalence of these early-stage plaques in younger patients.
Clinical Variables Association with AI-QCT Variables
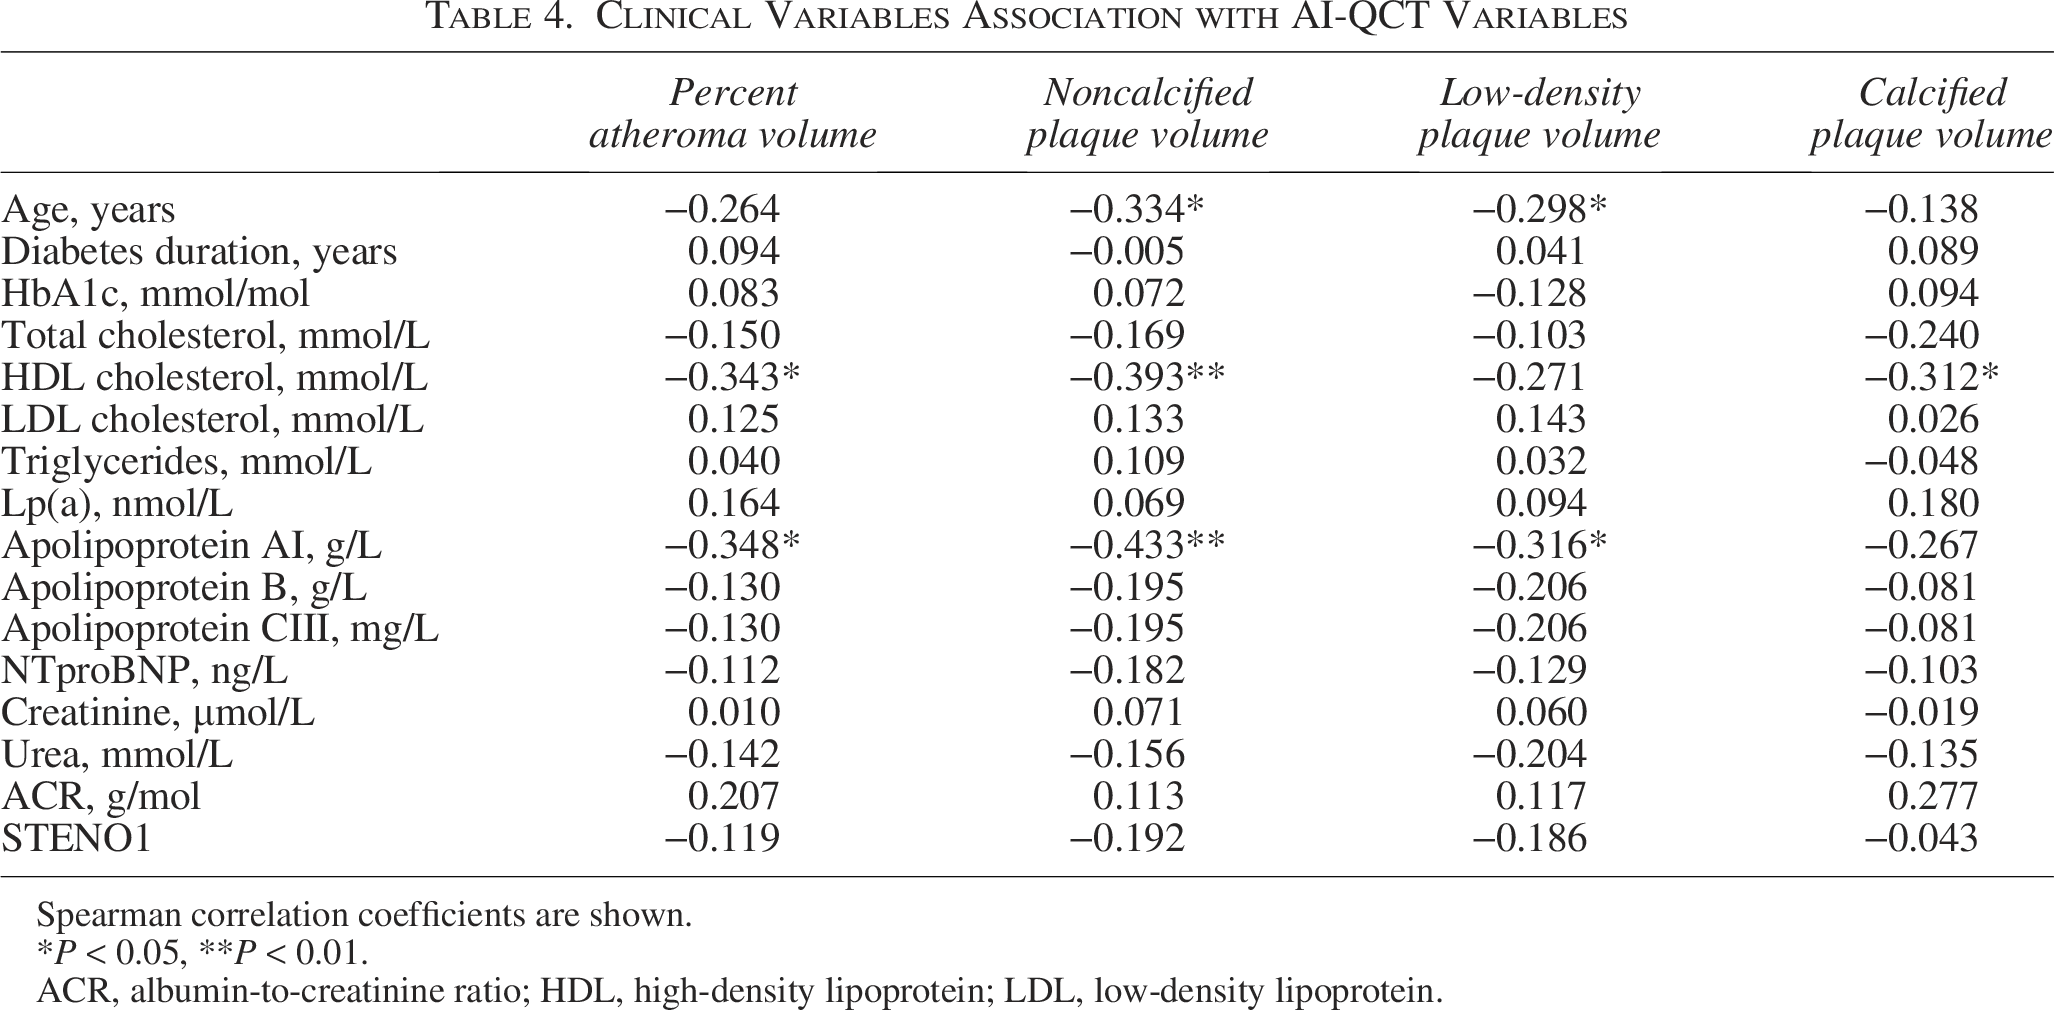
Spearman correlation coefficients are shown.
*P < 0.05, **P < 0.01.
ACR, albumin-to-creatinine ratio; HDL, high-density lipoprotein; LDL, low-density lipoprotein.
Discussion
This study highlights the utility of AI-based CCTA evaluation in refining ASCVD risk in T1D patients with low-to-moderate ASCVD risk as defined by CAC. We found that only 21% of patients with CAC <100 have an absence of CAD, while 17% have significant coronary artery stenosis, and 58% have at least one high-risk plaque. Overall, AI-QCT showed only slight agreement with STENO1 risk categories, suggesting that AI-QCT may capture aspects of cardiovascular risk not reflected by traditional risk factor-based models. Furthermore, our findings highlight the substantial burden of noncalcified atherosclerosis in T1D patients that remains undetected by CAC, challenging the prevailing assumption that a low CAC score equates to low cardiovascular risk in this population.
Given the limitations of traditional risk scores at the individual level, detecting subclinical atherosclerosis has emerged as a promising strategy to guide personalized prevention. While intensive control of cardiovascular risk factors can regress noncalcified plaques, unlike calcified plaques, early detection becomes critical to intercept the disease before it progresses. 24
CCTA offers this capability by enabling the non-invasive detection and characterization of coronary plaques; however, its utility has traditionally been limited to patients with suspected CAD. The FACTOR-64 trial, 25 which assessed CCTA screening in asymptomatic high-risk T2D patients, failed to demonstrate a reduction in major cardiovascular events. However, this may reflect a focus on revascularization over aggressive risk factor modification. Results of the FACTOR-64 trial align with the observation that coronary revascularization does not improve outcomes in stable CAD, even in patients with moderate to large ischemia. 26 In contrast, the SCOT-HEART study, which incorporated CCTA findings to guide preventive measures, demonstrated a significant reduction in coronary death and nonfatal myocardial infarction. 27 These contrasting outcomes underscore that the clinical utility of CCTA lies not in procedural escalation but in risk reclassification and improved risk factor control, especially LDL cholesterol.
Traditionally, patients with high or very high calculated ASCVD risk are referred for CCTA to detect obstructive disease. However, AI-QCT expands this paradigm by quantifying the total plaque burden, identifying HRP, and capturing nonobstructive disease—all of which carry prognostic value. Despite this, no prior studies have investigated the prevalence of clinically relevant coronary lesions in low-to-moderate-risk T1D patients. Our study fills this gap and reveals a surprisingly high prevalence of CAD in this subgroup. Notably, only 21% of those with CAC <100 were free of CAD, suggesting a significant underestimation of risk by CAC scoring alone, likely due to the predominance of non-calcified plaques in this relatively young cohort.
While clinical risk factors are commonly used to predict ASCVD risk in T1D, surprisingly, we did not find any association between PAV and parameters such as LDL cholesterol, age, DM duration, or STENO1 risk engine. This may be partially explained by the difference in vascular damage patterns in T1D and T2D. 28 The only parameters associated with PAV were HDL cholesterol and ApoA-1. This finding aligns with a recent systematic review and meta-analysis, which demonstrate that a decrease in LDL and an increase in HDL are necessary for atherosclerotic plaque regression. 29 Furthermore, a central role of ApoA1 in inhibiting the progression of T1D and T2D has been suggested. 30
Although our study does not include longitudinal outcomes, we interpret our findings using validated thresholds from prior studies. In the study by Nurmohamed et al., 15 PAV 0 was associated with a 0% 10-year ASCVD risk, while PAV >0%–5% corresponded to a 10-year risk of 8.2%–10.0%, and PAV >5%–15% to 10.1%–15.3%. HRP presence increased the MACE risk over ninefold. Furthermore, the PREVENT trial demonstrated that preventive PCI of nonflow-limiting vulnerable plaques reduced MACE compared with optimal medical therapy alone. 31 When applied to our cohort, AI-QCT reclassified 21% of patients compared with the STENO1 engine and 58% compared with CAC, underscoring its potential to improve risk stratification. This highlights the potential of AI-QCT analysis to reclassify a substantial proportion of T1D patients, offering a more precise approach to risk stratification and potentially guiding more targeted interventions.
Our findings have significant implications for clinical practice. CAC scoring has been recommended for ASCV stratification in T2D patients. 5 However, in the present study, only 17% of T1D patients had CAC >100. On the other hand, 79% of patients with CAC <100 had CAD detected by AI-QCT. Based on these findings, we propose that in T1D patients aged 45 years or older, AI-QCT should be performed to stratify risk. In individuals with an HRP or increased PAV, intensive risk factor control, including LDL cholesterol reduction of over 50% and low-dose aspirin consideration, should be considered.
Study limitations and strengths
While our findings are compelling, several limitations must be acknowledged. First, to identify individuals at low cardiovascular risk who may not benefit from AI-QCT, we used a combined criterion of CAC = 0 and absence of carotid atherosclerotic plaques. Therefore, our findings may not be generalizable to all patients with a CAC score of 0. Future studies are needed to validate our assumption that this combination effectively identifies individuals with T1D who are at low risk. Second, the study’s cross-sectional design precludes direct assessment of long-term outcomes associated with CCTA-detected features. However, numerous previous studies have confirmed the predictive value of the AI-QCT features evaluated in this study. Nonetheless, the ASCV risk associated with the analyzed features may be even higher in T1D patients than in the general population, as was previously shown for CAC. 32 Third, no prior power analysis was conducted due to the absence of existing data on QCTA in the low-to-moderate-risk T1D population. Although the sample size in this study is limited, precluding definitive conclusions, our findings provide valuable preliminary insights to inform the design of a future, adequately powered study with hard clinical endpoints that could ultimately influence clinical practice. Although the study sample used in this study was adequate for an exploratory analysis, it limits the generalizability of the findings. Fourth, it is unclear whether interventions based on AI-QCT will decrease ASCVD risk. Future large-scale interventional studies should investigate the impact of AI-QCT-guided interventions on clinical outcomes in T1D.
A significant strength of this study is the use of validated AI software for quantitative plaque analysis. Manual quantitative plaque analysis is time-consuming, which precludes its clinical use in everyday practice. The Cleerly AI-QCT is superior to the consensus of level 3 expert readers in determining the severity of coronary artery stenosis, plaque volume, and composition. 19 While different software may vary in plaque burden analysis based on the thresholds used, we have employed software that has demonstrated predictive power in previous studies. 15
Conclusions
This study reveals a high prevalence of clinically significant coronary atherosclerosis in asymptomatic T1D patients with CAC <100, supporting the role of AI-guided QCT in enhancing risk stratification. These findings challenge the reliability of CAC alone in identifying low-risk individuals and underscore the value of advanced imaging in detecting subclinical disease and informing preventive strategies in T1D.
Footnotes
Funding Information
Supported by the Ministry of Health of the Czech Republic, grant no. NV 19-09-00125, NU 22-02-00130, and by the project National Institute for Research of Metabolic and Cardiovascular Diseases (Program EXCELES, Project No. LX22NPO5104)—Funded by the European Union—Next Generation EU. A free AI-QCT analysis was done by Cleerly Inc., Denver, Colorado, USA.
Supplemental Material
References
Supplementary Material
Please find the following supplemental material available below.
For Open Access articles published under a Creative Commons License, all supplemental material carries the same license as the article it is associated with.
For non-Open Access articles published, all supplemental material carries a non-exclusive license, and permission requests for re-use of supplemental material or any part of supplemental material shall be sent directly to the copyright owner as specified in the copyright notice associated with the article.