
Abstract
Background:
Post hoc evaluation of ONWARDS 6 assessed continuous glucose monitoring (CGM) metrics and CGM-based hypoglycemia with once-weekly insulin icodec (icodec) and once-daily insulin degludec (degludec) in adults with type 1 diabetes.
Methods:
Open CGM data were collected throughout ONWARDS 6. During weeks 0–4, 22–26, and 48–52, time in range (TIR; 3.9–10.0 mmol/L), time above range (TAR; >10.0 mmol/L), and time below range (TBR; <3.9 and <3.0 mmol/L) were assessed by treatment day after icodec injection or degludec titration. Rates of CGM-based clinically significant hypoglycemic episodes (<3.0 mmol/L for ≥15 consecutive min) and durations of CGM-based hypoglycemic episodes (<3.9 mmol/L) and CGM-based periods <3.0 mmol/L were reported (baseline to weeks 26 and 57).
Results:
Although rates of overall CGM-based clinically significant hypoglycemia were statistically significantly higher with icodec than degludec from baseline to week 26 and week 57, estimated rate ratios (icodec/degludec) for CGM-based clinically significant hypoglycemic episodes were lower than those estimated from self-measured blood glucose (SMBG) data from baseline to week 26 (1.38 vs. 1.88) and to week 57 (1.28 vs. 1.79). Observed percentage of TIR was highest on days 2–4 after icodec injection with a concomitant reduction in TAR and an increase in TBR. Median duration of CGM-based hypoglycemic episodes was comparable between treatment arms from baseline to week 26 (icodec: 35 min; degludec: 30 min) and to week 57 (35 min for both treatments). Median duration of CGM-based periods <3.0 mmol/L was the same for both treatments at week 26 and week 57 (25 min).
Conclusion:
In adults with type 1 diabetes, estimated rate ratios for CGM-based clinically significant hypoglycemia were lower than those estimated from SMBG data, although still favoring degludec with estimated rate ratios of 1.28–1.38. CGM metrics varied by treatment day after icodec injection, but median duration of CGM-based hypoglycemia was comparable between treatment arms.
Introduction
Randomized controlled trials are increasingly using continuous glucose monitoring (CGM) devices to monitor the glucose profiles of participants. 1 Assessment of CGM data provides clinicians with a more comprehensive overview of glycemic control than glycated hemoglobin (HbA1c) alone and allows for the evaluation of additional outcomes, including CGM-based hypoglycemia duration. Consensus statements have been developed to provide recommendations on the consistent use of CGM assessment in clinical trials and subsequent data interpretation. 2
Insulin icodec (icodec) and insulin efsitora alfa (efsitora alfa) are once-weekly basal insulin analogs in clinical development.3,4 The pharmacokinetic (PK) and pharmacodynamic (PD) properties of icodec support the view that it can provide basal insulin coverage for a whole week after a single injection in individuals with type 1 diabetes. 5 The efficacy and safety of icodec in individuals with type 1 diabetes have been investigated in a 52-week (26-week main phase and 26-week safety extension phase), randomized, open-label, phase 3a trial as part of the ONWARDS clinical development program (ONWARDS 6; NCT04848480); CGM data were collected throughout the trial.6,7
In ONWARDS 6, icodec showed noninferiority to insulin degludec (degludec) (noninferiority margin: 0.3% points) in terms of HbA1c reduction from baseline to week 26 (estimated treatment difference [95% confidence interval or CI]: 0.53 [−1.46 to 2.51] mmol/mol; 0.05% points [−0.13% points to 0.23% points]). 7 Furthermore, during weeks 22–26 and 48–52, respectively, the observed percentages of time in range (TIR; 3.9–10.0 mmol/L [70–180 mg/dL]) were 59.1% and 57.3% in the icodec arm and 60.8% and 59.6% in the degludec arm, with no statistically significant differences observed between arms for either time period. The percentage of time below range (TBR; <3.0 mmol/L [<54 mg/dL]) was statistically significantly higher with icodec than with degludec during weeks 22–26 (1.0% vs. 0.7%, respectively; P = 0.0014), and there were no statistically significant differences between arms during weeks 48–52. No statistically significant differences in time above range (TAR; >10.0 mmol/L [>180 mg/dL]) were observed between arms at either time period.
When evaluated from baseline to week 26 or week 57 (52 weeks plus a 5-week follow-up period), the rate of combined clinically significant hypoglycemia (blood glucose <3.0 mmol/L [<54 mg/dL], confirmed by blood glucose meter) or severe hypoglycemia (no specific blood glucose threshold, associated with severe cognitive impairment requiring external assistance for recovery) was statistically significantly higher in the icodec arm than in the degludec arm. 7 Despite the higher rate of combined clinically significant or severe hypoglycemic episodes in the icodec arm, the number of participants who experienced severe hypoglycemia was comparable between treatment arms.
The efficacy and safety of efsitora alfa compared with once-daily degludec were assessed in the randomized phase 3 QWINT-5 trial (NCT05463744) in adults with type 1 diabetes receiving basal-bolus multiple daily injection therapy. 8 Efsitora alfa showed noninferiority in HbA1c reduction from baseline to week 26 and statistically significantly higher rates of combined clinically significant or severe hypoglycemia compared with degludec.
As summarized earlier, the prespecified efficacy and safety outcomes reported in ONWARDS 6 broadly assessed various aspects of icodec use in individuals with type 1 diabetes, including the assessment of selected CGM metrics during weeks 22–26 and 48–52. However, it is of interest to evaluate further the treatment effects of icodec using CGM data collected during the trial to compare hypoglycemic episodes based on CGM or self-measured blood glucose (SMBG) data, to assess the effect of icodec by treatment day after icodec injection, and to investigate CGM-based hypoglycemia duration. In this study, we describe a post hoc evaluation of CGM metrics and CGM-based hypoglycemia in individuals with type 1 diabetes switching from existing basal-bolus therapy to once-weekly icodec in combination with insulin aspart (aspart).
Methods
Trial design, participants, and procedure
This post hoc evaluation used data from the ONWARDS 6 phase 3a trial. The trial design, methods, and statistical analysis of ONWARDS 6 have been described previously; brief details are provided below. 7 The trial was conducted in compliance with the principles of the Declaration of Helsinki 9 and in accordance with the Good Clinical Practice guidelines of the International Conference for Harmonisation. 10
ONWARDS 6 was a randomized, multicenter, open-label, active-controlled, parallel-group, treat-to-target phase 3a trial. The trial comprised a 2-week screening period, a 52-week randomized treatment phase (26-week main phase and 26-week safety extension phase), and a 5-week follow-up period (Supplementary Fig. S1). ONWARDS 6 investigated the efficacy and safety of once-weekly icodec versus once-daily degludec in adults (aged ≥18 years) with type 1 diabetes and an HbA1c of less than 86 mmol/mol (<10.0%) who had been treated with basal-bolus insulin regimens for at least 1 year. Eligible participants were randomly assigned (1:1) to icodec or degludec, both in combination with bolus aspart (two or more daily injections).
At randomization, participants were provided with a blood glucose meter. Per protocol, participants were instructed to record four SMBG measurements per day (before each meal and at bedtime) throughout the trial. Participants wore a CGM device (Dexcom G6, Dexcom, Inc., USA) throughout the trial. CGM data were open to both participants and investigators but were not used for the titration of basal insulin or the self-reporting of hypoglycemic episodes.
Treatments
For individuals switching to once-weekly icodec (700 U/mL; Novo Nordisk), the icodec dose was calculated by multiplying the pretrial daily basal insulin dose by seven. For the first injection only, the dose was increased by either a 50% one-time additional dose for participants with a screening HbA1c of below 64 mmol/mol (<8.0%) or a 100% one-time additional dose for participants with a screening HbA1c of at least 64 mmol/mol (≥8.0%). Participants previously treated with insulin glargine U300 or twice-daily basal insulin received a 50% one-time additional dose regardless of screening HbA1c. For the second injection, participants received the calculated weekly dose (pretrial daily basal insulin dose multiplied by seven). Thereafter, the icodec dose was titrated once weekly according to a prespecified titration algorithm using the lowest of three prebreakfast SMBG values measured 2 days before titration and on the day of titration, to achieve a prebreakfast SMBG target of 4.4–7.2 mmol/L (80–130 mg/dL). Icodec doses were increased by 20 U/week if the lowest prebreakfast SMBG value was above 7.2 mmol/L (130 mg/dL) and decreased by the same amount if the lowest prebreakfast SMBG value was under 4.4 mmol/L (80 mg/dL).
The switch to degludec (100 U/mL; Novo Nordisk) was made in accordance with the local label; thereafter, titration was performed once weekly with dose adjustments based on the lowest of three prebreakfast SMBG values measured on each of the 2 days before titration and on the day of titration, to achieve the same prebreakfast SMBG target as icodec. Degludec doses were increased by 3 U/day if the lowest prebreakfast SMBG value was above 7.2 mmol/L (130 mg/dL) and decreased by the same amount if the lowest prebreakfast SMBG value was under 4.4 mmol/L (80 mg/dL).
For both arms, the switch from participants’ existing bolus insulin to aspart (100 U/mL; Novo Nordisk) was done unit-to-unit per meal. The aspart dose could either be adjusted weekly based on a prespecified titration algorithm (using the lowest preprandial or bedtime SMBG values measured in the week before titration) or based on carbohydrate counting. During the first 8 weeks, for participants using the titration algorithm, aspart dose adjustments were permitted for safety reasons only.
Definition of CGM-based hypoglycemia
A CGM-based hypoglycemic episode was defined as an episode with interstitial glucose (IG) below 3.9 mmol/L (<70 mg/dL) for at least 15 consecutive min, ending when IG was at least 3.9 mmol/L (≥70 mg/dL) for at least 15 consecutive min (Supplementary Fig. S2). The episode was classified as a clinically significant (level 2) hypoglycemic episode if IG was below 3.0 mmol/L (<54 mg/dL) for at least 15 consecutive min anytime during this interval; otherwise, the episode was a hypoglycemia alert value (level 1). 1 A CGM-based period below 3.0 mmol/L (<54 mg/dL) was defined as a period of IG below 3.0 mmol/L (<54 mg/dL) for at least 15 consecutive min, resolved when IG was at least 3.0 mmol/L (≥54 mg/dL) for at least 15 consecutive min. Within a CGM-based hypoglycemic episode, multiple CGM-based periods below 3.0 mmol/L (<54 mg/dL) might occur. Severe (level 3) hypoglycemic episodes were not included in the evaluations of CGM-based hypoglycemia because they were defined as episodes associated with severe cognitive impairment requiring external assistance for recovery and were not associated with a specific blood glucose threshold.
Post hoc evaluation
The incidence and rate of overall and nocturnal (from 00:01 h to 05:59 h, both inclusive) CGM-based clinically significant (level 2) hypoglycemic episodes were assessed from baseline to weeks 26 and 57 (the 52-week treatment period plus a 5-week follow-up period). The duration of overall CGM-based hypoglycemic episodes (IG <3.9 mmol/L [<70 mg/dL] for at least 15 consecutive min [i.e., combined level 1 and level 2]) and CGM-based periods below 3.0 mmol/L (<54 mg/dL) were evaluated for both time periods.
The percentages of TIR (3.9–10.0 mmol/L [70–180 mg/dL]), TAR (>10.0 mmol/L [>180 mg/dL]), and TBR (<3.9 mmol/L and <3.0 mmol/L [<70 mg/dL and <54 mg/dL]) were assessed by treatment day after icodec injection or degludec titration based on CGM data collected during three time periods (weeks 0–4, 22–26, and 48–52). These data were used to investigate the effects of icodec in the period immediately following the switch to trial treatment and to evaluate the effects of icodec further by treatment day in the prespecified CGM time periods throughout the trial. 7
Per consensus guidelines, for a participant to be included in the summary of CGM metrics, at least 70% of the planned CGM measurements had to be available for the time period assessed, 1 whereas all CGM data were taken into account for CGM-based hypoglycemia and duration.
The mean prebreakfast SMBG value and mean daily total bolus insulin dose by treatment day after icodec injection or degludec titration were reported during weeks 22–26 and 48–52.
Statistical analyses
CGM metrics and mean prebreakfast SMBG values were evaluated based on the in-trial period (i.e., from randomization to last participant contact) and the full analysis set (all randomized participants).
Safety outcomes were evaluated based on both the main-on-treatment (baseline to week 26) and on-treatment (baseline to week 57) periods; descriptive statistics were based on the safety analysis set (all participants receiving at least one dose of trial product), whereas statistical analyses were based on the full analysis set.
Hypoglycemic episodes were analyzed using a negative binomial model with log-link function, including geographical region (Asia, Europe, North America), screening HbA1c (<64 mmol/mol [<8.0%] or ≥64 mmol/mol [≥8.0%]), pretrial basal insulin treatment (either twice-daily insulin/insulin glargine U300 or once-daily insulin), and randomized treatment as fixed factors, and the logarithm of the main-on-treatment and on-treatment periods, respectively, as offset. Missing hypoglycemia data were imputed using multiple imputation for SMBG-based hypoglycemia only. Statistical analysis was not performed for hypoglycemia duration.
Results
Participants
In ONWARDS 6, 582 participants were randomized (icodec, n = 290; degludec, n = 292), all of whom received at least one dose of randomized treatment. 7 Of these participants, 555 (95%) completed the week 26 visit without permanent discontinuation of the trial product (icodec, n = 272 [94%]; degludec, n = 283 [97%]) and 540 (93%) completed the week 52 visit without permanent discontinuation of the trial product (icodec, n = 262 [90%]; degludec, n = 278 [95%]).
Participant demographics and baseline characteristics have previously been published. 7 Briefly, in the icodec arm and the degludec arm, respectively, mean (standard deviation [SD]) age was 44.1 (14.1) years (n = 290) and 44.3 (14.1) years (n = 292), and mean (SD) diabetes duration was 20.0 (13.2) years (n = 290) and 19.0 (12.9) years (n = 292). Mean (SD) baseline HbA1c was similar for the icodec arm (n = 290; 59 [10] mmol/mol; 7.59% [0.96%]) and the degludec arm (n = 292; 60 [10] mmol/mol; 7.63% [0.93%]).
Hypoglycemia incidence and rates
Table 1 shows the incidence and rate of overall CGM-based clinically significant (level 2) hypoglycemic episodes from baseline to weeks 26 and 57. During both time periods, the absolute number of CGM-based clinically significant hypoglycemic episodes was higher than that previously reported based on SMBG values for each treatment arm (baseline to week 26, icodec: 13,883 vs. 2789; degludec: 9965 vs. 1478; baseline to week 57, icodec: 26,986 vs. 5047; degludec: 21,623 vs. 2811). 7 However, the estimated rate ratios (ERRs; icodec/degludec) based on CGM data were lower than those based on SMBG data, although still favoring degludec (baseline to week 26, 1.38 vs. 1.88; baseline to week 57, 1.28 vs. 1.79). Similar patterns were seen for nocturnal hypoglycemic episodes (Table 1).
Incidence and Rates of Hypoglycemic Episodes (Overall and Nocturnal)
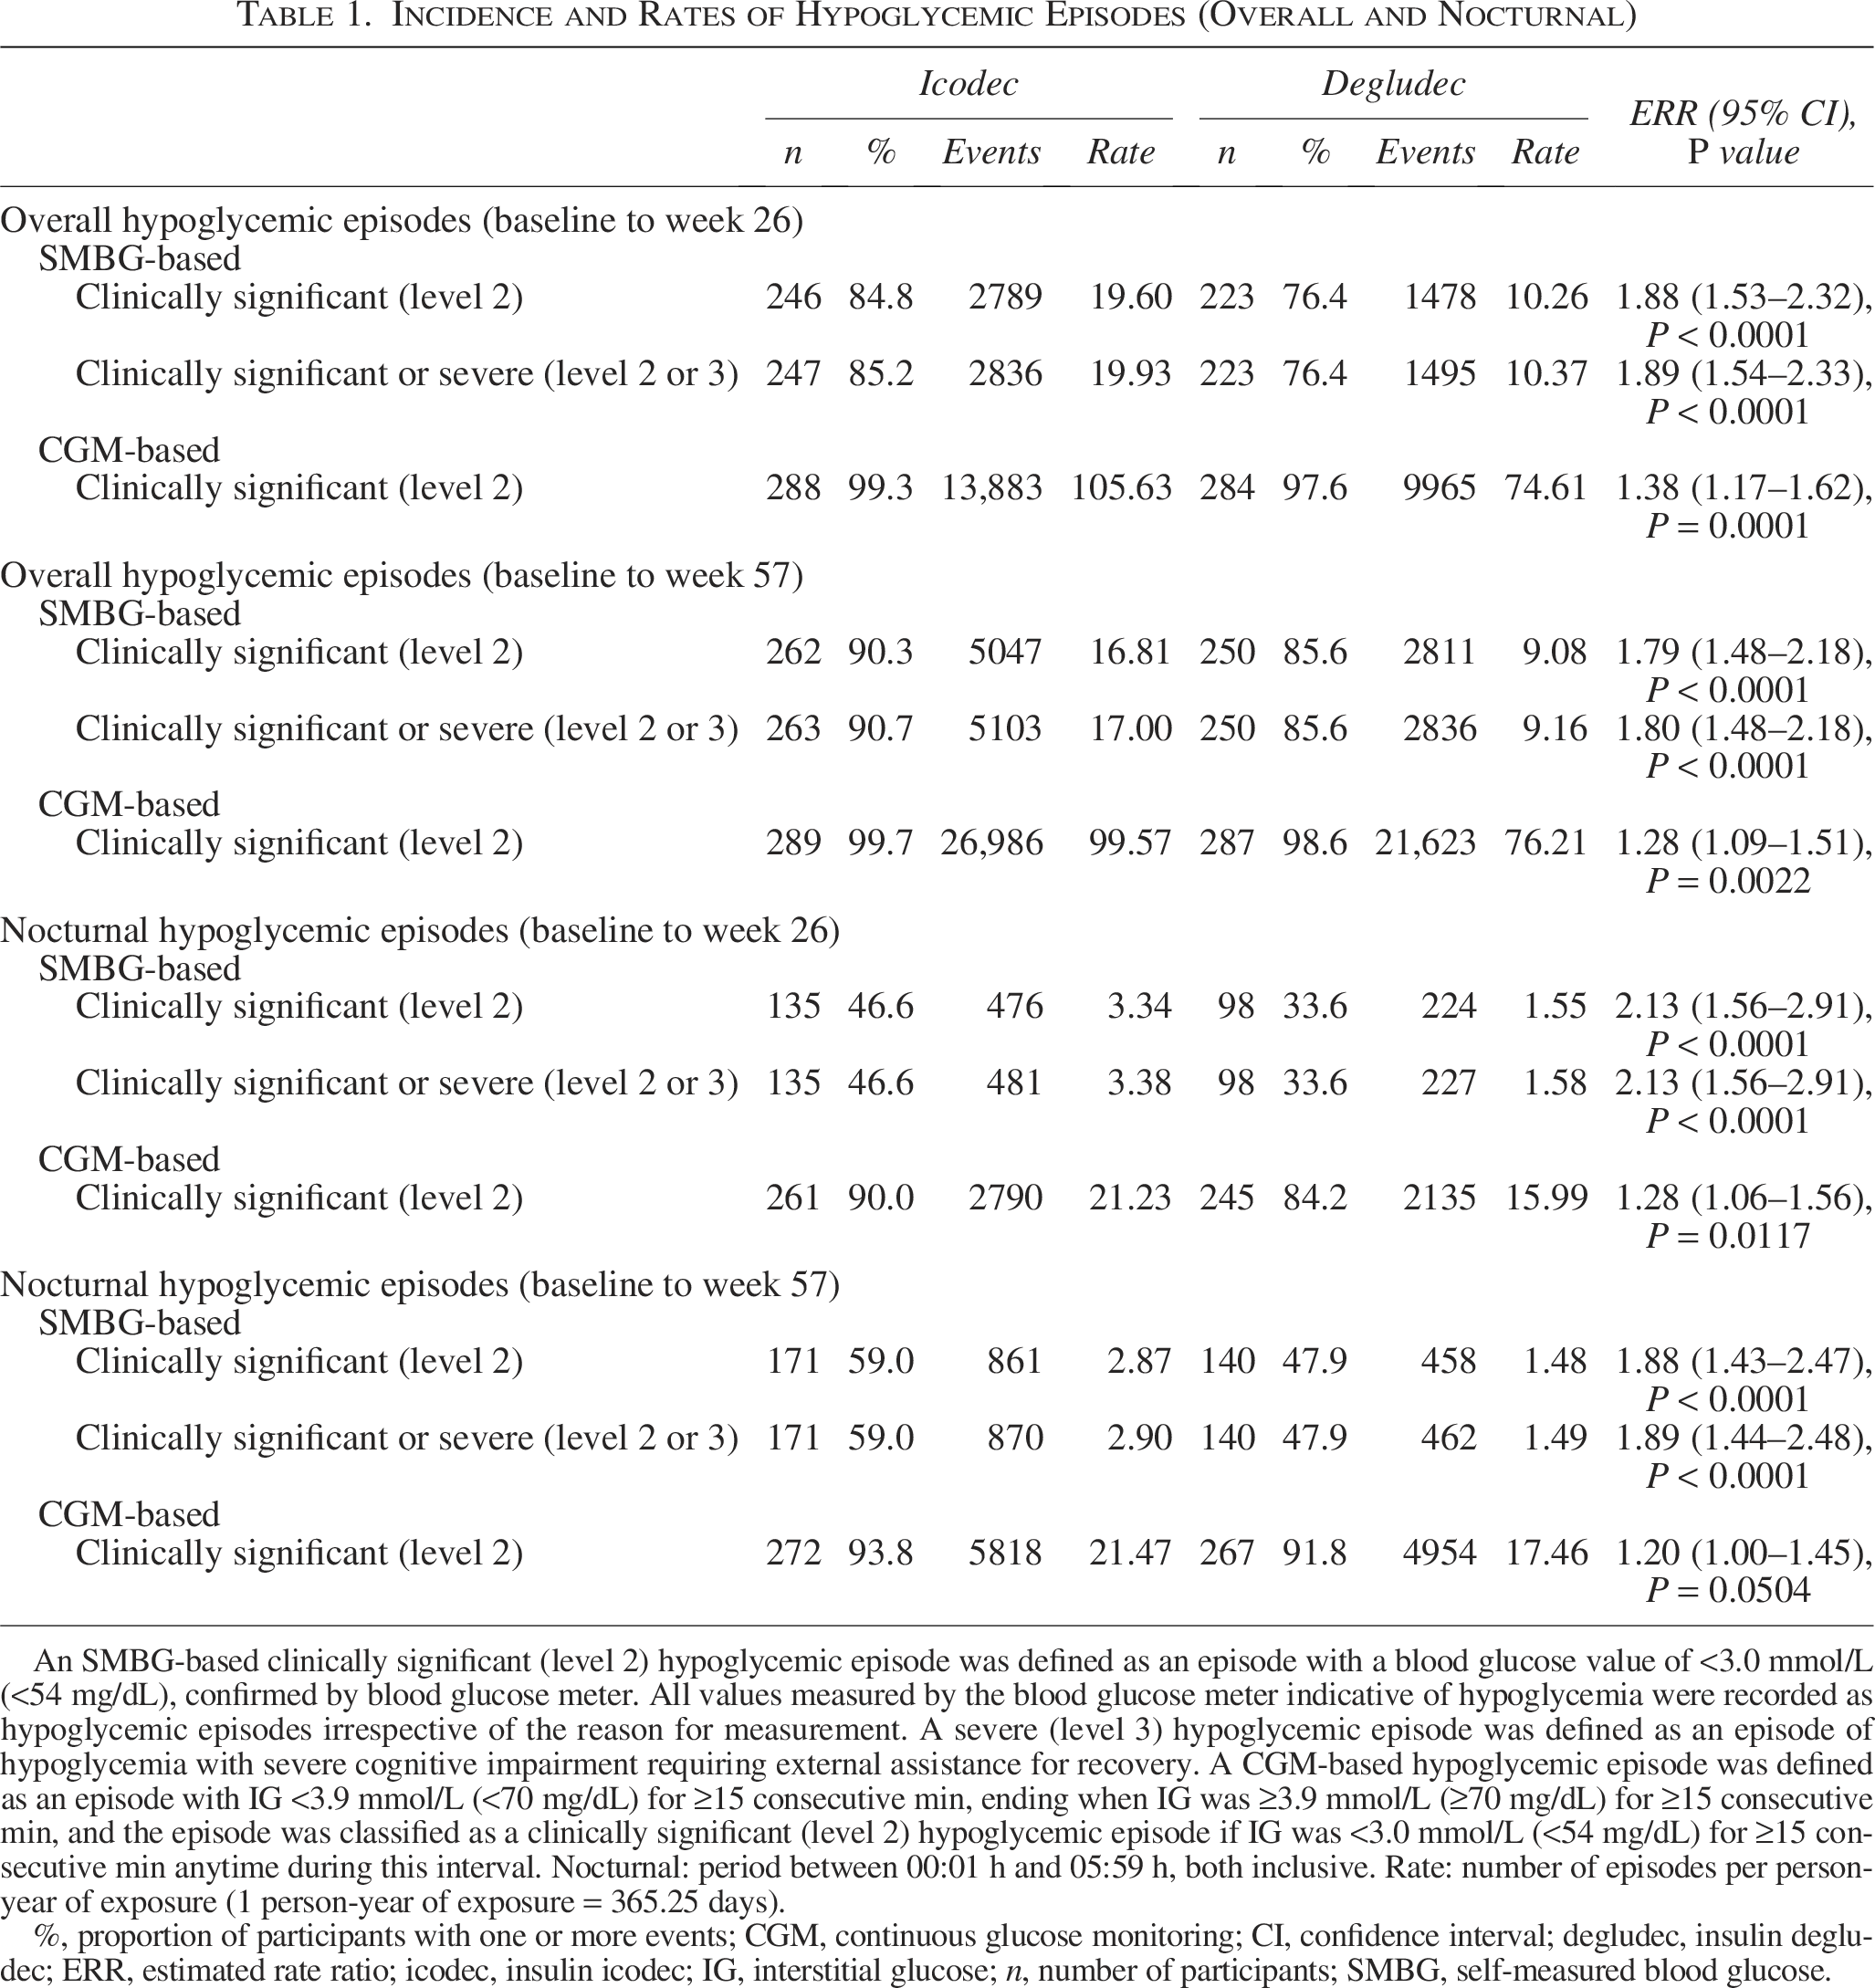
An SMBG-based clinically significant (level 2) hypoglycemic episode was defined as an episode with a blood glucose value of <3.0 mmol/L (<54 mg/dL), confirmed by blood glucose meter. All values measured by the blood glucose meter indicative of hypoglycemia were recorded as hypoglycemic episodes irrespective of the reason for measurement. A severe (level 3) hypoglycemic episode was defined as an episode of hypoglycemia with severe cognitive impairment requiring external assistance for recovery. A CGM-based hypoglycemic episode was defined as an episode with IG <3.9 mmol/L (<70 mg/dL) for ≥15 consecutive min, ending when IG was ≥3.9 mmol/L (≥70 mg/dL) for ≥15 consecutive min, and the episode was classified as a clinically significant (level 2) hypoglycemic episode if IG was <3.0 mmol/L (<54 mg/dL) for ≥15 consecutive min anytime during this interval. Nocturnal: period between 00:01 h and 05:59 h, both inclusive. Rate: number of episodes per person-year of exposure (1 person-year of exposure = 365.25 days).
%, proportion of participants with one or more events; CGM, continuous glucose monitoring; CI, confidence interval; degludec, insulin degludec; ERR, estimated rate ratio; icodec, insulin icodec; IG, interstitial glucose; n, number of participants; SMBG, self-measured blood glucose.
Profile by treatment day after injection/titration
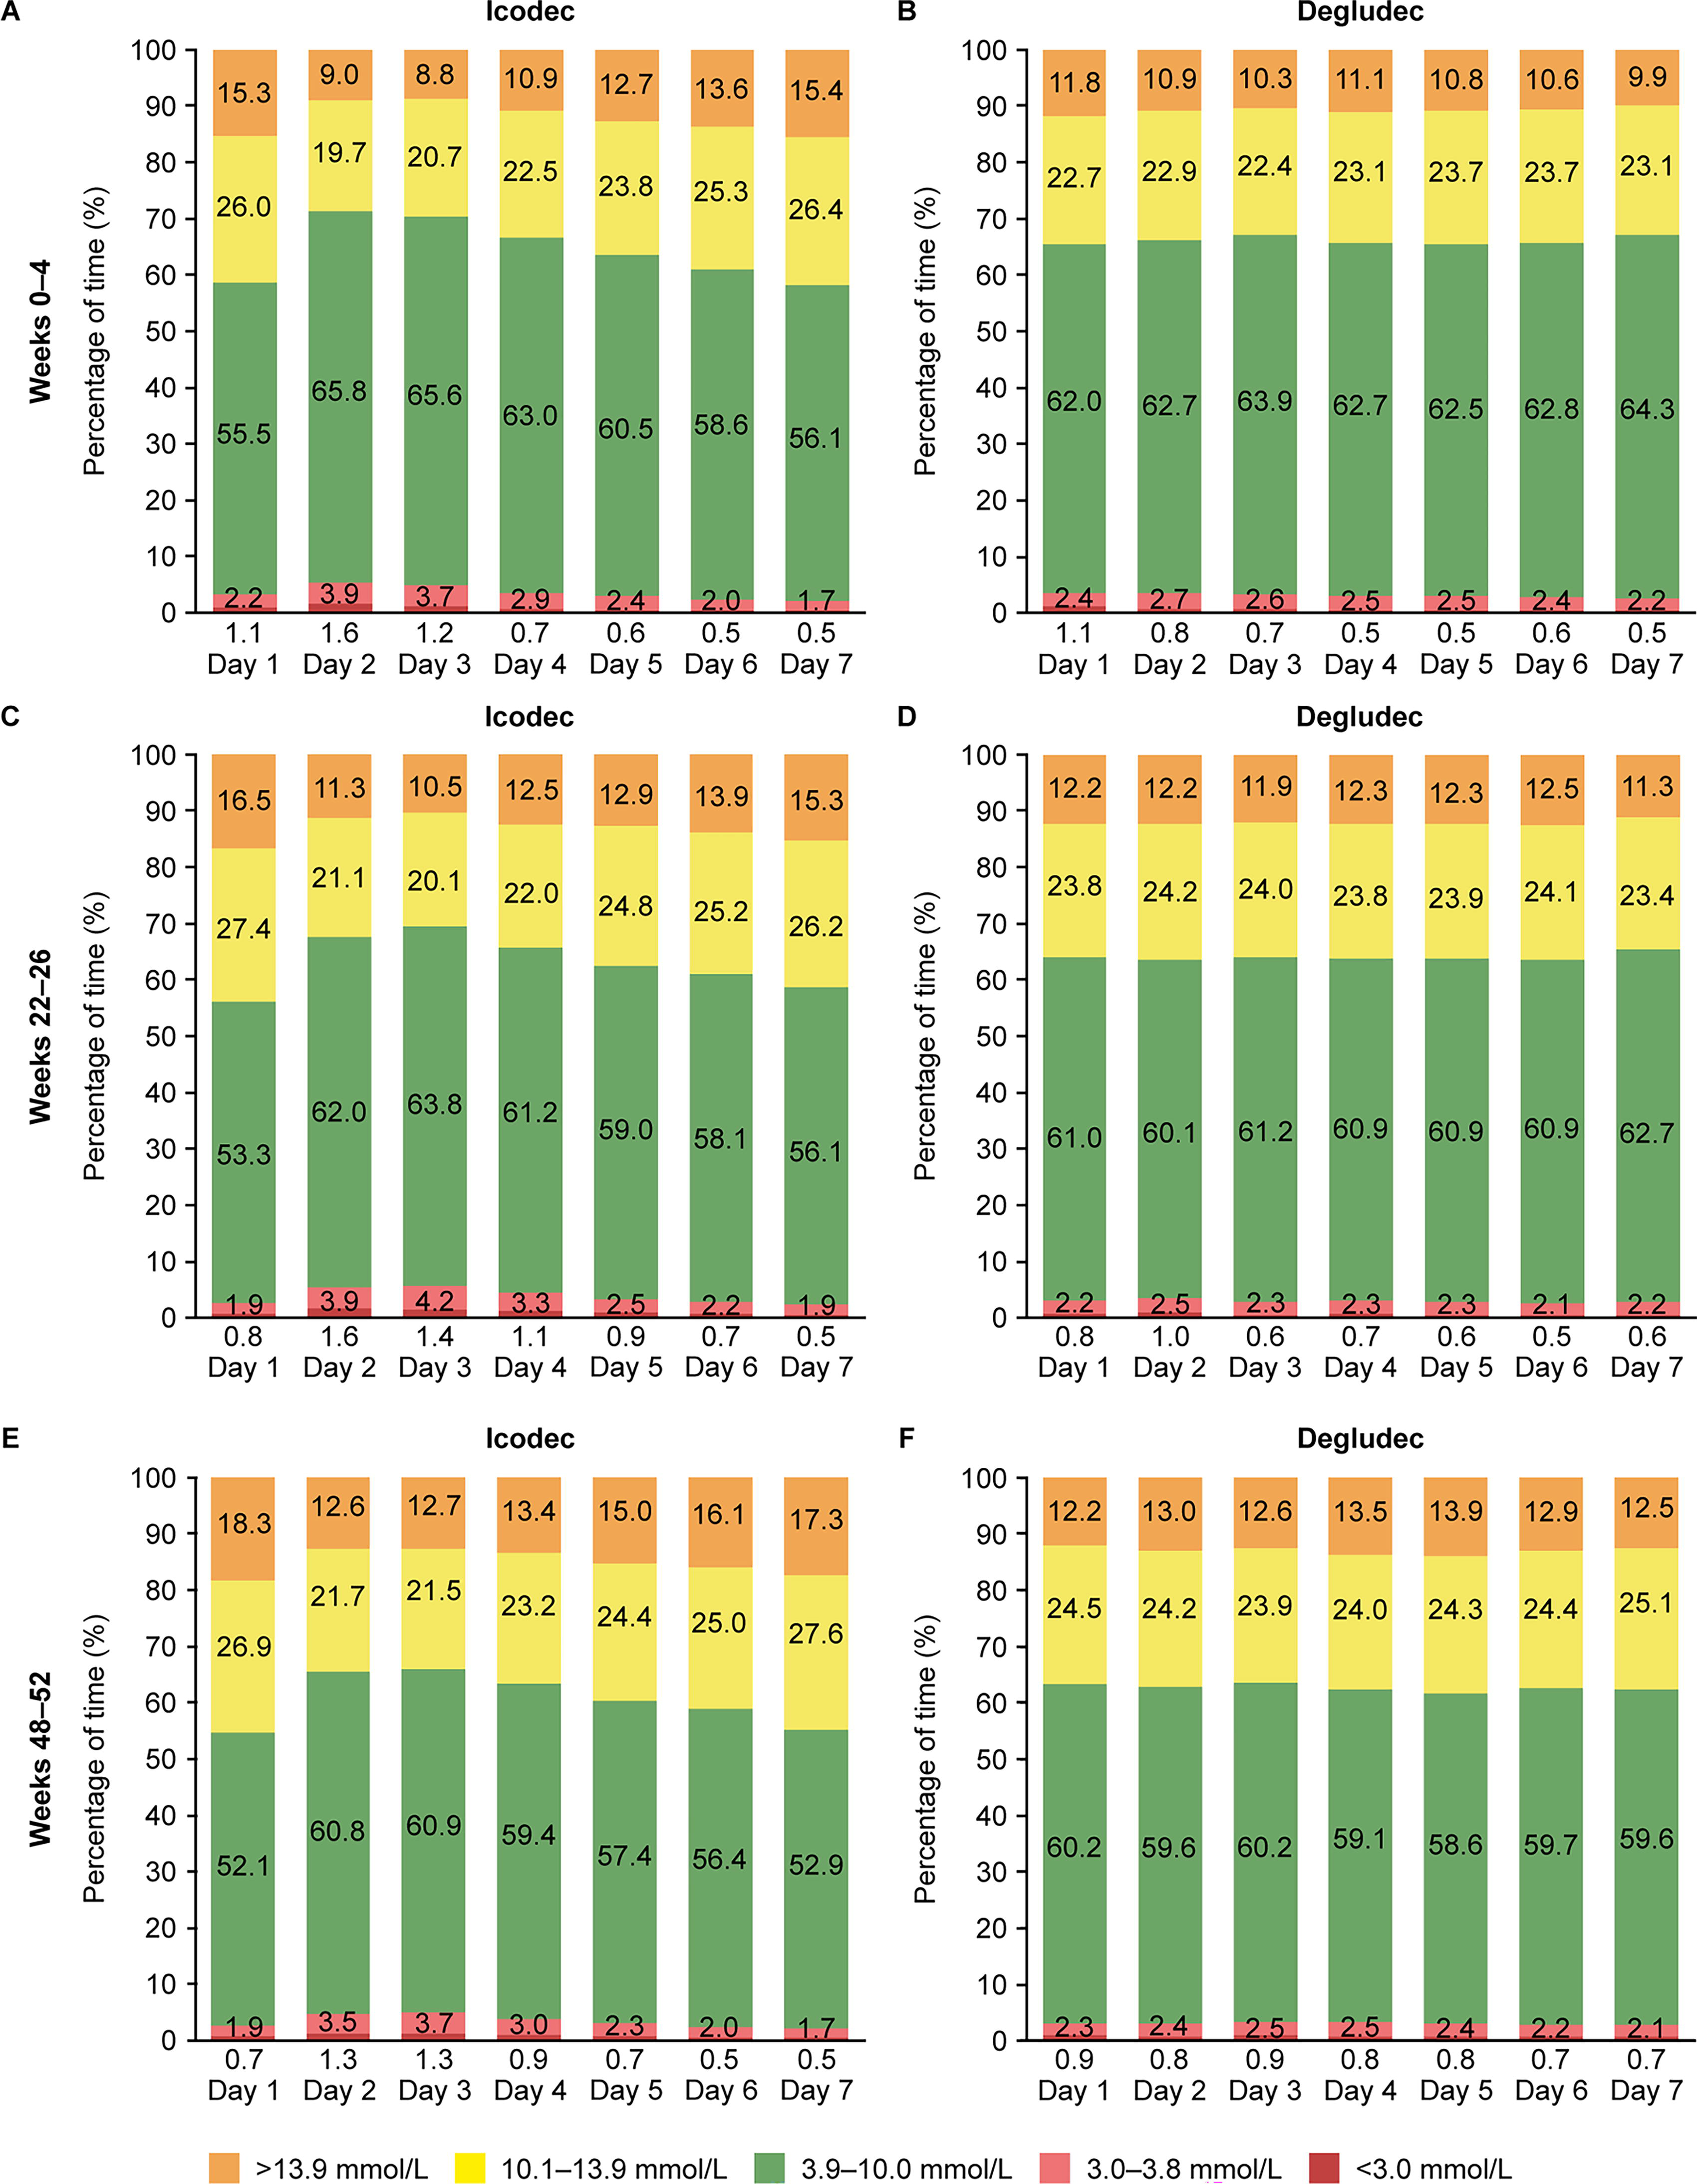
When CGM metrics were examined by treatment day during weeks 0–4, 22–26, and 48–52, the observed percentage of TIR was highest on days 2–4 after icodec injection (Fig. 1A, C, E). This was accompanied by a concomitant decrease in TAR and an increase in TBR below 3.9 mmol/L and below 3.0 mmol/L (<70 mg/dL and <54 mg/dL, respectively) (Fig. 1A, C, E; Supplementary Fig. S3A, C, E). In contrast, in the degludec arm, CGM metrics appeared to be relatively consistent across the treatment week after degludec titration (Fig. 1B, D, F; Supplementary Fig. S3B, D, F).
CGM metrics by treatment day during
During weeks 22–26, when examined by treatment day, observed mean prebreakfast SMBG values were lowest on days 2–4 after icodec injection (Supplementary Fig. S4A). Conversely, in the degludec arm, observed mean prebreakfast SMBG levels remained fairly consistent across the treatment week after degludec titration. During weeks 48–52, the patterns observed for both icodec and degludec were similar to those seen during weeks 22–26 (Supplementary Fig. S4B).
In the icodec arm, observed mean daily total bolus insulin dose was lowest on days 2–4 after icodec injection during both weeks 22–26 and 48–52 (Fig. 2A, B). This was not seen in the degludec arm, with observed mean daily total bolus insulin dose appearing to be stable across the treatment week after degludec titration during both time periods.
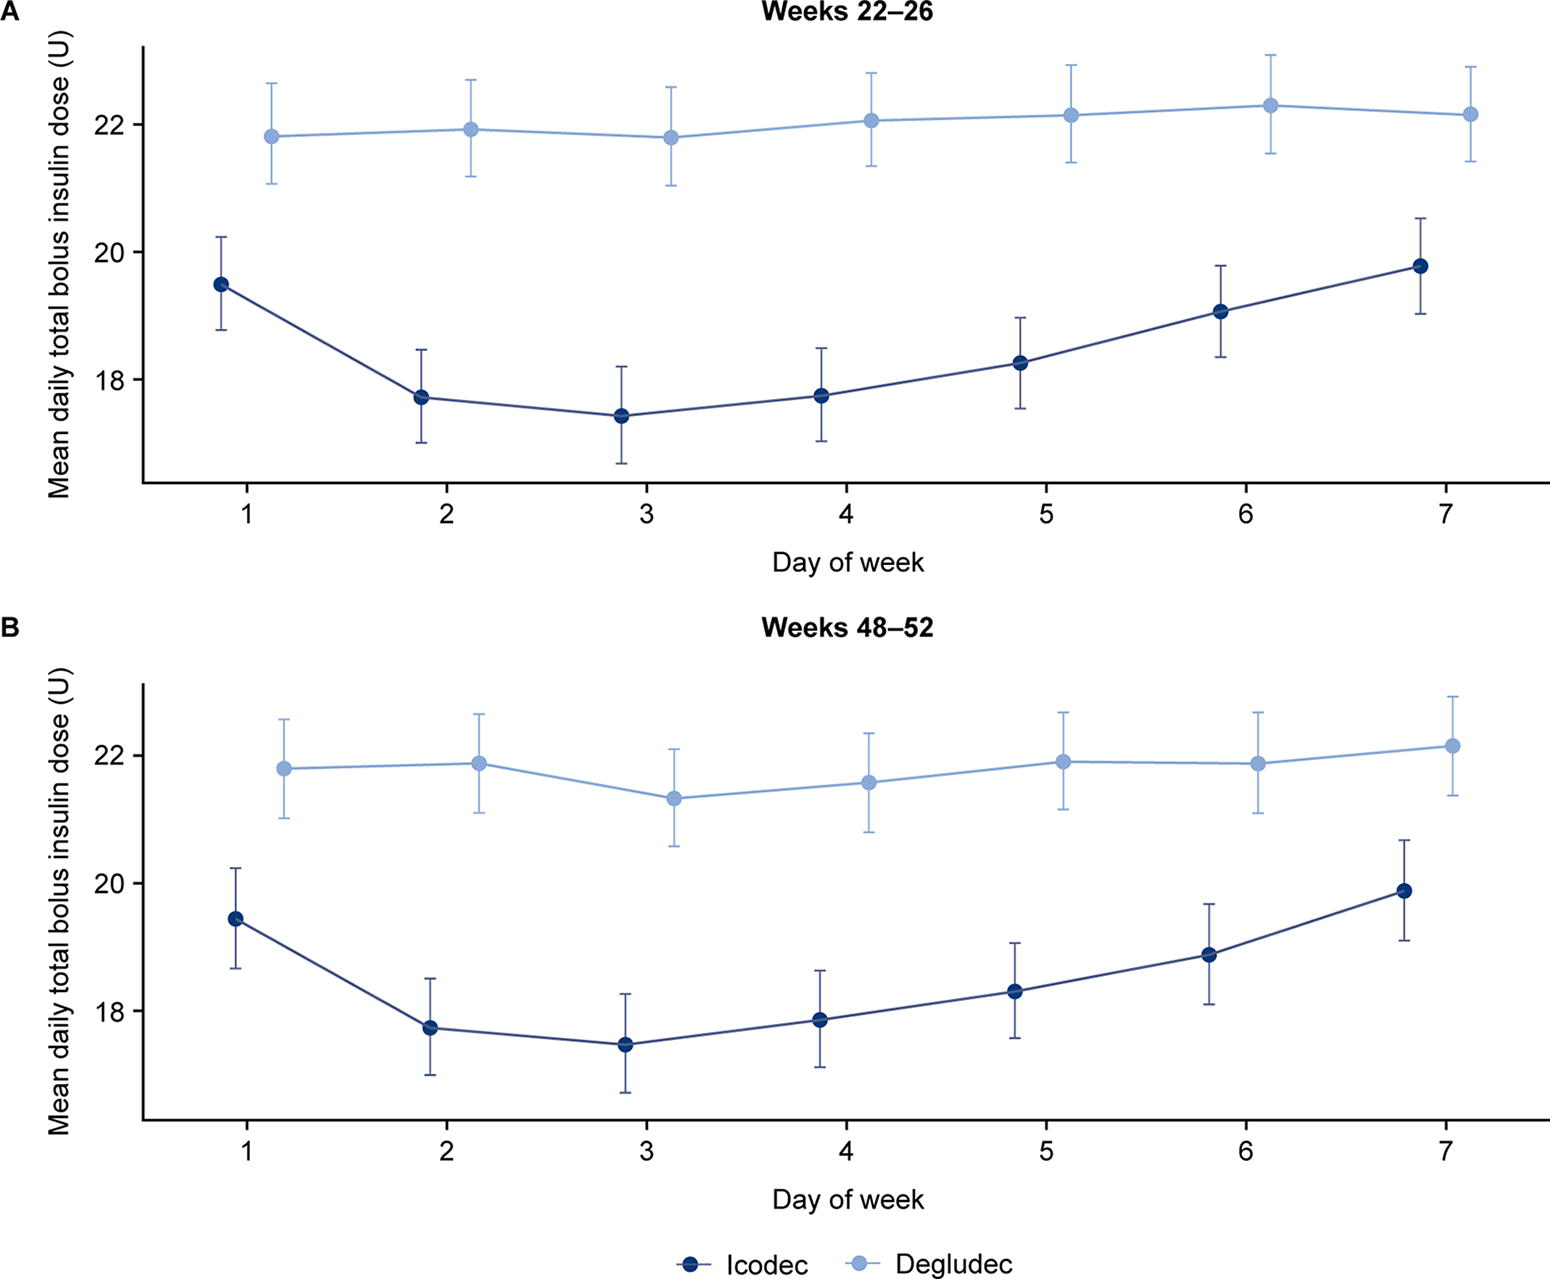
Observed mean daily total bolus insulin dose by treatment day during
CGM-based hypoglycemia duration
From baseline to week 26, the median (interquartile range [IQR]) duration of CGM-based hypoglycemic episodes (IG <3.9 mmol/L [<70 mg/dL] for ≥15 consecutive min [i.e., combined level 1 and level 2]) was 35 (20, 55) min with icodec and 30 (20, 55) min with degludec (Fig. 3A). During the same period, the median (IQR) duration of CGM-based periods below 3.0 mmol/L (<54 mg/dL) was 25 (20, 45) min for both icodec and degludec (Fig. 3B). When evaluated over 57 weeks, the median (IQR) duration of CGM-based hypoglycemic episodes (IG <3.9 mmol/L [<70 mg/dL] for ≥15 consecutive min [combined level 1 and level 2]) was 35 (20, 55) min with both icodec and degludec (Fig. 3C). The median (IQR) duration of CGM-based periods below 3.0 mmol/L (<54 mg/dL) was 25 (20, 45) min for both icodec and degludec (Fig. 3D). The cumulative percentage of duration of CGM-based hypoglycemia was similar between treatment arms (Supplementary Fig. S5). The median duration of CGM-based hypoglycemic episodes by treatment day remained generally stable in both treatment arms during both time periods (Supplementary Fig. S6).
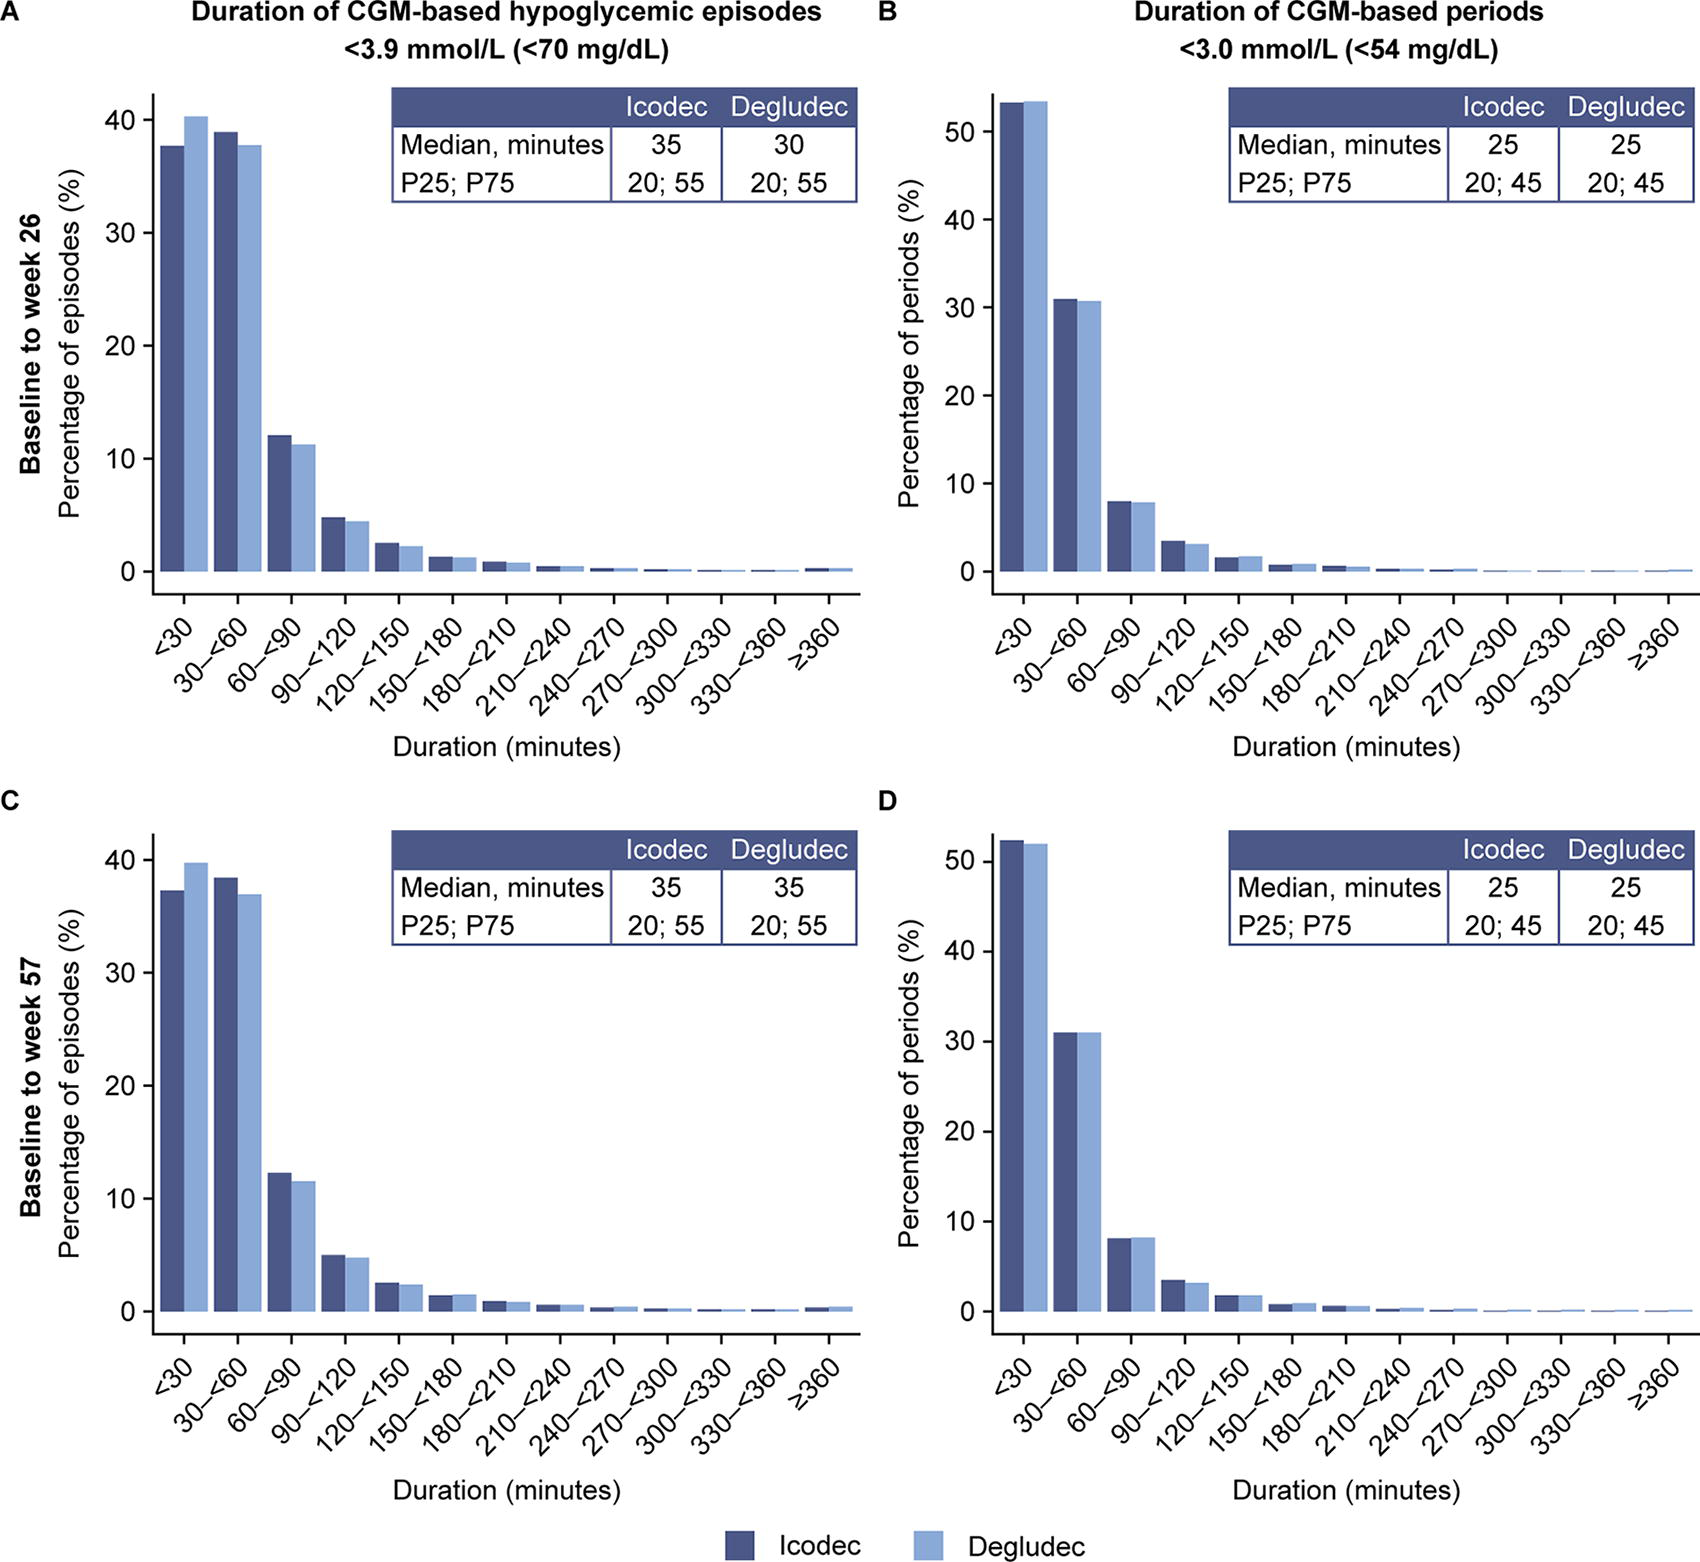
Duration of CGM-based hypoglycemic episodes (combined level 1 and level 2) and CGM-based periods <3.0 mmol/L (<54 mg/dL) from baseline to
Discussion
In this post hoc evaluation of CGM data from ONWARDS 6 participants, the ERR (icodec/degludec) for CGM-based hypoglycemic episodes was lower than that estimated from SMBG data, but still favoring degludec. Treatment with icodec was associated with variations in CGM metrics by treatment day. The percentage of TIR was highest on days 2–4 after icodec injection; this was accompanied by a concomitant decrease in TAR and an increase in TBR, highlighting the expected glucose-lowering effect of icodec based on its PD profile in type 1 diabetes. From baseline to weeks 26 and 57, duration of CGM-based hypoglycemic episodes (combined level 1 and level 2) and CGM-based periods below 3.0 mmol/L (<54 mg/dL) was comparable for icodec and degludec.
As expected, owing to the differences in the frequency of monitoring and methods of data collection, the rate of overall CGM-based hypoglycemic episodes reported in previous publications was higher than those based on SMBG values.11,12 In the InRange study, post hoc analysis of blinded CGM-based hypoglycemia data found that CGM captured approximately 2–6-fold higher rates of hypoglycemic events than SMBG during the same period, with the greatest disparity being between nocturnal events, highlighting the benefit of using CGM to capture hypoglycemia data. 11 In ONWARDS 6, from baseline to weeks 26 and 57, the ERR (icodec/degludec) for CGM-based clinically significant hypoglycemic episodes was lower than that estimated from SMBG data, suggesting that there may have been some overreporting of SMBG-based hypoglycemic episodes in the icodec arm compared with the degludec arm. This overreporting could be due to the open-label nature of the trial design, because these insulin-experienced participants may have been more cautious about initiating a once-weekly basal insulin and, consequently, more vigilant in testing for hypoglycemia. All hypoglycemia results favored degludec. Similar findings were reported for nocturnal hypoglycemia.
In the QWINT-5 trial, which compared efsitora alfa and degludec in individuals with type 1 diabetes, statistically significantly higher rates of SMBG-based combined clinically significant or severe hypoglycemia were reported in the efsitora alfa arm than the degludec arm (14.03 vs. 11.59 episodes per person-year of exposure; ERR [95% CI] = 1.21 [1.04–1.41], P = 0.016) over 52 weeks; the highest rates were observed during the first 12 weeks of treatment. 8 In ONWARDS 6, the incidence of severe hypoglycemia was similar between treatment arms. 7 However, in QWINT-5, the incidence of severe hypoglycemia was higher for efsitora alfa than for degludec when evaluated over 26 weeks (8% vs. 3%, respectively) or 52 weeks (10% vs. 3%, respectively). Rates of severe hypoglycemia from baseline to weeks 26 (ERR [95% CI] = 3.23 [1.42–7.38]; P = 0.0052) and 52 (ERR [95% CI] = 3.44 [1.64–7.19]; P = 0.0011) were statistically significantly higher for efsitora alfa than for degludec. 8 Nocturnal combined clinically significant and severe hypoglycemia rates were similar with efsitora alfa and degludec treatment. 8
A PK/PD trial in type 1 diabetes showed that icodec exposure at steady state covered the full weekly dosing interval, with the proportion of PD effect of icodec per day ranging from 8.4% to 19.6% of the total effect across 1 week. 5 The largest daily effect (19.6% of the full weekly effect) occurred on day 2, whereas the smallest effect (8.4% of the full weekly effect) occurred on day 7. The data presented here align with the previously published PD weekly profile of icodec in type 1 diabetes, highlighting that the PD curve for the effect of icodec was not uniform across the week but instead demonstrated a peak on days 2–4 (shown by the lower mean prebreakfast SMBG and higher TIR) of the 7-day cycle before gradually declining toward day 7.
In alignment with these findings, the mean daily total bolus insulin dose was lower on days 2–4 after icodec injection (approximately 2 U lower than the rest of the week), when the glucose-lowering effect of icodec was highest. This could be explained by the weekly adjustment of aspart dose based on a prespecified titration algorithm per protocol. Before trial initiation, it was not anticipated that further dose adjustments would be required, and throughout the trial it is likely that neither participants nor investigators were aware of any substantial differences by treatment day. Overall, the difference on days 2–4 is lower than what could be expected from the PD profile of icodec in type 1 diabetes.
From baseline to weeks 26 and 57, the median duration of overall CGM-based hypoglycemic episodes (combined level 1 and level 2) was 35 min or less and was comparable between icodec and degludec. When evaluated over 57 weeks, most overall CGM-based hypoglycemic episodes (93% in both the icodec and degludec arms) had a duration of less than 120 min (the consensus definition of extended hypoglycemia). 2 Taken together, these data suggest that the long duration of action for icodec did not increase hypoglycemia duration. Similar findings have been reported for efsitora alfa. 8 This study has several strengths. First, the design of ONWARDS 6 enabled the collection of long-term CGM data for icodec in individuals with type 1 diabetes. Importantly, these data provide detailed insights on how icodec affects glycemic control by treatment day after icodec injection. Second, the use of CGM data to examine hypoglycemia is not affected by participant bias.
There are also some limitations that should be considered. This is a post hoc evaluation, and the analyses reported were not prespecified. The participants selected for inclusion in ONWARDS 6 had a relatively low baseline HbA1c (mean: 60 mmol/mol [7.6%]), and they were expected to have good experience of self-management with daily basal insulin, which may affect the generalizability of the results to the wider population with type 1 diabetes. Furthermore, the use of open CGM data may have affected the participants’ bolus-dosing behavior and reported SMBG-based hypoglycemia rates during the trial. In addition, there are no data available on which of the preset alarm settings were used by participants on their CGM device or the number of alerts for high- or low-glucose levels throughout the trial. Finally, there is no information available on participants’ carbohydrate intake in either arm, limiting the interpretation of how participants reacted to hypoglycemia; however, the reported management of severe hypoglycemic episodes did not differ between arms. 7
Once-weekly icodec could potentially be an attractive alternative for people with type 1 diabetes who struggle to maintain adherence to daily basal insulin injections, leading to better adherence and, thereby, better glycemic control and reduced risk of diabetic ketoacidosis. However, further real-world studies are needed to explore this hypothesis directly.7,13 A once-weekly basal insulin may also be beneficial for individuals with type 1 diabetes who need third-party assistance to administer their injections, those who prefer fewer injections, or individuals with latent autoimmune diabetes in adults (slowly evolving immune-related diabetes). To counter the PD curve for the effect of icodec in people with type 1 diabetes, it may be relevant to reduce bolus insulin doses on days 2–4 after icodec injection.
Conclusions
In this post hoc evaluation of ONWARDS 6, although rates of overall CGM-based clinically significant hypoglycemia were higher with icodec than with degludec, a lower ERR (icodec/degludec) of clinically significant (level 2) hypoglycemic episodes was reported when based on CGM data rather than on SMBG data. Treatment with once-weekly icodec was associated with differences in CGM metrics, mean prebreakfast SMBG, and mean daily total bolus insulin dose by treatment day after icodec injection during weeks 22–26 and 48–52, with the greatest glucose-lowering effect observed on days 2–4 after icodec injection. The duration of CGM-based hypoglycemic episodes (combined level 1 and level 2) and CGM-based periods below 3.0 mmol/L (<54 mg/dL) with icodec was comparable to that with degludec. The data presented here could be useful to both physicians and individuals with type 1 diabetes when considering switching from once-daily basal insulin to once-weekly icodec treatment.
Authors’ Contributions
All authors provided substantial contributions to the conception and design of the study or the interpretation of data. All authors contributed to the review and revision of the article and approved the final version. D.R.-J. is the guarantor of this work and, as such, had full access to all the data in the study and takes responsibility for the integrity of the data and the accuracy of the data analysis.
Footnotes
Acknowledgment
Medical writing support was provided by Jen Geatrell, PhD of Oxford PharmaGenesis, Oxford, UK, funded by Novo Nordisk A/S.
Author Disclosure Statement
T.D. has received speaker fees and research support from or has consulted for Abbott, AstraZeneca, Boehringer Ingelheim, Dexcom, Eli Lilly, Medtronic, Novo Nordisk, Provention Bio, Roche, Sanofi, and Vertex Pharmaceuticals and is a shareholder of DreaMed Ltd. S.E., M.I.S.K., and S.K.W. are employees of Novo Nordisk and hold stock in Novo Nordisk. C.I. has provided advisory board services for Abbott, Ascensia, Menarini, Novo Nordisk, Roche Diabetes Care Italy, and Senseonics and has received speaker fees from Abbott, Ascensia, Boehringer Ingelheim, Eli Lilly, and Novo Nordisk. D.C.K. has acted as a consultant for Afon Technology, Atropos Health, embecta, GlucoTrack, Lifecare, Nevro, Novo Nordisk, and Thirdwayv. C.M. serves or has served on the advisory panel for ActoBio Therapeutics, AstraZeneca, Avotres, Boehringer Ingelheim, Eli Lilly, Imcyse, Insulet, Medtronic, Merck Sharp & Dohme, Novartis, Novo Nordisk, Pfizer, Roche, Sanofi, and Vertex Pharmaceuticals; financial compensation for these activities has been received by KU Leuven (Leuven, Belgium). KU Leuven reports research support for C.M. from ActoBio Therapeutics, Imcyse, Medtronic, Novo Nordisk, and Sanofi. C.M. serves or has served on speakers’ bureaus for AstraZeneca, Boehringer Ingelheim, Eli Lilly, Novartis, Novo Nordisk, and Sanofi; financial compensation for these activities has been received by KU Leuven. D.R.-J. reports research income or advisory board honoraria from AstraZeneca, Dexcom, Lilly, Medtronic, Novartis, Novo Nordisk, and Sanofi.
Funding Information
This study was funded by Novo Nordisk A/S. Representatives of Novo Nordisk A/S were involved in the trial design and conduct; data collection, management, analysis, and interpretation; and article preparation, review, and approval. A medical writer funded by Novo Nordisk A/S assisted with drafting of the article under the direction of the authors.
Data Availability
Individual participant data will be shared in datasets in a de-identified, anonymized format. Shared data will include datasets from clinical research sponsored by Novo Nordisk and completed after 2001 for product indications approved in both the European Union and the United States. The study protocol and redacted clinical study report will be made available according to Novo Nordisk data sharing commitments. These data will be available permanently after research completion and after approval of product and product use in both the European Union and the United States (no end date). Data will be shared with bona fide researchers submitting a research proposal requesting access to data, for use as approved by the Independent Review Board (IRB) according to the IRB charter. These data can be accessed via an access request proposal form. The data will be made available on a specialized SAS data platform.
Supplemental Material
References
Supplementary Material
Please find the following supplemental material available below.
For Open Access articles published under a Creative Commons License, all supplemental material carries the same license as the article it is associated with.
For non-Open Access articles published, all supplemental material carries a non-exclusive license, and permission requests for re-use of supplemental material or any part of supplemental material shall be sent directly to the copyright owner as specified in the copyright notice associated with the article.