
Abstract
The aim of this study is to evaluate the correlations of peak oxygen uptake (VO2peak) with lung mechanics, radiographic abnormalities, and quality of life (QoL) in adults with post-tuberculosis lung disease (PTLD). This is a cross-sectional study in which 60 adults with PTLD underwent a cardiopulmonary exercise test (CPET). Additionally, the following assessments were performed: spirometry, impulse oscillometry (IOS), chest X-ray (CXR), and QoL using the WHOQOL-BREF. The mean peak oxygen uptake (VO2peak) was 16.1 ± 6.8 ml/kg/min. There were positive correlations between VO2peak and several parameters, including height, physical–WHOQOL-BREF, and forced vital capacity (FVC). There were negative correlations between VO2peak and several parameters, including age, heterogeneity of resistance between 5 and 20 Hz, frequency response (Fres), and reactance-area. In IOS, patients with small airway disease (SAD) had a lower VO2peak. Regarding CXR, only cavitation and nodular opacities were associated with a lower VO2peak. In multivariate analysis, FVC, age, male sex, and Fres explained 65.2% of the variability in VO2peak. In conclusion, there is a relationship between VO2peak and lung mechanics in patients with PTLD. In these patients, IOS is able to detect more pulmonary mechanical alterations than spirometry, including those reflecting SAD. Thus, the use of both CPET and IOS may aid in the monitoring of patients with PTLD.
Introduction
Post-tuberculosis lung disease (PTLD) is emerging as a disease of great interest due to increased tuberculosis (TB) survival rates driven by advances in anti-TB therapy and the expansion of public health systems.1,2 As the number of TB survivors rises, the long-term repercussions have garnered greater attention due to their profound clinical and socioeconomic impacts. 2 In 2020, it was estimated that there were 155 million TB survivors still alive worldwide,3 and the prevalence of PTLD is estimated to range from 18% to 87%. 4 The estimated disability-adjusted life-years (DALYs) is 12.1, with 28% covering 15 or more years after the initial TB episode. 5 Furthermore, PTLD patients, even after successful treatment, have a 3.76 times higher all-cause mortality rate compared to the general population. 6 The variability in PTLD presentation depends on several factors, including the severity of the initial infection, the extent of lung damage, the effectiveness of therapy, and the presence of comorbidities.1,2,7
The extent of lung damage in PTLD is vast and depends on the individual’s immune response, which may vary due to genetic differences and external environmental factors such as smoking, pollution, and concomitant infections. 8 About 96% of patients present with residual lung damage on chest X-ray (CXR) after anti-TB chemotherapy. 9 A major obstacle to understanding PTLD has been its heterogeneity, as the spectrum of radiological manifestations ranges from tracheobronchial stenosis to bronchiectasis, nodular opacities, pulmonary fibrosis, cavitation, pleural involvement, and small airway dysfunction (SAD).2,7,10 One of the main imaging findings in PTLD is bronchiectasis, which may also develop secondary to the destruction of adjacent parenchyma and fibrosis. 11 Although most cavities heal and close after anti-TB chemotherapy, some persist beyond treatment and may undergo secondary colonization by pathogens such as Aspergillus fumigatus. 7
Residual lung damage following pulmonary TB (PTB) treatment contributes to pulmonary function decline. The heterogeneity of lung damage in PTLD can manifest as either obstructive or restrictive patterns, 1 and 10% of patients lose more than half of their lung function. 12 These residual damages can be detected through spirometry, which is a useful tool for measuring lung function. 13 However, since spirometry depends on patient effort and mental tenacity, it underestimates the extent of lung damage when compared to other traditional pulmonary function tests (PFTs), such as body plethysmography and diffusion capacity for carbon monoxide (DLco) measurement. 14 Additionally, spirometry is unable to reliably assess SAD, which appears to be common in these patients.2,15 In this sense, impulse oscillometry (IOS) has proven to be a sensitive tool for assessing small airway function in various pulmonary conditions, including COPD, by employing low-frequency waves to measure small airway resistance. 16
In patients with PTLD, not only are persistent respiratory symptoms common, but also a reduction in exercise capacity. 17 In this context, the cardiopulmonary exercise test (CPET) is considered the gold standard for assessing cardiorespiratory fitness (CRF), providing a comprehensive assessment of the integrative responses to exercise. 18 Using CPET in PTLD, a recent study demonstrated weak correlations between peak oxygen uptake (VO2peak) and traditional PFTs, including spirometry, body plethysmography, and DLco measurement. 19 However, these authors did not assess SAD using IOS, and SAD may be a contributor to exercise performance in patients with PTLD, although it has never been evaluated in this patient population. It is likely that the relationship between pathophysiology and predictors of exercise capacity in PTLD is more complex than previously thought, possibly driven by both the multicompartmental involvement of lung destruction during PTB and the inconsistency in the presentation of PTLD. 19
PTLD can have a profound impact on the quality of life (QoL) of affected individuals, impairing lung function and reducing exercise capacity. 7 Although traditional PFTs—particularly spirometry—are commonly used as diagnostic tools to assess respiratory impairment after PTB treatment, they fail to capture the complex spectrum of PTLD. 20 Furthermore, the prevalence of radiological findings in PTLD is highly variable, and the relationship between radiological findings and functional impairment has not been well studied. 20 Many studies assessing PTLD burden have used traditional PFTs as surrogate measures of exercise capacity, without considering oxygen consumption and SAD.1,13,14 We hypothesized that there is a relationship between peak oxygen uptake (VO2peak), SAD, and structural damage in PTLD. Thus, this study aimed to evaluate the correlations between oxygen consumption during exercise and resting lung mechanics, radiographic abnormalities, and QoL in adults with PTLD.
Materials and methods
Participants
Between March and December 2024, we conducted a cross-sectional study with patients aged ≥18 years diagnosed with PTLD at the Piquet Carneiro University Policlinic of the State University of Rio de Janeiro, Rio de Janeiro, Brazil. Since our institution has a dedicated PTLD outpatient clinic, these patients were approached sequentially as they were seen and invited to participate in the study. We defined PTLD as a chronic respiratory abnormality, with or without symptoms, attributed at least in part to previous pulmonary TB. 21 In this study, we defined pulmonary sequelae as any abnormalities detected in one or more of the following assessments: persistent clinical symptoms, CXR, and spirometry. 22 Patients who had completed PTB treatment within the past 3 years and who had been treated for drug-susceptible PTB with bacteriological cure were included. We applied the following exclusion criteria: the presence of pulmonary comorbidities unrelated to PTLD; any absolute contraindications to CPET (acute myocardial infarction within 3–5 days, unstable angina, uncontrolled arrhythmia, syncope, active endocarditis, acute myocarditis or pericarditis, severe aortic stenosis, uncontrolled heart failure, suspected aortic aneurysm, and arterial desaturation at rest on room air <85%) 23 ; and any inability to perform CPET. The Research Ethics Committee of the State University of Rio de Janeiro, Rio de Janeiro, Brazil, approved the protocol under CAAE-70493823.5.0000.5259, and all patients signed the consent form.
Instruments and measurements
Measurements were conducted in the following order: QoL assessment using the World Health Organization Quality of Life (WHOQOL-BREF) questionnaire, assessment of dyspnea severity using the modified Medical Research Council scale (mMRC), assessment of pulmonary function starting with IOS followed by spirometry and finally, the CPET. In addition, the patients were asked to bring their most recent CXR that had been taken within the previous 3 months, and 54 of them did so. The CXRs were read by a pulmonologist (AJL, with 30 years of experience in thoracic radiology). The median time between CXRs and completion of TB treatment was 22 (19–24) months, while the mean time between CXRs and the date of the research visit was 62 ± 11 days.
The WHOQOL-BREF is a self-administered questionnaire consisting of 26 questions divided into four domains: physical, psychological, social relationships, and environment. A score can be obtained for each domain. All scores follow an ascending and positive scale, where higher scores indicate greater QoL. On a 0–100 scale, 0 represents an extremely poor QoL, while 100 denotes an exceptionally good QoL. 24
The mMRC dyspnea scale consists of five items, and participants select the one that best represents how dyspnea limits their activities of daily living. Participants report their subjective degree of dyspnea by choosing a value from 0 to 4, with higher values indicating more intense dyspnea. The mMRC dyspnea scale has demonstrated satisfactory reliability and validity. 25
To assess SAD, we performed IOS using the Quark i2m (Cosmed, Rome, Italy) device, following previous recommendations. 26 We assessed the following resistive and reactive parameters: respiratory system resistance (Rrs) at 5 Hz (R5) and 20 Hz (R20); mean resistance between 5 and 20 Hz (Rm); heterogeneity of resistance between 5 and 20 Hz (R5–R20); frequency response (Fres); respiratory system reactance (Xrs) at 5 Hz (X5) and 20 Hz (X20); and reactance area (Ax). Abnormal values were defined as Fres >12 Hz and Ax ≥8.66 cm H2O/L/s.27,28 We performed spirometry with a Vitatrace VT 130 SL device (Codax Ltda, Rio de Janeiro, Brazil), following previous standardizations. 29 The Brazilian predicted equations were used to interpret the spirometry. 30 In the spirometry test, a restrictive pattern was suggested by a forced vital capacity (FVC) < 80% predicted (%pred), while an obstructive pattern was defined by a forced expiratory volume in one second (FEV1)/FVC <70%. 31
CPET was conducted according to prior recommendations 16 using a breath-by-breath system on a cycle ergometer connected to the FitMate™ (Cosmed, Rome, Italy) and an ergometer bicycle (Ergoselect 4 SN, Ergoline GmbH, Bitz, Germany). The FitMate™ employs a new sampling technology using a representative small sample of the expired volume in a miniaturized dynamic mixing chamber. This device uses a turbine flowmeter to measure ventilation and a galvanic fuel cell oxygen sensor to analyze the fraction of expired oxygen. The FitMate™ is not equipped with a CO2 analyzer; instead, it has a software that ramps up the respiratory exchange ratio between 0.8 and 1.2 based on increases in heart rate (HR). 32 Participants pedaled at a rate of 55–65 revolutions per minute (RPM) and the test was stopped if the cadence fell below 40 rpm; the workload was increased by 10 W/min until maximum tolerance was reached. VO2peak was considered the highest VO2 volume averaged over a 20–30 s period achieved at presumed maximal effort. 33 The exercise was terminated when participants developed marked dyspnea (Modified Borg scale between 9 and 10) or muscle fatigue and reached exhaustion. The following criteria were used to establish a maximum effort: maximum HR >90% of age predicted (220 - age) or a plateauing of VO2. 34
Statistical analysis
The normality of data distribution was verified using the Shapiro–Wilk test. The criterion for determining significance was the 5% level. Statistical analysis was performed using the SPSS software, version 26 (IBM Corporation, Armonk, NY, USA). The association between VO2peak and numerical variables was analyzed using Spearman’s correlation coefficient. The values were interpreted according to the following cut-off points: <0.10 = insignificant correlation; 0.10–0.39 = weak correlation; 0.40–0.69 = moderate correlation; 0.70–0.89 = strong correlation; and 0.90–1.00 = very strong correlation. 35 The association between VO2peak and categorical variables was analyzed using the Student’s t-test for independent samples or one-way ANOVA. Tukey’s multiple comparison test was applied to identify which categories differed significantly from each other. The association between smoking and categorical variables was analyzed using the Fisher’s exact test. We employed multiple linear regression (MLR) using the stepwise forward selection method to identify independent variables that explained the variability of VO2peak.
To provide context for interpreting the null findings, a post hoc power analysis was performed using G*Power 3.1.9.7 software based on the actual sample size (n = 60) and the observed correlations between the main outcome (VO2peak) and the other studied variables. Based on a priori type-I error α = 0.05 (two-tailed), a complete-case analysis showed that the observed significant effects were detected with a power ranging from 99 to 64%, showing the adequacy of the studied sample size to obtain significant results. 36
Results
Anthropometric data, clinical characteristics, lifestyle, comorbidities, degree of dyspnea, and quality of life in the total sample (n = 60).
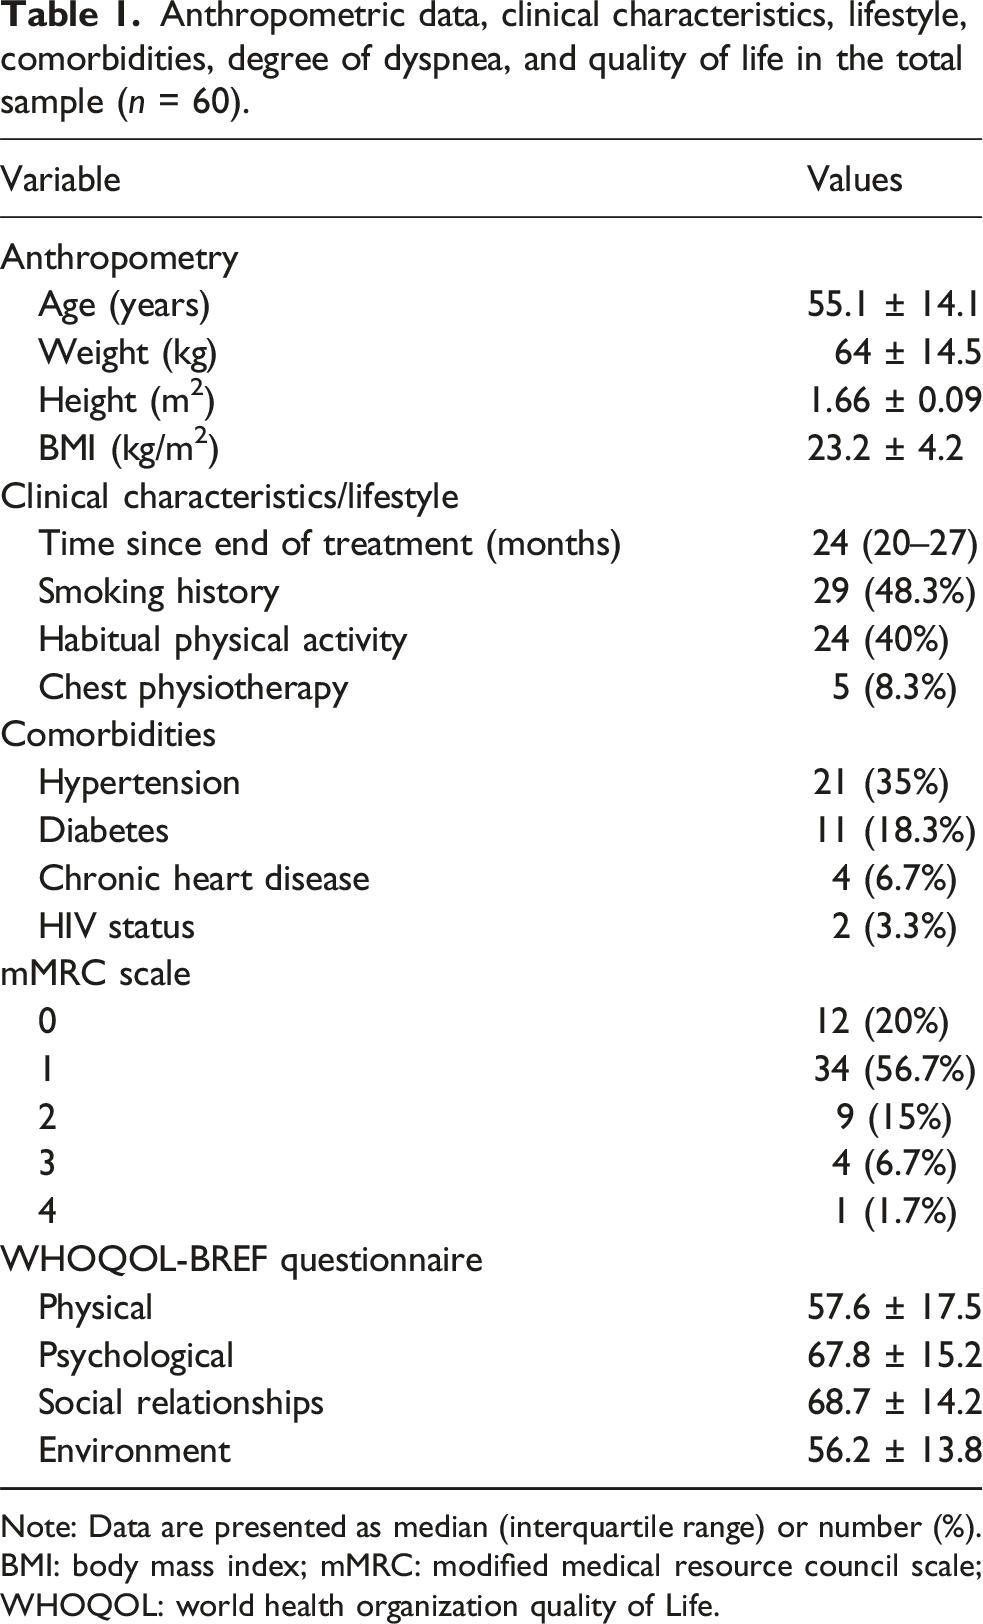
Note: Data are presented as median (interquartile range) or number (%).
BMI: body mass index; mMRC: modified medical resource council scale; WHOQOL: world health organization quality of Life.
Pulmonary function, radiographic abnormalities, and cardiopulmonary performance to exercise in the total sample.

Note: Data are presented as median (interquartile range) or number (%).
FVC: forced vital capacity; FEV1: forced expiratory volume in the 1st sec; FEF25–75%: forced expiratory flow during the middle half of the FVC maneuver; Rm: mean resistance between 5 and 20 Hz; R5: respiratory system resistance at 5 Hz; R20: respiratory system resistance at 20 Hz; R5-R20: heterogeneity of resistance between 5 and 20 Hz; Fres: frequency response; X5: respiratory system reactance at 5 Hz; R20: respiratory system reactance at 20 Hz; Ax: reactance-area; VO2peak: peak oxygen uptake; VEpeak: peak minute ventilation, HR: heart rate; RR: respiratory rate; FeO2: expired O2 fraction.
Spearman’s correlation coefficients between peak oxygen uptake, clinical characteristics, quality of life, and pulmonary function.

BMI: body mass index; WHOQOL: World Health Organization quality of life; FVC: forced vital capacity; FEV1: forced expiratory volume in the 1st sec; FEF25–75%: forced expiratory flow during the middle half of the FVC maneuver; Rm: mean resistance between 5 and 20 Hz; R5: respiratory system resistance at 5 Hz; R20: respiratory system resistance at 20 Hz; R5–R20: heterogeneity of resistance between 5 and 20 Hz; Fres: frequency response; X5: respiratory system reactance at 5 Hz; R20: respiratory system reactance at 20 Hz; Ax: reactance-area.

Relationships of the peak oxygen uptake (VO2peak) with forced vital capacity (FVC, r s = 0.603, p < 0.0001) (A), age (r s = −0.452, p = 0.0002) (B), and frequency response (Fres, r s = −0.675, p < 0.0001) (C).
Among participants with a history of smoking, 15 (51.7%) had an obstructive pattern and 14 (48.3%) had a non-obstructive pattern (p = 0.89). No significant difference in VO2peak was found between participants with and without a history of smoking [14.9 ± 5.8 versus 17.3 ± 7.4 ml/kg/min, p = 0.16].
Multiple linear regression for the peak oxygen uptake using clinical characteristics, quality of life, and pulmonary function.

B: regression coefficient; SEB: standard error of the regression coefficient; R: correlation coefficient; R2: determination coefficient; FVC: forced vital capacity; Fres: frequency response.
Discussion
There is still much to be discovered, as PTLD is a developing field, with few studies. The main findings of this study indicate that patients with PTLD exhibit a low VO2peak. In these patients, the lower the VO2peak, the greater the abnormalities observed in both IOS and spirometry, although IOS is able to detect more alterations in lung mechanics than spirometry. In addition, a lower VO2peak is associated with the presence of pulmonary cavitation or nodular opacities on the CXR. However, the correlation between VO2peak and QoL is weak or insignificant. To our knowledge, this is the first study to evaluate the relationship between CPET and lung mechanics using IOS, aiming to assess small airway behavior.
CRF is considered a vital sign in assessing cardiovascular health, and the gold standard for expressing CRF is the VO2peak. Using a simple, low-cost, and user-friendly cycle ergometer, we could demonstrate changes in VO2peak in adults with PTLD. Indeed, the VO2peak measured in this cohort (16.1 ± 6.8 ml/kg/min) was significantly below what is considered normal (35–50 ml/kg/min) for a sedentary adult. 19 In the Brazilian population, Dourado et al. 37 recently showed that the minimum VO2peak value for good performance is 33 ml/kg/min for men and 22 ml/kg/min for women. The mean VO2peak observed in our study was notably lower than that reported by Curry et al. 19 in PTLD patients (24.3 ± 5.3 ml/kg/min), which may be at least partially explained by the high heterogeneity of PTLD presentations. Persistent inflammation and dysregulated wound-healing responses in the lungs lead to progressive scar tissue accumulation, potentially impairing exercise capacity. 6 Recent studies indicate that a decrease in pro-inflammatory vascular cell adhesion molecule-1 and an increase in pro-fibrotic collagen 1a are associated with better exercise capacity outcomes after PTB treatment.1,38 It is worth noting that predicting work rate increments that will result in a CPET period of approximately 8 to 12 min in patients with chronic lung disease is still an open question. 39 Assuming an average increase in VO2 of 10 mL·W−1·min−1 and an assumption about the kinetic lag between the increase in exercise intensity and the VO2 response, work rate increments should be calculated on an individual basis.18,39 Because our CPET device does not allow for incremental adjustments and our patients have a mean age >40 years, we used 10 W/min until symptom limitation based on preliminary studies. 40 It is also important to note the low median (IQR) for exercise duration in our sample, which may be at least partially due to the low performance caused by PTLD.
Regarding pulmonary function at rest, the predominant spirometric pattern in our sample was obstructive, which is in line with findings from another Brazilian cohort evaluated by Silva et al. 41 Notably, COPD is four times more common in individuals with previous PTB, and previous TB is associated with an obstructive pattern, and should be considered a potentially significant cause of obstructive diseases. 42 In fact, smoking is strongly associated with an increased risk of developing PTB, both in developing and progressing the disease. 43 However, in our sample, no association was found between a history of smoking and an obstructive pattern or worse VO2peak, suggesting that factors other than smoking influence airflow limitation (e.g., chronic residual airway narrowing, peribronchial fibrosis, or bronchial hyperresponsiveness) and worse exercise capacity in patients with PTDL (e.g., loss of parenchymal tissue).44,45 Importantly, while more than 80% of our sample showed alterations in IOS, only about 60% had alterations in spirometry, highlighting the higher accuracy of IOS and the importance of incorporating this technique into clinical practice when assessing PTLD patients. Additionally, patients with SAD diagnosed with IOS exhibited lower VO2peak when compared to those without SAD, suggesting that SAD may serve as a marker of poorer CRF in this population. Correlations between VO2peak and IOS parameters were stronger than those between VO2peak and spirometry parameters.
In the multivariate analysis, only two pulmonary function variables were included in our explanatory model for VO2peak: FVC and Fres. FVC reflects the healing process that lungs go through during and after anti-TB treatment, where structural damage leads to excessive collagen deposition. 45 Conversely, Fres—a marker of SAD corresponding to the equilibrium point where X5 crosses the horizontal frequency axis 46 —may indicate incipient obstruction in PTLD patients, driven both by inflammation and immune factors that induce small airway hyperresponsiveness. 45 Similar to our findings, Curry et al. 19 observed that, although statistically significant, the correlations between any lung function patterns — whether measured by spirometry, DLco, or body plethysmography — and VO2peak were weak. In their study, only the correlation coefficient for FVC exceeded 0.50, and their multivariable model for VO2peak had an adjusted R2 value of just 0.310. This once again highlights the importance of assessing SAD in PTLD patients, as it partially explains their CRF.
In our study, the most frequent radiological findings were bronchiectasis, nodular opacities, and pulmonary fibrosis, which is not surprising since these are described as common in PTLD patients.2,7 However, we only observed correlations between VO2peak and pulmonary cavitation, and to a lesser extent, nodular opacities. Pulmonary cavitation involves lung tissue obliteration and the formation of gas-filled cavities. 1 In general, declining pulmonary function tends to be associated with PTLD severity, as there is a significant correlation between increased cavitary volume and decreased FEV1 in PTLD patients. 47 Consistent with our findings, Singh et al. 48 reported that patients with pulmonary cavitation may be at higher risk for progressive declines in exercise capacity. It is worth noting that chest computed tomography (CT) has been shown to be much more sensitive than CXR for detecting abnormalities in patients with PTLD, although it is unlikely that access to chest CT will be available in low- and middle-income countries for routine evaluation of patients after TB treatment. 49
PTLD can have a profound impact on patients’ QoL, including physical, social, and psychological dimensions. 11 Similar to the study by Kodical et al., 50 who used the WHOQOL-BREF questionnaire on patients still undergoing treatment for TB, we observed low scores across all assessed domains, indicating impaired QoL even after completing anti-TB therapy. PTLD can isolate individuals from their communities due to the social stigma associated with TB, and disrupt social and occupational roles, leading to unemployment, financial hardship, and reduced social participation. 13 Interestingly, we observed weak or insignificant correlations between VO2peak and the domains of the WHOQOL-BREF questionnaire, which indicates that an individual’s perception of their QoL does not necessarily limit their objectively measured exercise capacity. From a practical perspective, this underscores the importance of exploring rehabilitative strategies for these patients, regardless of QoL reported in this population. Of note, the WHOQOL-BREF questionnaire has been widely used in several studies to assess the impact of TB and its treatment,50–52 as it is important to address all health domains to achieve better QoL. 50 Interestingly, we observed an association between hypertension and low VO2peak, which, although previously described, 53 has not yet been elucidated pathophysiologically, but suggests a possible benefit of blood pressure control in these individuals.
The strength of this study is that it assessed SAD using IOS and its correlation with the gold standard measure for measuring functional capacity to exertion—VO2peak. However, several limitations should be noted. First, this is a cross-sectional study and we evaluated data from a single center. This makes it difficult to generalize our results. Second, we did not use percentages of predicted values to calculate VO2peak; however, the available Brazilian equations for VO2peak used small samples from specific locations in the country,34,54 included predominantly young adults, 54 and differ from international equations, 55 perhaps due to the statistical methods used. Third, although the participants reached the limit of exercise tolerance, we used a protocol of 10 W/min for all participants, which may have influenced the VO2peak measurement and exercise time. In fact, it is recommended that a protocol be adapted to the individual characteristics of patients because of differences in age, sex, body size, lung disease, and physical activity level. 39 Fourth, we did not assess DLco or body plethysmography, which could have strengthened our results in terms of correlation with CRF. Finally, we did not assess the extent of the disease on CXR, which may have hindered the detection of correlations between radiographic abnormalities and VO2peak. Here, we highlight the scoring system proposed by Báez-Saldaña et al. 56 to measure the extent of radiographic abnormalities in patients with PTLD, although it does not take into account the impact of specific lesions caused by TB. Despite these limitations, our findings could serve as a starting point for better understanding reduced exercise capacity in PTLD patients, especially if applied in randomized controlled trials to follow up this patient population and evaluate the effects of rehabilitation.
Conclusion
Our results show that patients with PTLD present a low VO2peak. There is a relationship between VO2peak and lung mechanics. In these patients, IOS is capable of capturing more changes in lung mechanics than spirometry, including those reflecting SAD. There is a relationship between VO2peak and radiographic abnormalities, especially with pulmonary cavitation and nodular opacities. However, the relationship between VO2peak and QoL is virtually nonexistent. With this in mind, the use of both CPET and IOS can aid in the monitoring of patients with PTLD, including assessing the impact of interventions.
Footnotes
Acknowledgements
The authors would like to thank the entire team of professionals at the Department of Pulmonology at the Piquet Carneiro Policlinic, State University of Rio de Janeiro, Rio de Janeiro, Brazil.
Ethical statement
Author contributions
Conceptualization: M.P.V.L.S., A.S.D., W.C., A.P.S., A.J.L.; Data curation: P.V.L.S.P.; I.M.P.P.F.; L.S.L.; Formal analysis: M.P.V.L.S., A.J.L.; Funding acquisition: A.J.L.; Investigation: M.P.V.L.S., A.J.L.; Methodology: M.P.V.L.S., A.S.D., W.C., A.P.S., A.J.L.; Resources: M.P.V.L.S., A.J.L.; Supervision: M.P.V.L.S.; Writing – original draft: A.J.L.; Writing – review & editing: M.P.V.L.S., P.V.L.S.P.; I.M.P.P.F.; L.S.L.; A.S.D., W.C., A.P.S., A.J.L.
Funding
The authors disclosed receipt of the following financial support for the research, authorship, and/or publication of this article: This study was funded by the Conselho Nacional de Desenvolvimento Científico e Tecnológico (CNPq; Grant numbers #301967/2022-9 and #401633/2023-3), Brazil; the Fundação de Amparo à Pesquisa do Estado do Rio de Janeiro (FAPERJ; Grant number #E-26/200.929/2022), Brazil, and the Coordenação de Aperfeiçoamento de Pessoal de Nível Superior (CAPES, Finance Code 001), Brazil.
Declaration of conflicting interests
The authors declared no potential conflicts of interest with respect to the research, authorship, and/or publication of this article.
Data Availability Statement
Data will be made available on request.