
Abstract
Objective
To determine if pre-frail Chronic obstructive pulmonary disease (COPD) patients with poor and non-poor performance in the five-repetition sit-to-stand test (5-STS) had a worse prognosis for hospitalization and mortality at 2 years and for mortality at 5 years than non-frail patients.
Methods
We prospectively included patients with stable COPD, between 40 and 80 years, from a hospital in Spain. Patients were classified according their performance on the 5-STS test and level of frailty. Timing, number of hospitalizations, length of stay, and timing and rate of mortality were outcome measures. Patients were followed for 2 years for exacerbations and for 5 years for mortality. Kaplan-Meier curves and univariate and multivariate Cox proportional-hazard analyses, ANOVA tests and univariate and multivariate linear and logistic regression models were used.
Results
Of the 125 patients included, 25.6% were pre-frail with poor performance, 57% pre-frail with non-poor performance, and 17.4% non-frail with non-poor performance. Pre-frail patients with poor performance had a higher number of hospitalizations (adjusted beta: 0.49; 95% CI: 0.01–0.96), mortality rates (odds ratio: 11.33; 95% CI: 1.15–110.81), and risk at 5 years (adjusted hazard ratio: 8.77; 95% CI: 1.02–75.51) than non-frail patients. Pre-frail patients with poor performance also had worse prognoses than non-frail patients with respect to length of hospital stays (increased by 4.16 days) and timing to first hospitalization (HR: 6.01) in unadjusted models, but not when adjusted.
Conclusion
The COPD prognosis of pre-frail patients with respect to the number of exacerbations with hospitalization and the timing and rate of mortality is dependent of functional performance.
Keywords
Introduction
Chronic obstructive pulmonary disease (COPD) is a common cause of death worldwide, and its morbidity and mortality are constantly increasing. 1 COPD is a heterogeneous disease in which patients with the same forced expiratory volume in 1 s (FEV1) differ considerably in their disease characteristics.2,3 As consequence, in recent years there has been a tendency to group patients with similar attributes in clusters called phenotypes that are associated with prognosis and important clinical outcomes. 2 One of the phenotypes most studied in COPD is the physical frailty described by Fried, which determines the frailty status of the patient that according to the presence of one or more characteristics patients were classified as frail (three or more characteristics), pre-frail (one or two), and non-frail (none). 4 Several studies have shown that the prevalence of frailty among COPD patients is 20–50%, while pre-frailty prevalence is usually higher.5,6
The frailty phenotype has shown that frail patients have a worse disability outcome after rehabilitation than non-frail patients. 5 Moreover, several longitudinal studies have found that mortality among frail COPD patients was up to 4-fold higher than in non-frail patients.7–9 Similarly, Kennedy et al. recently reported that frail patients have shorter times to first hospitalization and death, and longer length of hospital stay than non-frail patients. 10 However, the prognosis of pre-frail patients was not significantly different than that of non-frail patients. 10 Thus, while the prognosis of frail patients is well known, the impact of pre-frailty remains to be verified.10,11
Some studies have suggested that pre-frail patients vary considerably in their performance of some musculoskeletal and cardiorespiratory functions, such as lower-limb strength and aerobic capacity.5,12 While impairments of these functions have shown an independent association with mortality and exacerbations in patients with COPD,13–15 their interaction with the frailty phenotype has not still been analysed. Focussing on this issue, we hypothesized that pre-frail patients could have any sub-phenotype, based on the performance of these functional measures, with a different prognosis than non-frail patients. For this, we use the 5-STS because performance in this test of functional capacity reflects both lower-limb muscle strength and aerobic capacity in COPD patients.16,17
Our main objective was to determine if pre-frail outpatients with stable COPD with poor and non-poor performance in the 5-STS have a worse prognosis for exacerbation with hospitalization and mortality at 2 years than do non-frail patients. A secondary objective was to determine if an increased follow-up time of 5 years had an effect on mortality prognosis.
Materials and methods
Participants and study design
A consecutive sample of eligible patients with stable COPD was recruited prospectively from an outpatient pulmonary service at hospital in Spain during 2014, as described in a previous cross-sectional study. 17 All study participants provided written informed consent, and the study protocol was approved by the institutional review board of the hospital, called the “Ethical Committee of Clinical Research of the General University Hospital”. While the initial protocol included a follow-up period of 2-years (approval number: EST-35/13), a subsequent version encompassed 5-years overall (approval number: EST-66/20). All methods were performed in accordance with the relevant guidelines and regulations. Inclusion criteria were a diagnosis of COPD according to the Global Initiative for COPD (GOLD) recommendations (i.e., FEV1/forced vital capacity, post-bronchodilator ratio <70%), 18 stable stage (without exacerbations in the previous 3 months), either pre-frail or non-frail, and aged 40–80 years. Exclusion criteria were unstable cardiac condition within 4 months of the start of the study, cognitive deterioration, inability to walk, and frail phenotype.
A pulmonary physician assessed their eligibility for inclusion among all patients with stable COPD that attended their follow-up visits. All patients participated in an annual follow-up program consisting of medical consultations including update of their medical treatments; none of the participants was involved in rehabilitation programs.
Measures
Patients participated in the baseline data collection and were followed up for 2 years (2014–2016) for exacerbation-related outcome measures and for 5 years (2014–2019) for mortality. At baseline, we obtained data regarding sociodemographic, clinical, and pulmonary and non-pulmonary variables, as described elsewhere. 19 We also measured frailty.
Briefly, demographic characteristics included age and sex. The clinical and pulmonary measures were history of smoking in pack-years, body mass index (calculated as mass [kg]/height [m2]), number of comorbidities (measured with a functional comorbidity index), 20 the number of severe exacerbations in the previous year (defined as an exacerbation requiring an urgent visit to the emergency department with hospital admission), grade of dyspnoea (measured using the modified British Medical Research Council [mMRC] scale 21 ), perceived health status assessed by the COPD Assessment Test (CAT categorized as ≥10 or <10, as recommended),19,22 and the FEV1 in percentage as determined by use of post-bronchodilator spirometry with a MasterScope Spirometer (version 4.6, Jaeger, Würzburg, Germany) according to the American Thoracic Society guidelines. 23
Non-pulmonary variables included quadriceps strength, short physical performance battery (SPPB) test scores, and self-reported mobility limitations. Quadriceps strength was assessed on the dominant side with a hand-held dynamometer (HHD) (Nicholas Manual Muscle Tester, model 01160; Lafayette Instrument). To measure quadriceps strength, participants stayed seated with the knee flexed 70° and a break test was performed. 24 Gait velocity and 5-STS and balance tests were assessed according to the National Institute on Aging protocol for the SPPB. 17 Velocity was reported in m/s and measured with the 4-m gait speed test; the 5-STS was reported in seconds taken to stand 5 times from a sitting position as rapidly as possible. The three SPPB sub-tests were scored from 0 to 4, with a higher score denoting better performance; the total SPPB test was scored from 0 to 12. 17 Self-reported mobility limitations were measured using a questionnaire. 25
Frailty was defined using the Fried phenotype model, 4 which is well established and has been validated in large epidemiological studies. 26 It consists of five features that reduce physiologic reserve and precipitate a state of vulnerability: unintentional weight loss, low physical activity, exhaustion, slow walking speed, and low grip strength. All cut-off points used were according to the original values of Fried 4 : unintentional weight loss equal or greater than 4.6 kg of body weight in the last year assessed by collecting information from the medical record; low physical activity was identified by a score on the Spanish Short Version of the Minnesota Leisure Time Physical Activity Questionnaire 27 in the lower quintile adjusted by sex; exhaustion was identified using two questions from the Center for Epidemiologic Studies Depression Scale (CES-D scale), 28 with a positive answer to one of the two questions; slow walking speed, assessed as a 4-m gait-speed 29 lower than the 20th percentile and adjusted for sex and height; and low grip strength was assessed using a handgrip dynamometer 30 and defined as strength below the 20th percentile, adjusted for sex and BMI. Patients meeting none of the Fried criteria were considered non-frail, those meeting 1–2 criteria were considered pre-frail, and those meeting ≥3 criteria were considered frail.
In addition, pre-frail patients as well non-frail patients were classified into another two groups: patients with poor performance and non-poor performance in the 5-STS. For this we used a time cut-off of 15.98 s, which was established in a previous study to identify patients with higher exacerbation risk at 1 year 31
Outcome measures
The outcome measures were related to exacerbations with hospitalization (time until the first hospitalization, the total number of hospitalizations, and length of stay per hospitalization) and to mortality (timing and rate of all-cause mortality at 2 and 5 years). We focused on all-cause mortality because the determination of cause of death is prone to misclassification and difficult to perform, even if centrally adjudicated. All outcome measures were collected from the patients’ electronic files.
Statistical analyses
Participants’ characteristics at baseline were summarised. Categorical variables were expressed as counts (%) and continuous variables as mean (± standard deviation) or median (interquartile range [IQR]) as appropriate. The one-way analysis of variance with Bonferroni correction applied to a post hoc pairwise comparison and chi-squared tests were used to compare these characteristics between the pre-frail and non-frail groups.
Time to death at 2 and 5 years and time to first hospitalization were modelled using Cox proportional-hazards models. First, we used unadjusted models to compare both pre-frail groups, with poor and non-poor performance, with non-frail patients. Second, we adjusted for age, sex, mMRC scale, and FEV1, as previously done, 10 and we also added other clinical/pulmonary variables that showed differences between the pre-frail groups of our sample (e.g., CAT) because they could be confounders. Kaplan-Meier curves and log-rank tests were also used for these time-to-event end points.
The total number of hospitalizations and mean of length of stay per hospitalization during 2 years were modelled using linear multivariable regression models. Differences between mortality rates were also adjusted using logistic regression models with the same covariates.
Sample size calculation was based on the rule of thumb that 15 subjects per predictor are needed for a reliable equation in multiple regression models. 22 We recruited a minimum of 105 participants, assuming a maximum of 7 predictors. All analyses were performed using the Statistical Package for the Social Sciences (SPSS) version 24.0 (IBM SPSS, Chicago, IL, USA).
Results
Participants
Participant characteristics of study population, and comparisons between groups.

ap < .05 respect pre-frail poor performance.
bp < .05 respect pre-frail non-poor performance.
cOnly 21/25 non-frail with non-poor performance patients are shown (4/25 had poor performance).
SD: standard deviation; BMI: body mass index; FEV1: forced expiratory volume in 1 s; CAT: COPD Assessment Test; mMRC: modified British Medical Research Council; IQR: interquartile range; 5-STS: five-repetition sit-to-stand test; SPPB: short physical performance battery.
Timing to first hospitalization, number of hospitalizations, and length of stay
The Kaplan-Meier plot (Figure 1) shows that the combination of pre-frailty and functional performance was associated with time to first hospitalization due to exacerbation (log-rank test, X2 = 13.3; p = .001). The cumulative percentage of pre-frail patients with poor performance increased faster over time compared with the rest of the groups, and 62% of them had at least one hospitalization at 2 years. In addition, unadjusted Cox regression showed that pre-frailty with poor performance was associated with time to hospitalization (hazard ratio [HR]: 6.01; 95% CI: 1.76–20.44; p = .004), but not when it was adjusted (aHR: 3.59; 95% CI: 0.91–14.11; p = .067). Cumulative incidence of time to first hospitalization stratified by the pre-frailty with poor and non-poor performance and non-frailty phenotype.
Associations of pre-frailty with hospitalized in this cohort during 2-years.

ap < .05 respect non-frail.
bp < .05 respect pre-frail non-poor performance.
cAdjusted: age, sex mMRC, % FEV1.
dAdjusted: age, sex mMRC, % FEV1 and CAT.
SD: standard deviation; CI: confidence interval; mMRC: modified British Medical Research Council; FEV1: forced expiratory volume in 1 s; CAT: COPD Assessment Test.
Timing and mortality rate at 2 and 5 years
At 2 years, pre-frail patients with poor performance had significantly worse survival by Kaplan-Meier survival analysis (log-rank test, X2 = 8.71; p = .013) (Figure 2). Nevertheless, the adjusted Cox regression models showed non-significant higher risk for pre-frail patients with poor performance than for non-frail patients (HR of 2.37; 95% CI: 0.17–32.36; p = .632) (see Table 3). The 2-year event rate for mortality was higher in pre-frail patients with poor performance than in non-frail participants (16.1% vs. 4.8%, respectively), but adjusted logistic regression models also showed non-significant differences (OR: 10.18; 95% CI: 0.97–105.95). Kaplan-Meier curves for time to death stratified by the pre-frailty with poor and non-poor performance and non-frailty phenotype. Associations of pre-frailty and non-frailty based physical performance with mortality in this cohort. ap < .05 respect non-frail. bAdjusted: age, sex mMRC, % FEV1. cAdjusted: age, sex mMRC, % FEV1 and CAT. CI: confidence interval; mMRC: modified British Medical Research Council FEV1: forced expiratory voume in 1 s; CAT: COPD assessment est.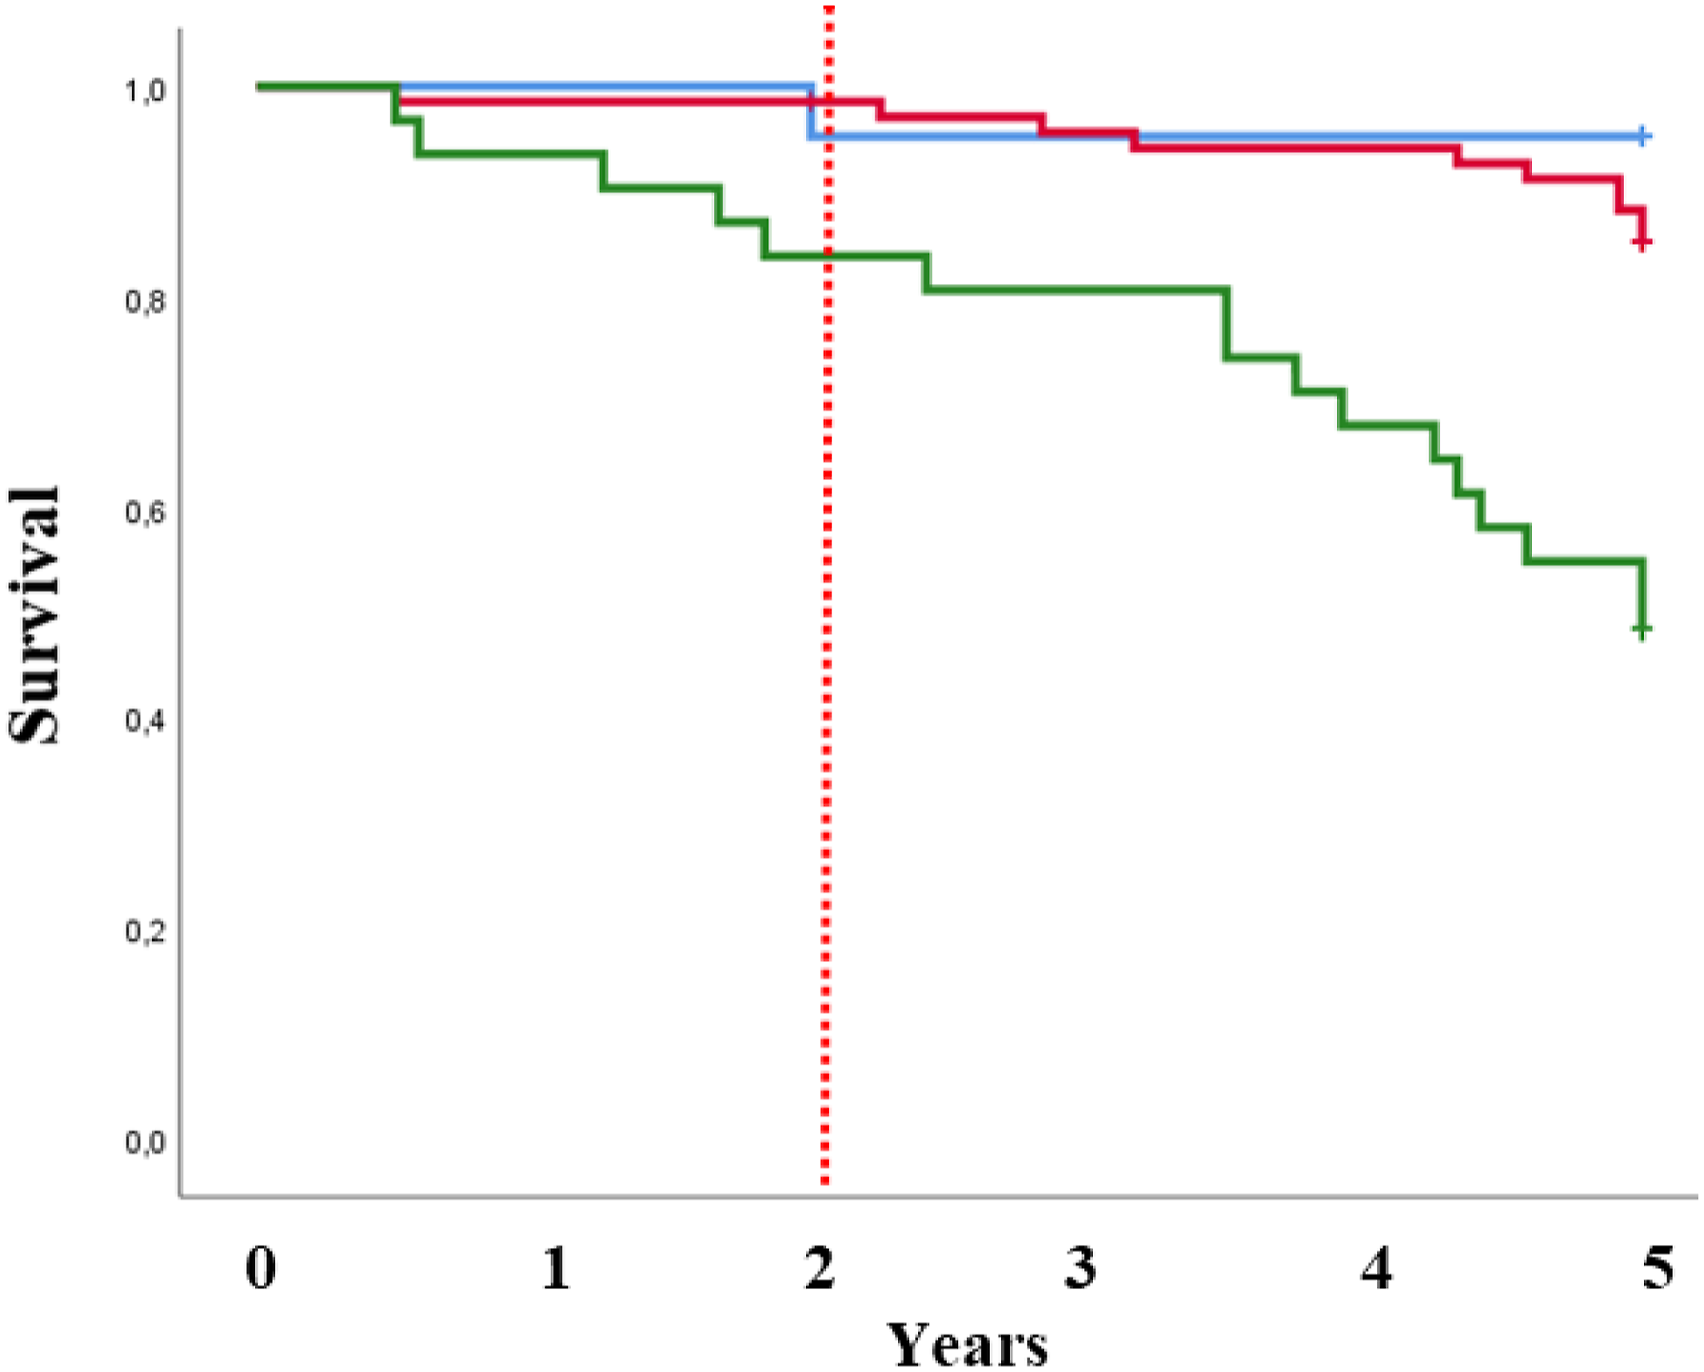

At 5 years, Kaplan-Meier survival analysis (log-rank test, X2 = 24.77; p < .001) and adjusted Cox regression models showed that pre-frail patients with poor performance had higher mortality risk than non-frail patients (aHR: 8.77; 95% CI: 1.02–75.51). The event rate for mortality of pre-frail patients with poor performance increased significantly with respect to non-frail patients (51.6% vs. 4.8%), and the ORs were statistically significant even when they were adjusted (OR: 11.33; 95% CI: 1.15–110.81). Pre-frail patients with non-poor performance and non-frail patients were not significantly different, except in their adjusted mortality rates (Figure 2).
Discussion
To our knowledge, this is the first study comparing prognoses for exacerbations with hospitalization and mortality between groups of non-frail and pre-frail patients with poor and non-poor functional performance in the 5-STS. We found that pre-frail patients with poor performance on the 5-STS had a higher number of hospitalizations during 2 years, and higher rates and mortality risk at 5 years, than non-frail patients. In contrast, the prognosis of pre-frail patients with non-poor performance did not differ from that of non-frail patients, except in their 5-year mortality rates.
Our results reveal different prognoses for the two groups within the pre-frail phenotype. This finding suggests the existence of two sub-phenotypes based on functional performance on the 5-STS. The prognostic value of poor functional performance has been widely demonstrated,13–15 but without regard to its relationship to frailty phenotypes, which we have examined in the present study. One of the preferred functional measures has been the 6-min walking test (6-MWT). For example, Morakami et al. showed that patients with poor performance in aerobic capacity as measured using the 6-MWT were more than twice as likely to experience exacerbations at 2 years than were those whose exercise capacity was preserved. 32 Despite the relevance of the 6-MWT, it is not typically measured by pulmonologists in the clinic due to time constraints, equipment, and obvious space requirements. 17 So that, in our study we have shown that a simpler and faster test, such as the 5-STS, can be used to define possible sub-phenotypes within the frailty phenotype. 33
As expected, at least one of our hypotheses with respect to exacerbations was confirmed. Our results are evidence that, while pre-frail patients with poor performance clearly had a higher number of hospitalizations than non-frail patients over a 2-year follow-up, those with non-poor performance did not. These results seem reasonable since it has been recognized that skeletal muscle dysfunction is a common feature in subjects with COPD. 34 In addition, previous studies have shown that pre-frail and non-frail patients have different physical activity, and may play a significant role in morbidity and mortality.12,13,35–37 In particular, a poor performance in the 5-STS has been shown to be a predictor of re-hospitalization 31 and survival in COPD patients. 35
However, hypotheses about timing and length of stay remained to be confirmed. Despite pre-frail patients with poor performance clearly having a higher tendency to faster timing to first hospitalization and longer length of stay per hospitalization than non-frail patients, these tendencies were not statistically significant. This non-significant association could be explained by the low number of non-frail patients with any hospitalization during the 2-year follow-up.
Regarding mortality, the low number of deaths at 2 years is probably also one of the reasons that explain our finding of non-differences between pre-frail and non-frail patients. However, when we extended the follow-up time to 5 years, our study demonstrated that while pre-frail patients with poor performance clearly had faster times to hospitalization and greater mortality risk than non-frail patients, pre-frail patients with non-poor performance did not. This finding is novel and is not comparable to those of the Kennedy study, which explored only mortality at 2 years. Nevertheless, previous studies support an independent association of measures of physical performance (e.g., exercise capacity and sit-to-stand) with increased all-cause mortality risk at 5 years35,38,39 One study even found that the 5-STS test is a mortality predictor at both 2 and 5 years 35
Implications for practice and research
In recent years, various studies on COPD have focused on describing patients based on different phenotypes. 2 Recognition of such phenotypes enables clinical screening of a unique population at risk and enables personalized medical regimens. We believe that the pre-frailty phenotype based on physical performance will allow discrimination between patients who were previously grouped into a single group and whose prognosis, in terms of hospitalizations and mortality, has been shown to be different.
Assessing the pre-frailty phenotype based on physical performance will help clinicians counsel their patients in a more personalized treatment. In fact, other studies have reinforced the finding that responses to treatment vary among patients with the frailty phenotype in COPD. For example, physical rehabilitation programs produce significant improvements in exercise capacity and lower limb strength in most frail patients over 80 years of age. 40 Maddocks and his colleagues have also suggested that pulmonary rehabilitation shows greater improvement in pre-frail COPD patients than in frail patients. 5
Future research should assess whether the combination of the frailty phenotype with physical performance measured with the 5-STS could help to monitor disease progression and predict differential treatment responses to interventions. 41 In addition, further studies are needed to replicate and confirm the value of the results obtained.
Strengths and limitations
This study has two main strengths. First, we explored the prognostic value of pre-frailty and non-frailty based on physical performance, which to our knowledge has not been published previously. Second, we included an exhaustive selection of confounders to ensure comprehensive control of potential confounding.
This study also has limitations. First, because the small sample size of the group of non-frail patients with poor performance, we could not compare the prognosis of pre-frail groups with that of those non-frail patients. Second, due to the small number of deaths at 2 years, a type II error could have been made when we did not find some differences in prognosis between the two pre-frailty groups in comparison to the non-frail. Third, although we included a wide variety of potential prognostic factors to control for confounding, some important factors may have been omitted (e.g., physical activity, participation in rehabilitation programs). Finally, as our study was developed in one centre and included a small number of women, generalisations should be made with caution.
Conclusions
Chronic obstructive pulmonary disease prognosis in pre-frail patients with regard to the number of exacerbations with hospitalization and timing and mortality rates is dependent on their level of functional performance. The impact of that performance on timing to the first hospitalization and length of hospital stays remains to be verified.
Footnotes
Acknowledgements
The authors wish to thank their patients, and the personnel of the hospital unit, for their cooperation during the course of this study.
Declaration of conflicting interests
The author(s) declared no potential conflicts of interest with respect to the research, authorship, and/or publication of this article.
Funding
The author(s) disclosed receipt of the following financial support for the research, authorship, and/or publication of this article: The study was supported by FAES FARMA, S.A. The sponsors had no role in the study design, the data collection and analysis, or the manuscript preparation.
Ethics statements and Consent statement
All study participants provided written informed consent, and the study protocol was approved by the institutional review board of the hospital, called the “Ethical Committee of Clinical Research of the General University Hospital” (approval number: EST-35/13-66/20).