
Abstract
Lower respiratory tract infection is the most common cause of acute exacerbations of chronic obstructive pulmonary disease (AECOPD). The aim of the present study was to compare the accuracy of procalcitonin (PCT), C-reactive protein (CRP) and white blood cell count (WBC) as single diagnostic tests and in combination with clinical signs and symptoms to diagnose pneumonia in patients hospitalized with AECOPD. This was a prospective, single centre observational study. Patients with spirometry-confirmed COPD who were hospitalized due to AECOPD were consecutively recruited at the hospital’s Emergency Unit. Pneumonia was defined as a new pulmonary infiltrate on chest X-ray. The values of PCT, CRP and WBC were determined at admission. Receiver operating characteristic (ROC) curve analysis was used to study the accuracy of various diagnostic tests. Of the 113 included patients, 35 (31%) had pneumonia at admission. Area under the ROC curve (AUC) for PCT, CRP and WBC as a single test to distinguish between patients with and without pneumonia was 0.67 (95% CI 0.55–0.79), 0.73 (95% CI 0.63–0.84) and 0.67 (95% CI 0.55–0.79), respectively (p = 0.42 for the test of difference). The AUC for a model of clinical signs and symptoms was 0.84 (95% CI 0.76–0.92). When biomarkers were added to the clinical model, the AUCs of the combined models were not significantly different from that of the clinical model alone (p = 0.54). PCT had about the same accuracy as CRP and WBC in predicting pneumonia in patients hospitalized with AECOPD both as a single test and in combination with clinical signs and symptoms.
Introduction
Chronic obstructive pulmonary disease (COPD) is the third leading cause of death worldwide and has considerable impact on the patients’ quality of life and activities of daily living. Acute exacerbations of COPD (AECOPD) contribute to the morbidity, costs and mortality associated with COPD, 1 and AECOPD requiring hospital admission represent a significant prognostic factor for reduced survival across all stages of COPD severity. 2
Patients with COPD have an increased risk of pneumonia due to various factors. 3 –5 Previous studies have shown that 16–36% of patients admitted to hospital because of an AECOPD had findings on chest X-ray consistent with pneumonia. 6 –8 Patients diagnosed with pneumonia in addition to an AECOPD demonstrate more severe clinical and laboratory disease manifestations, increased in-hospital morbidity and worse outcome 6,7 as well as increased healthcare utilization compared to those without pneumonia. 8 Most AECOPD are diagnosed and treated on an outpatient basis without access to a chest X-ray, 9 and it may be challenging to diagnose pneumonia in patients with an ongoing AECOPD based only on clinical and laboratory findings. Hence, clinicians have sought for new biomarkers that together with clinical assessments can improve the diagnostic accuracy of pneumonia in patients with COPD. Procalcitonin (PCT) is a diagnostic marker of the presence of a bacterially induced systemic inflammatory reaction. Using PCT as a diagnostic tool may increase the ability to detect clinically relevant bacterial infections at an early stage of the disease. 10 PCT has been advocated as a marker more closely correlated with the severity of infection and organ dysfunction compared to C-reactive protein (CRP). 11
The aim of the present study was to compare the accuracy of PCT, CRP and white blood cell counts (WBC) as single diagnostic tests and in combination with clinical signs and symptoms to diagnose pneumonia in patients hospitalized with AECOPD.
Methods
Study population and design
The study was a prospective, single centre observational study conducted from May 2011 to May 2013. Inclusion criteria and the descriptive data on the 113 participants have been presented previously. 12 Patients admitted to the Department of Thoracic Medicine at Trondheim University Hospital (TUH) due to an AECOPD were consecutively recruited on arrival at the Emergency Unit (EU). The patients were examined at the EU and included in the study if they had a COPD diagnosis previously confirmed by spirometry according to the global initiative for chronic obstructive lung disease criteria 13 and a clinically confirmed AECOPD. The criteria for a COPD exacerbation were increased dyspnoea, sputum production and sputum purulence. 14 Pneumonia was defined as a new pulmonary infiltrate (PI) on chest X-ray at admission. The patients were divided into two groups based on the chest X-ray results: patients with evidence of AECOPD with PI (p-AECOPD) and patients with evidence of AECOPD without PI (np-AECOPD). Exclusion criteria were known malignant disease, bronchiectasis, chronic bacterial colonization of the airways and treatment with an immunosuppressive drug or long-term treatment with antibiotics. Patients who were not examined with a chest X-ray at admission were excluded from the study. Ethical approval for the study was obtained from the Regional Committee for Medical Health Research Ethics (REC Central). All study participants gave a written informed consent.
Clinical variables
The patients’ medical charts were reviewed for results of previously performed lung function tests in a stable phase of the disease, duration of the acute respiratory symptoms, prehospital treatment during the last 48 hours before admission, symptoms and findings during the physical examination at admission including results from chest X-ray and laboratory tests, as well as treatment during the actual hospital stay and the discharge diagnosis according to international classification of disease and related health problems-10 classification. When the authors retrospectively reviewed the patients’ medical charts, they were blinded to the biomarker results. The attending physicians were responsible for the diagnostic procedures, interpretation of laboratory analyses and decision on treatment during the patients’ in-hospital stay.
Sample collection
The standard hospital procedures were followed for collection and processing of blood for the analysis of CRP and WBC, and for microbiological surveys. Additional blood samples for PCT analysis were obtained at admission (T0) and 6 (T1), 24 (T2) and 48 (T3) hours post-admission. Serum specimens for the PCT analysis were stored at −70°C until they were analysed.
Laboratory measurements
PCT was measured on a Roche Modular E system (Roche Diagnostics GmbH, Mannheim, Germany) using an electrochemiluminescence immunoassay method with the Elecsys B.R.A.H.M.S. reagents (B.R.A.H.M.S. KryptorTM PCT; Thermo Fisher Scientific Inc, Hennigsdorf, Germany). The functional assay sensitivity (where the between-day coefficient of variation is 20%) is 0.06 μg L−1 (data from Roche). The specimens were analysed in batches on six separate days. The between-day coefficient of variation was 2.6% at 0.43 μg L−1 (data from Roche).
WBC was measured on Sysmex XE-2100 (Sysmex, Kobe, Japan). The reference limits in adults were 3.7–10.0 × 10⁹ L−1. The between-day coefficient of variation was 2.3% at 6.7 × 10⁹ L−1.
CRP was measured on a Roche Modular P system (Roche Diagnostics GmbH), with reagents from the manufacturer and from Diagnostic Systems GmbH, Holzheim, Germany. The reference limit was less than 5.0 mg L−1. The between-day coefficient of variation was 6.3% at 19 mg L−1.
All analyses were monitored using appropriate internal and external (WBC and CRP) quality control systems.
Processing of biological materials (blood cultures and sputum) was performed according to the standard hospital procedures for microbiological surveys.
Statistical analysis
Normality of the continuous variables was tested by the Kolmogorov–Smirnov test. The normally distributed continuous variables were expressed as mean ± standard deviation and skewed data were expressed as median and interquartile range. The independent samples t test was used to compare means. The independent samples median test, the Mann–Whitney U test, the Wilcoxon matched pairs test and the related samples Friedman’s two-way analysis of variance were used to compare non-normally distributed data. Categorical data were compared using the χ 2 test and Fisher’s exact test. The Spearman rank correlation coefficient (ρ) was used to determine the strength of the relationship between variables. Receiver operating characteristic (ROC) curve analysis was used to study the accuracy of the various diagnostic tests. A logistic regression model was used to find the best combination of predictive variables for pneumonia in AECOPD patients. From the model containing the variables sex, crackles on auscultation, chest pain, expiratory wheezing, prolonged expiratory time, oxygen saturation (O2 Sat), body temperature, heart rate (HR, heart beats per minute), respiratory rate (RR, breaths per minute), CRP, WBC and PCT, the variable with the poorest predictive value (the variable with highest p value) was excluded, and the process was repeated until a final model with only statistically significant variables remained. p Values less than 0.05 were considered to be statistically significant. There was an expectation of getting at least 50 people in each patient group.
Statistical analyses were performed using IBM software SPSS 22 (Chicago, Illinois, USA) and Stata (version 14.1; StataCorp LP, College Station, Texas, USA).
Data availability
Data file supporting the results reported in this article follows the manuscript.
Results
In total, 159 patients were eligible, and 113 patients met the inclusion criteria, of which 35 (31%) and 78 (69%) patients belonged to the p-AECOPD group and the np-AECOPD group, respectively (Figure 1). There were no significant differences between the two groups regarding the baseline characteristics age, lung function, proportion of current smokers, length of illness before admission, the proportion of patients who received antibiotics or prednisolone before admission, or the number of patients using inhaled corticosteroids daily. However, the proportion of males was higher in the p-AECOPD group compared to the np-AECOPD group (Table 1).

Flow chart of the study population. AECOPD: acute exacerbation of chronic obstructive pulmonary disease; p-AECOPD: AECOPD with pulmonary infiltrate on chest X-ray at admission; np-AECOPD: AECOPD without pulmonary infiltrate on chest X-ray at admission.
Baseline characteristics of patients and disease status by groups.
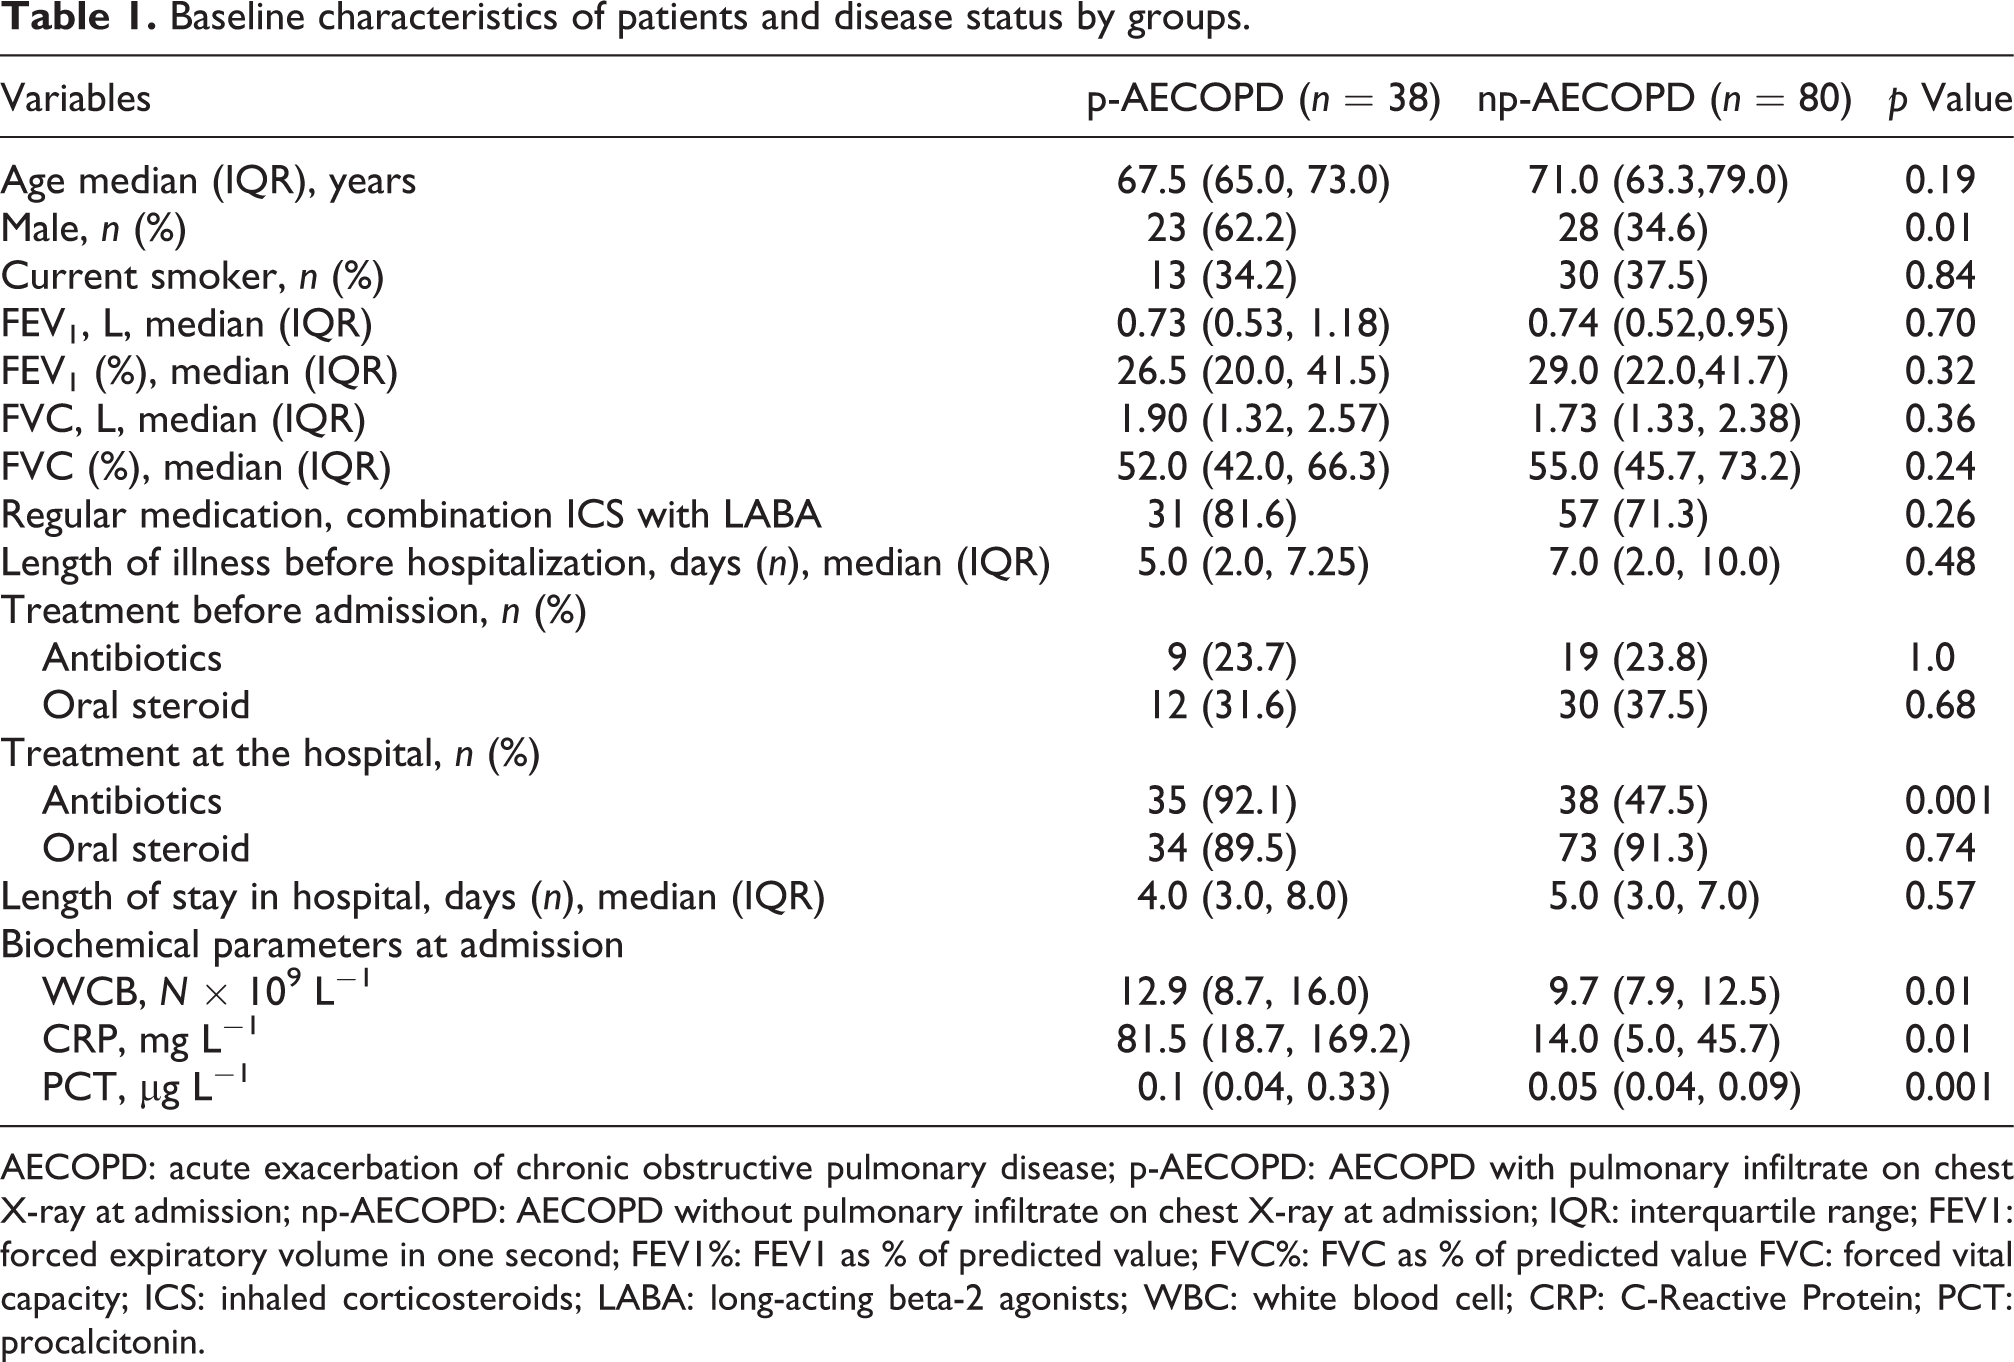
AECOPD: acute exacerbation of chronic obstructive pulmonary disease; p-AECOPD: AECOPD with pulmonary infiltrate on chest X-ray at admission; np-AECOPD: AECOPD without pulmonary infiltrate on chest X-ray at admission; IQR: interquartile range; FEV1: forced expiratory volume in one second; FEV1%: FEV1 as % of predicted value; FVC%: FVC as % of predicted value FVC: forced vital capacity; ICS: inhaled corticosteroids; LABA: long-acting beta-2 agonists; WBC: white blood cell; CRP: C-Reactive Protein; PCT: procalcitonin.
Clinical signs and symptoms
There was no statistically significant difference between the two groups with regard to dyspnoea, cough, sputum purulence, chest pain and crackles on auscultation. More patients in the p-AECOPD group had higher temperature, increased HR and lower O2 Sat, while more patients in the np-AECOPD group had expiratory wheezing and prolonged expiratory time (Table 2).
Review of symptoms and clinical findings by groups.

AECOPD: acute exacerbation of chronic obstructive pulmonary disease; p-AECOPD: AECOPD with pulmonary infiltrate on chest X-ray at admission; np-AECOPD: AECOPD without pulmonary infiltrate on chest X-ray at admission; RR: respiration rate, breaths per minute; IQR: interquartile range; HR: heart rate, beats per minute; SD: standard deviation; BT: blood pressure, mmHg.
Biochemical parameters
At admission, the median values of PCT, CRP and WBC were statistically significantly higher in patients with p-AECOPD than in those with np-AECOPD (Table 1). There was a significant variation in the biomarker levels both within the p-AECOPD and the np-AECOPD group and between the two groups (Figure 2). The median PCT values continued to increase during the first 24 hours in the p-AECOPD group compared with merely unchanged levels in the np-AECOPD group (Table 3).

Individual values of PCT, CRP and WBC in patients with and without infiltrate on chest X-ray at admission. The PCT scale is logarithmic. PCT: procalcitonin, CRP: C-reactive protein; WBC: white blood cell.
Procalcitonin values (μg L−1) during 48 hours of follow-up by groups.
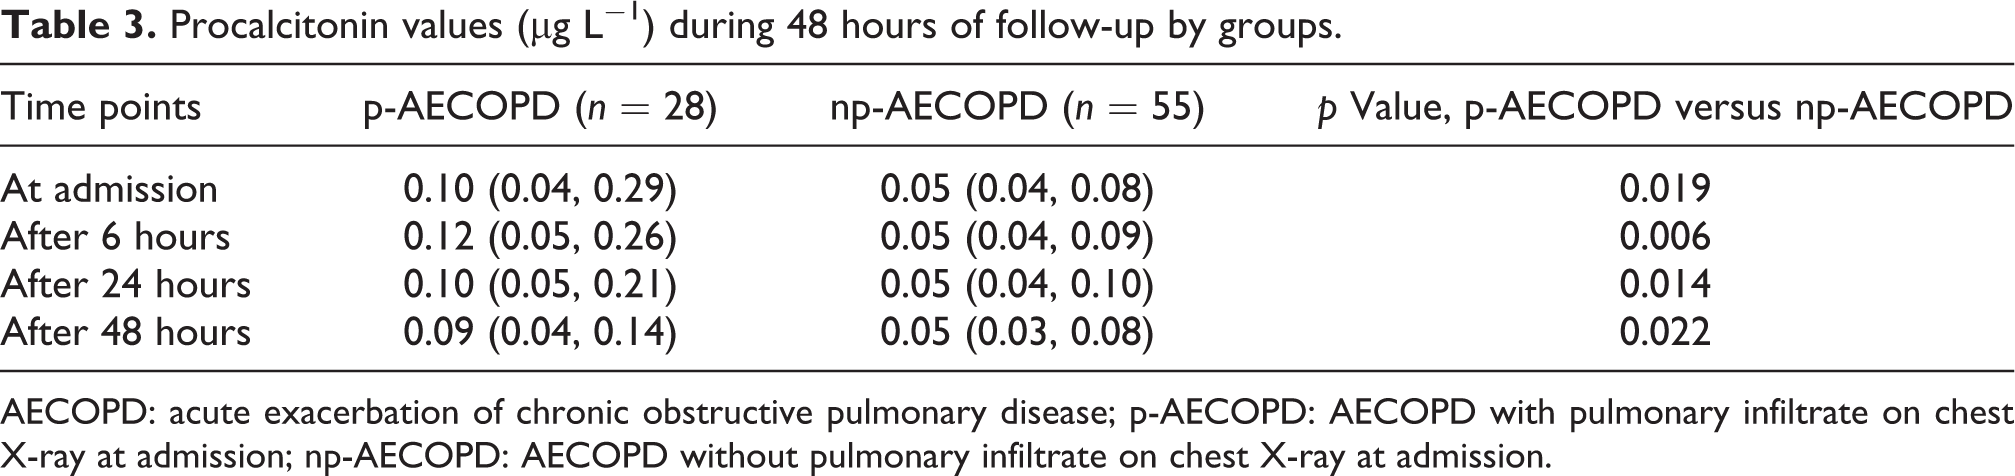
AECOPD: acute exacerbation of chronic obstructive pulmonary disease; p-AECOPD: AECOPD with pulmonary infiltrate on chest X-ray at admission; np-AECOPD: AECOPD without pulmonary infiltrate on chest X-ray at admission.
Microbiological findings and the PCT values
Blood cultures were collected from 42 patients and all tests were negative. Bacterial sputum cultures were ordered for 67 patients, and bacterial growth were found in samples from 38 (57%) patients of which only 20 (30%) samples had a clinical significance. Viruses were detected in 5 (42%) of 12 samples. Streptococcus pneumoniae urinary antigen test was positive in 3 (30%) of 10 samples. No significant associations were found between microbiological findings and PCT values or occurrence of p-AECOPD. There were two patients with extremely high PCT values in the p-AECOPD group with S. pneumoniae infection (18.13 and 100 μg L−1) at admission. PCT value change was observed in one of these patients, another patient had a PCT value of 100 μg L−1 in all four samples while the CRP values declined.
The diagnostic accuracy of the biomarkers
There was no significant difference in the diagnostic accuracy between PCT, CRP or WBC as single tests to distinguish between the np-AECOPD and the p-AECOPD groups: the area under the ROC curve (AUC) was 0.67 (95% CI 0.55–0.78) for PCT, 0.73 (95% CI 0.63–0.84) for CRP and 0.67 (95% CI 0.55–0.79) for WBC (p = 0.42 for the test of the null hypothesis that all AUCs were equal).
Sensitivity, specificity, positive and negative predictive values of CRP, PCT and WBC are given in Table 4.
Sensitivity, specificity, cut-off values and predictive values of PCT, CRP and WBC.

PCT: procalcitonin, CRP: C-reactive protein; WBC: white blood cell.
The final clinical model to distinguish between the np-AECOPD and the p-AECOPD groups included the variables male gender, expiratory wheezing on auscultation, respiratory rate, heart rate and body temperature. The AUC of that model was 0.84 (95% CI 0.76–0.92), statistically significantly increased compared to the AUC of PCT and WBC (p = 0.022 and 0.026, respectively) but not that of CRP (p = 0.084). When biomarkers were added to the clinical model, the AUC was 0.87 (95% CI 0.80–0.94) after adding PCT, 0.87 (95% CI 0.80–0.93) after adding CRP and 0.85 (95% CI 0.78–0.92) after adding WBC (Figure 3). In these combined models of clinical variables and one biomarker, the logistic regression coefficients were statistically significant for all biomarkers (p = 0.048 for PCT, p = 0.008 for CRP and p = 0.034 for WBC). However, the AUCs of the combined models were not statistically different from that of the clinical model (p = 0.54 for the test of the null hypothesis that all AUCs were equal). When adding PCT or WBC to the combined model of clinical variables and CRP, the logistic regression coefficient did not reach statistical significance, neither for PCT (p = 0.18) nor WBC (0.059).
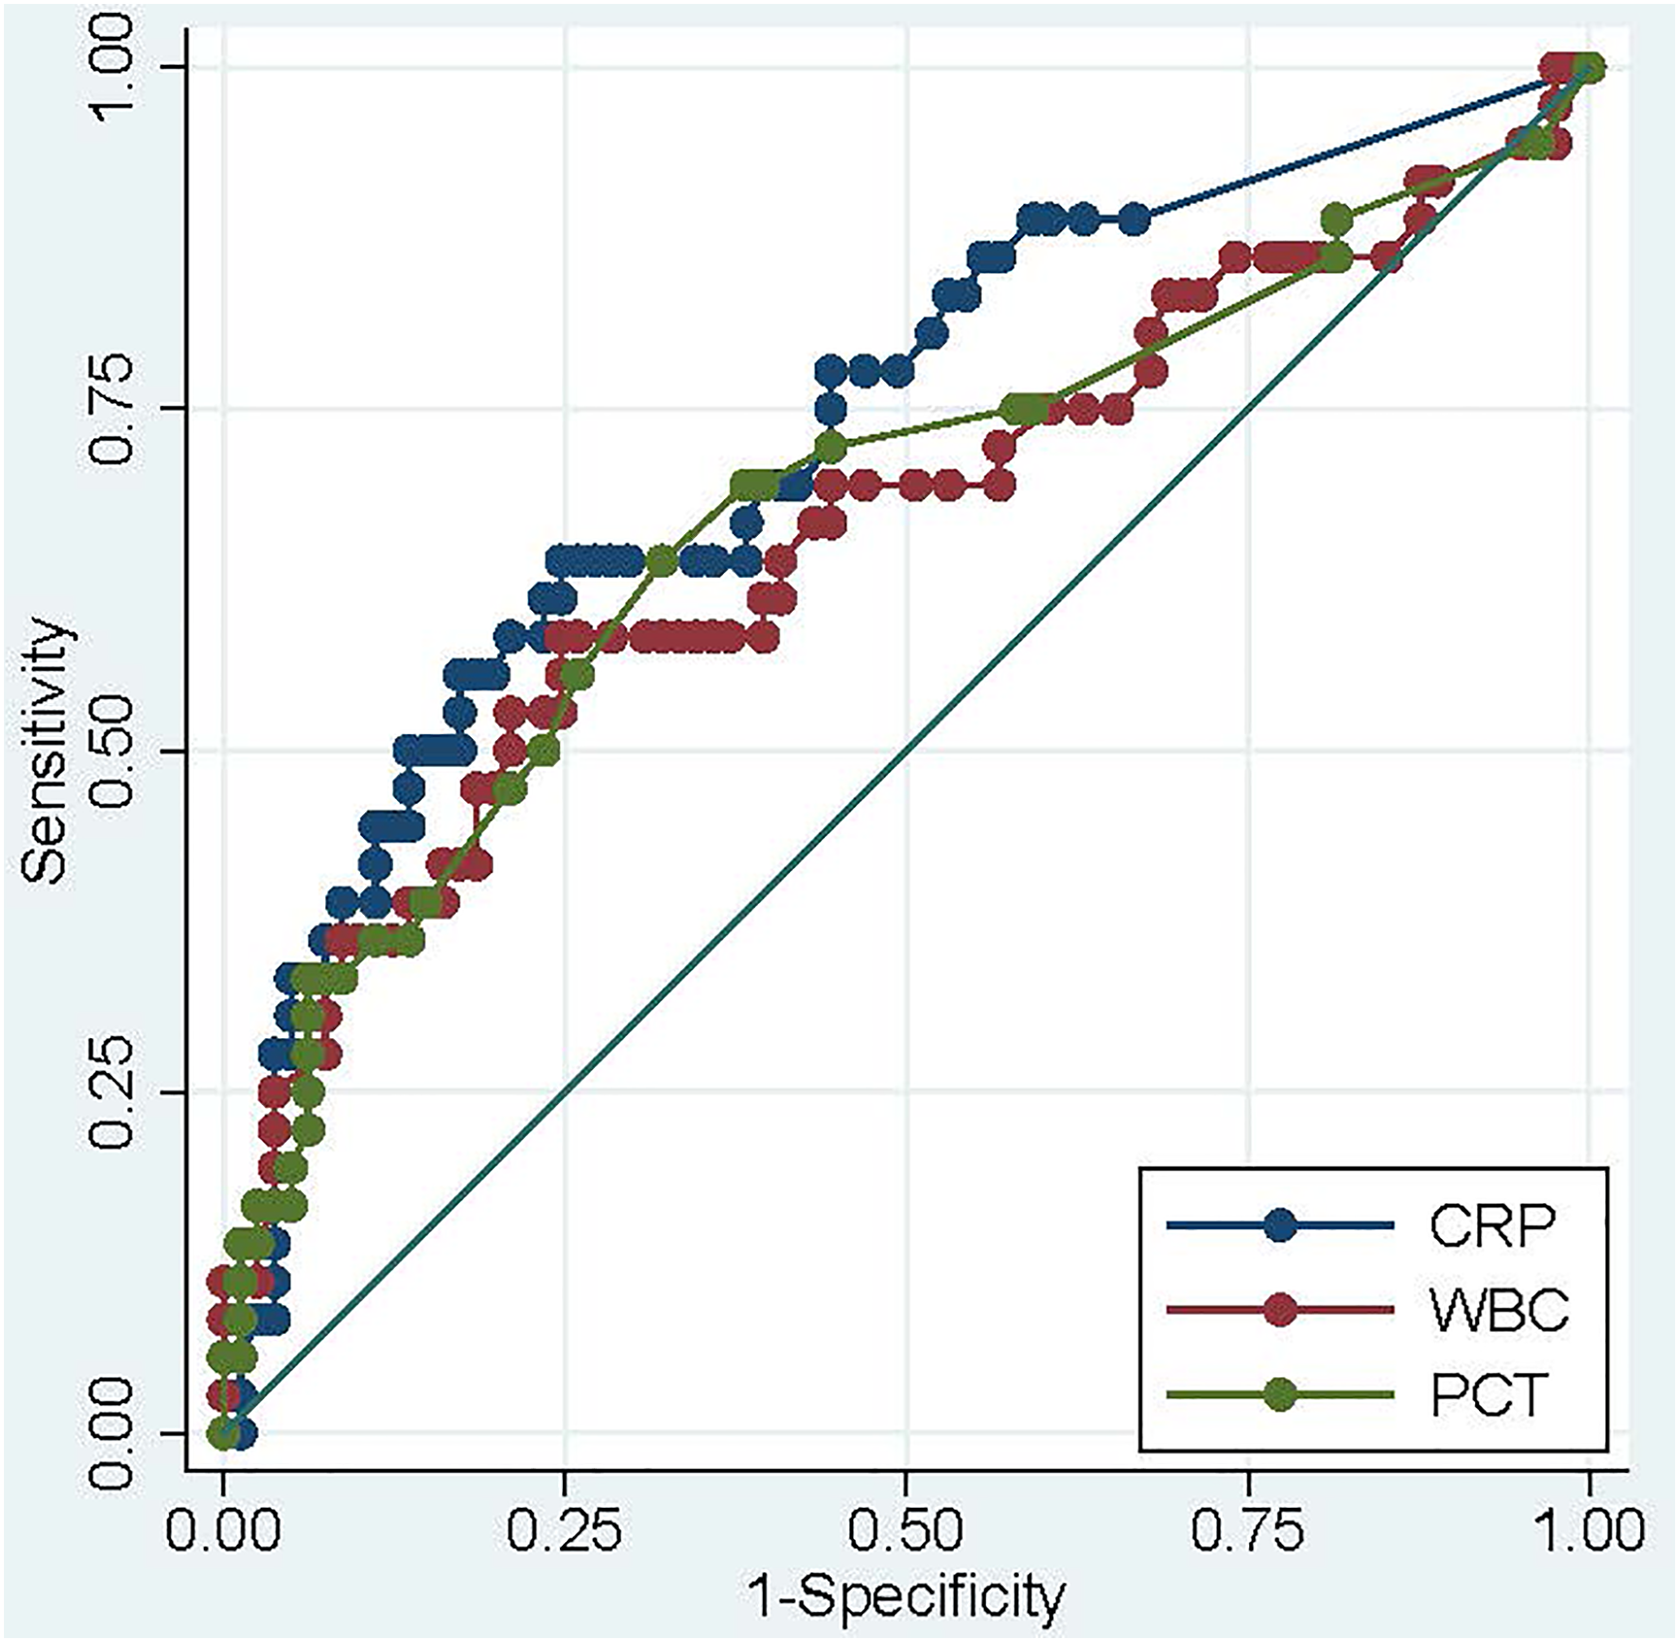
ROC curves for PCT, WBC and CRP measured in samples taken at admission. The curves show how sensitivity (true positive fraction) varies with 1-specificity (false positive fraction) when diagnostic cut-off limit is varied. ROC: receiver operation characteristic; PCT: procalcitonin, CRP: C-reactive protein; WBC: white blood cell.
Discussion
In the present study, it was shown that PCT as a single test at admission had about the same diagnostic accuracy as CRP and WBC in diagnosing pneumonia in patients hospitalized with AECOPD. A combination of clinical variables (gender, expiratory wheezing on auscultation, heart rate, respiratory rate and body temperature) was at least as accurate as the biomarkers. Although the biomarkers did reach statistical significance when added to the model of clinical variables, the increase in diagnostic accuracy (measured as the AUC under the ROC curve) was modest and not statistically significant.
The usefulness of biomarkers in diagnosing and assessing causes of pneumonia in AECOPD is still a matter of controversy. One study showed that in patients presenting to the emergency department with AECOPD, CRP, PCT and copeptin levels were significantly elevated, but only CRP was able to discriminate between an Anthonisen type I exacerbation and Anthonisen type II or type III exacerbation. 15 Another study comparing the diagnostic accuracy of PCT, CPR and neutrophil/lymphocyte (N/L) ratio showed that the ROC AUC value of PCT was significantly better in predicting bacterial infection compared with CRP or N/L ratio. 16 Moreover, in the study of upper respiratory tract viral infections in patients with COPD exacerbations, no correlation between either CRP or PCT values and sputum cultures or results of virological screening was found, and neither of these biomarkers could efficiently discriminate between viral and non-viral infections. 17
Moreover, in the study by Lacoma et al., the levels of PCT, CRP, neopterin and microbiological tests were evaluated in COPD patients in stable phase, patients undergoing a COPD exacerbation and patients with pneumonia. 18 The levels of PCT and CRP were significantly different in these three patient groups. However, when defining subgroups of the patients with AECOPD according to the Anthonisen classification, none of the biomarker levels differed significantly. Further, when mucopurulent expectoration was present, CRP levels were higher and almost reached statistical significance, but no significant increase was found for PCT levels. Interestingly, unlike other studies 19,20 pretreatment with antibiotics had no significant effect on the biomarker levels.
In agreement with previous studies on p-AECOPD versus np-AECOPD, 21,22 we found that patients with p-AECOPD had more pronounced objective criteria consistent with pneumonia such as high fever, increased pulse rate, more severe hypoxemia, more often crackles on lung auscultation and a more pronounced increase in the levels of biomarkers compared with np-AECOPD patients. However, we showed that there were no significant differences between the p- and np-AECOPD groups regarding the distribution of patient-reported symptoms such as increased dyspnoea, cough or increased sputum purulence. This finding is noteworthy in view of the trend that patients with chronic diseases are encouraged to rely on supported self-management.
As has been shown in several previous studies, 18,23,24 our results demonstrated a large variability in the biomarker levels and some overlap between the p- and np-AECOPD groups. This may be explained by the fact that AECOPD as well as pneumonia encompass widely different degrees of severity from very mild forms to life-threatening conditions, as well as differences in etiology. 25,26
Some limitations of the present study should be considered. The study population was rather small, and the patients were quite heterogeneous in terms of duration, clinical manifestations and prehospital treatment of their AECOPD. The difference in the diagnostic accuracy between PCT, CRP and WBC might have been significant in a larger study population where no participants were treated with antibiotics until admission. Moreover, we assume that the diagnosis of pneumonia in patients with AECOPD could be more accurate if we had used chest computed tomography (CT). 27 However, diagnosis of pneumonia in adults presenting with signs of lower respiratory tract infection in primary care as well as at the hospital EU is based on chest X-ray, not chest CT according to existing guidelines. 28,29
The strength of the present study is the study design where the participants represent a real-life clinical population of patients admitted to hospital due to an AECOPD, and the diagnostic procedures, laboratory measurements and decision on treatment were made without any knowledge of the PCT values. Hence, the findings are transferable to common clinical settings in hospital emergency units or outpatient clinics.
Conclusion
As a single test, PCT had about the same accuracy as CRP and WBC in diagnosing pneumonia in patients hospitalized with AECOPD. However, PCT did not add to the combined diagnostic accuracy of relevant clinical parameters and CRP.
Footnotes
Authors’ note
This study was partly supported by Unimed, Trondheim University Hospital Foundation and the Research Council of Norway.
Acknowledgements
The authors would like to acknowledge the assistance they received from the staff at the Emergency Department, the Department of Thoracic Medicine, the Department of Medical Microbiology and the Department of Clinical Chemistry at the Trondheim University Hospital.
Authors’ contributions
ET and AÅ helped in conception and design, acquisition of data, analysis and interpretation of data. All authors contributed to the intellectual content of the manuscript and were consulted for the final approval of the submitted version.
Declaration of conflicting interests
The author(s) declared no potential conflicts of interest with respect to the research, authorship and/or publication of this article.
Funding
The author(s) received no financial support for the research, authorship and/or publication of this article.