
Abstract
Introduction
Previously, we observed that subgroups of type 2 diabetes (T2D) – mild obesity-related diabetes (MOD), mild age-related diabetes (MARD), severe insulin-resistant diabetes (SIRD) – had distinct characteristics and complications. This study aims to investigate if movement behaviour also differs by T2D subgroup. Given that physical activity (PA) reduces the risk of complications, identifying less active subgroups could inform more targeted interventions.
Methods
Using age at T2D onset, body mass index, hbA1c, homeostasis model assessment 2 estimates of beta-cell function and insulin resistance, 706 study participants were classified into T2D subgroups. Using time spent in light PA, moderate-vigorous PA, day inactivity and night sleep per 24-hour, the participants were classified into three profiles. Regression models were used to examine the association between T2D subgroup (exposure) and movement behaviour (outcome).
Results
Compared to MOD, the relative risk ratio (RRR) of having the least active profile was 0.69 (95%CI 0.43-1.10), while the RRR of having the most active profile was 1.53 (95%CI 0.82-2.83) for MARD. The RRRs of having the least and most active profile was 1.32 (95%CI 0.85-2.04) and 1.44 (95%CI 0.76-2.72) respectively for SIRD.
Conclusion
Understanding the relationship between T2D subgroups and movement behaviour is a step towards advocating for PA intervention tailored to each subgroup’s unique characteristics.
Introduction
Besides taking anti-diabetic medication, lifestyle intervention such as physical activity (PA) can reduce the risk of diabetes complications.1,2 The full spectrum of 24-hour movement behaviour, which encompasses light PA, moderate PA, vigorous PA, sedentary time and sleep, is interrelated and collectively influences glucose metabolism and cardiometabolic health. Evidence suggests that the total volume of PA as well as the pattern of daily movement, such as breaking up prolonged sitting, incorporating light-intensity activity, and maintaining adequate sleep duration, plays a critical role in glycaemic control and insulin sensitivity. 3 Studies have shown that PA improves glucose level,4–6, beta-cell function, 7 insulin sensitivity, 8 vascular function 9 and gut microbiota. 10 The American Diabetes Association has various recommendations for PA, which vary by the type of diabetes, medication for diabetes and presence of other co-morbidities. Generally, it is recommended for adults with diabetes to engage in ≥150 minutes of moderate-to-vigorous intensity PA, over ≥3 days a week with <3 consecutive days without PA. Shorter durations (≥75 minutes a week) of vigorous intensity PA may be sufficient for younger and physically fitter individuals. 11 Extended periods of sitting should be interspersed with light PA every 30 minutes. 11 Having six to nine hours of sleep is ideal as the association between sleep quantity and markers of diabetes burden is U-shaped, though sleep quality and sleep timing also matter. 12 Assessing movement behaviour across the entire day provides a comprehensive understanding of lifestyle influences on type 2 diabetes (T2D).
T2D is a heterogeneous disease, with etiology, manifestation and prognosis that vary across individuals. 13 Several studies have identified and replicated subgroups of T2D across a diverse range of populations. Previously, using de novo k-means clustering on five clinical variables, three subgroups of recent-onset T2D were identified. 14 Across the T2D subgroups, participants with mild obesity-related diabetes (MOD) tend to have preserved beta-cell function. Those who had mild age-related diabetes with insulin insufficiency (MARD) tend to have lower body mass index and lower insulin resistance. The severe insulin-resistant diabetes with relative insulin insufficiency (SIRD) group tend to have younger age at T2D onset and higher hbA1c. Not only did these subgroups have distinct genetic, lipidomic and proteomic signatures, their risk of cardiorenal complications also differed.14,15
Given that there are clinical and omics profile unique to each subgroup of T2D, we hypothesized that movement behaviour, known to be associated with differential clinical and omics profile, also vary across the subgroups. There are limited studies, especially in the Asian multi-ethnic context, that investigate the differences in movement behaviour by T2D subgroup. As participants with SIRD had worse metabolic profile and higher risk of cardiorenal complications than those with MOD or MARD, we hypothesized the SIRD group is the least physically active. Therefore, the aim of this exploratory study was to examine the association between the three identified subgroups of T2D and movement behaviour. This study is an initial step towards understanding variation in movement behaviour across T2D subgroups, which could potentially guide the design of future studies or interventions focusing on subgroup-specific movement behaviour strategies to prevent complications of T2D.
Methods
Study population
Participants of this cross-sectional study were from a prospective cohort (Singapore Study of Macro-Angiopathy and microvascular Reactivity in Type 2 Diabetes, SMART2D) that investigates the risk factors and complications of T2D. 16 T2D was diagnosed after excluding type 1 diabetes and diabetes due to specific causes. Participants with pregnancy, uncontrolled hyperglycaemia (point-of-care fasting plasma glucose >15.0 mmol/L or hbA1c >12%), overt infection, autoimmune disease, cancer on active treatment, kidney diseases attributable to specific causes, and those unable to provide informed consent were excluded from cohort enrolment. Participants were first recruited from outpatient clinics of a regional hospital and a primary care facility in northern Singapore between August 2011 and March 2014 (phase 1). They were subsequently followed up with an approximately 3-year interval in 2014 to 2017 (phase 2) and in 2019 to 2024 (phase 3) (Supplementary table 1). Blood and urine samples after overnight fasting from the participants were collected at baseline (phase 1) and follow-up (phases 2 and 3). This study was conducted according to the principles laid by Helsinki Declaration and approved by Singapore National Healthcare Group Ethic Review Committee. Each participant gave written informed consent.
Subgroups of T2D
Previously, de novo k-means clustering on five clinical variables captured at phase 1 of SMART2D – age at T2D onset, body mass index (BMI), hbA1c, homeostasis model assessment 2 estimates of beta-cell function (HOMA2-B) and insulin resistance (HOMA2-IR) – were used to classify study participants with T2D diagnosed ≤5 years (recent-onset) into three distinct subgroups. Age at T2D onset was derived from participants’ self-reported diabetes duration and birth date at recruitment. BMI was derived from weight and height measured by research coordinator. HbA1c was quantified by immunoassay (DCA Vantage Analyzer, Siemens, Germany). HOMA2-B and HOMA2-IR were derived from fasting plasma glucose (quantified by enzymatic assay, Roche Cobas Integra 700, Roche Diagnostics, Switzerland) and fasting plasma C-peptide (quantified by immunoassay, Mercodia, Uppsala, Sweden) using HOMA2 calculator version 2.2.3 (https://www.dtu.ox.ac.uk/homacalculator/). HOMA2-B and HOMA2-IR were log-transformed, and all five variables were z-score standardised before clustering.
Individual’s cluster membership could change as their T2D evolves over time. 11 Now, to allow comparability with the T2D subgroups identified previously, using minimum Euclidean distance between the three clusters’ centroids of the five classifiers from phase 1 and values of the five classifiers from phase 3, cluster membership for participants who were followed up at phase 3 were determined, disregarding their T2D duration at phases 1 and 3. Participants were included in the analysis if complete data were available across all five classifiers. Bootstrapping with 1000 iterations was done to assess the robustness of cluster membership. Coefficient of variation was low at <0.1 across the clusters, demonstrating consistent emergence of the three T2D subgroups.
Movement behaviour
To capture more objective data, movement behaviour was measured using Axivity AX3 wrist-worn triaxial accelerometer rather than relying on self-reported questionnaire, at phase 3 of SMART2D. Participants were asked to wear the accelerometer on their non-dominant hand continuously for 24 hours over ≥7 days. The raw data was processed using GGIR package (version 3.1.0) in R software.17,18 The accelerometer devices were calibrated relative to gravity. Vector magnitude was calculated from the three axes raw signals, with one gravity unit subsequently subtracted. Negative values were set to 0, following the Euclidean Norm Minus One method. 19 Indices of 24-hour activity were aggregated based on 5-second epochs to capture brief movement bursts. 20 Non-wear time was identified using 60-minute sliding windows with 15-minute increments, based on standard deviation <3 milligravity and value range <50 milligravity in at least two of the three axes.18,19,21 Participants with ≥16 hours of wear time for ≥3 days were included in the analysis. Night sleep duration was estimated using the algorithm by Van Hees et al. based on sustained period of inactivity and minimal change in arm angle.22,23 Beyond night sleep, the remaining time in a day was classified into inactivity (proxy for sedentary behaviour) including day nap (<25 milligravity), light PA (LPA, 25-100 milligravity), moderate PA (100-430 milligravity) or vigorous PA (>430 milligravity), based on Euclidean Norm Minus One cut points estimated using the algorithm by Hildebrand et al. 24 The weighted daily averages of time spent on each movement behaviour across all valid days, whereby a statistical weight of 5/7 and 2/7 was allocated to weekday and weekend respectively, were analysed. The weighted averages of the time spent in moderate PA and vigorous PA per day were summed up to derive the moderate-vigorous PA (MVPA) duration as vigorous PA duration was low at <5 minutes per day for most participants.
Statistical analysis
The characteristics of participants at phase 3 of SMART2D and time spent for each movement behaviour (reported in minutes per 24-hour) were compared across the T2D subgroups and latent profiles using ANOVA or Kruskal-Wallis test for continuous variables and Chi-square test for categorical variables. To identify specific groups differences, pairwise comparisons were conducted using mean or median differences for continuous variables and proportion differences for categorical variables, with confidence intervals (CI) generated through bootstrapping with 1000 iterations and corrected for multiple testing using the Bonferroni procedure (0.05/3 pairwise comparisons).
As movement behaviour are correlated to each other, besides analysing each of them as a continuous variable one-by-one, latent profile analysis based on time spent in day inactivity, LPA, MVPA and night sleep was used to derive a categorical latent variable that represents the movement behaviour profile. 25 Latent profile analysis was implemented using gsem command in Stata software. Models with two to four profiles without any covariates were explored. As the model with four profiles did not substantially improve the model fit (i.e. lower Bayesian information criterion) and did not yield additional profile that differ distinctly from the three-profile model (Supplementary table 2), the model with three profiles was selected. Relative entropy for the entire study population, average posterior class probability for each latent class, and odds of correct classification ratio for each latent class were used to evaluate the quality of latent class assignment. 26 For the model with three profiles, the entropy and mean posterior probability for each class was close to 1, while the odds of correct classification for each class were high at >5 (Supplementary table 3), indicating that the classes were well separated and class assignments were accurate to a large extent.
To examine the association between T2D subgroup (exposure) and movement behaviour (outcome), we looked at the time spent in each movement behaviour using linear regression and the odds of having certain latent movement behaviour profile using multinomial logistic regression weighted by each participant’s posterior latent class probability. The coefficients and odds ratios, as well as their corresponding 95% CI, from the linear and multinomial logistic regression respectively, were reported. All models adjusted for age at phase 3, sex and ethnicity only as age at T2D onset, BMI, hbA1c, HOMA2-B and HOMA2-IR were already included for T2D subgrouping.
The 706 participants included in this study (Supplementary Figure 1) did not have any missing data for the variables included in analysis. Analyses were performed using Stata SE 18 and R 4.1.3.
Results
Movement behaviour profile by T2D subgroup
Characteristics of participants by T2D subgroup.
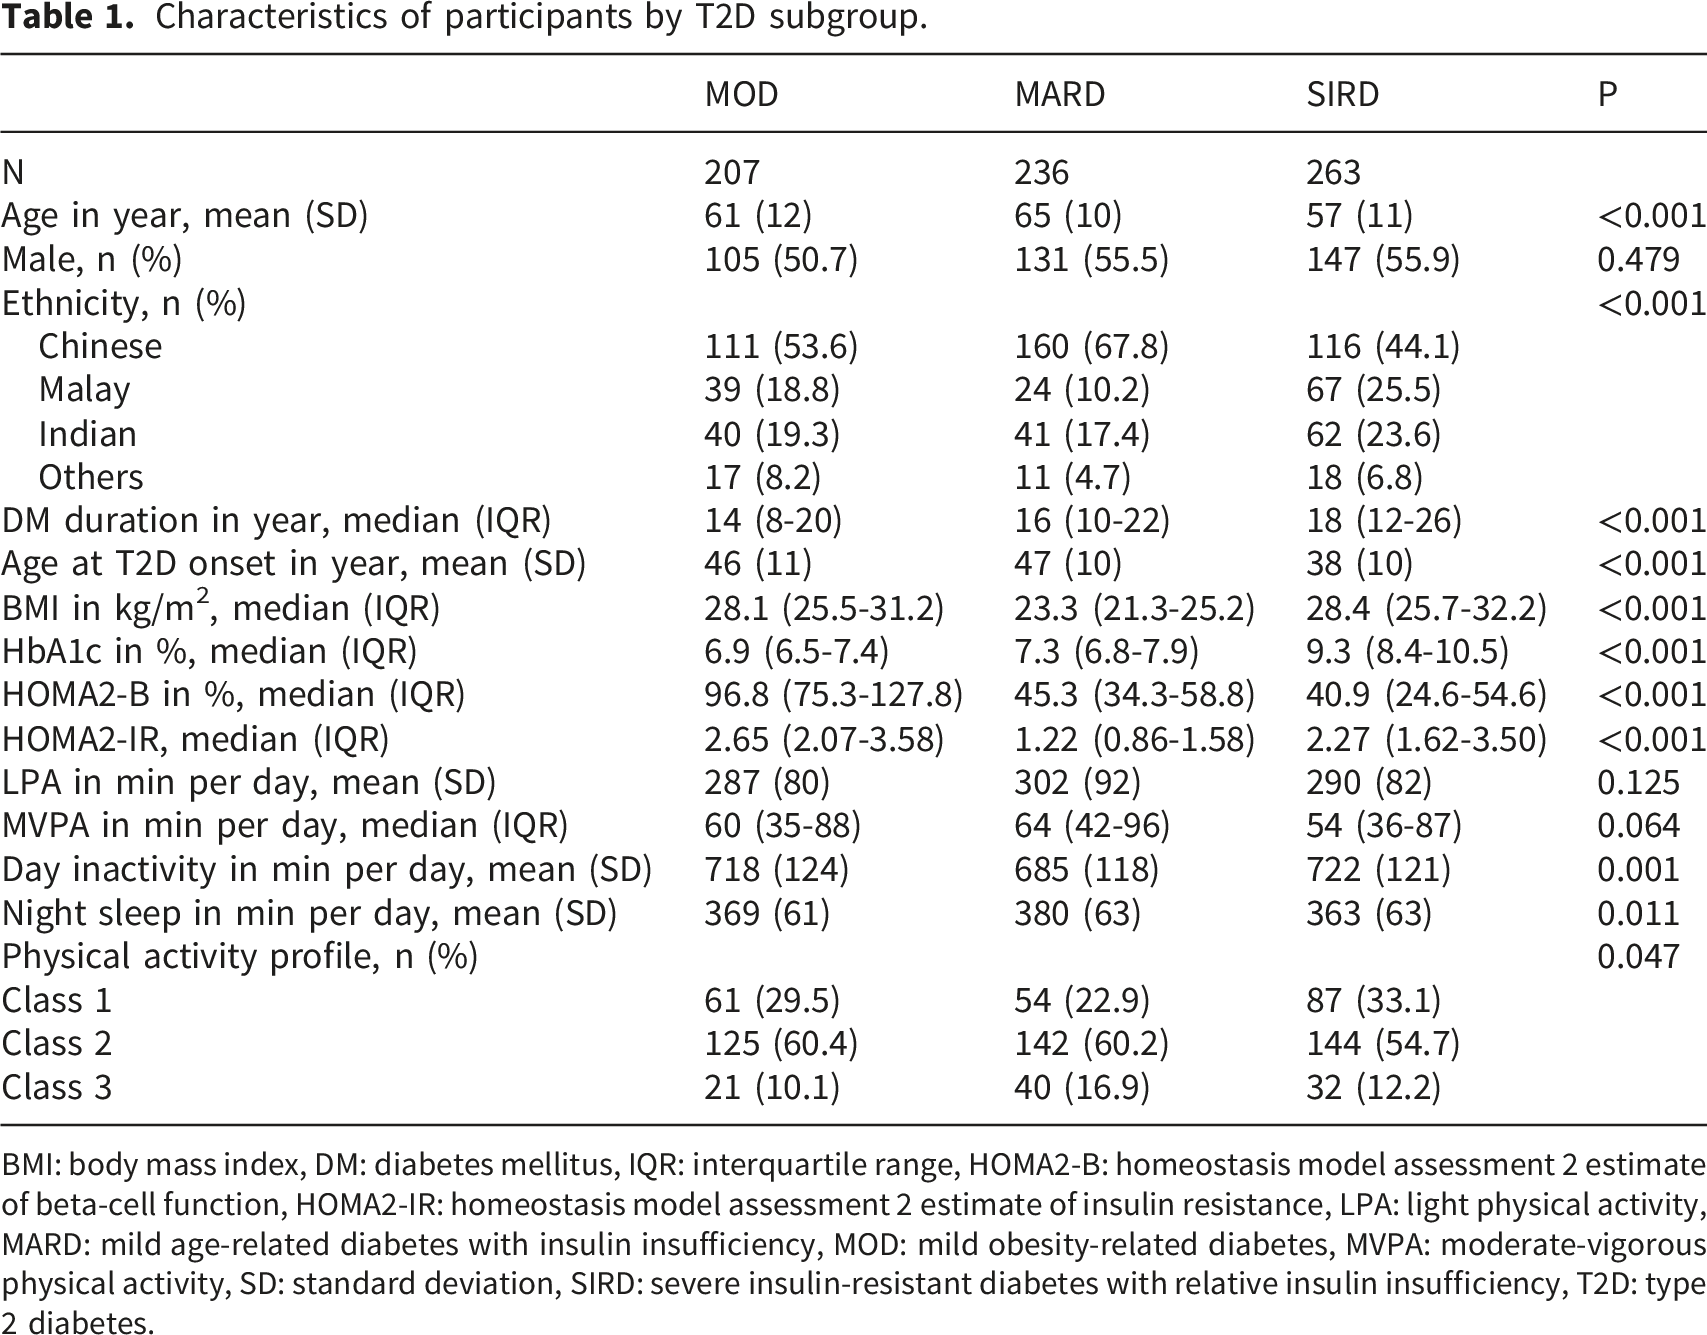
BMI: body mass index, DM: diabetes mellitus, IQR: interquartile range, HOMA2-B: homeostasis model assessment 2 estimate of beta-cell function, HOMA2-IR: homeostasis model assessment 2 estimate of insulin resistance, LPA: light physical activity, MARD: mild age-related diabetes with insulin insufficiency, MOD: mild obesity-related diabetes, MVPA: moderate-vigorous physical activity, SD: standard deviation, SIRD: severe insulin-resistant diabetes with relative insulin insufficiency, T2D: type 2 diabetes.
Characteristics of participants by movement behaviour profile.

BMI: body mass index, DM: diabetes mellitus, IQR: interquartile range, HOMA2-B: homeostasis model assessment 2 estimate of beta-cell function, HOMA2-IR: homeostasis model assessment 2 estimate of insulin resistance, LPA: light physical activity, MARD: mild age-related diabetes with insulin insufficiency, MOD: mild obesity-related diabetes, MVPA: moderate-vigorous physical activity, SD: standard deviation, SIRD: severe insulin-resistant diabetes with relative insulin insufficiency, T2D: type 2 diabetes.
Association between T2D subgroup and movement behaviour
Association between T2D subgroup (exposure) and movement behaviour (outcome).
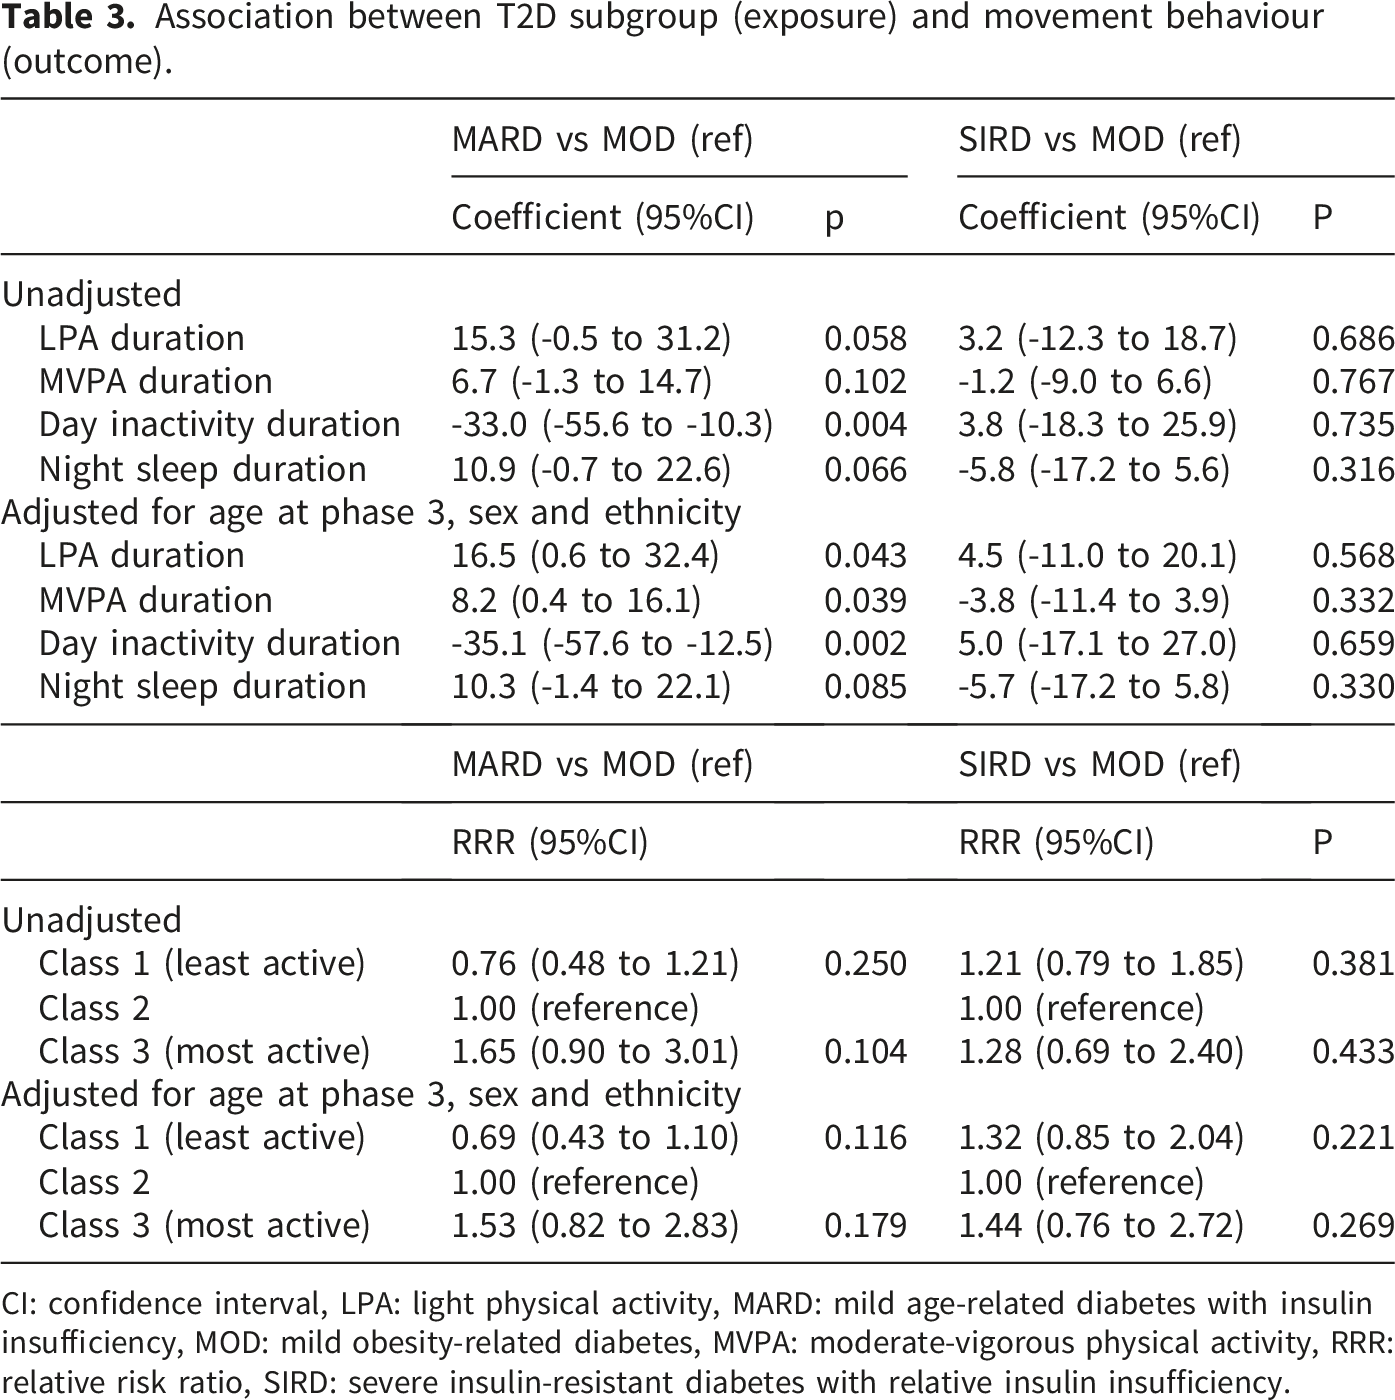
CI: confidence interval, LPA: light physical activity, MARD: mild age-related diabetes with insulin insufficiency, MOD: mild obesity-related diabetes, MVPA: moderate-vigorous physical activity, RRR: relative risk ratio, SIRD: severe insulin-resistant diabetes with relative insulin insufficiency.
With MOD as the reference group, the relative risk ratio (RRR) of having the least active profile (class 1) was 0.69 (95%CI 0.43 to 1.10), while the RRR of having the most active profile (class 3) was 1.53 (95%CI 0.82 to 2.83) for MARD after adjusting for age, sex and ethnicity (Table 3 and Figure 1). The RRRs of having the least and most active profile was 1.32 (95%CI 0.85 to 2.04) and 1.44 (95%CI 0.76 to 2.72) respectively for SIRD. As the confidence intervals included RRRs in both directions, there was no statistically significant evidence to suggest that the likelihood of having the least or most active was higher or lower for MARD and SIRD than MOD. Predicted probability and 95% confidence interval of being in each physical activity class for each T2D subgroup adjusted for age at phase 3, sex and ethnicity.
Discussion
Using the nearest pre-defined centroids of five clinical variables to cluster participants into three T2D subgroups and using accelerometer to measure their movement behaviour over ∼7 days, MARD was observed to be the most physically active T2D subgroup, with lower day inactivity duration, higher LPA duration, and higher MVPA duration than the other two subgroups after accounting for age, sex and ethnicity.
Consistent with the results from Henson et al., lower sedentary duration but higher LPA, MVPA and night sleep duration were observed in participants with MARD than MOD. 27 There was no similar comparison for participants with SIRD as they classified the participants into insulin-deficient diabetes and insulin-resistant diabetes subgroups instead. Saatmann et al. found that participants with SIRD had the lowest physical fitness compared to other diabetes subgroups. 28 After adjusting for age, sex and ethnicity, significant differences in LPA, MVPA and day inactivity duration were observed in MARD but not in SIRD, compared to MOD in our study. Insulin resistance (high HOMA2-IR) seen in participants with MOD and SIRD often indicates a problem with glucose utilisation due to impaired insulin action. Impaired glucose metabolism, partly due to suboptimal insulin mediated muscle glucose uptake, can lead to muscle fatigue or difficulty sustaining energy level during PA.29,30 Insulin resistance is associated with increased global and visceral fat, 31 resulting in high BMI and impeding PA. After adjusting for age, sex and ethnicity, the difference in night sleep duration between MARD and MOD attenuated more than the difference between SIRD and MOD, suggesting that cumulative health burden from age-related factors, such as mild anaemia and hypothyroidism, might have contributed to more night sleep for participants with MARD. 29
Based the GRADE (Grading of Recommendations, Assessment, Development, and Evaluation) framework, a relative risk reduction or increase of 25% is used as a rough guide to indicate clinical significance. 32 When movement behaviour was analysed collectively with MOD as the reference group, the RRR of having the least active profile was <0.75 (0.69 95%CI 0.43 to 1.10) while the RRR of having the most active profile was >1.25 (1.53, 95%CI 0.82 to 2.83) for MARD, which aligned with the findings corresponding to each movement behaviour. In contrast, the RRR of having the least active profile (1.32, 95%CI 0.85 to 2.04) and the RRR of having the most active profile (1.44, 95%CI 0.76 to 2.72) were both >1.25 for SIRD, suggesting that there might be more variability in movement behaviour within SIRD. On one hand there might be participants who were motivated to be more active due to their T2D diagnosis, on the other hand there might be participants who were physically challenged by their T2D. However, the confidence intervals of the RRRs for MARD and SIRD encompassed a range of effect sizes, from clinically small effects to potentially meaningful effects in both directions. As this study was exploratory, no a priori sample size calculation was performed. Given the limited number of patients willing to wear the accelerometer continuously for 24 hours over ≥7 days, the study is likely underpowered to provide precise confidence intervals.
While increased PA is broadly applicable and benefits all individuals with T2D, highlighting subgroups with lower activity level and unhealthy movement behaviour pattern could inform more targeted interventions. As participants with MOD or SIRD tend to be less physically active than those with MARD, future intervention for MOD and SIRD should aim to increase PA and reduce sedentary time. SIRD is associated with increased risk of progressive chronic kidney disease and heart failure. 14 If SIRD can be identified early at diagnosis of T2D, adequate amount of PA may mitigate the risk burden associated with this unfavourable T2D subgroup. The benefits from PA are more pronounced and sustained with preserved beta cell function as improved insulin sensitivity is matched by increased endogenous insulin secretion, whereas there is lack of insulin to transport glucose into cells beyond the PA duration with impaired beta cell function.33–35 MOD tends to have preserved beta cell function (high HOMA2-B). If MOD can be identified early while the beta cells are still functional, more benefits from PA can be reaped for this T2D subgroup. Understanding the factors that drive or impede T2D patients from engaging in PA can help in the design of more personalised exercise programmes that address individual barriers while leveraging motivational factors to enhance long-term participation in PA. 36 Besides reducing sedentary time through increased PA, adequate sleep is also essential in reducing the risk of T2D complications. 12 Understanding the factors that contribute to suboptimal sleep duration in T2D patients can similarly guide intervention to help patients achieve optimal sleep patterns, thereby providing the energy needed to engage in PA.
This study is one of the few studies in existing literature that examined the relationship between T2D subgroups and movement behaviour in a city-dwelling Asian population. Latent profile analysis considers the full spectrum of movement behaviour simultaneously while providing probability-based class membership to each participant. However, due to the observational nature of this study with the possibility of having unmeasured confounders, all the results could only suggest association but not causation. As there is no longitudinal PA data, the relationships can only be examined cross-sectionally, assuming the data captured at phase 3 of SMART2D was reflective of the participants’ habitual PA. While using an accelerometer to measure PA can overcome recall bias, Hawthorne effect might still exist for some participants during the week that the accelerometer was worn. Moreover, the accelerometer could only detect the intensity, duration and frequency of PA, but not the type of PA (aerobic, resistance, flexibility or balance). Despite having granular data from the accelerometer (e.g. whether PA was done at specific time or throughout the day or week) and other data that could affect PA (e.g. variables related to body composition, arterial stiffness and dietary intake), those data were not analysed as they are beyond the scope of this study but would be our future work. This study lacks other data, such as self-efficacy and social support, which could affect the association between T2D subgroups and movement behaviour. As this study was limited to an Asian population with T2D, the findings may not be generalisable to other ethnic groups. The wide confidence intervals reflect substantial uncertainty in the precision of the observed associations between T2D subgroup and movement behaviour, warranting further research with enhanced precision. Moreover, this study is exploratory without a validation cohort. External validation in a bigger and more diverse study population is needed to confirm these results.
In conclusion, we have shown that movement behaviour profile varied across Asian T2D subgroups. Like all risk factors, movement behaviour is probably one of the many factors, albeit a clinically important one given its modifiability, that may explain the T2D subgroups. Understanding the relationship between T2D subgroups and movement behaviour is a step towards advocating PA intervention tailored to each subgroup’s unique characteristics.
Supplemental material
Supplemental Material - Insights on accelerometer-measured 24-hour movement behaviour across type 2 diabetes sub-phenotypes in the Asian population
Supplemental Material for Insights on accelerometer-measured 24-hour movement behaviour across type 2 diabetes sub-phenotypes in the Asian population by Huili Zheng, Keven Ang, Natarajan Padmapriya, Tsz Kiu Kwan, Mei Chung Moh, Serena Low, Falk Mueller-Riemenschneider, Su Chi Lim in Diabetes & Vascular Disease Research
Footnotes
Funding
The authors disclosed receipt of the following financial support for the research, authorship, and/or publication of this article: The SMART2D cohort is supported by the Singapore Ministry of Health’s National Medical Research Council CS-IRG (MOH-000066 and MOH-001704-00). Su Chi Lim is supported by the Singapore Ministry of Health’s National Medical Research Council Clinician Scientist Award (MOH-000714-01 and MOH-001688-00).
Declaration of conflicting interests
The authors declared no potential conflicts of interest with respect to the research, authorship, and/or publication of this article.
Data Availability Statement
The data used in this study may be shared on reasonable request to the corresponding author.
Supplemental material
Supplemental material for this article is available online.
References
Supplementary Material
Please find the following supplemental material available below.
For Open Access articles published under a Creative Commons License, all supplemental material carries the same license as the article it is associated with.
For non-Open Access articles published, all supplemental material carries a non-exclusive license, and permission requests for re-use of supplemental material or any part of supplemental material shall be sent directly to the copyright owner as specified in the copyright notice associated with the article.