
Abstract
Background
Atherosclerosis (AS) and type 2 diabetes mellitus (T2DM) frequently coexist, jointly accelerating cardiovascular complications through shared inflammatory and metabolic pathways. Despite extensive research, the molecular mechanisms linking these chronic diseases remain incompletely defined.
Purpose
This study aimed to delineate the shared transcriptional signatures and identify candidate biomarkers contributing to T2DM-associated AS progression using an integrative multi-omics strategy.
Research Design
A retrospective bioinformatics investigation integrating differential expression analysis, co-expression network modeling, protein-interaction profiling, immune deconvolution, and machine-learning–based biomarker prioritization was conducted.Study Sample: Publicly available transcriptomic datasets were obtained from the NCBI Gene Expression Omnibus, including AS tissue samples (GSE100927), pancreatic islet samples from individuals with T2DM (GSE25724), and two independent datasets for external validation (GSE30169 and GSE26168).
Data Collection and/or Analysis
Differentially expressed genes (DEGs) were identified for AS (n = 3,368) and T2DM (n = 4,553). DEG intersection and Weighted Gene Co-expression Network Analysis (WGCNA) revealed 443 shared crosstalk genes. Enrichment analyses highlighted immune activation processes (e.g., leukocyte-mediated immunity, lysosomal pathways) and metabolic dysregulation (e.g., mitochondrial-mediated apoptosis, TGF-β signaling). A protein-protein interaction network was constructed, identifying high-degree hub genes such as HLA-DRB1, JAK3, and MFN1. Immune cell profiling using CIBERSORTx compared disease microenvironments, demonstrating increased M1 macrophages and helper T cells in AS, and elevated monocytes and B cells in T2DM (p < 0.05). A fine-tuned TabNet model ranked predictive biomarkers (e.g., BTK, ZAP70, CD4) showing strong diagnostic performance (AUC = 0.85 for AS; 0.79 for T2DM).
Results
The integrative multi-omics workflow uncovered a robust set of immune-metabolic crosstalk genes shared between AS and T2DM. Hub-gene analysis and immune infiltration patterns demonstrated convergent dysregulation in lysosomal activity, mitochondrial integrity, and adaptive immune signaling. Machine-learning prioritization further identified a subset of biomarkers capable of discriminating disease states with high accuracy, strengthening their translational potential.
Conclusions
This study provides a comprehensive molecular framework linking T2DM and AS, revealing previously unrecognized lysosomal and mitochondrial pathways that may drive their synergistic pathology. The identified biomarkers and immune signatures offer promising avenues for early diagnosis and targeted therapeutic development in patients with comorbid T2DM and atherosclerosis.
Introduction
Atherosclerosis (AS) is a chronic, progressive inflammatory disease of the arterial wall and a major contributor to cardiovascular diseases (CVDs), including ischemic heart disease, stroke, and peripheral arterial disease.1,2 Despite its localized manifestations, AS is systemic and remains a leading cause of global morbidity and mortality. 3 Plaque rupture can precipitate thrombosis, myocardial infarction, stroke, or sudden cardiac death,4,5 highlighting the need for reliable biomarkers and therapeutic targets for vulnerable plaques. 6
Type 2 diabetes mellitus (T2DM), characterized by insulin resistance and chronic hyperglycemia, is projected to affect over 784 million people by 2045 7 and is a well-established risk factor for AS.8,9 Diabetic patients often exhibit advanced plaques with larger necrotic cores and calcification, driven by metabolic and inflammatory factors such as elevated LDL-C and disrupted insulin signaling.10–13 Yet, the shared molecular mechanisms linking T2DM and AS remain poorly defined, limiting targeted therapeutic strategies.
High-throughput transcriptomic technologies, including RNA-seq and microarrays, have enabled the identification of differentially expressed genes (DEGs) and novel biomarkers.14,15 Previous studies have revealed genes like CCL4, CCL18, MMP9, and SPP1 in ruptured plaques, 16 and ACLY, SERPING1, ANPEP in T2DM pathogenesis.17,18 Despite these advances, integrative approaches to identify shared molecular signatures for both diseases remain limited. 19
In this study, we define “crosstalk genes” as genes consistently differentially expressed in both AS- and T2DM-related datasets, with strong co-expression connectivity. These genes are considered to represent potential systemic or shared molecular responses rather than strictly tissue-specific alterations, providing a molecular basis for investigating the interplay between these diseases.20–25
This study makes four principal contributions: 1. Identification of Shared Genetic Signatures: Crosstalk genes linking T2DM and AS, mainly in immune activation, lysosomal, and mitochondrial pathways. 2. Characterization of the Immune Microenvironment: Immune deconvolution and single-cell analyses revealed elevated memory B cells and activated mast cells correlated with crosstalk genes. 3. Prioritization of Novel Biomarkers: Biomarkers such as HLA-DRB1, JAK3, and MFN1 were validated across multiple datasets. 4. Discovery of Underexplored Molecular Pathways: Unfolded protein response and mitochondrial-mediated apoptosis pathways offer new therapeutic insights.
By integrating multi-omics and machine learning, this study provides a robust framework for understanding T2DM-AS comorbidity and identifying novel diagnostic and therapeutic targets.
Materials and methods
Data sources
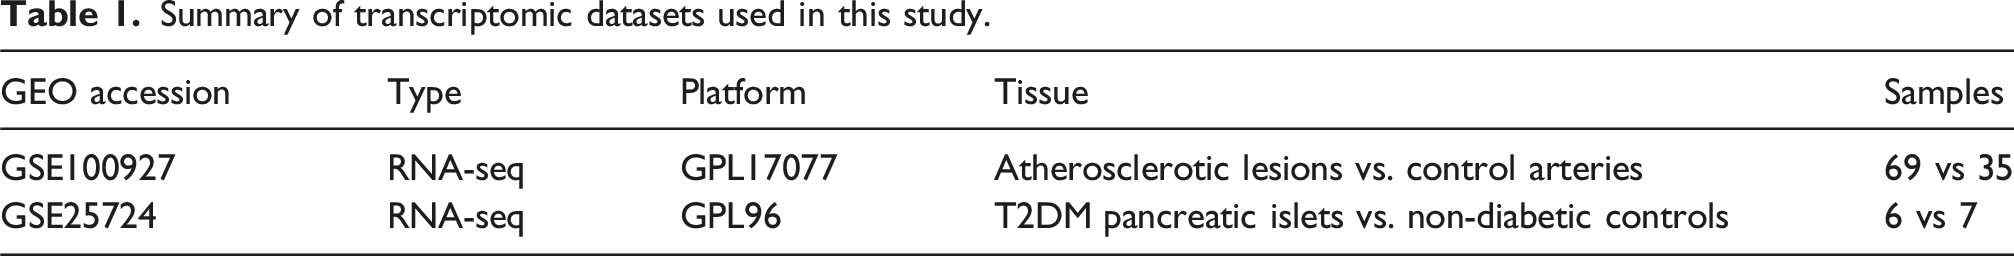
Summary of transcriptomic datasets used in this study.
Differential expression analysis
Raw data were preprocessed to ensure consistency. Probe-level expression values mapping to the same gene were averaged, and probe IDs were mapped to gene symbols using platform-specific annotations. Quantile normalization (GSE100927) and RMA normalization (GSE25724) were applied. Missing values were imputed with k-nearest neighbors (k = 5), and genes with >20% missing data or low expression were excluded. PCA identified outliers (>2 SD from mean), which were removed.
Summary of differentially expressed genes.

Crosstalk gene identification
Disease-specific DEGs were integrated with hub genes from WGCNA to construct AS- and T2DM-related gene sets. Co-expression modules were identified with soft-thresholding powers achieving scale-free topology (R2 > 0.85 for AS, R2 > 0.90 for T2DM). Hub genes (kME >0.8) were merged with DEGs. Crosstalk genes, representing shared molecular signatures, were defined as the intersection of these gene sets with consistent expression directionality, high connectivity, and functional annotation. Low-expression genes (<20th percentile) were excluded. Functional enrichment (GO, KEGG) focused on inflammation, metabolism, and vascular biology. PPI networks were constructed via STRING (confidence >0.7) and hub genes (degree >10) were identified with igraph.
TabNet-based prioritization
The TabNet deep learning model, featuring sequential attention for interpretable feature selection, was employed to prioritize biomarkers. A pre-trained model (TCGA, GTEx) was fine-tuned on GSE100927 and GSE25724, with quantile normalization, log2 transformation, and SMOTE to balance classes. Genes were selected if meeting at least two criteria: TabNet attention score >0.8, |log2FC| >1, or kME >0.8. TabNet integrates feature transformer blocks, attentive transformers, decision steps, and sparsity-inducing regularization for end-to-end interpretable feature selection. Pretraining captures broad gene patterns, and fine-tuning adapts to disease-specific signatures. Attention masks highlight influential genes, improving interpretability and biological relevance.
Model training used a 70:30 split for GSE100927 and Leave-One-Out Cross-Validation for GSE25724. Hyperparameters were optimized via grid search. Performance metrics included accuracy, sensitivity, specificity, and AUC.
Immune signature analysis
Immune cell proportions were estimated using CIBERSORTx with the LM22 matrix. SMOTE balanced classes. Comparisons between disease and control groups used Wilcoxon tests; Spearman correlation assessed associations between crosstalk genes and immune cells. Functional enrichment of immune-related GO and KEGG pathways was performed using clusterProfiler, with cross-reference to ImmPort. PPI networks of immune genes were constructed using STRING, and hub genes (degree >10) identified via igraph.
Validation of crosstalk genes and biomarkers
Independent GEO datasets (GSE30169, n = 50; GSE26168, n = 12) were used for cross-dataset validation. Genes showing consistent differential expression (adjusted p < 0.05, |log2FC| >0.5) or high network centrality (kME >0.8) were considered high-confidence. Literature validation further confirmed biological relevance, focusing on metabolic, vascular, and inflammatory processes. Biomarker performance was evaluated using t-tests and metrics including AUC, accuracy, sensitivity, and specificity.
Statistical analysis
All analyses were conducted in R (v4.2.0). Limma with Benjamini–Hochberg correction was applied for DEGs. Spearman correlation evaluated gene–immune relationships. Machine learning metrics were calculated using pROC. Functional enrichment employed hypergeometric testing with adjusted p < 0.05 considered significant.
Results
The integrative transcriptomic analysis of datasets GSE100927 and GSE25724 provided a comprehensive overview of the molecular interplay between T2DM and AS. This approach enabled the identification of differentially expressed genes (DEGs), shared crosstalk genes, and potential biomarkers, thereby offering insights into diagnostic and therapeutic opportunities. The following subsections detail the results of differential expression profiling, functional annotation, network-based analyses, and immune cell deconvolution.
Identification of differentially expressed genes (DEGs)
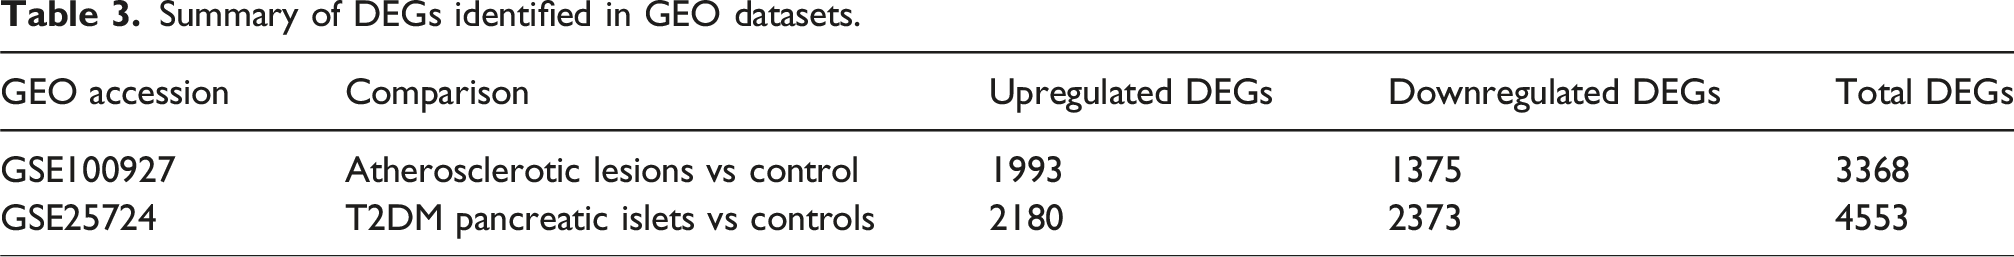
Differential expression analysis revealed extensive transcriptional alterations associated with both Atherosclerosis and T2DM. In the GSE100927 dataset, which included 69 atherosclerotic lesion samples and 35 control arterial tissues, 3368 DEGs were identified, comprising 1993 upregulated and 1375 downregulated genes (|log2FC| > 0.5, adjusted p < 0.05). Similarly, in the GSE25724 dataset, which contained 6 T2DM pancreatic islet samples and 7 non-diabetic controls, 4553 DEGs were detected, including 2180 upregulated and 2373 downregulated genes.
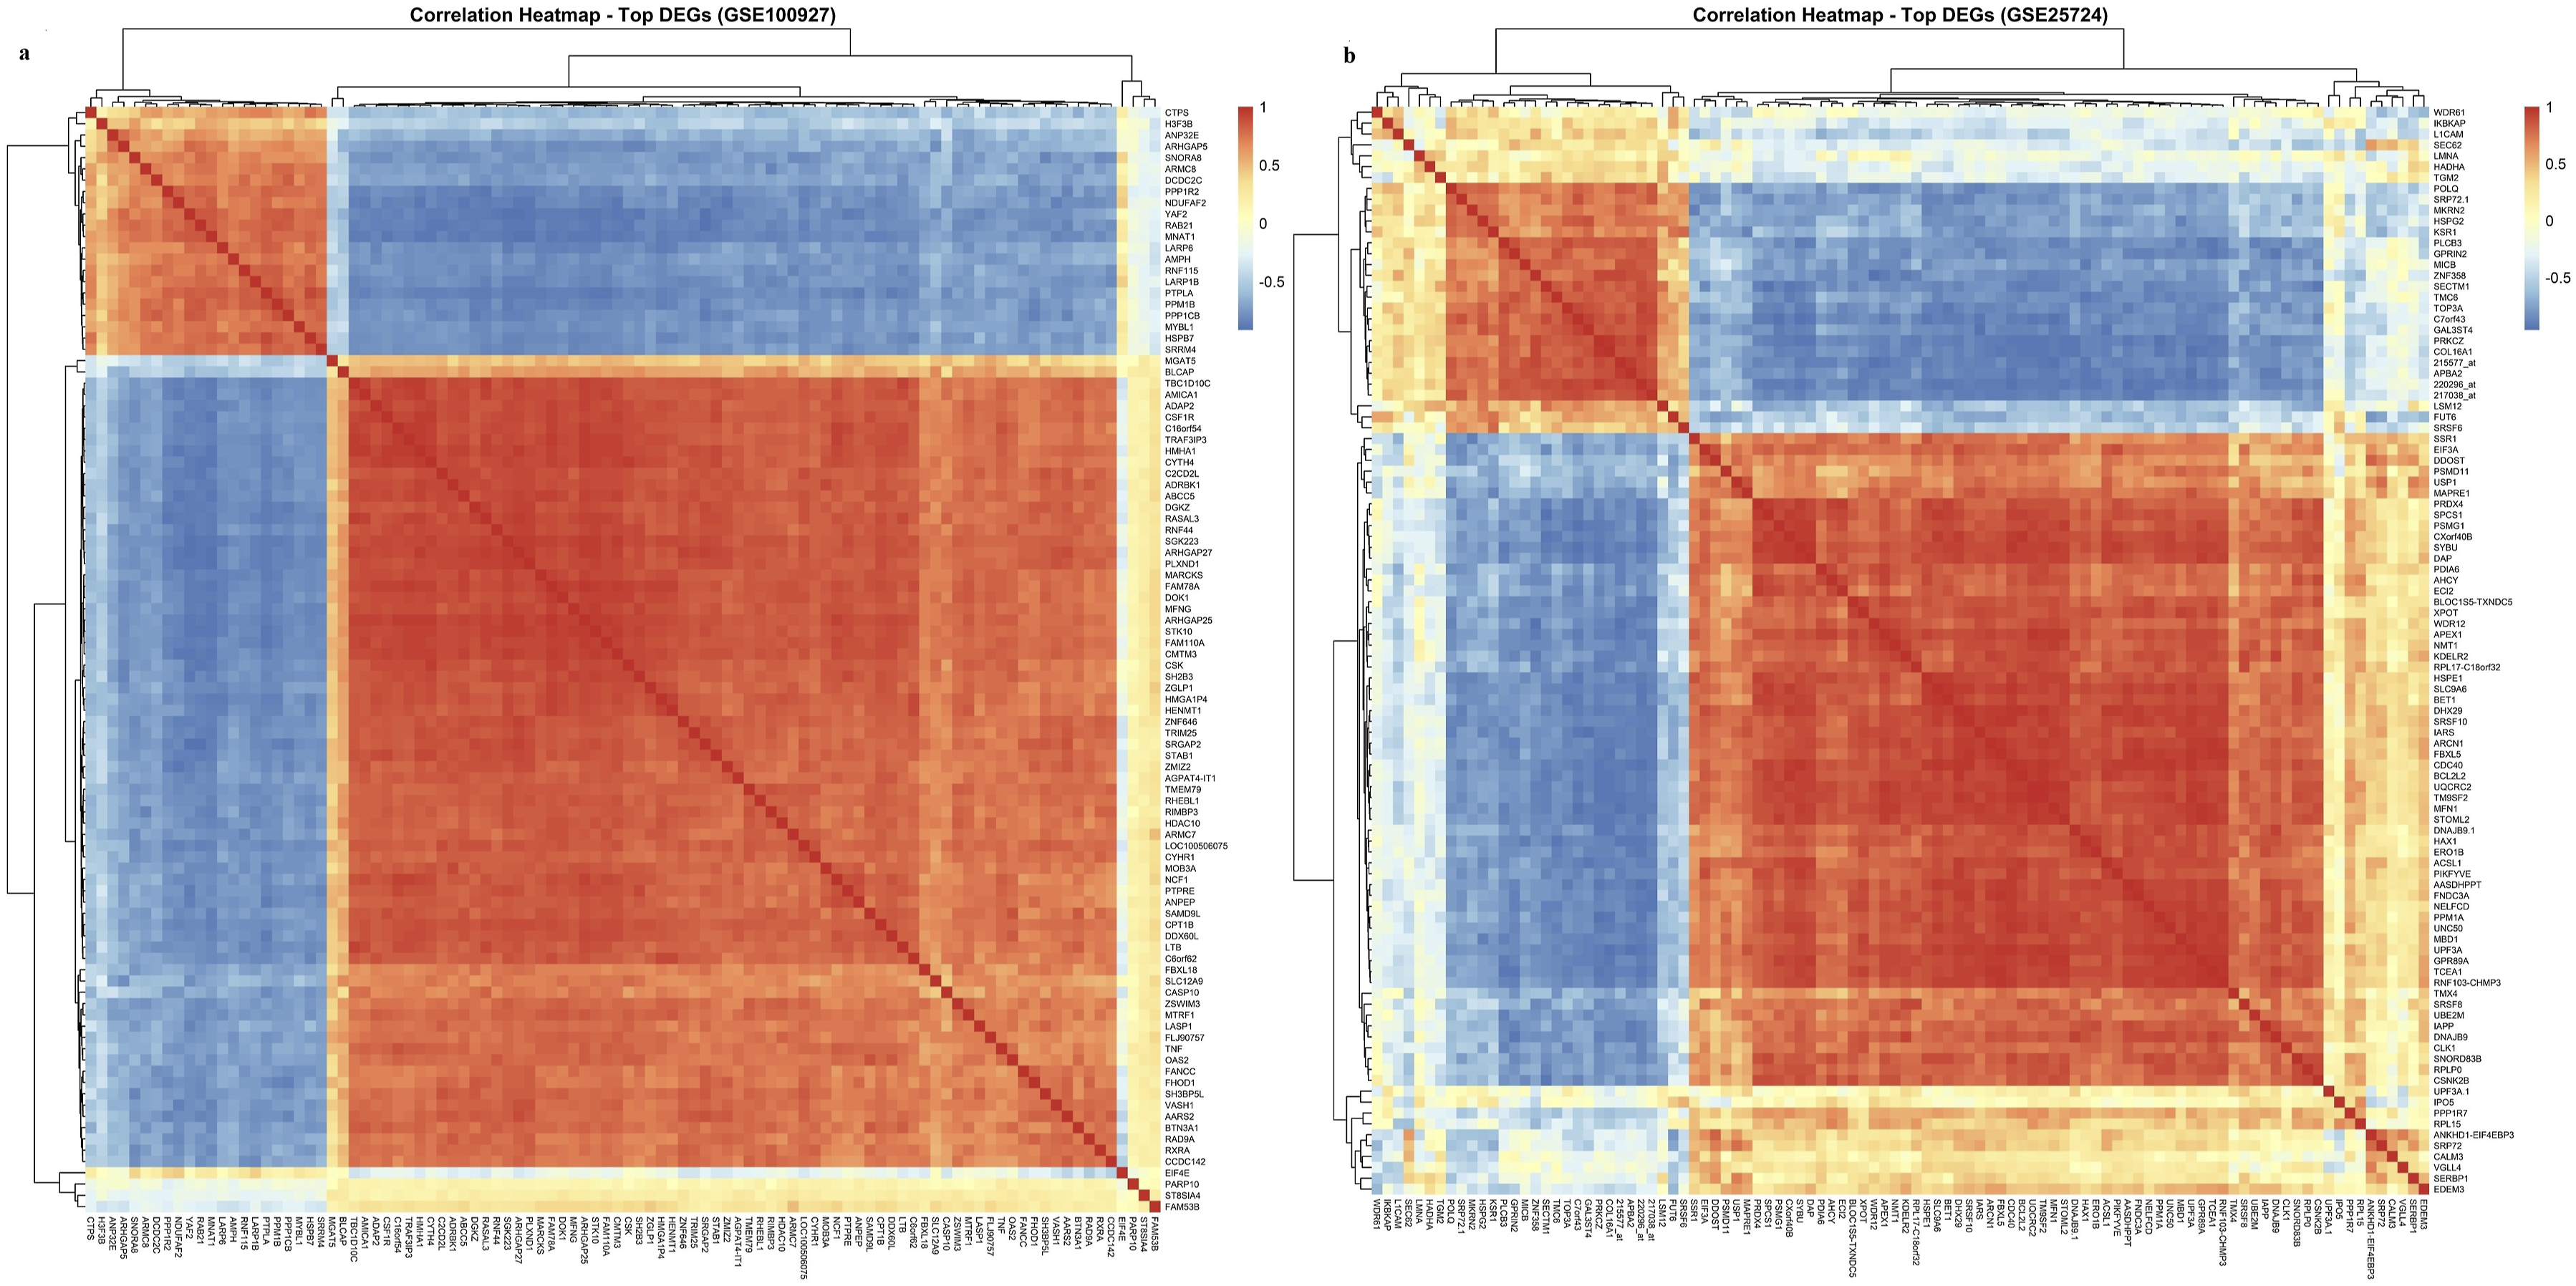
Volcano plots highlighted genes with statistically significant expression changes and substantial fold differences, while principal component analysis (PCA) and correlation heatmaps confirmed robust separation between disease and control groups. These results validated preprocessing and normalization procedures and emphasized the presence of distinct transcriptomic signatures in each dataset (Figures 1 and 2; Table 3). Differential gene expression analysis in GSE100927 and GSE25724. (a) GSE100927 – Volcano plot showing DEGs in atherosclerotic lesions compared with control arterial tissues. Genes with |log2FC| > 0.5 and adjusted p < 0.05 are highlighted. (b) GSE25724 – Volcano plot of DEGs in pancreatic islets from individuals with T2DM versus non-diabetic controls under the same statistical thresholds.(c) GSE100927 – PCA plot illustrating separation of atherosclerotic and control arterial samples based on global gene expression profiles. (d) GSE25724 – PCA plot depicting transcriptional differences between T2DM and non-diabetic pancreatic islet samples. Each point represents a sample, and the colored ellipses indicate 95% confidence intervals, illustrating group clustering and separation. Correlation heatmaps of top DEGs in GSE100927 and GSE25724. (a) GSE100927: Heatmap of pairwise Pearson correlation coefficients among the top DEGs, with hierarchical clustering applied to rows and columns. Positive correlations are shown in red, negative correlations in blue, with intensity reflecting correlation strength. (b) GSE25724: Heatmap of pairwise Pearson correlations among the top DEGs, clustered by similarity. Red indicates positive correlations and blue negative correlations, highlighting transcriptional relationships. Summary of DEGs identified in GEO datasets.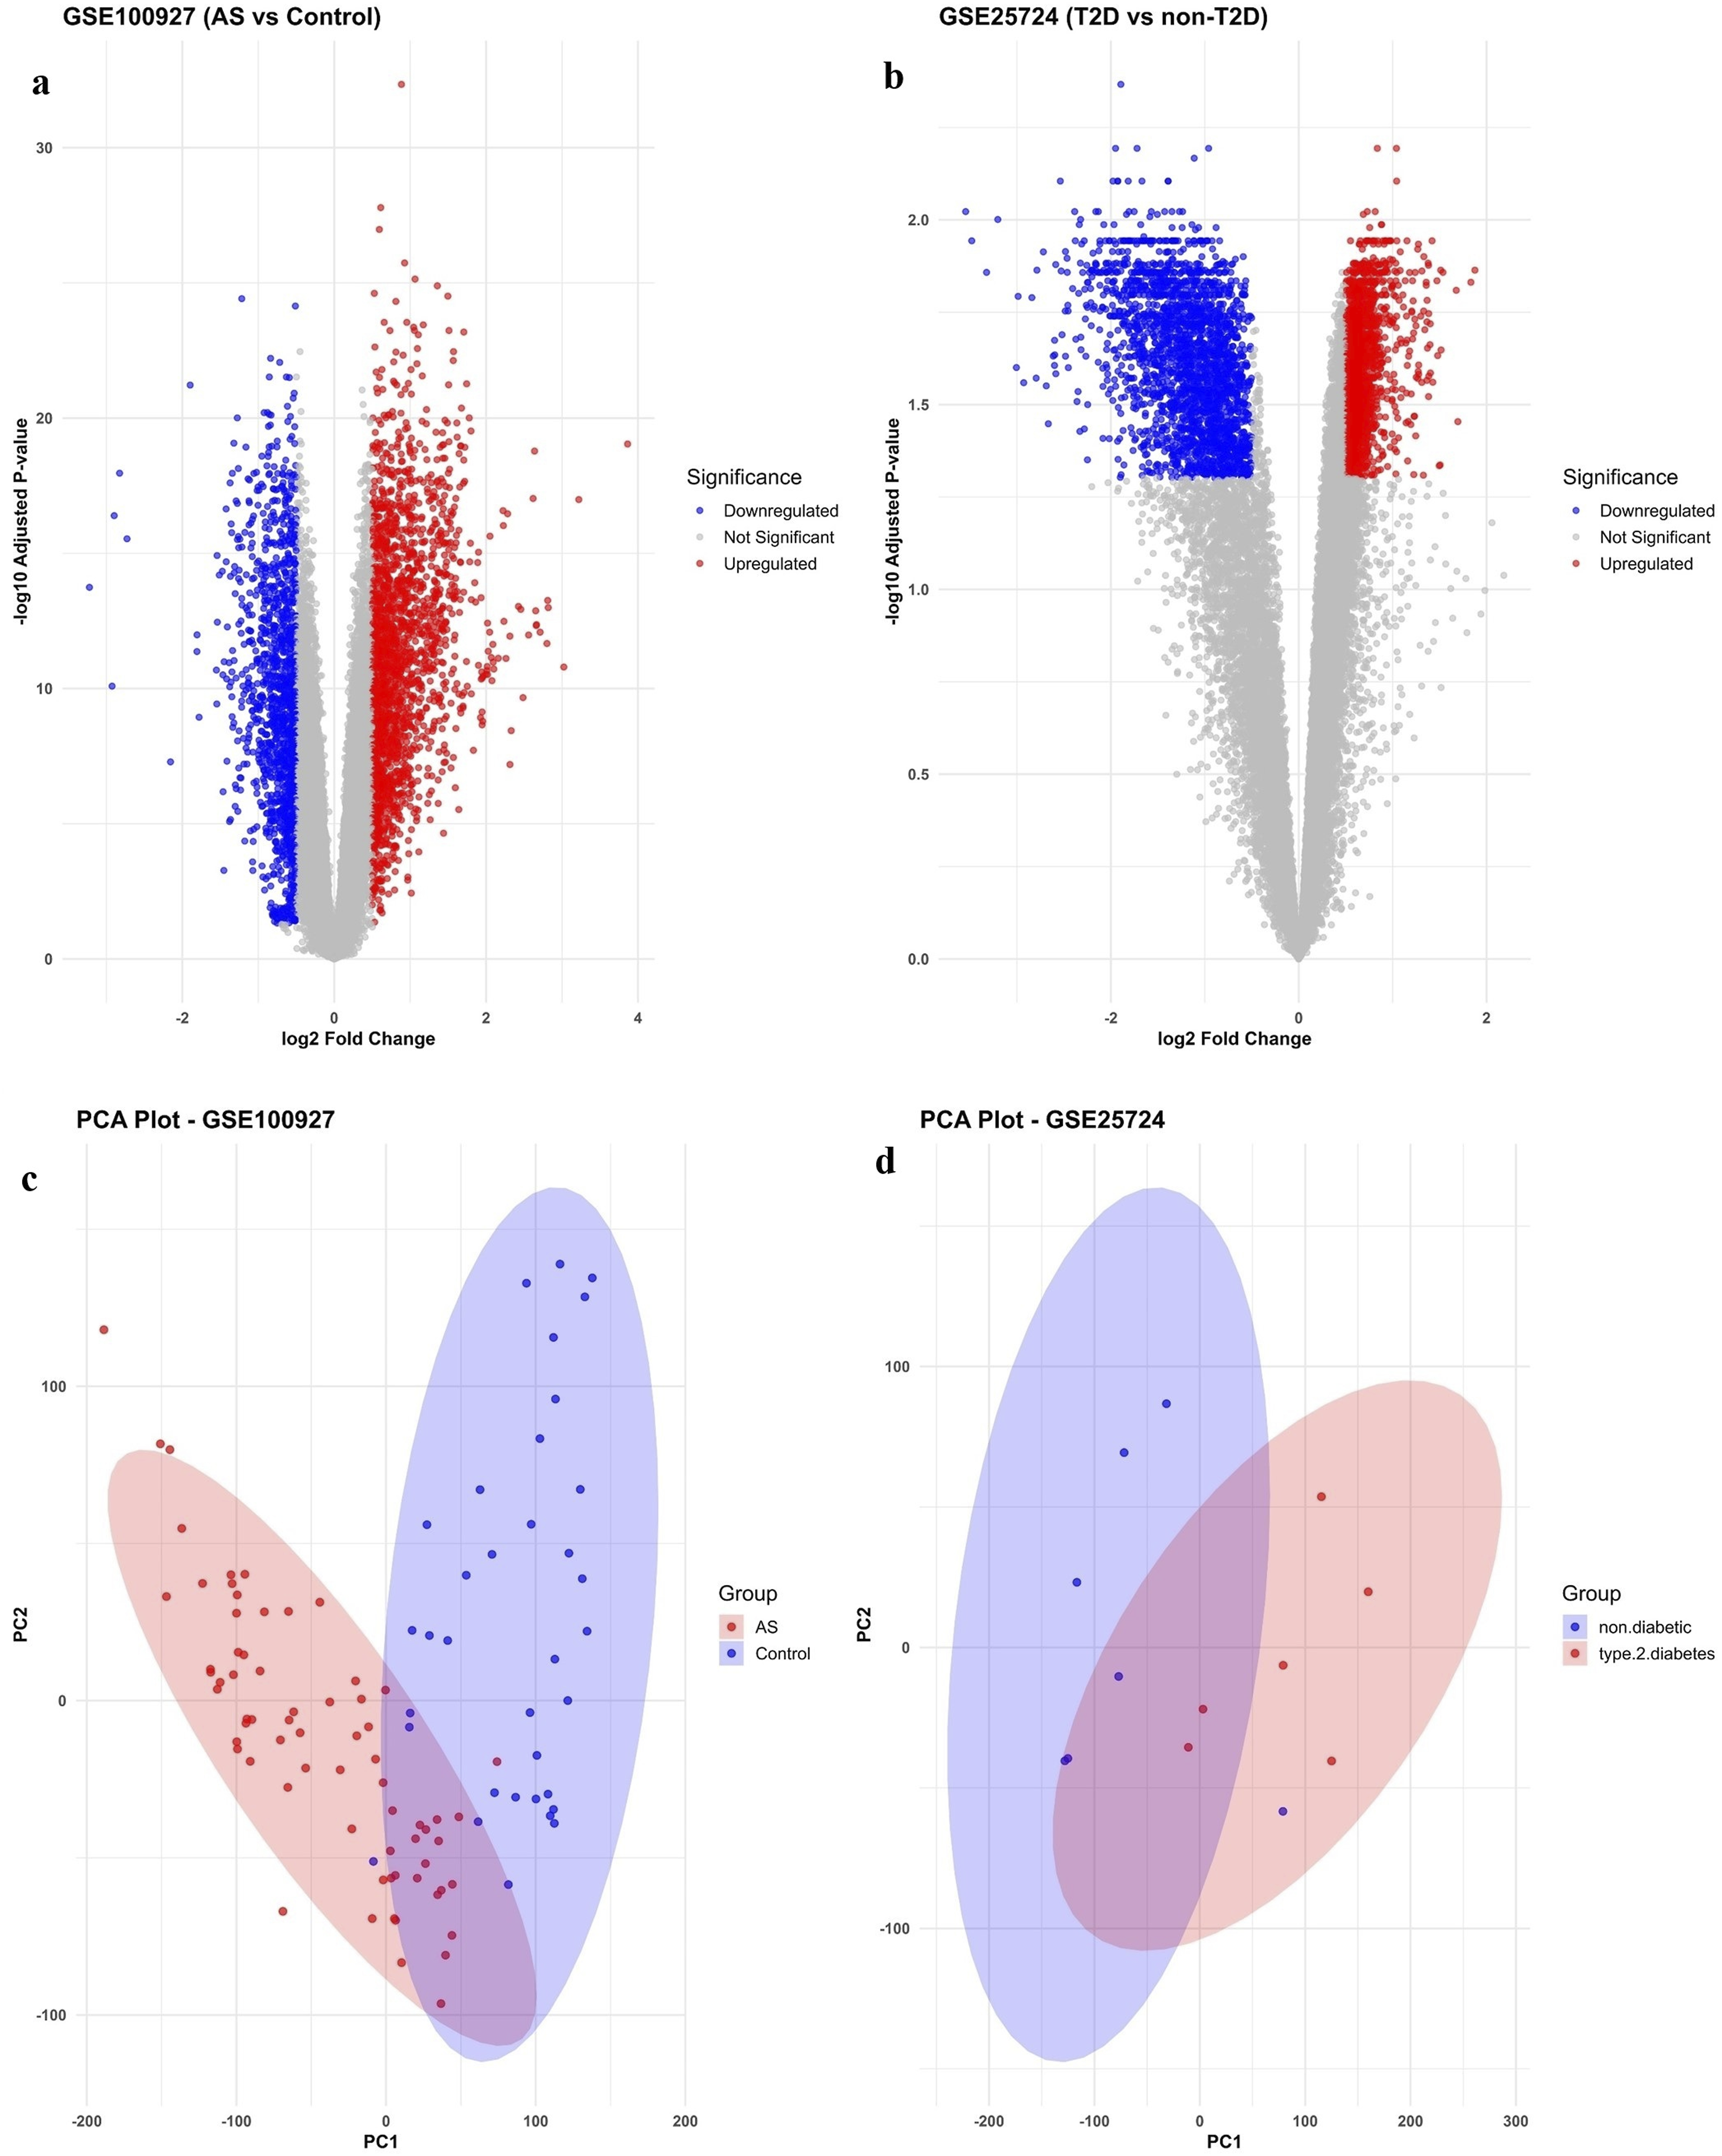
The large number of DEGs in both datasets underscores the extensive transcriptional remodeling associated with AS and T2DM. These findings established a foundation for subsequent functional enrichment and network-based analyses to delineate disease-specific and shared molecular pathways.
Functional enrichment of DEGs
Functional enrichment analysis, performed using the clusterProfiler package in R, identified key biological processes and pathways associated with DEGs in both datasets. In GSE100927 (AS), top-ranking genes such as CYHR1, TMEM79, DGKZ, FLJ90757, SGK223, ZSWIM3, ARHGAP27, MYBL1, and C2CD2L were significantly enriched in pathways primarily related to inflammation (e.g., cytokine–cytokine receptor interaction, NF-kappa B signaling), extracellular matrix (ECM) remodeling (e.g., ECM–receptor interaction), and lipid metabolism (e.g., cholesterol metabolism). These findings suggest the involvement of these DEGs in chronic inflammation, structural tissue remodeling, and lipid homeostasis, all of which are central to atherosclerotic disease progression (adjusted p < 0.05).
In GSE25724 (T2DM), top DEGs including SYBU, FUT6, SERBP1, HAX1, MFN1, EIF3A, TCEA1, SSR1, ERO1B, and AASDHPPT were functionally enriched in pathways related to protein translation and folding (e.g., EIF3A, SSR1, ERO1B, TCEA1), mitochondrial dynamics and lipid metabolism (e.g., MFN1, AASDHPPT), immune regulation and glycosylation (e.g., FUT6), and apoptosis regulation (e.g., HAX1). These genes were associated with biological processes such as the unfolded protein response, mitochondrial-mediated apoptosis, oxidative protein folding, and immune-related glycosylation, all with adjusted p < 0.05 (see Supplemental Table S1, and S2).
The convergence of enriched pathways—particularly those linked to inflammation and metabolic dysregulation—suggests the existence of shared molecular mechanisms underlying both T2DM and AS.
Weighted gene co-expression network analysis (WGCNA)
Weighted Gene Co-expression Network Analysis (WGCNA) was employed to identify gene co-expression modules associated with disease phenotypes in the GSE100927 (AS) and GSE25724 (T2DM) datasets. The analysis followed the methodology outlined in the section ‘Crosstalk gene identification' to ensure the generation of scale-free network topology and the detection of biologically relevant modules.
In GSE100927, a soft-thresholding power of β = 9 was selected to achieve scale-free topology (R2 > 0.85), as demonstrated by the scale independence plot (Supplemental Figure S1, (A)), which shows a rapid increase in R2 approaching the target threshold. The mean connectivity plot (Supplemental Figure S1, (B)) confirmed the adequacy of network connectivity at this threshold. A total of six modules were identified, each assigned a unique color. The module–trait relationship heatmap (Supplemental Figure S2) revealed significant correlations between modules and AS status. Notably, the blue module (correlation = 0.74, p = 2e-19) was enriched for genes involved in inflammatory response and lipid metabolism, while the turquoise module (correlation = 0.79, p = 2e-23) was enriched for genes associated with extracellular matrix remodeling and lipid metabolism. Hub genes from these modules (kME >0.8), representing nodes with high connectivity within the network, were merged with DEGs to construct the AS-specific gene set.
In GSE25724, a higher soft-thresholding power of β = 7 was chosen to account for the smaller sample size (n = 13), with the scale independence plot (Supplemental Figure S3, (A)) confirming that R2 > 0.9 was achieved at this threshold. Mean connectivity decreased as expected, supporting the suitability of this parameter (Supplemental Figure S3, (B)). Seven modules were identified, and the module–trait heatmap (Supplemental Figure 4) showed significant correlations with T2DM status. The black module (correlation = −0.78, p = 0.0002) was enriched for genes involved in insulin signaling and glucose metabolism, whereas the red module (correlation = 0.79, p = 0.001) was enriched for immune response and inflammatory signaling. Hub genes (kME >0.8) from these modules were integrated with DEGs to define the T2DM-related gene set. These module–trait relationships are illustrated in Supplemental Figures S2 and S4, demonstrating the strength and direction of association between co-expression modules and disease phenotypes.
Identification of crosstalk genes
Crosstalk genes—reflecting shared molecular signatures between T2DM and AS—were identified by intersecting gene sets related to each condition using the VennDiagram package in R. This intersection yielded 443 crosstalk genes,which were further filtered based on consistent expression directionality, high network connectivity (kME >0.8), and the presence of functional annotations. The overlap between the two gene sets is depicted in the Venn diagram (Supplemental Figure S5), highlighting the shared molecular framework underlying both diseases.
Functional enrichment analysis of crosstalk genes
Functional enrichment analysis of crosstalk genes—derived from the intersection of DEGs and WGCNA hub genes in GSE100927 and GSE25724—identified several pathways and biological processes relevant to the shared pathophysiology of AS and T2DM.
For the upregulated genes, KEGG pathway enrichment (Figure 3) revealed significant involvement in immune and infection-related processes, including “Lysosome” (GeneRatio = 0.08, adjusted p = 0.0005), “Osteoclast differentiation” (GeneRatio = 0.07, adjusted p = 0.001), “Tuberculosis”, “Influenza A″, and “Human T-cell leukemia virus 1 infection” (each with GeneRatio = 0.06, adjusted p = 0.002). GO Biological Process terms were enriched for immune activation processes such as “leukocyte mediated immunity” (GeneRatio = 0.14, adjusted p = 0.0001), “positive regulation of immune response” (GeneRatio = 0.12, adjusted p = 0.0002), “lymphocyte differentiation”, and “positive regulation of T cell activation.” In the GO Molecular Function category, enriched terms included “phospholipid binding”, “GTPase regulator activity”, and “MHC class II receptor activity”. GO Cellular Component enrichment indicated significant localization in lysosomal and vesicular compartments, including the “lysosomal membrane”, “vacuolar membrane”, and “secretory granule membrane”. These findings suggest that upregulated crosstalk genes are primarily involved in inflammatory and immune-related functions, as well as lysosomal activity and cellular signaling. Functional enrichment analysis of crosstalk genes.
For the downregulated genes, KEGG pathway analysis (Figure 4) pointed to pathways associated with muscle function and vascular regulation, such as “Cytoskeleton in muscle cells” (GeneRatio = 0.125, adjusted p = 0.03), “Regulation of actin cytoskeleton”, “TGF-beta signaling pathway”, “Vascular smooth muscle contraction”, and “Oxytocin signaling pathway”. GO Biological Process terms indicated enrichment in muscle and cardiac-related processes, including “muscle tissue development”, “regulation of cardiac muscle contraction”, and “cardiac chamber morphogenesis”. Molecular Function terms included “actin binding”, “phosphatase regulator activity”, and “transmembrane transporter binding”, while Cellular Component terms such as “focal adhesion”, “cell-substrate junction”, and “contractile muscle fiber” highlighted structural roles in cellular adhesion and contractility. Functional enrichment analysis of crosstalk genes.
Together, these results highlight a dual molecular signature among crosstalk genes, with upregulated genes primarily reflecting immune activation and lysosomal involvement, and downregulated genes associated with structural and functional alterations in muscle and vascular tissues—both of which are central to the pathogenesis of T2DM and AS.
Protein-protein interaction (PPI) network analysis
PPI networks were constructed using the STRING database, applying a confidence score threshold of >0.7 to ensure high-confidence interactions. This analysis was aimed at identifying hub genes among the crosstalk gene set. Ten hub genes exhibiting high network connectivity (degree >10) were identified, including ACTA1, MFN1, HLA-DRB1, CD4, JAK3, ZAP70, RUNX3, CD74, and HLA-DRA. These genes are functionally associated with key processes such as immune response, antigen presentation, and lysosomal activity, indicating their central roles in the molecular crosstalk between AS and T2DM (Supplemental Figure 6).
Biomarker prioritization using transfer learning
A pre-trained TabNet model was fine-tuned to prioritize crosstalk genes as potential biomarkers, following the methodology outlined in the section ‘TabNet-based prioritization'. For GSE100927, the model was trained on a cohort of 104 samples, utilizing a 70:30 train-test split, and achieved an area under the curve (AUC) of 0.85, sensitivity of 0.82, specificity of 0.78, and accuracy of 0.80. For GSE25724, due to the limited sample size (n = 13), the dataset was augmented using the Synthetic Minority Over-sampling Technique (SMOTE), and leave-one-out cross-validation (LOOCV) was applied, yielding an AUC of 0.79, sensitivity of 0.75, specificity of 0.71, and accuracy of 0.73.
Genes with high attention scores (>0.8), absolute log2 fold change (|log2FC| > 1), or module membership (kME > 0.8) were prioritized as biomarkers. A comprehensive list of these prioritized biomarkers, together with their biological roles and relevance to T2DM and AS, is provided in Supplemental Table S3. This structured presentation enhances clarity and facilitates interpretation of the candidate biomarkers.
Immune signature analysis
Immune cell deconvolution using CIBERSORTx and the LM22 reference matrix revealed distinct immunological landscapes in the GSE100927 and GSE25724 datasets, reflective of disease-specific immune responses. In GSE100927, atherosclerotic lesions showed significantly elevated fractions of M1 macrophages, T-helper cells, and neutrophils compared to control tissues (p < 0.05, Wilcoxon rank-sum test). In contrast, pancreatic islets from individuals with T2DM in GSE25724 exhibited increased levels of monocytes, regulatory T-cells, and B-cells (p < 0.05) (Figure 5). These patterns underscore the differential activation of pro-inflammatory and adaptive immune cells in AS and T2DM, respectively. Immune cell composition in atherosclerotic lesions and T2DM islets. (a) Comparison of immune cell fractions between atherosclerotic lesions and control arterial tissues (GSE100927). Boxplots demonstrate significantly elevated levels of M1 macrophages (p = 0.01), T-helper cells (p = 0.02), and neutrophils (p = 0.03) in lesion samples. (b) Comparison of immune cell fractions between T2DM islets and healthy controls (GSE25724). Boxplots indicate significantly increased proportions of monocytes (p = 0.01), regulatory T-cells (p = 0.02), and B-cells (p = 0.03) in diabetic samples.
Further analysis using Spearman’s correlation identified 18 crosstalk genes with significant associations to immune cell fractions (p < 0.05). Key genes such as MFN1, AASDHPPT, FUT6, and HAX1 demonstrated strong correlations with immune subsets including M1 macrophages, T-helper cells, neutrophils, monocytes, regulatory T-cells, and B-cells, with correlation coefficients ranging from −0.85 to 0.90. These genes are functionally implicated in immune regulation, glycosylation, and apoptosis. Enrichment analysis of these immune-correlated crosstalk genes revealed significant involvement in pathways such as the unfolded protein response (adjusted p = 0.02), mitochondrial-mediated apoptosis (adjusted p = 0.03), oxidative protein folding (adjusted p = 0.04), and immune-related glycosylation (adjusted p = 0.02), all indicative of key processes in immune and metabolic homeostasis.
Complementing these findings, PPI network analysis using the STRING database (confidence score >0.7) identified six immune-related hub genes with high connectivity (degree >10): MFN1, HLA-DRB1, LILRB2, FUT6, HAX1, CD74, and HLA-DRA. These genes are centrally involved in immune regulation, antigen presentation, lysosomal function, glycosylation, and apoptosis regulation, reinforcing their pivotal roles in the immunometabolic crosstalk that underpins both T2DM and AS.
Positive correlations (e.g., 0.85 for MFN1 with M1 macrophages) indicate that higher gene expression is associated with increased immune cell fractions. Negative correlations are not included in this sample but can be added if your data shows inverse relationships.
Discussion
This study provides a comprehensive integrative analysis of the molecular interplay between T2DM and AS by leveraging transcriptomic datasets (GSE100927 for AS and GSE25724 for T2DM) and combining differential expression analysis, WGCNA, immune deconvolution via CIBERSORTx, and a fine-tuned TabNet model. Our approach identified 443 crosstalk genes and revealed distinct immune landscapes, uncovering shared mechanisms of inflammation, metabolic imbalance, and vascular dysfunction that underpin T2DM-AS comorbidity. This integrative strategy advances current understanding of disease crosstalk and offers a robust framework for biomarker discovery and therapeutic development.
Crosstalk genes and shared molecular mechanisms
The identification of 443 crosstalk genes, derived from the intersection of DEGs and WGCNA hub genes, represents a pivotal step in elucidating the molecular nexus between T2DM and AS. These genes, selected for consistent expression patterns and strong connectivity (kME >0.8), were enriched in immune-associated pathways, including “leukocyte-mediated immunity” (GeneRatio = 0.14, adjusted p = 0.0001) and “lysosomal membrane” (GeneRatio = 0.1, adjusted p = 0.0004), as well as vascular pathways such as “vascular smooth muscle contraction” and “TGF-beta signaling” (GeneRatio = 0.075, adjusted p = 0.05). Protein-protein interaction network analysis identified hub genes, including HLA-DRB1, CD4, JAK3, ZAP70, and MFN1 (degree >10), implicating these molecules in immune regulation, antigen presentation, and mitochondrial function. Compared to Frostegård et al., 26 who emphasized OxLDL and inflammatory phospholipids as major immune activators, 26 our findings provide a more comprehensive molecular landscape, revealing novel lysosomal and mitochondrial pathways. Similarly, Fu et al. 27 reported 34 DEGs with a focus on CD4 and PLEK, 27 whereas our expanded panel encompasses additional pathways, including the “unfolded protein response” (adjusted p = 0.02), aligning with Gusev’s 28 insights on low-grade inflammation in AS. 28 In contrast to Soehnlein & Libby,29,30 who targeted specific cytokines such as IL-1β,29,30 our integrative strategy identifies a broader spectrum of molecular targets, providing deeper insight into T2DM-AS pathophysiology.
Immune signatures and disease interplay
Immune deconvolution using CIBERSORTx revealed distinct immunological profiles across T2DM and AS. In atherosclerotic lesions (GSE100927), elevated levels of M1 macrophages, T-helper cells, and neutrophils (p < 0.05) were observed, indicative of a pro-inflammatory microenvironment that favors plaque progression. Conversely, pancreatic islets from T2DM patients (GSE25724) exhibited increased monocytes, regulatory T-cells, and B-cells (p < 0.05), reflecting adaptive immune activation. 18 crosstalk genes, including MFN1, HLA-DRB1, and FUT6, displayed strong correlations with specific immune cell types (Spearman’s r = −0.85 to 0.90, p < 0.05), supporting the notion of immune-mediated crosstalk between the two diseases. Pathway enrichment analysis revealed involvement of “mitochondrial-mediated apoptosis” (adjusted p = 0.03), linking endoplasmic reticulum stress, beta-cell dysfunction, and plaque instability. Compared with Engelen et al., 31 who provided a broad description of immune involvement in AS, 31 and Frostegård, 26 who emphasized T-cell activation and OxLDL, 26 our study offers a more precise and gene-specific characterization of immune-metabolic interactions, complementing Gusev’s 28 observations on inflammation. 28
Biomarker prioritization and machine learning innovation
The fine-tuned TabNet model exhibited robust predictive performance (AUC = 0.85 for GSE100927, 0.79 for GSE25724) and prioritized biomarkers including BTK, ZAP70, JAK3, CD4, IL7R, and MFN1, selected based on high attention scores (>0.8), significant expression changes (|log2FC| > 1), and strong network connectivity (kME >0.8). These biomarkers are implicated in inflammation, insulin resistance, vascular pathology, and mitochondrial function. Relative to Fu et al., 27 who reported CD4 and PLEK as diagnostic markers, 27 our approach identifies a broader and more accurate panel of biomarkers. While Soehnlein & Libby29,30 concentrated on cytokines and lipid mediators,29,30 our analysis highlights novel targets, such as MFN1, underscoring potential avenues for therapeutic development. Despite the limited sample size in GSE25724 necessitating SMOTE, rigorous leave-one-out cross-validation (LOOCV) ensured the reliability of findings.
Originality and methodological advancements
The novelty of this study derives from its multi-omics integration, combining transcriptomics, WGCNA, immune deconvolution, and transfer learning through TabNet, enabling a detailed elucidation of molecular crosstalk between T2DM and AS. Unlike Frostegård, 26 who focused on general immune activation, 26 or Engelen et al., 31 who discussed immunotherapeutic challenges, 31 our study identifies specific crosstalk genes and immune signatures. Fu et al. 27 examined only 34 DEGs without employing machine learning, 27 limiting mechanistic insight. By contrast, our comprehensive gene panel and integrative approach provide higher-resolution molecular and immune-level insights, surpassing prior studies by Gusev et al. 28 and Libby et al. 30 regarding inflammation and emerging risk factors.28,30
Strengths and limitations
The strengths of this study lie in its integrated design, careful data processing (including quantile normalization and PCA-based outlier removal), and validation using independent datasets (GSE30169 and GSE26168). The discovery of new lysosomal and mitochondrial pathways further enhances its value. However, there are limitations. The small sample size in GSE25724 reduces statistical power, and the use of bulk RNA-seq limits the ability to detect changes at the individual cell level. In addition, relying on public GEO datasets may introduce batch effects. As with similar studies, experimental validation using methods such as qPCR or proteomics is needed to confirm these results. An important limitation of our study lies in the inherent biological disparity between pancreatic islets and vascular tissues. These two tissue types differ markedly in their cellular composition, physiological functions, and microenvironmental contexts, which complicates direct comparisons. Therefore, the observed overlaps in gene expression may partly reflect systemic inflammatory or metabolic stress responses rather than direct causal mechanisms linking the two diseases. While this limitation does not invalidate the concept of shared molecular signatures, it underscores the need for caution in interpreting “crosstalk genes” and highlights the importance of future validation in matched tissue models or single-cell data.
Another important limitation of our study is that the transcriptomic datasets analyzed represent single time points. As such, our findings capture static snapshots of gene expression rather than dynamic changes that occur during disease initiation, progression, or resolution. This constraint limits the ability to infer causal trajectories or temporal ordering of molecular events in T2DM-associated atherosclerosis. Future studies incorporating longitudinal or time-series multi-omics data will be essential to unravel the dynamic nature of disease progression and to validate whether the identified crosstalk genes and immune signatures remain consistent across different disease stages.
A further limitation of our study relates to the use of CIBERSORTx for immune cell deconvolution. This method is based on bulk RNA-seq data and predefined reference signatures, which may not fully reflect the true cellular heterogeneity present in complex or inflamed tissues such as atherosclerotic lesions. As a result, the estimated immune cell proportions should be interpreted with caution, recognizing the potential influence of reference bias and the inability to resolve subtle or rare immune populations. To overcome this limitation, future work incorporating single-cell RNA sequencing, spatial transcriptomics, or multimodal profiling will be invaluable for more precise characterization of immune landscapes in T2DM-associated atherosclerosis.
Implications and future directions
Our integrative analysis highlights 443 crosstalk genes and hub regulators including HLA-DRB1, JAK3, MFN1, CD4, and ZAP70, reflecting disease-specific immunometabolic signatures. Machine learning-based prioritization identified MFN1, BTK, and ZAP70 as novel diagnostic candidates. Future studies should focus on: (i) experimental validation via molecular and proteomic assays, (ii) high-resolution single-cell and spatial transcriptomics to characterize cellular heterogeneity, and (iii) longitudinal multi-omics to capture dynamic disease trajectories. These strategies will enhance translational relevance and support precision therapeutic development.
Conclusion
This study is the first to identify 443 crosstalk genes and immune signatures linking T2DM and AS, revealing novel lysosomal and mitochondrial pathways through a combined multi-omics and machine learning approach. This study not only delineates the shared molecular mechanisms of T2DM-associated AS but also provides a translational roadmap. By highlighting hub genes, immune signatures, and prioritized biomarkers with strong predictive power, we establish a foundation for future experimental validation and clinical translation. The integration of single-cell technologies and multi-omics profiling will be essential next steps to move from discovery to precision medicine.
Supplemental Material
Suppplemental Material - A novel multi-omics–machine learning pipeline reveals immune and metabolic links between type 2 diabetes and Atherosclerosis
Suppplemental Material for A novel multi-omics–machine learning pipeline reveals immune and metabolic links between type 2 diabetes and Atherosclerosis by Lili Shi, Yingying Xu, Huijing Zhai, Chao Zhao, Wenbo Xia, Yi Zheng, Guangjin Qu, Lin Geng, Xinyu Li in Diabetes & Vascular Disease Research.
Footnotes
Ethical consideration
This study involves no human or animal participants.
Author contributions
Lili Shi, Yingying Xu, and Huijing Zhai contributed to the conceptualization and design of the study. Chao Zhao, Wenbo Xia, and Yi Zheng collected and preprocessed the data. Guangjing Qu and Lin Geng performed the data analysis and interpretation. Xinyu Li supervised the overall study, provided critical revisions, and was responsible for project administration. All authors participated in manuscript writing and approved the final version of the manuscript.
Funding
The authors received no financial support for the research, authorship, and/or publication of this article.
Declaration of conflicting interests
The authors declared no potential conflicts of interest with respect to the research, authorship, and/or publication of this article.
Data Availability Statement
All relevant data are within the manuscript and its Supporting Information files.
Supplemental Material
Supplemental material for this article is available online.
References
Supplementary Material
Please find the following supplemental material available below.
For Open Access articles published under a Creative Commons License, all supplemental material carries the same license as the article it is associated with.
For non-Open Access articles published, all supplemental material carries a non-exclusive license, and permission requests for re-use of supplemental material or any part of supplemental material shall be sent directly to the copyright owner as specified in the copyright notice associated with the article.