
Abstract
Background
Prediabetes (PDM) and diabetes mellitus (DM) are common among acute coronary syndrome (ACS) patients. The present study evaluated the association between diabetes status and radial artery (RA) atherosclerosis using optical coherence tomography (OCT) in ACS patients.
Methods
A total of 335 ACS patients who underwent RA OCT were categorized into the DM group, the PDM group, and the normal glucose metabolism (NGM) group. OCT characteristics and clinical variables were compared.
Results
RA atherosclerotic plaques were more frequent in the PDM and DM groups than in the NGM group (38.7% vs. 33.3% vs. 16.1%, p = 0.001). Lipid and calcified plaque occurrence were significantly more common in the DM group, followed by the PDM and NGM groups (19.3% vs. 14.6% vs. 6.5%, p = 0.027; 11.8% vs. 6.5% vs. 1.1%, p = 0.009). The prevalence of microvessels in the PDM group was significantly higher (42.7% vs 23.7%, p = 0.017) than in the NGM group but was comparable to the DM group. Multivariate analysis revealed that HbA1c level and age were independent predictors of RA plaque formation and eccentric intimal hyperplasia (all p<0.05).
Conclusions
RA atherosclerosis characteristics differ according to diabetes status. HbA1c level could be a useful marker for RA atherosclerosis progression in ACS patients.
Keywords
Key messages
- Patients with DM and PDM were more likely to have RA atherosclerosis than those with normal glucose levels. - RA OCT characteristics differ according to glycemic status. - HbA1c level may be a useful marker for RA atherosclerosis progression in patients with ACS.
Introduction
Cardiovascular disease is the leading cause of death in patients with diabetes mellitus (DM), and approximately one-fourth of patients who develop acute coronary syndrome (ACS) have DM. 1 Coronary artery bypass grafting (CABG) has been demonstrated to improve long-term outcomes after ACS in DM patients with multivessel coronary disease.2-4 The radial artery (RA) is considered as a second arterial conduit for CABG due to its efficacy and safety. 5 However, previous studies demonstrated that radial arteries are associated with some degree of atherosclerosis which may have a detrimental effect on graft patency or render them unsuitable as a graft in CABG.6-8 Although DM is a known risk factor for silent RA atherosclerosis,6,9,10 the incidence of RA atherosclerosis in patients with DM has not been widely investigated. Several methods have been used to evaluate RA atherosclerosis including ultrasonography, 11 intravascular ultrasound (IVUS), 12 and harvested radial artery pathology, 6 but their role in detecting atherosclerosis is limited by their poor spatial resolution or presence of pathology in the discarded distal segments of the RA.
Optical coherence tomography (OCT) is a high-resolution imaging technique that has been well established for evaluating vulnerable coronary plaques in patients with ACS. 13 Its utility for the evaluation of RA atherosclerotic plaque was confirmed by a previous validation study in which RA atherosclerotic plaque components and tissue layers were identified by OCT and which reported high agreement with histological results. 14
In this study, we compared RA atherosclerosis among diabetic and non-diabetic patients with ACS using OCT. We also investigated whether DM duration had any negative effects on plaque characteristics in diabetic ACS patients.
Methods
Patient population
A total of 462 consecutive patients with ACS who underwent RA OCT after coronary OCT at our institute between March 2019 and December 2020 were enrolled in the present study. The study flowchart is shown in Figure 1. Clinical data such as age, sex, and classic risk factors for atherosclerosis were collected. The study population was stratified according to three glycemic categories in accordance with the definition by the American Diabetes Association
15
: DM group [(self-reported type 2 DM, hemoglobin A1c (HbA1c) >6.4% (47 mmol/mol), and/or use of insulin)], prediabetes group [(PDM, no self-reported type 2 DM and HbA1c of 5.7%–6.4% (39–47 mmol/mol)], and normoglycemia group [NGM, no self-reported type 2 DM and HbA1c < 5.7% (39 mmol/mol)].
16
The HbA1c levels in whole blood were routinely measured in all patients using high-performance liquid chromatography with ELUENT 80A (ARKRAY, IN, Japan). Patients with type 2 DM were further divided into two subgroups: long-DM group (DM duration ≥ 10 years) and short-DM group (DM duration <10 years). All laboratory data were collected during fasting throughout the hospitalization period. Written informed consent was obtained from all the patients. This study was performed in accordance with the Declaration of Helsinki and was approved by the ethics committee of the Beijing Luhe Hospital, Capital Medical University (Beijing, China). Study flowchart.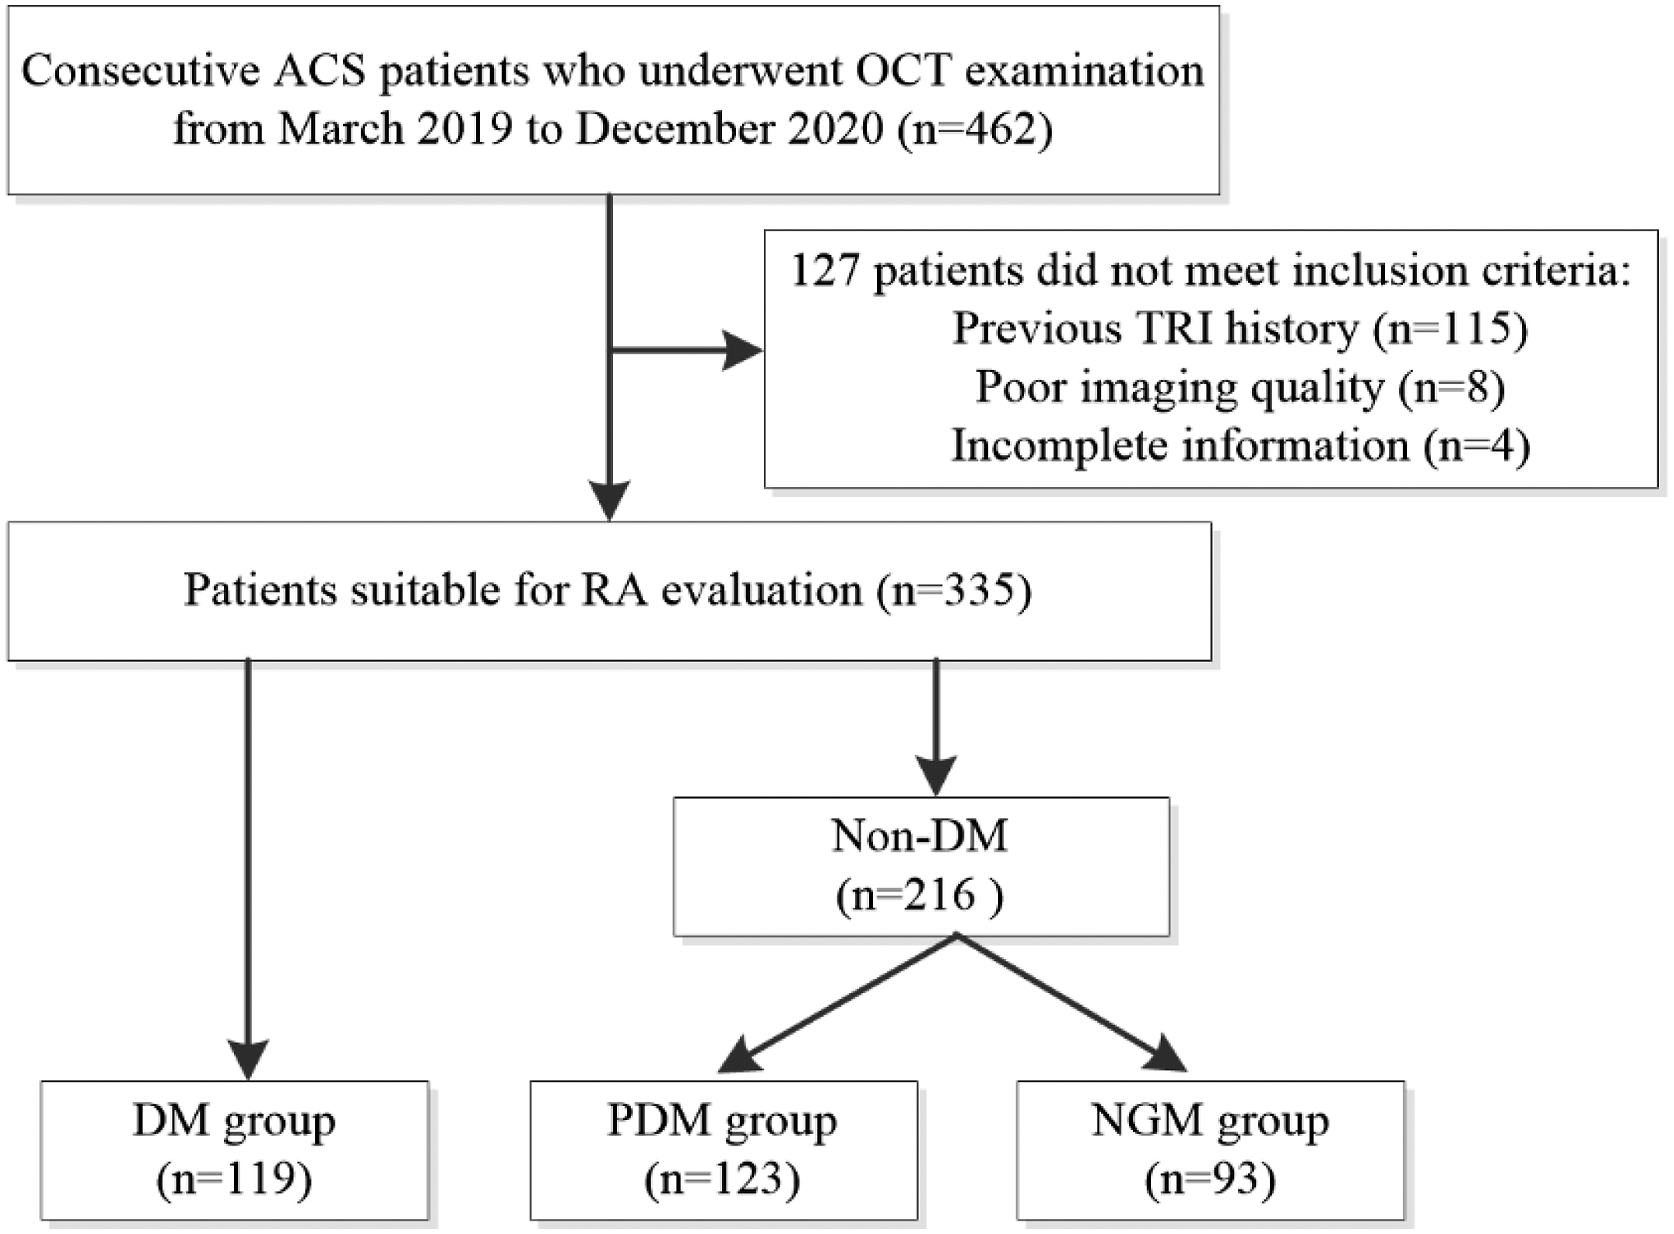
OCT image acquisition
After a 6F sheath (Terumo Co, Tokyo, Japan) was inserted at the default vascular access of the right RA, coronary angiography and percutaneous coronary intervention were performed with 6 Fr catheters. Upon completion of the coronary procedure, the protocol described below (Figure 2) was implemented to perform OCT imaging of the RA. Three OCT pullback recordings (20 mm/s) including proximal (0–50 mm), middle (50–100 mm), and distal (100–150 mm) portions were acquired using saline to flush the RA. The OCT procedure was performed using a C7XR FD-OCT system (St. Paul, MN, USA). Algorithm for radial artery OCT imaging. OCT = optical coherence tomography; RA = radial artery; RAA = radial artery angiography.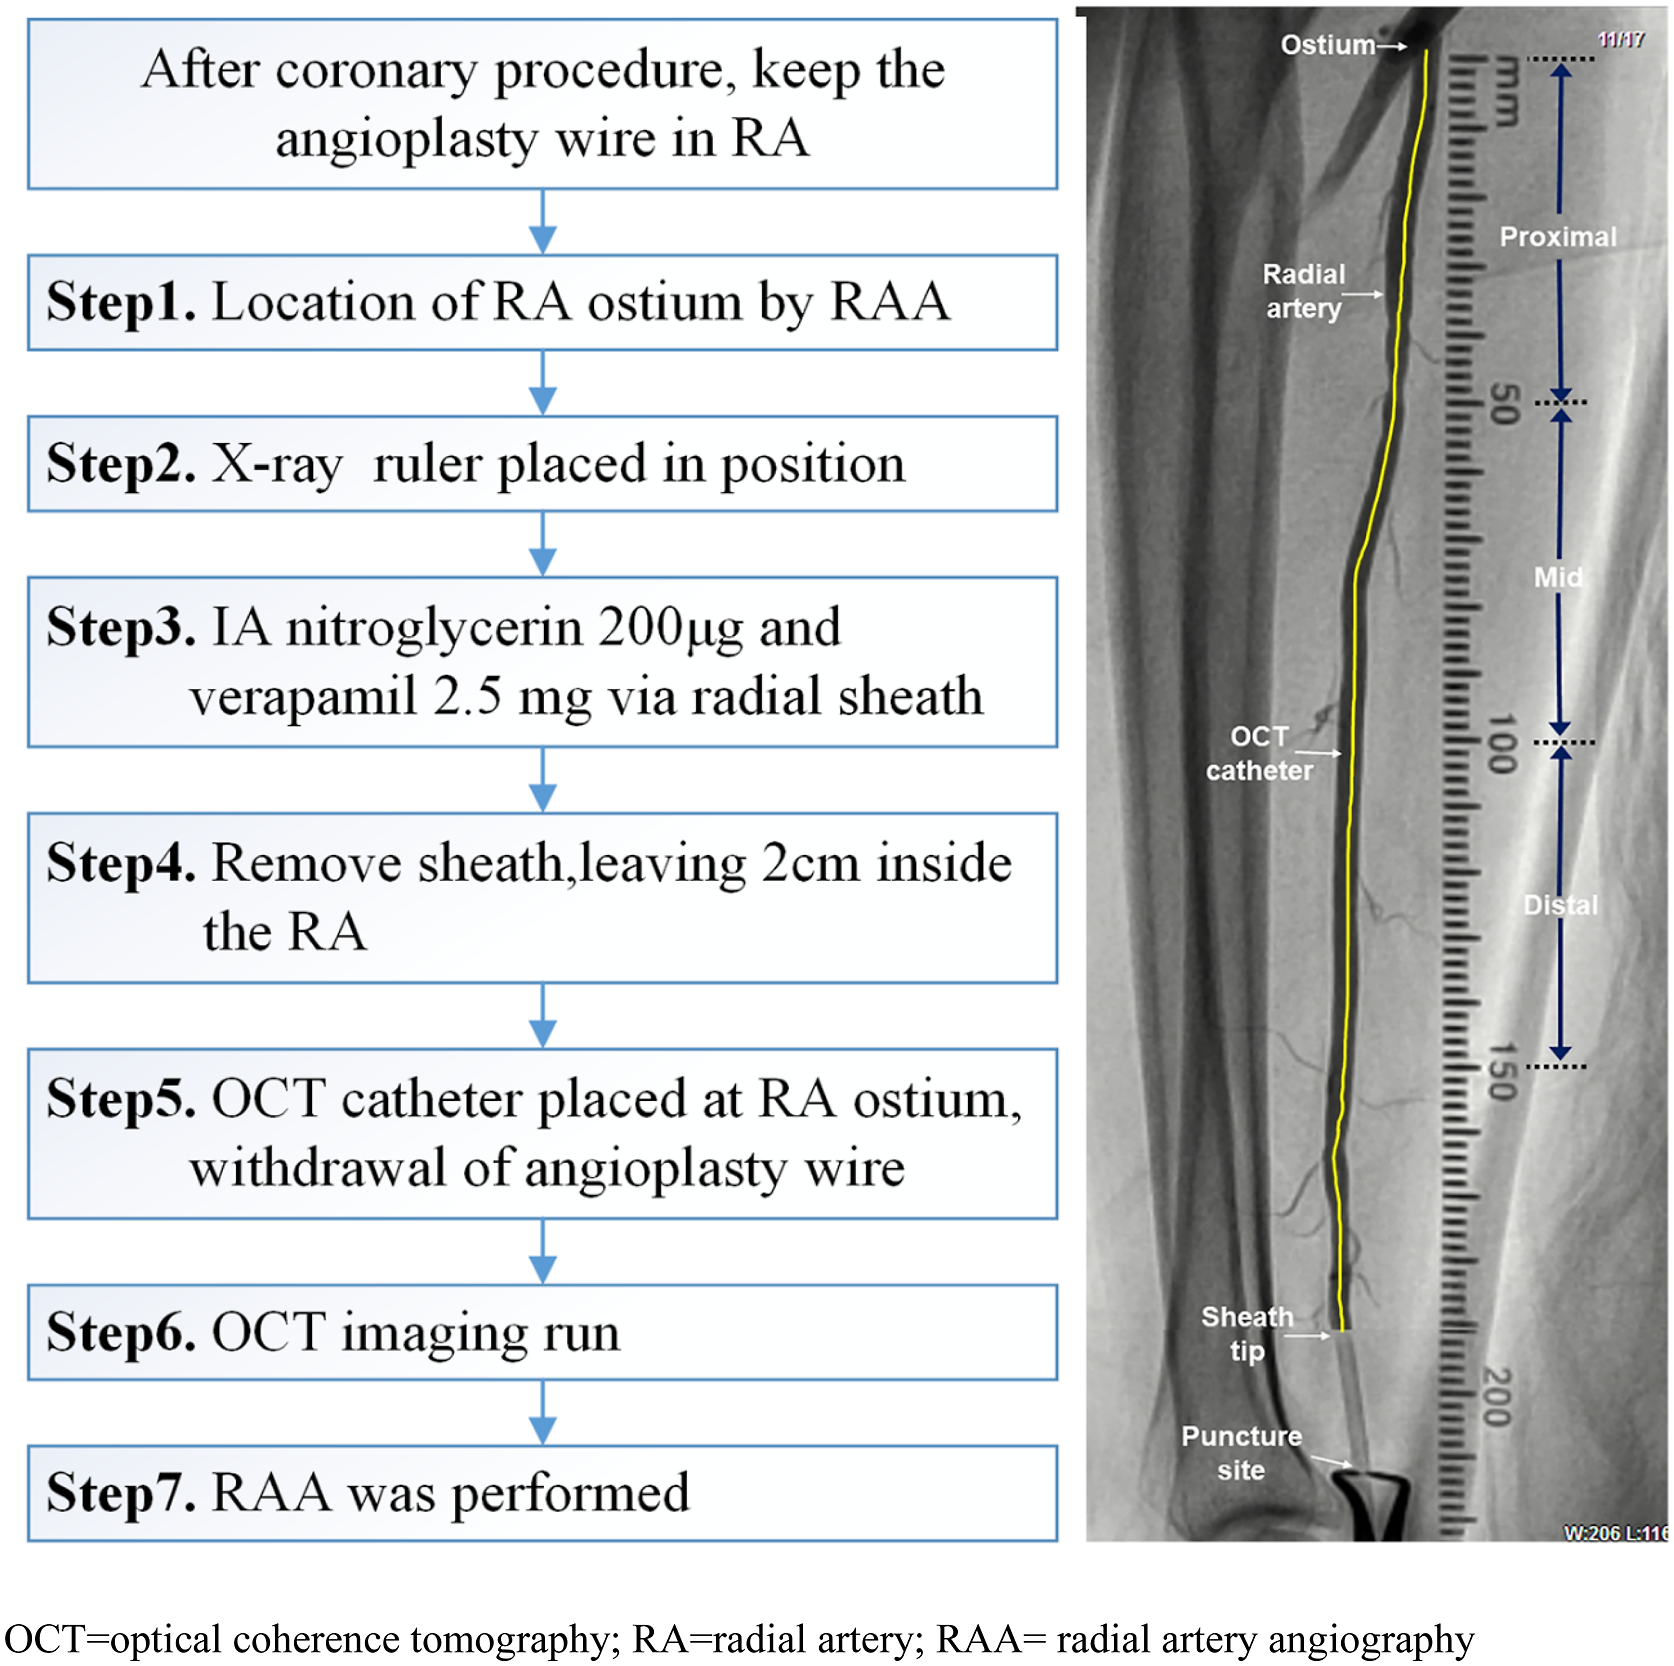
OCT image interpretation
The OCT image analysis was performed using proprietary software (LightLab Imaging), and the correct calibration settings for Z-offset were confirmed by two independent and experienced readers (TZ, LZX) who were unaware of the clinical data.
The RA imaging characteristics were based on the current OCT consensus standard.
17
In this study, atherosclerotic plaques were defined and classified into three categories
17
: (1) fibrous plaques were defined by a homogeneous signal and high backscattering region; (2) lipid plaques were defined by a low-signal region with a diffuse border; and (3) calcified plaques were defined as a plaque containing calcium deposits (signal-poor regions with sharply delineated borders). Representative images are shown in Figure 3. The longitudinal length of each plaque was assessed, and two plaques were seen as separated when their distance was more than 10 mm in the longitudinal view. For lipid plaques, the fibrous cap thickness (FCT) and maximal lipid arc were measured three times at the thinnest part, and the average value was calculated. When lipid deposits were present at ≥ 90 in any of the cross-sectional images within the plaque, it was considered a lipid-rich plaque. A TCFA was defined as an FCT thickness of ≤65 μm in a lipid-rich plaque on cross-sectional imaging.
18
Calcium deposits were analyzed individually by measuring calcium longitudinal length, arc, and depth. The maximum calcium arc, maximal depth, and FCT of the calcific plaques were analyzed. Spotty calcification was defined plaques with a length of <4 mm and a maximal arc of <90°. Microvessels were defined as black holes with diameters of 50–300 μm that were sharply delineated for at least three consecutive frames. Macrophage infiltration was defined as signal-rich, distinct, or confluent punctuate regions that exceed the intensity of background speckle noise.
17
The severity of intimal hyperplasia in RA has been reported previously6,10,19 (Supplemental Methods). Representative cross-sectional optical coherence tomography images. (A) Normal RA wall shows a 3-layered architecture. (B) The microvessel (arrow) present in a patient with PDM. (C) The macrophage (arrows) present in a DM patient with long disease duration. (D) Fibrous plaque identified as a homogeneous, highly backscattering region (arrow). (E) The representative case of lipid-rich plaque. The fibrous cap thickness overlying a lipid-rich plaque was 80 μm at its thinnest part (arrow). (F) Calcified plaque identified by the presence of a well-delineated, low-backscattering heterogeneous region (asterisk). DM = diabetes mellites; NGM = normoglycemia; PDM = prediabetes.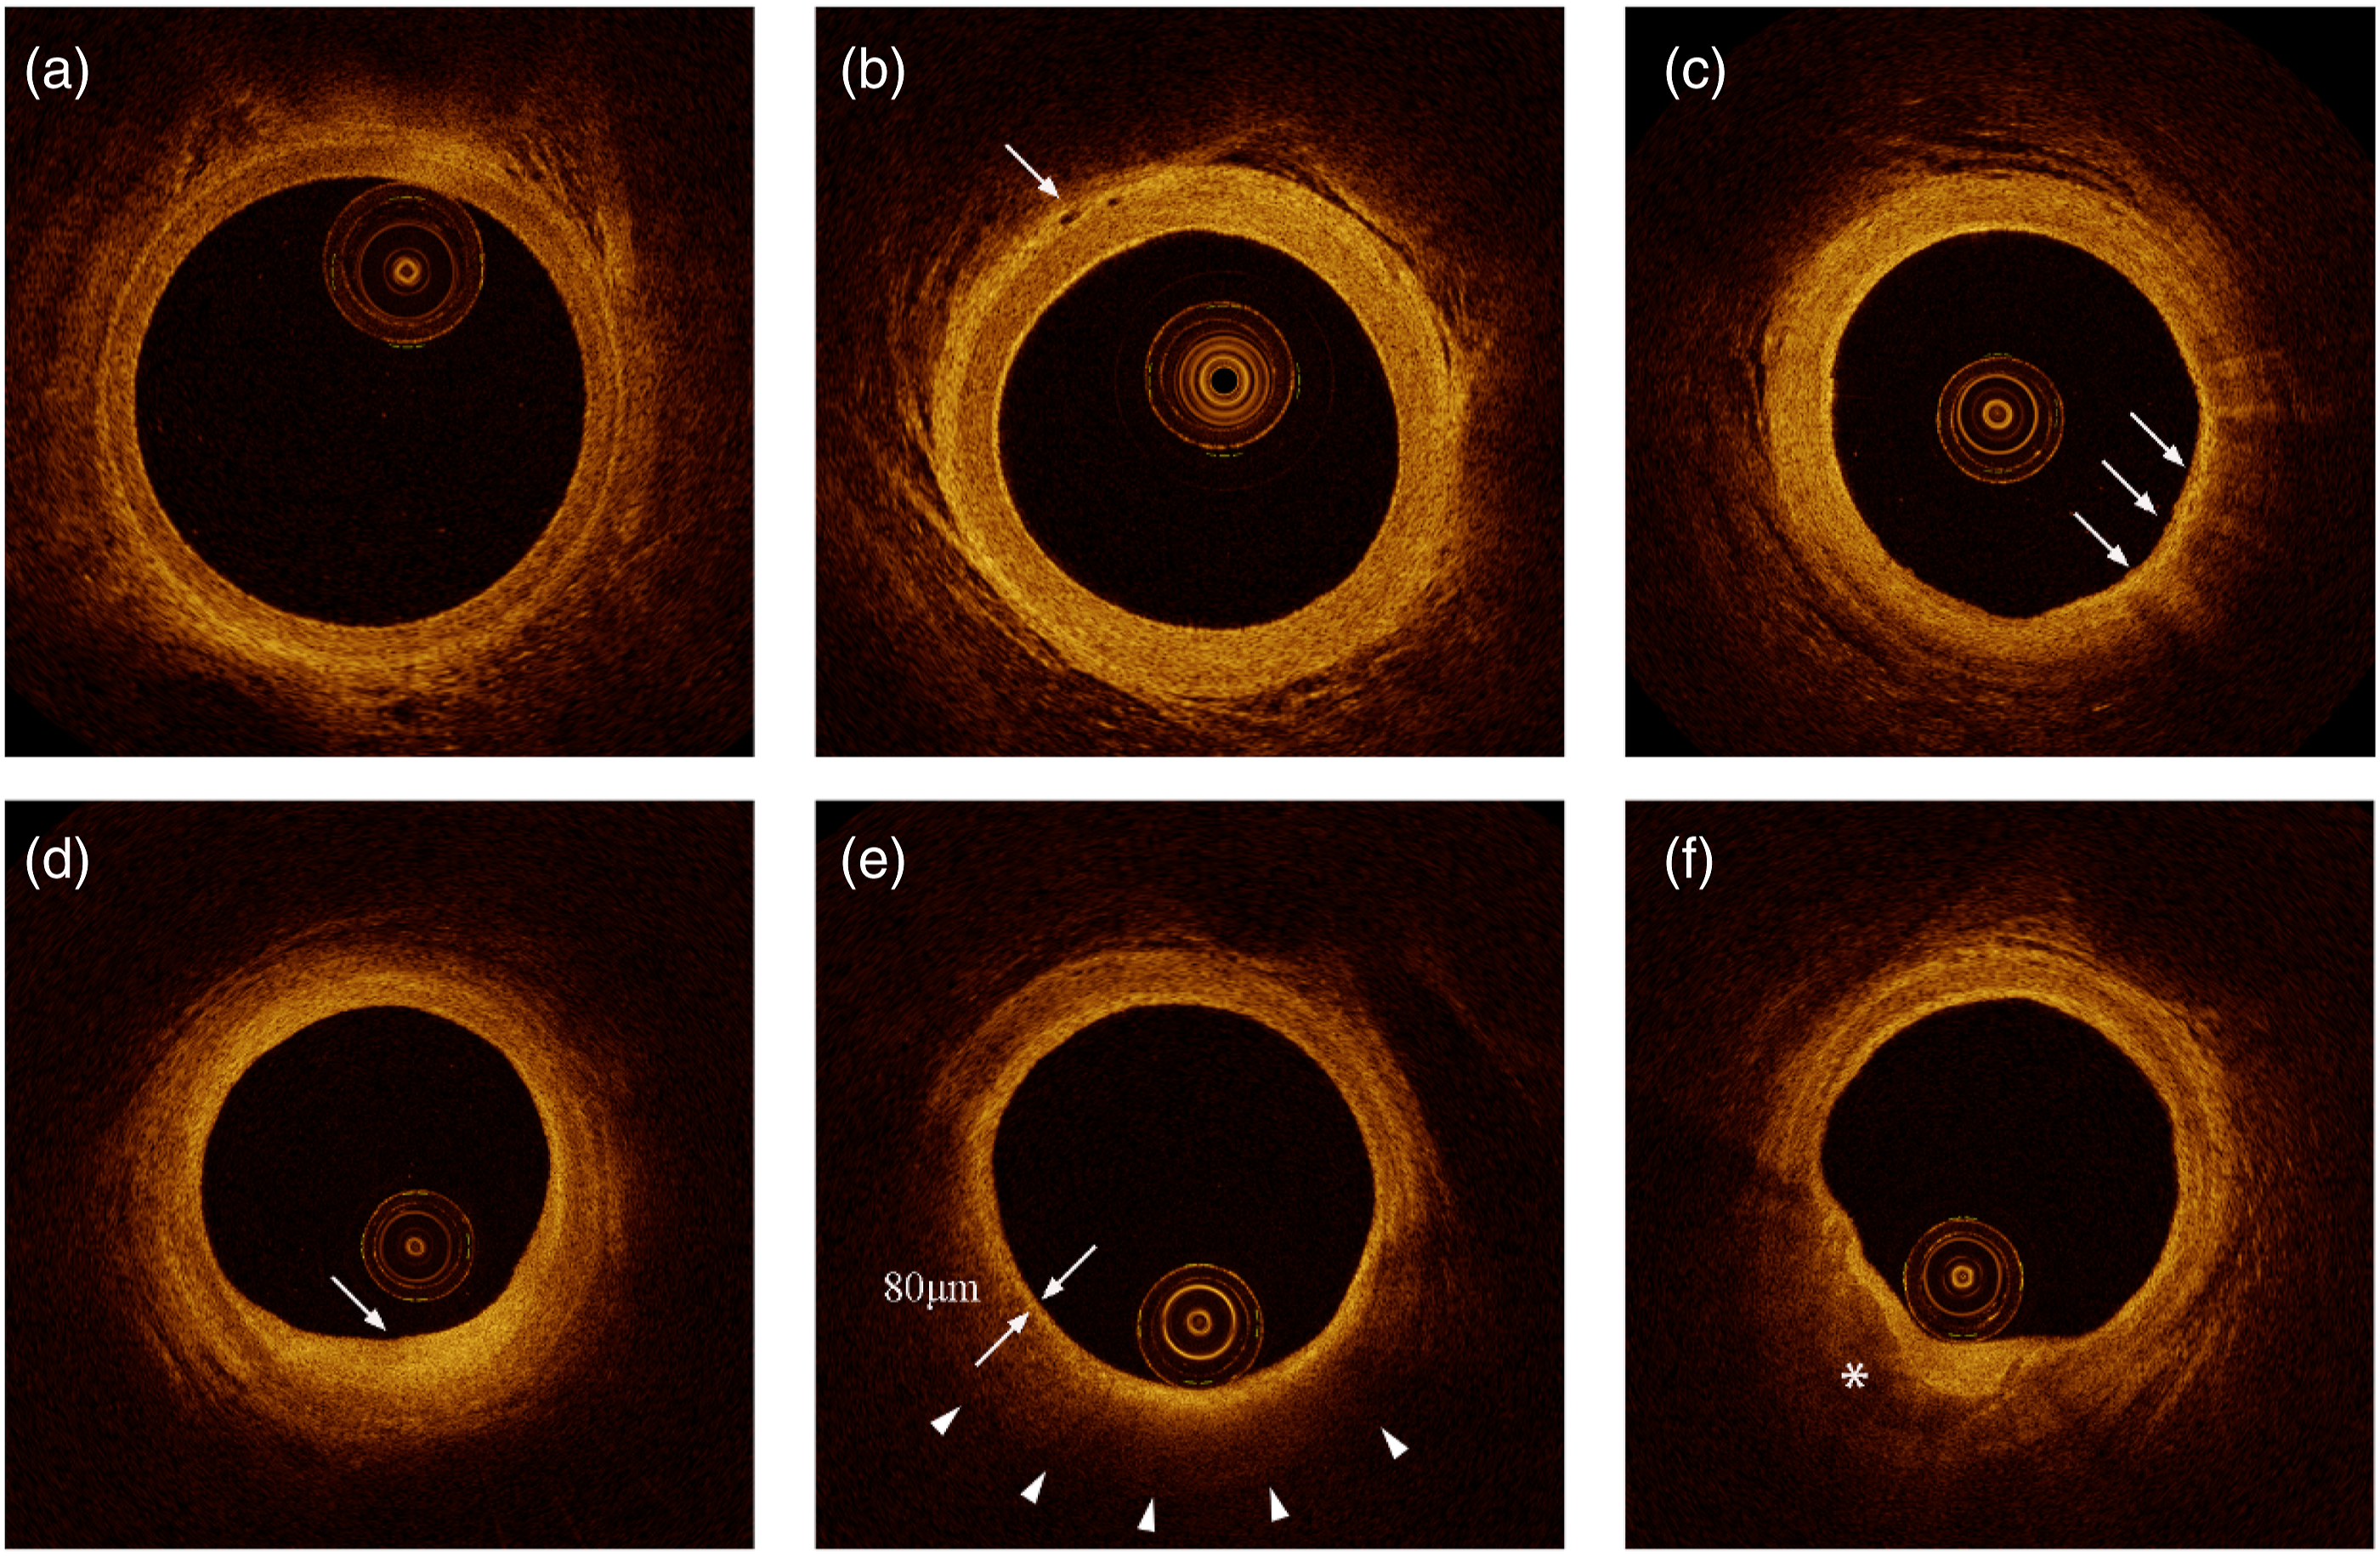
Reproducibility of qualitative OCT assessment
An author (TZ) who was blinded to clinical, angiographic, and OCT data selected 50 cases after all annotations on OCT images were deleted. For the inter-observer variability assessment, two experienced OCT observers (LZX and TZ) interpreted the 50 OCT cases, and then an OCT observer (LZX) assessed them again at 4-week intervals. The inter- and intra-observer kappa coefficients for the plaque presence and plaque phenotypes were 0.919∼0.975.
Statistical analysis
Statistical analysis was performed using SPSS (version 23.0; IBM Corp., Armonk, New York). Categorical variables were expressed as numbers (percentages). Continuous variables were presented as mean ± standard deviation. The normality of variables was assessed using the Shapiro–Wilk test. Categorical variables were compared using the x2 test. Continuous variables were compared using the Mann–Whitney U test, one-way analysis of variance (ANOVA), or Kruskal–Wallis ANOVA on ranks as appropriate. Further multiple comparison analysis was performed to analyze within-group differences; the post-hoc Scheffe method was chosen for continuous data, and the Bonferroni method for categorical data. The association between RA plaque presence and traditional risk factors or biochemical biomarkers was assessed using multivariate analysis. All variables with p < 0.1 in univariable analysis were entered en bloc in the multivariable model. Variables with significant contribution to the regression model were kept in the combination models and were plotted with a receiver-operating characteristic (ROC) curve. A two-tailed p value of <0.05 was considered statistically significant.
Results
Study populations and baseline characteristics
Baseline patient characteristics.
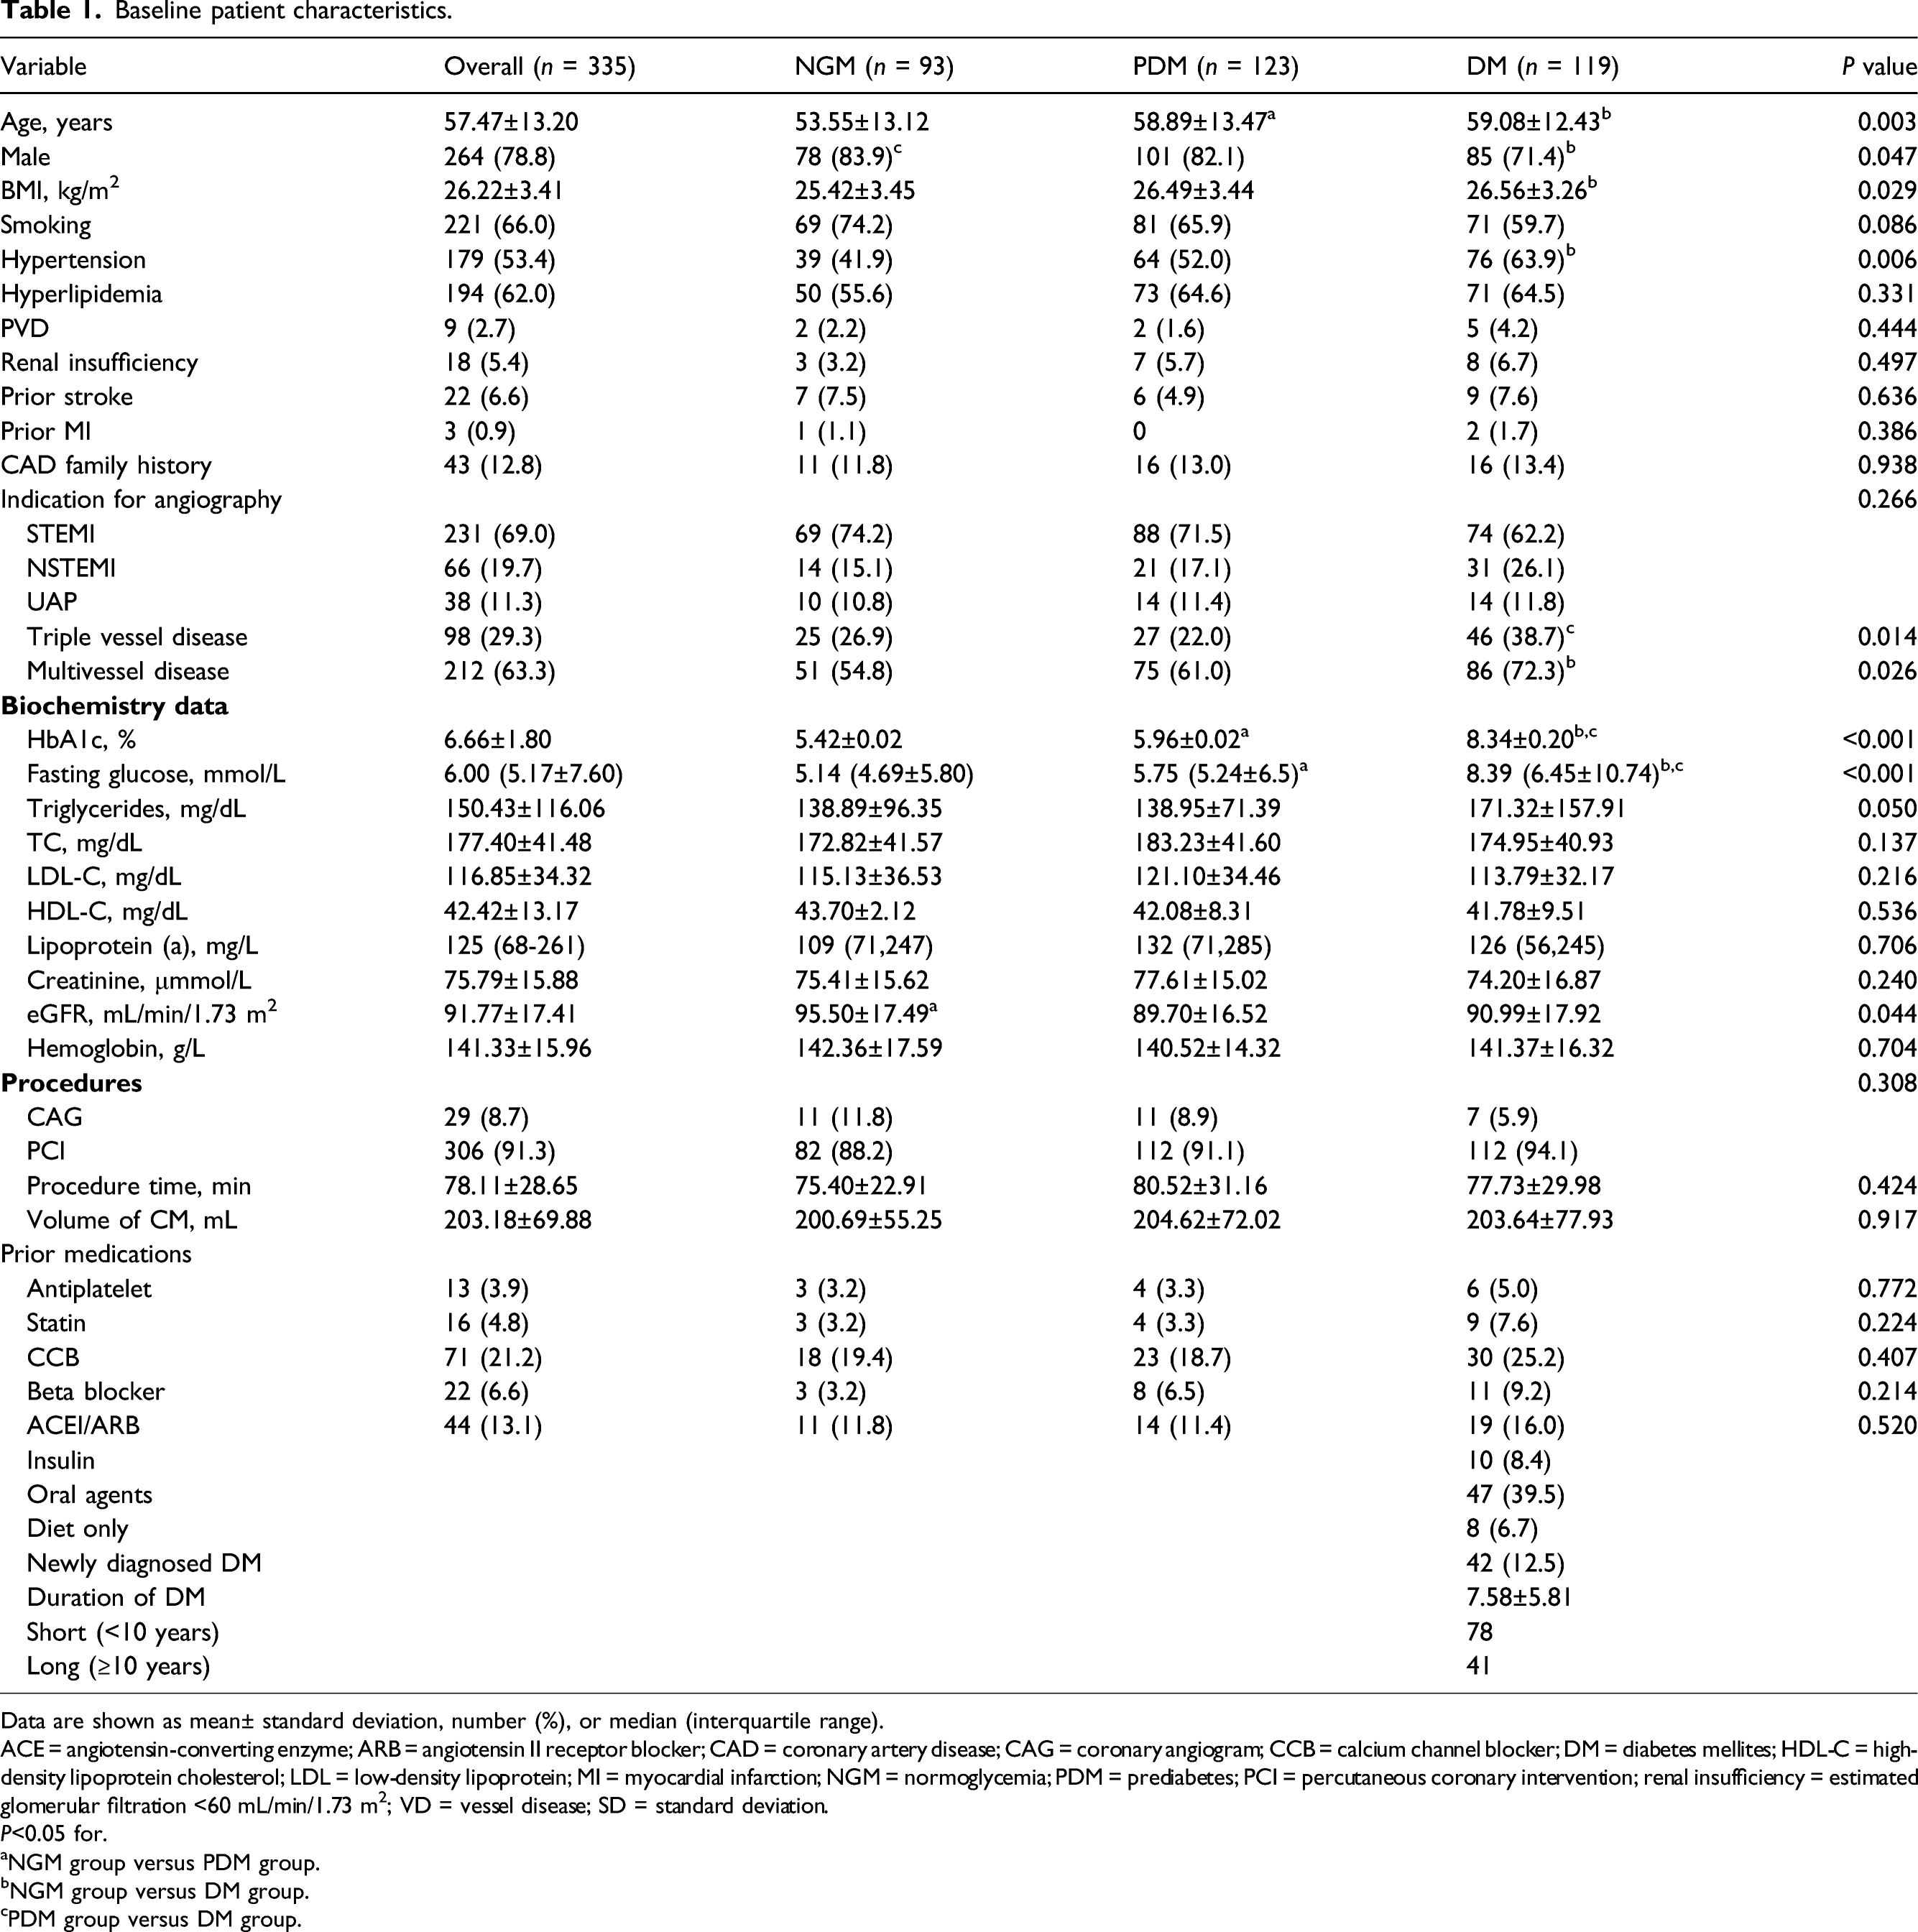
Data are shown as mean± standard deviation, number (%), or median (interquartile range).
ACE = angiotensin-converting enzyme; ARB = angiotensin II receptor blocker; CAD = coronary artery disease; CAG = coronary angiogram; CCB = calcium channel blocker; DM = diabetes mellites; HDL-C = high-density lipoprotein cholesterol; LDL = low-density lipoprotein; MI = myocardial infarction; NGM = normoglycemia; PDM = prediabetes; PCI = percutaneous coronary intervention; renal insufficiency = estimated glomerular filtration <60 mL/min/1.73 m2; VD = vessel disease; SD = standard deviation.
P<0.05 for.
NGM group versus PDM group.
NGM group versus DM group.
PDM group versus DM group.
OCT findings
Optical coherence tomography features of the RA stratified according to glycemic status.
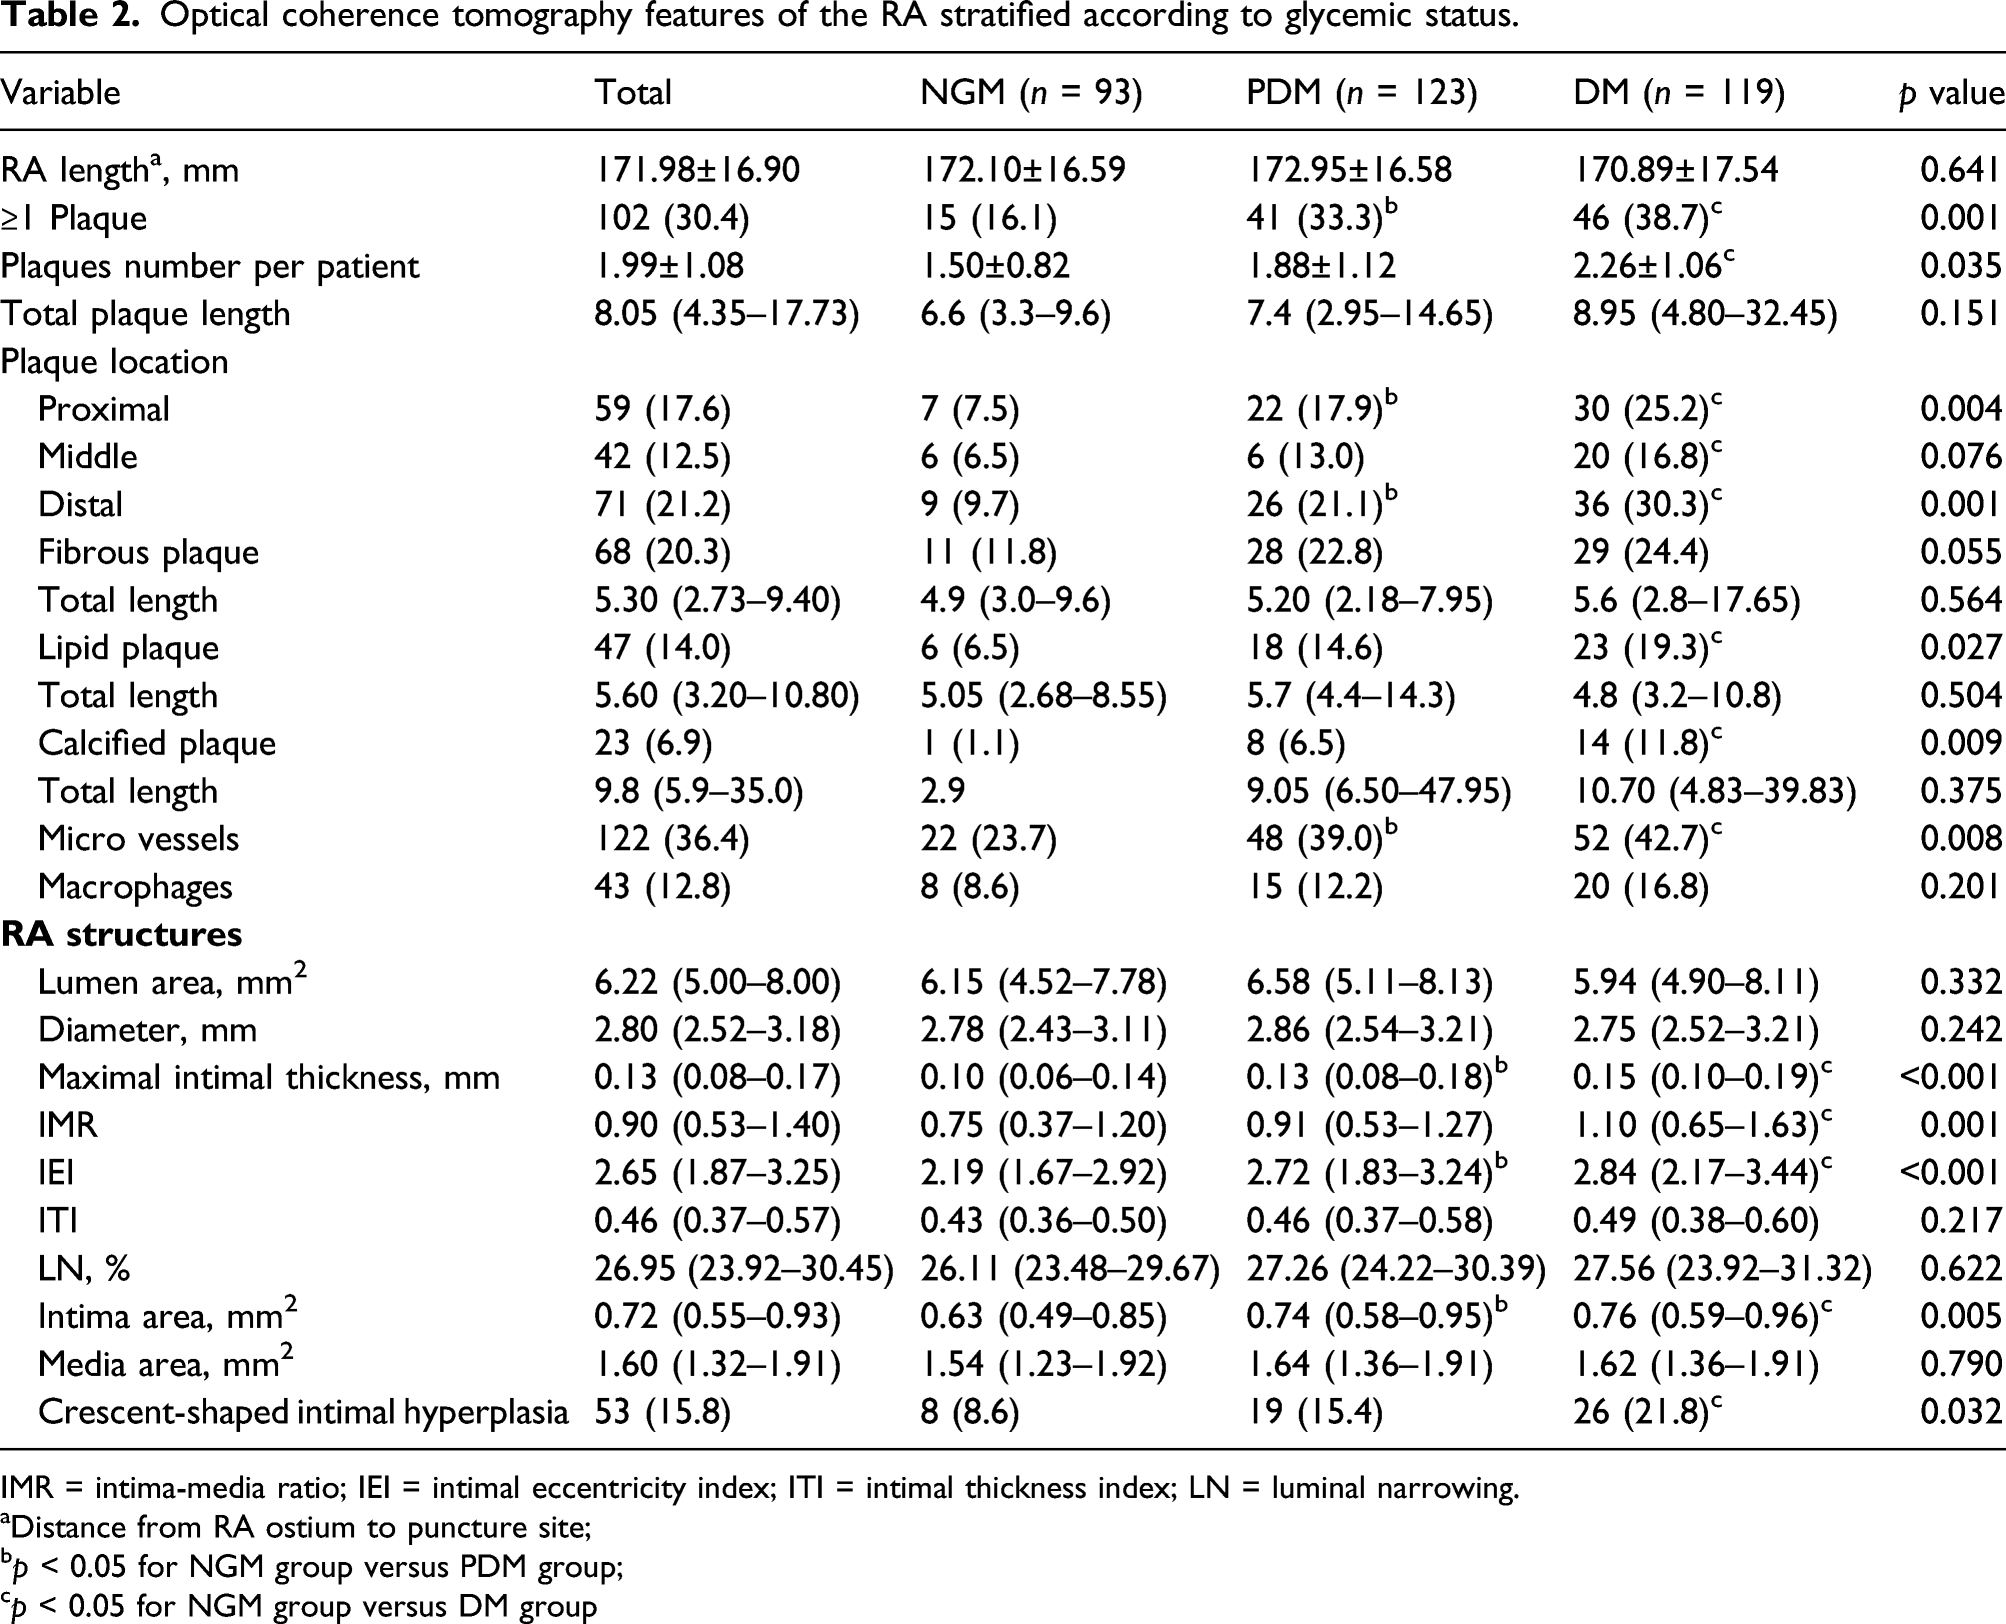
IMR = intima-media ratio; IEI = intimal eccentricity index; ITI = intimal thickness index; LN = luminal narrowing.
Distance from RA ostium to puncture site;
p < 0.05 for NGM group versus PDM group;
p < 0.05 for NGM group versus DM group
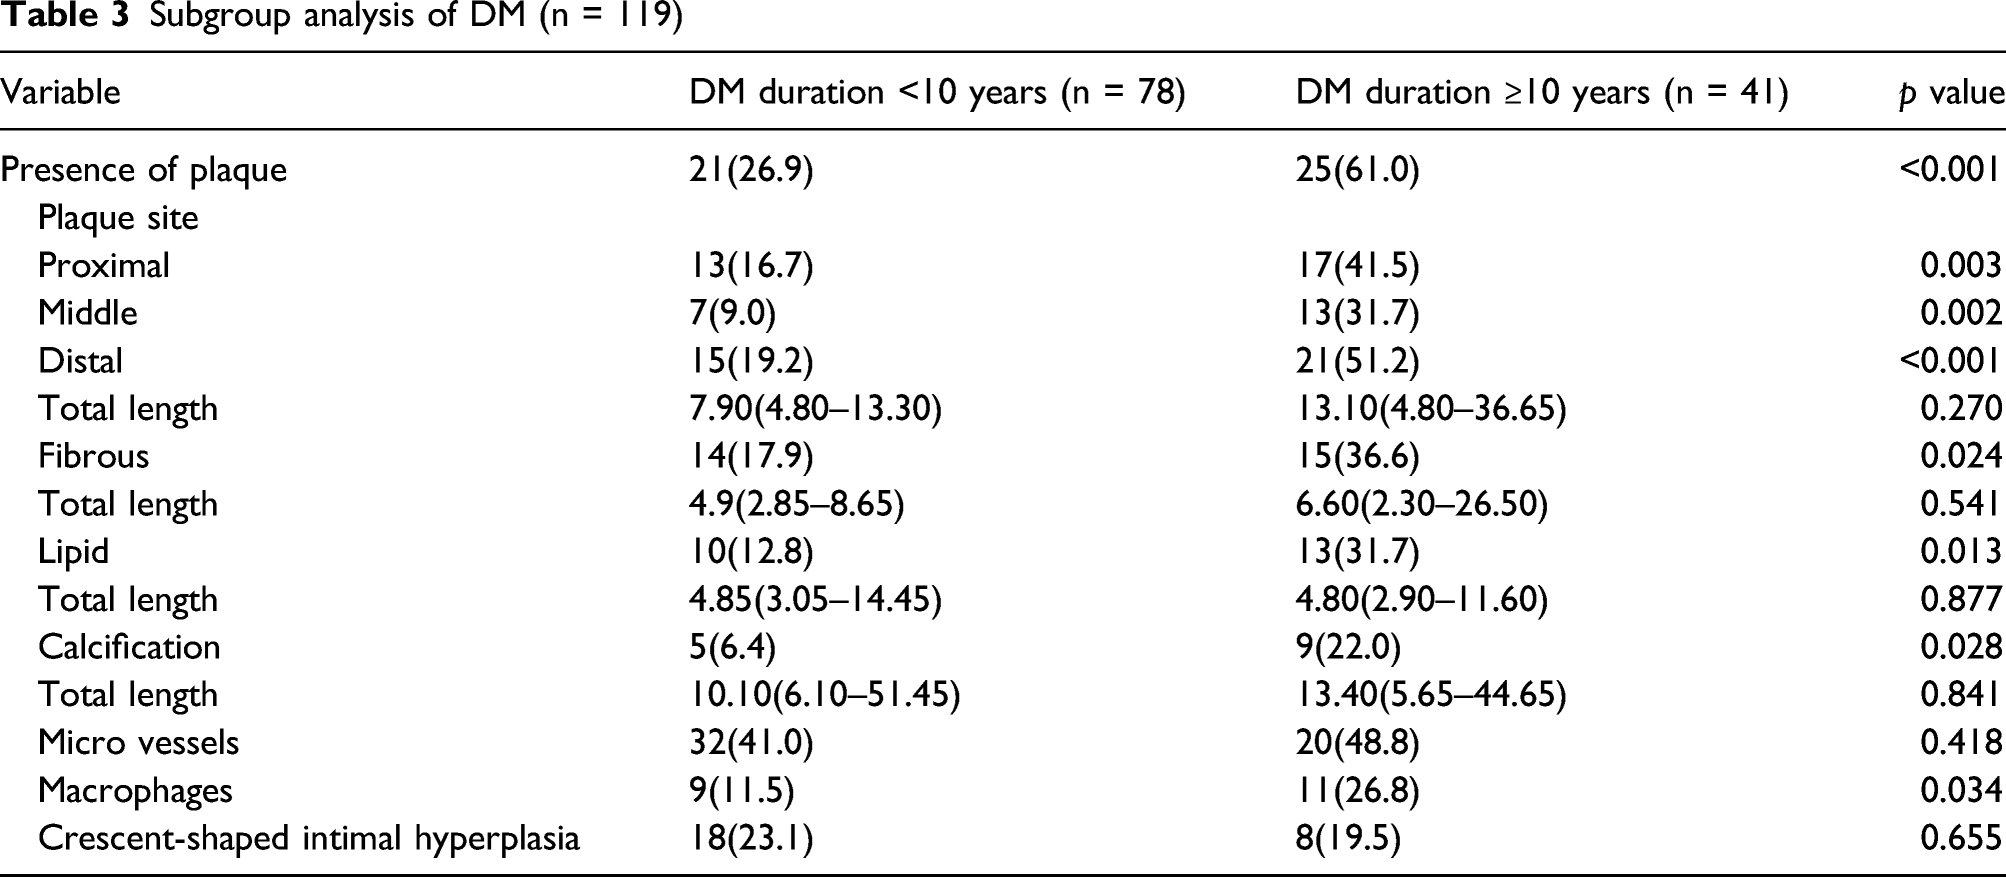
Subgroup analysis of DM (n = 119)
In plaque-level analysis, a total of 205 RA plaques were detected in 102 cases (24 plaques in 15 NGM subjects, 77 plaques in 41 PDM subjects, and 104 plaques in 46 DM subjects). A comparison of the quantitative OCT findings at the plaque level among the three groups is presented in Supplementary Table 1.
As shown in Table 2 and Supplementary Table 2, compared with the NGM group, the DM and PDM groups showed a significant increase in intima-media ratio (IMR), maximum intimal thickness (MIT), intimal eccentricity index (IEI), and intimal area (all p < 0.05). The proportion of crescent-shaped intimal hyperplasia was the highest in diabetic patients, followed by that in prediabetic and NGM patients, respectively (21.8% vs. 15.4% vs. 8.6%, p = 0.032).
Multivariate analysis of risk factors for RA plaque formation
Logistic regression analysis of RA plaque
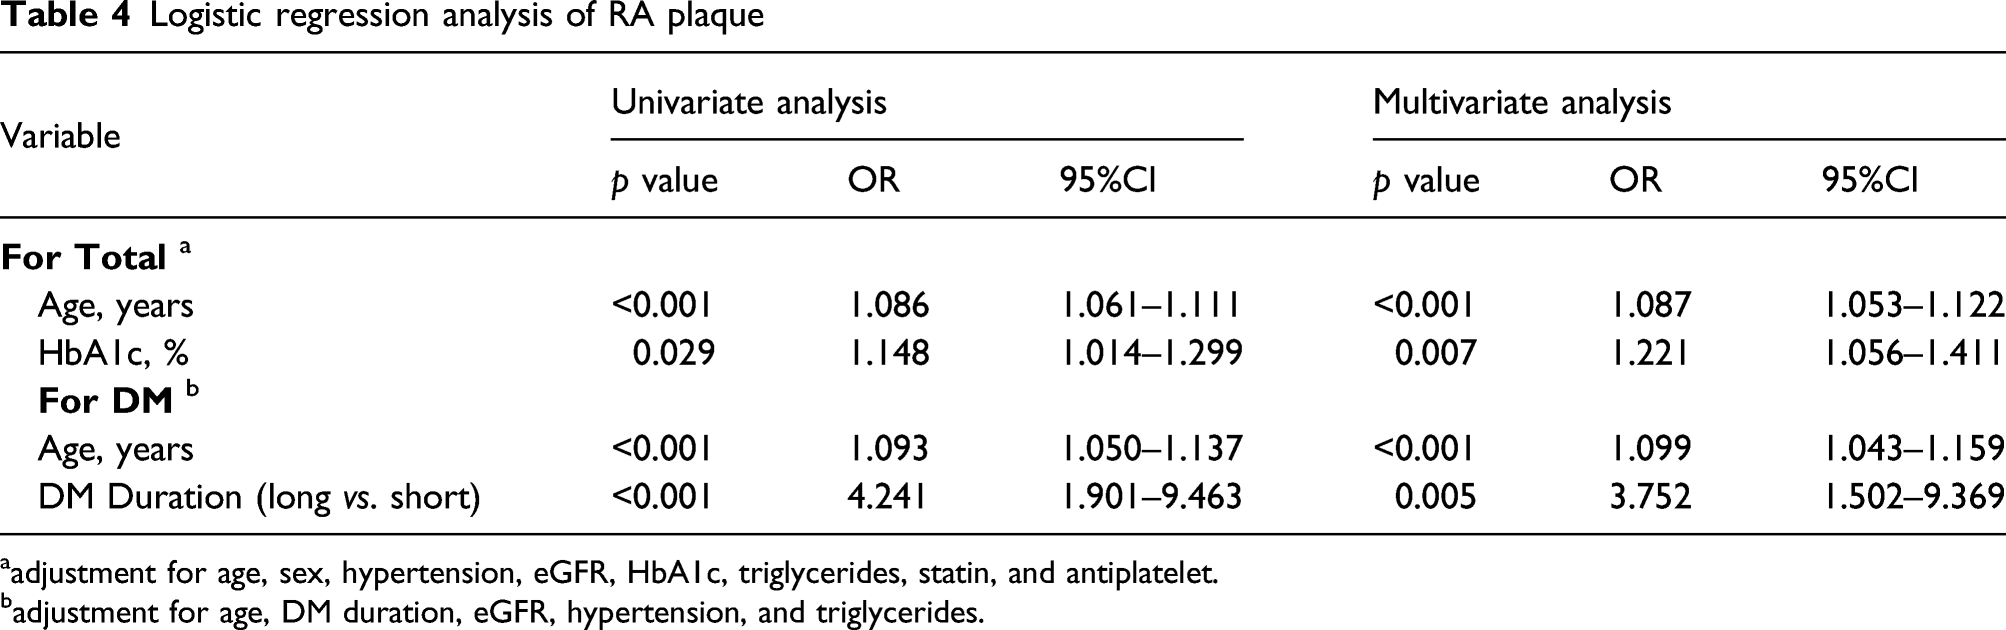
aadjustment for age, sex, hypertension, eGFR, HbA1c, triglycerides, statin, and antiplatelet.
badjustment for age, DM duration, eGFR, hypertension, and triglycerides.
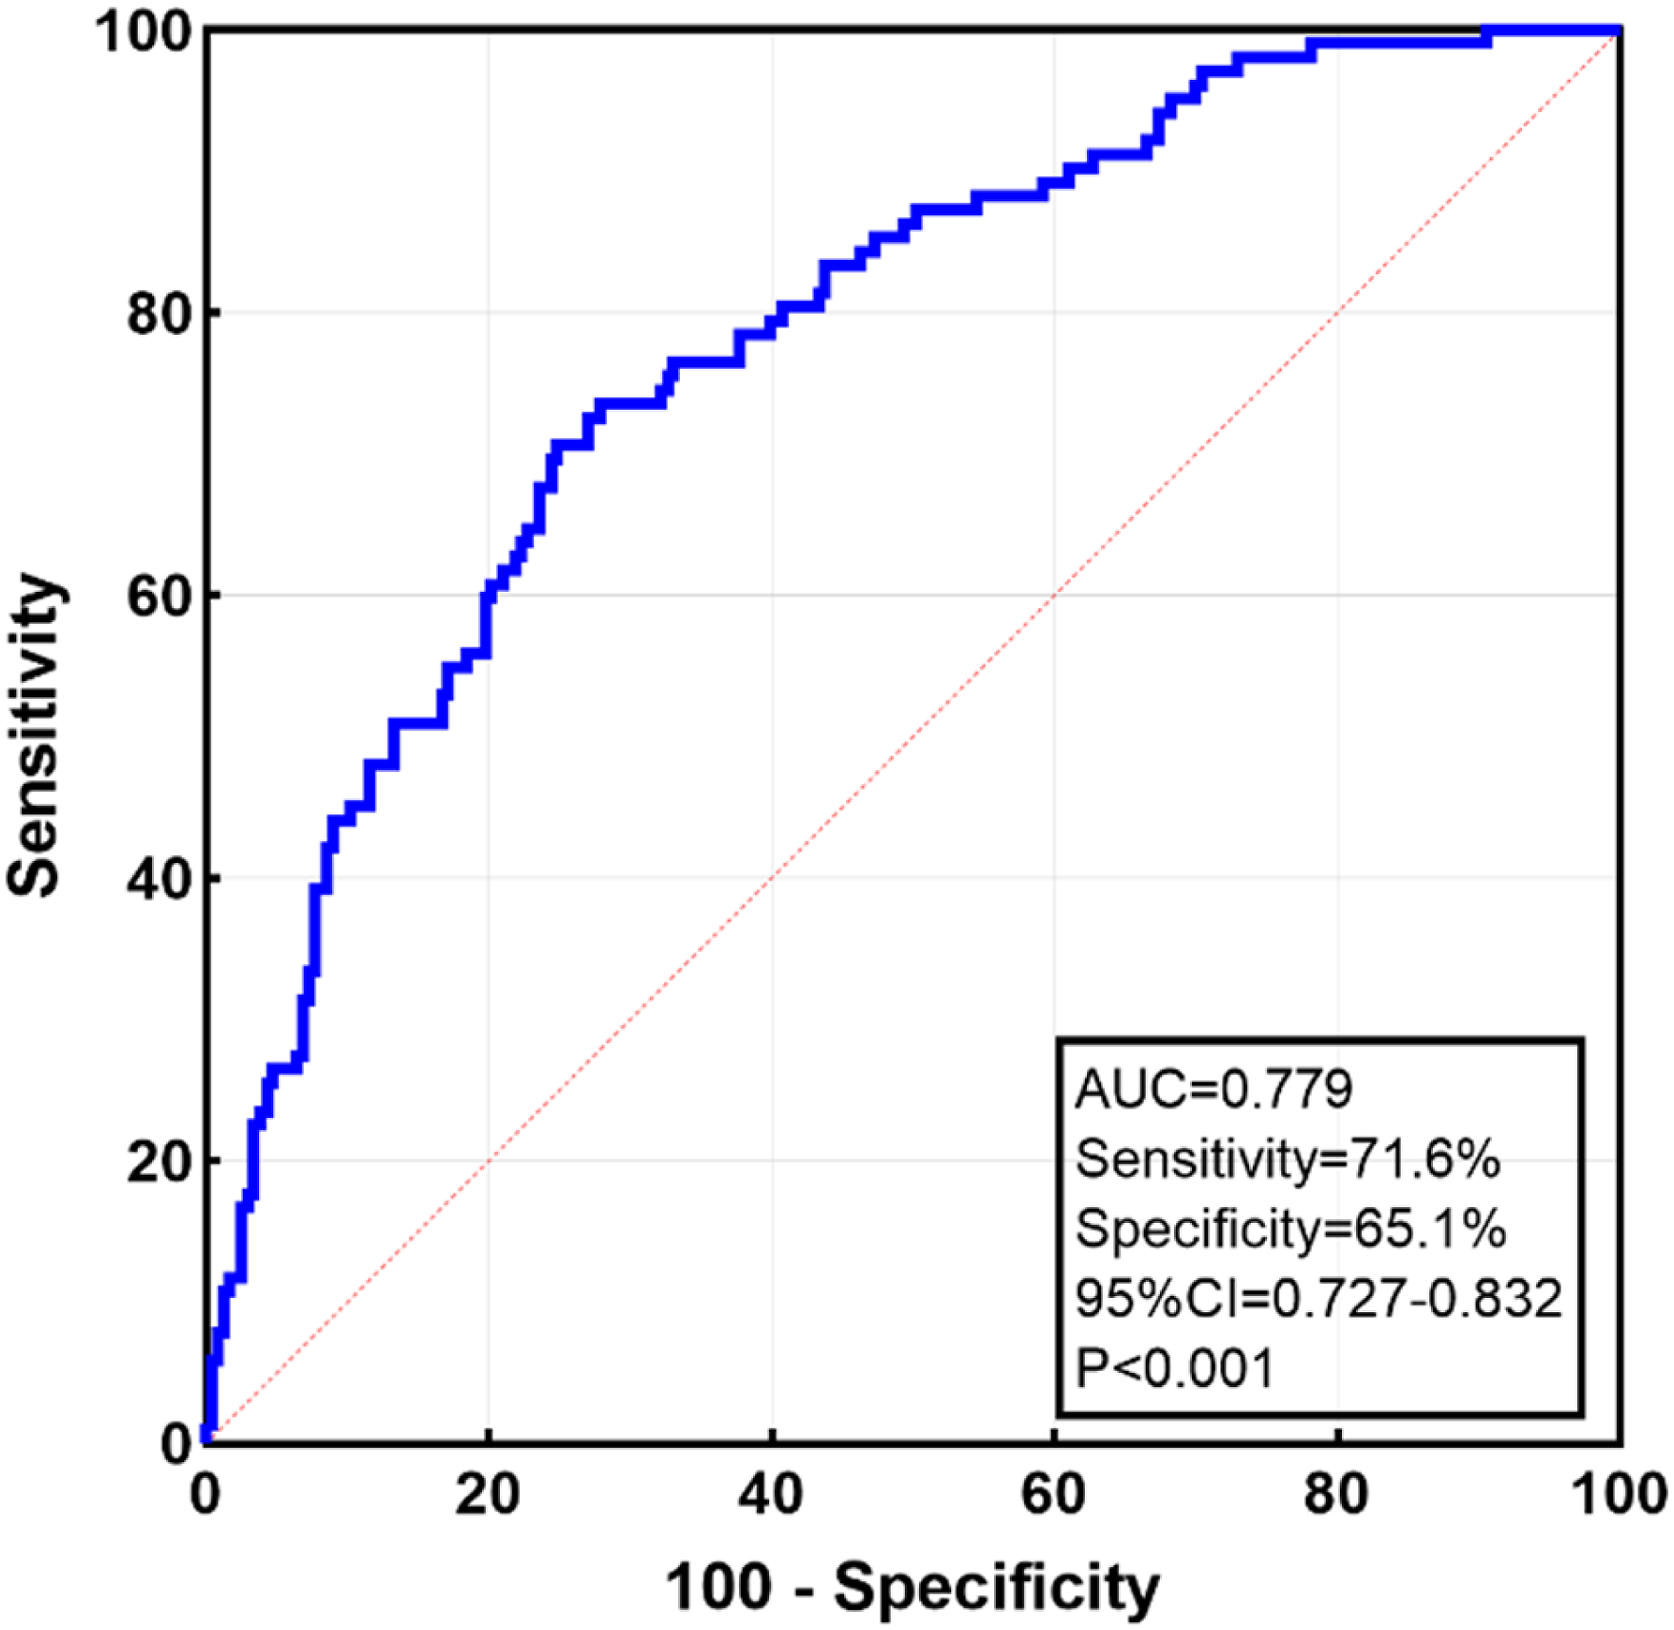
Receiver-operating characteristic curves of HbA1c combined with age for predicting RA plaque presence.
Linear regression analysis of RA intimal hyperplasia
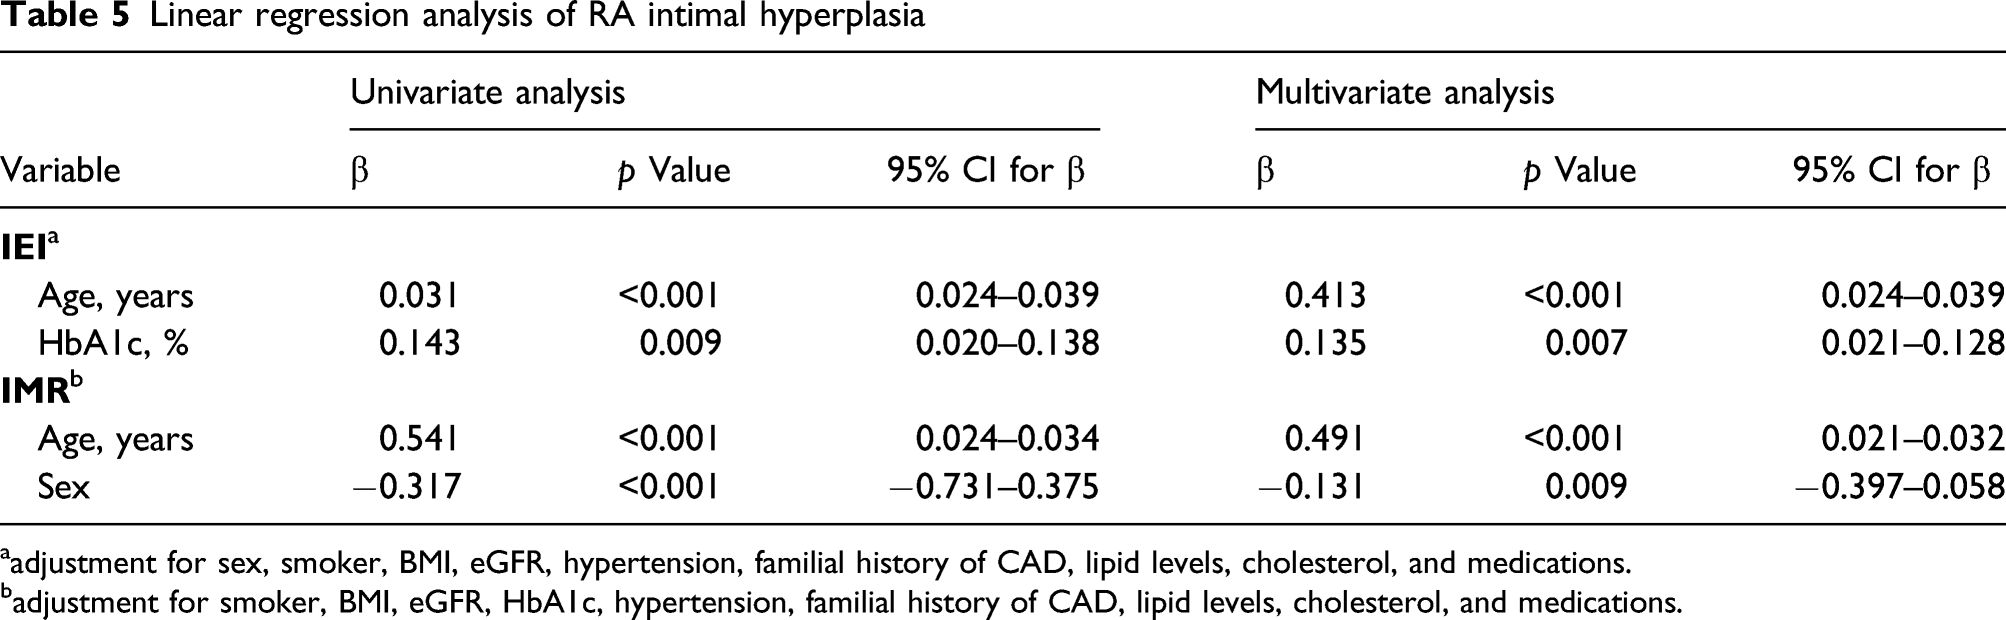
aadjustment for sex, smoker, BMI, eGFR, hypertension, familial history of CAD, lipid levels, cholesterol, and medications.
badjustment for smoker, BMI, eGFR, HbA1c, hypertension, familial history of CAD, lipid levels, cholesterol, and medications.
Discussion
In the present study, OCT, a novel high-resolution technique with a spatial resolution of 10 μm, demonstrated that atherosclerotic plaque presence and the extent of intimal hyperplasia of the RA in the PDM group were greater than those in the NGM group but comparable to those in the DM group. HbA1c levels increase in advanced atherosclerosis and can help identify at-risk individuals. Moreover, individuals with a longer duration of DM showed a higher prevalence of RA plaque phenotypes and macrophage presence. These data suggest that even prediabetic status affects the microstructure of the RA; meanwhile, a longer duration of DM will further aggravate atherosclerosis.
Evidence suggests that patients with DM have accelerated vascular atherosclerosis that affects multiple vessels, 20 and prolonged exposure to high levels of glucose can alter systemic endothelial function. 21 In line with previous studies, DM was identified as a risk factor for RA intimal hyperplasia or atherosclerosis.6,9,12 Electron microscopic comparisons of distal RA grafts obtained from diabetic patients have previously shown an increase in histological changes, such as endothelial cell damage, compared to grafts from non-diabetic patients, especially those with long-standing duration or poor glycemic control. 22 Recent studies have reported that patients with PDM have a higher prevalence of subclinical atherosclerosis. 23 Thus, our study raises the question of the subclinical status of RA structural changes that occur before and after the diagnosis of DM. Structures such as arterial layers and plaque components of the RA are often difficult to visualize in vivo and are easily evaluated by OCT after routine coronary procedures.
Prior work has documented that preoperative quality evaluation of RA grafts is crucial for their long-term patency. 24 For example, ultrasound 11 and histopathologic 9 studies have demonstrated that RAs in diabetic patients were more prone to calcium deposition, which may make the RA an unusable conduit in many of these patients. 25 Brown et al. 26 confirmed that intraoperative OCT imaging of RAs that were considered as acceptable for bypass grafting allowed for detection of intimal lipids which could help predict the degree of postoperative spasm of the RA. Importantly, the current OCT observation expands this understanding; we found a significantly higher incidence of RA plaque presence in both the DM and PDM groups than in the NGM group, and the incidence of RA lipid plaque was significantly higher in the DM group, followed by that in the PDM and NGM groups. Given the complex abnormalities of vascular complications seen in DM patients, it is not surprising that percutaneous or surgical coronary revascularization after ACS is less effective in diabetic than in non-diabetic patients.27-29
Jared et al. reported that the durations of DM and PDM during adulthood are both independently associated with subclinical atherosclerosis in middle-aged patients. 30 In the present study, patients with long-standing DM had higher levels of RA atherosclerotic alterations, including plaque phenotype and macrophage presence, which may aggravate its impaired vasoreactivity. 11 These findings add to the relationship between HbA1c level, disease duration, and diabetic atherosclerosis progression in ACS patients, which helps to understand the structural alterations of the vascular tree in patients with DM.
Pathologic studies revealed that coronary tissue from patients with DM exhibited more microstructure than that from patients without DM. 31 Microvessels are focally enhanced in areas of increased vessel wall thickness, and atherosclerotic lesion formation typically precedes the appearance of endothelial dysfunction. 32 Consistently, we found a significant increasing trend in RA microvessel presence among patients with NGM, PDM, and DM. Furthermore, macrophage accumulation was more common in patients with longer DM duration, which has been reported to play an important role during various steps of atherosclerosis and promote ACS events, thus indicating a higher level of plaque vulnerability. 33
HbA1c is not only a useful biomarker of long-term glycemic control but also a good predictor of atherosclerosis. For example, Shah et al. 34 reported that a 1% increase in HbA1c is associated with an approximately 30% increase in probability of a thicker carotid IMT. Recently, Rossello et al. 35 demonstrated a linear association between HbA1c > 5.4% level and multi-territory subclinical atherosclerosis detected by vascular ultrasound and non-contrast cardiac CT in carotid arteries, coronary arteries, and peripheral arteries in non-diabetic individuals. In the present study, we found an obvious intimal hyperplasia of the RA in the DM and PDM groups but not in the NGM group, and the intimal eccentric index was positively associated with HbA1c level. These findings extend previous research on the effect of HbA1c and highlight the association between HbA1c and RA atherosclerosis.
Data obtained in previous studies using a high-frequency ultrasound (55 Hz) indicated that assessment of RA intima thickness, other than RA media thickness, provides a tool for non-invasive early detection of atherosclerosis or additive value for the diagnosis of coronary artery disease.36,37 Although IVUS has been used to quantify RA atheroma burden, it cannot reliably identify the separation between the intima and media because of its limited spatial resolution. 38 In our study, the use of OCT allowed for the evaluation of even slight metabolic changes which contribute to the microstructural phenotype changes of the RA. The potential of RA intimal hyperplasia or plaque components that considered as cardiovascular risk modifiers deserve further investigation in future studies.
Study limitations
The present study had some limitations. First, this was a retrospective observational study from a single-center database; therefore, selection bias may have influenced the results. Second, we could not confirm that the effects of anti-atherosclerotic drugs, such as statins and hypoglycemic agents, were not independently associated with plaque regression. Recent studies have demonstrated that statin therapy increases FCT, thereby stabilizing the plaque irrespective of the DM status. 39 Third, the lack of longitudinal follow-up data did not allow for assessment of the clinical impact of OCT findings on future events. Fourth, in the present study, although it is hypothesized that the region of crescent-shaped intimal hyperplasia is prone to plaque formation, these data were not examined. Fifth, the RA is a good candidate for OCT imaging owing to its diameter; however, OCT is an invasive method used in the research stage and its role in clinical applications has not been fully established. In the present study, OCT imaging of the RA required little additional effort after the completion of the coronary OCT procedure during transradial intervention. In addition, to avoid wire artifacts, when the OCT catheter was in place, the guide wire was removed from the body. In the future, non-invasive and very high-resolution ultrasound is needed to evaluate RA atherosclerosis in clinical scenarios.
Conclusions
PDM stratified by HbA1c level is associated with RA plaque characteristics and eccentric intimal hyperplasia in ACS patients, similar to DM. HbA1c level could be a useful marker for RA atherosclerosis progression. Moreover, DM with a longer duration contributed to more damage to RA. This study highlighted that the prevention of vascular complications started below the threshold for DM, and the RA in patients with extended DM duration requires more attention.
Supplemental Material
sj-pdf-1-dvr-10.1177_14791641221078108 – Supplemental Material for Impact of prediabetes and duration of diabetes on radial artery atherosclerosis in acute coronary syndrome patients: An optical coherence tomography study
Supplemental Material, sj-pdf-1-dvr-10.1177_14791641221078108 for Impact of prediabetes and duration of diabetes on radial artery atherosclerosis in acute coronary syndrome patients: An optical coherence tomography study by Zixuan Li, Zhe Tang, Yujie Wang, Zijing Liu, Senhu Wang, Yuntao Wang, Guozhong Wang, Yuping Wang and Jincheng Guo in Diabetes & Vascular Disease Research
Footnotes
Declaration of conflicting interests
The author(s) declared no potential conflicts of interest with respect to the research, authorship, and/or publication of this article.
Funding
The author(s) disclosed receipt of the following financial support for the research, authorship, and/or publication of this article: This work was supported by grant No.2018-2-7082 from the Capital’s Funds for Health Improvement and Research, and grant No.2020CX004-15 from the TongZhou District Funds.
Supplemental material
Supplemental material for this article is available online.
Appendix
References
Supplementary Material
Please find the following supplemental material available below.
For Open Access articles published under a Creative Commons License, all supplemental material carries the same license as the article it is associated with.
For non-Open Access articles published, all supplemental material carries a non-exclusive license, and permission requests for re-use of supplemental material or any part of supplemental material shall be sent directly to the copyright owner as specified in the copyright notice associated with the article.