
Abstract
Diabetes is a proinflammatory and prothrombotic condition that increases the risk of vascular complications. The aim of this study was to develop a diabetic microvascular flow model that allows to study the complex interactions between endothelial cells, blood cells and plasma proteins and their effects on clot formation. Primary human cardiac microvascular endothelial cells from donors without diabetes or donors with diabetes (type 1 or type 2) were grown in a microfluidic chip, perfused with non-diabetic or diabetic whole blood, and clot formation was assessed by measuring fibrin deposition in real time by confocal microscopy. Clot formation in non-diabetic whole blood was significantly increased in the presence of endothelial cells from donors with type 2 diabetes compared with cells from donors without diabetes. There was no significant difference in clot formation between non-diabetic and diabetic whole blood. We present for the first time a diabetic microvascular flow model as a new tool to study clot formation as a result of the complex interactions between endothelial cells, blood cells and plasma proteins in a diabetes setting. We show that endothelial cells affect clot formation in whole blood, attributing an important role to the endothelium in the development of atherothrombotic complications.
Introduction
Diabetes mellitus is a chronic metabolic disease that affected 8.5% of the adult global population in 2014 (422 million). The number of affected individuals has doubled since 1980, and with a predicted number of 522 million people suffering from diabetes by 2030, the disease has developed to a fast-rising global burden that is not restricted to high-income countries anymore.1,2 This means that novel preventive, diagnostic and therapeutic approaches are required.
Diabetes is subdivided into type 1 and type 2 diabetes. 3 Type 1 diabetes mellitus (T1DM) is an autoimmune disease that causes deficiency of insulin due to the destruction of insulin-producing pancreatic beta cells. In type 2 diabetes mellitus (T2DM), which accounts for the majority of all cases, hyperglycaemia is caused by insulin resistance. Although T1DM and T2DM differ in regard to their causative factors and pathogenesis, both types of diabetes are associated with an elevated risk of macrovascular complications such as cardiovascular disease (CVD).4–6 In most T2DM patients, hyperglycaemia with insulin resistance is accompanied by a cluster of cardiovascular risk factors including obesity, dyslipidaemia and hypertension, summarised as the metabolic syndrome, which is caused by a combination of lifestyle and genetic factors.7–10 This cluster of risk factors promotes endothelial dysfunction and procoagulant and proinflammatory changes which contribute to the formation of atherosclerotic plaques and eventually acute thrombotic cardiovascular events.11–13
Novel approaches to prevent or reduce macrovascular complications of diabetes may target endothelial dysfunction and procoagulant and proinflammatory changes. The complement system, a part of the innate immune system that fights infection but also boosts inflammatory reactions, is emerging as a player in diabetes.14,15 The complement system also closely interacts with the coagulation and fibrinolytic system, further promoting clot formation. 16 In diabetes patients, elevated plasma levels of complement proteins and activation products were associated with increased clot formation, denser clot structure and prolonged clot lysis.17–19 Similarly, elevated plasma levels of procoagulant factors including fibrinogen and the fibrinolysis inhibitor plasminogen activator inhibitor-1 (PAI-1) were associated with diabetes.20,21 Hyperglycaemia has also been shown to alter the function of proteins in plasma (e.g. fibrinogen, plasminogen, complement C3) and on cell surfaces by non-enzymatic glycation, further contributing to the proinflammatory and prothrombotic state.12,18,22,23
As a prerequisite for the exploration of novel preventive and therapeutic targets, diagnostic methods must be in place that can assess whether the desired outcome has been reached. But a complex procoagulant and proinflammatory state in a multifactorial disease such as T2DM may not be reflected by a single biomarker measured in plasma. Novel experimental models that integrate both cellular and humoral components and enable to investigate their interactions and effects on a certain outcome may help to identify novel targets and in the future may also be used as tools to better monitor treatments. A microfluidic model that features microchannels of the dimension of human arterioles coated with a viable monolayer of human endothelial cells was developed to study microvascular occlusion and thrombosis in whole blood in the case of haematological diseases.24,25 We have recently shown that activation of the complement system affects blood clot formation in this microvascular whole blood flow model. 26
The aim of this study was to further develop this model into a diabetes model. We coated the microchannels with primary human cardiac microvascular endothelial cells from donors without diabetes or donors with T1DM or T2DM. To assess the diabetic phenotype of the endothelial cells, we analysed the expression of markers associated with diabetes by real-time polymerase chain reaction (PCR). The endothelialised microchannels were then perfused at physiological flow and shear rates with freshly drawn whole blood from individuals without diabetes or patients with T1DM or T2DM, and clot formation was observed in real time by confocal microscopy. For the first time, we assessed and compared the effects of endothelial cells and whole blood from T1DM and T2DM patients and donors without diabetes on the extent of clot formation.
Materials and methods
Endothelial cell culture
Primary human cardiac microvascular endothelial cells (HMVECs) from individuals without diabetes and diseased human cardiac microvascular endothelial cells (D-HMVECs) from T1DM and T2DM patients were purchased from Lonza (Basel, Switzerland). Cells were maintained in microvascular endothelial cell growth medium (EGM-2 MV, with SingleQuots™; Lonza) as recommended by the supplier. Cells from T1DM and T2DM donors were cultured with
Expression of diabetic markers in endothelial cells
Total RNA from HMVECs and D-HMVECs (passage 5, approximately 3 × 10⁶ cells per donor) was extracted using an RNAeasy MiniKit (Qiagen, Hilden, Germany) according to the manufacturer’s manual. Isolated RNA was transcribed into complementary DNA (cDNA) using the iScript gDNA Clear cDNA Synthesis Kit (Bio-Rad, Hercules, CA, USA) according to the manufacturer’s instructions. The gene expression of fibronectin (gene name: fibronectin 1, FN1), PAI-1 (gene name: SERPINE1), and advanced glycation end-product-specific receptor (AGE receptor, AGER) was quantified by quantitative PCR (qPCR) performed on a CFX Connect-96 device (Bio-Rad) using SsoAdvanced Universal SYBR® Green Supermix (Bio-Rad) on customised PrimePCR plates containing lyophilised primer pairs (Bio-Rad Unique Assay ID qHsaCID0012349 for FN1; qHsaCED0043144 for SERPINE1; qHsaCED0037299 for AGER). Results were normalised against SDHA expression (succinate dehydrogenase complex, subunit A; Bio-Rad Unique Assay ID qHsaCED0057393). Two technical replicates of each sample were used to determine quantification cycle values (CFX Maestro Version 4.1.2433.1219; Bio-Rad), and the fold-differences between control and diabetic HMVECs were assessed by comparative quantification (2−∆∆Ct).
Patients and blood sampling
A total of 22 T1DM and T2DM patients (n = 11 each) were recruited during their consultation at the University Clinic for Diabetology, Endocrinology, Nutritional Medicine and Metabolism at the University Hospital of Bern. Inclusion criteria were adult age, either newly diagnosed and non-treated diabetes or patients with an earlier diagnosis but poor glycaemic control. One T1DM patient and one T2DM patient were excluded from the analysis due to problems with the microvascular flow model and hence implausible clot formation (instead of a smooth curve showing an increasing fluorescence signal over time, the curves were ragged, possibly due to a floating particle such as cell debris). Control subjects without diabetes were recruited by advertisement at the University and University Hospital of Bern. Individuals under anticoagulant and/or antiplatelet treatment, with haemostatic or thrombotic disorders and lactating or pregnant women were excluded. The study was approved by the local ethics committee (reference number 2017-01916), and all patients and control subjects gave informed consent. Demographic and medical data were collected and stored in anonymised form. Whole blood was taken by venipuncture into ethylenediaminetetraacetic acid (EDTA) and trisodium citrate monovettes (1.6 mg EDTA/mL or 0.106 mol/L trisodium citrate; Sarstedt AG, Nümbrecht, Germany). Citrated whole blood (2 mL) was supplemented with corn trypsin inhibitor (CTI), a contact pathway inhibitor (final concentration: 2.86 μmol/L; Haematologic Technologies, Essex Junction, VT, USA), and was used for microscopic experiments within 90 min after blood sampling. Platelet-poor plasma was produced from EDTA and citrated whole blood by centrifugation (2900 r/min for 15 min, 4°C) and stored at −80°C for biomarker measurements.
Circulating biomarker measurements
Plasma levels of the complement proteins C3, mannan-binding lectin (MBL) and soluble terminal complement complex (sC5b-9) were measured by commercial ELISA kits (Hycult Biotech, Uden, The Netherlands), according to the manufacturer’s protocols. Plasma levels of the coagulation protein fibrinogen and the fibrinolysis inhibitor PAI-1 were also measured by commercial ELISA kits (HYPHEN Biomed, Neuville-sur-Oise, France) following the manufacturer’s instructions. Fructosamine levels, a marker of non-enzymatic glycation of plasma proteins, were measured by a commercial colorimetric assay following the manufacturer’s protocol (Abcam, Cambridge, UK).
The microvascular flow model
The microvascular flow model was assembled as described earlier. 26 Briefly, a silicone photomask with an imprinted microchannel pattern was used as a template to cast identical polydimethylsiloxane (PDMS, Sylgard 184 silicone elastomer kit; Dow Corning, Midland, MI, USA) single-use devices (Figure 1(a)). The microchannels were coated with a 0.005% fibronectin solution (wt/vol., final concentration: 50 μg/mL; Sigma Aldrich, St. Louis, MO, USA) in phosphate-buffered saline (PBS) (pH 7.4, Life Technologies, Carlsbad, CA, USA) for 60 min. Passage 5 HMVECs or D-HMVECs grown to full confluency in T25 flasks (4.0 × 10⁴ cells/cm2) were washed and detached with 1 mL of trypsin (0.05% trypsin in Hank’s balanced salt solution, 0.53 mmol/L EDTA; Dow Corning), inactivated with 3 mL of EGM-2 MV and centrifuged at 1000g for 10 min. The pellet was resuspended in 100 μL of EGM-2 MV containing dextran (80 mg/mL, 450 ± 650 Mr; Sigma Aldrich), separated with a cell strainer (35 μm mesh size; Dow Corning) and injected into the microchannels at a concentration of 1 × 10⁷ cells/mL. The device was incubated at 37°C, 5% CO2 for 75 min. Then, thin tubing (Cole-Parmer, Vernon Hills, IL, USA) was connected to the channels and a constant flow of 2 μL/min of EGM-2 MV was applied for 48 h. After 2 days, the channels were checked by microscopy to determine whether a viable endothelial cell monolayer with 95%–100 % confluency had been established (Figure 1(b)).
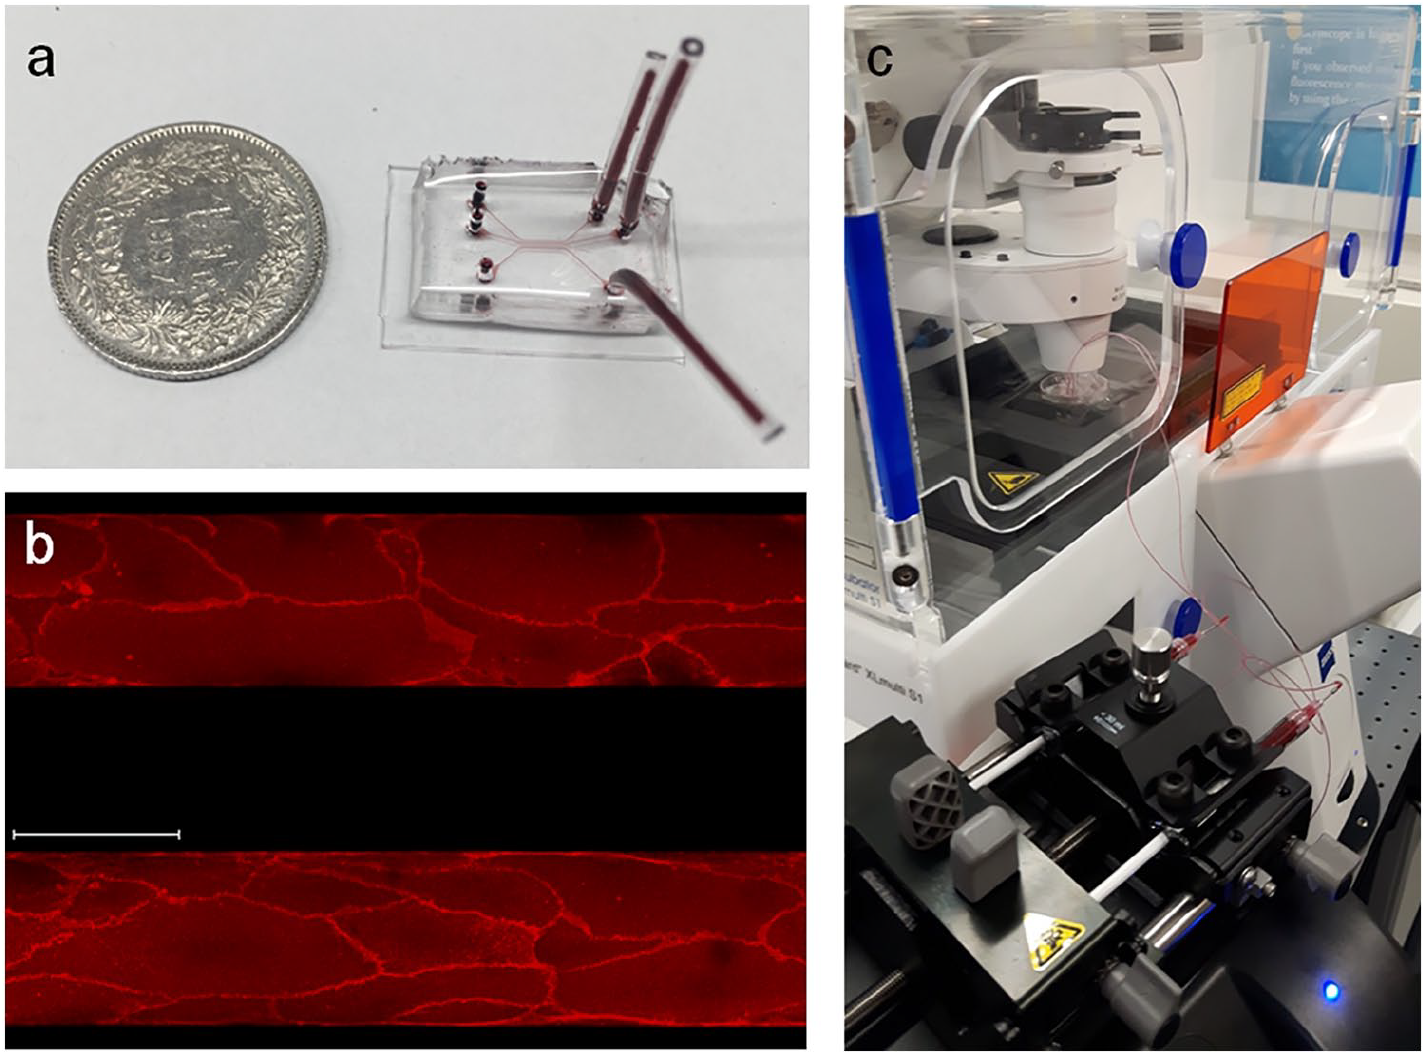
The microvascular flow model. (a) Exemplary picture of a PDMS straight channel device with three microchannels filled with red dye to visualise the channel size. For size comparison, the device is shown next to a Swiss 1 Franc coin with a diameter of 2.32 cm. [Figure 1(a), from Jenny et al. 26 is subject to the creative commons licence (www.creativecommons.org) and has not been changed.] (b) Two microchannels coated with a human microvascular endothelial cell monolayer, 48 h after the channels were seeded. Scale bar = 100 µm. (c) Experimental setup of a straight channel device being perfused with diabetic whole blood while observing the blood flow by laser scanning confocal microscopy.
Microscopic evaluation of clot formation
The HMVEC monolayer was stained with CellMask™ dissolved in EGM-2 MV (final concentration: 1 μL/mL, excitation/emission: 554/567 nm, red; Life Technologies) for 5 min. Citrated whole blood was supplemented with prestained fibrinogen (final concentration: 50 μg/mL, Alexa Fluor 488 conjugate, excitation/emission: 495/519 nm, green; Molecular Probes, Eugene, OR, USA) and recalcified with CaCl2 (final concentration: 12.5 mmol/L). Subsequently, parallel microchannels were perfused with either diabetes or control blood samples at a flow rate of 2 μL/min (Figure 1(c)). Fibrin deposition was measured for a period of 12.5 min at cycles of 15 s by confocal microscopy at 10× magnification (Figure 2) (LSM 710 confocal microscope, Zen software Version 2.1; Carl Zeiss AG, Oberkochen, Baden-Württemberg, Germany) and started 12 min after recalcification of the blood sample. The images were evaluated with ImageJ (version 1.51k; Wayne Rasband, National Institutes of Health, Bethesda, MD, USA). The extent of clot formation was calculated as mean area under the time curve (AUC) of duplicates measured in parallel channels.
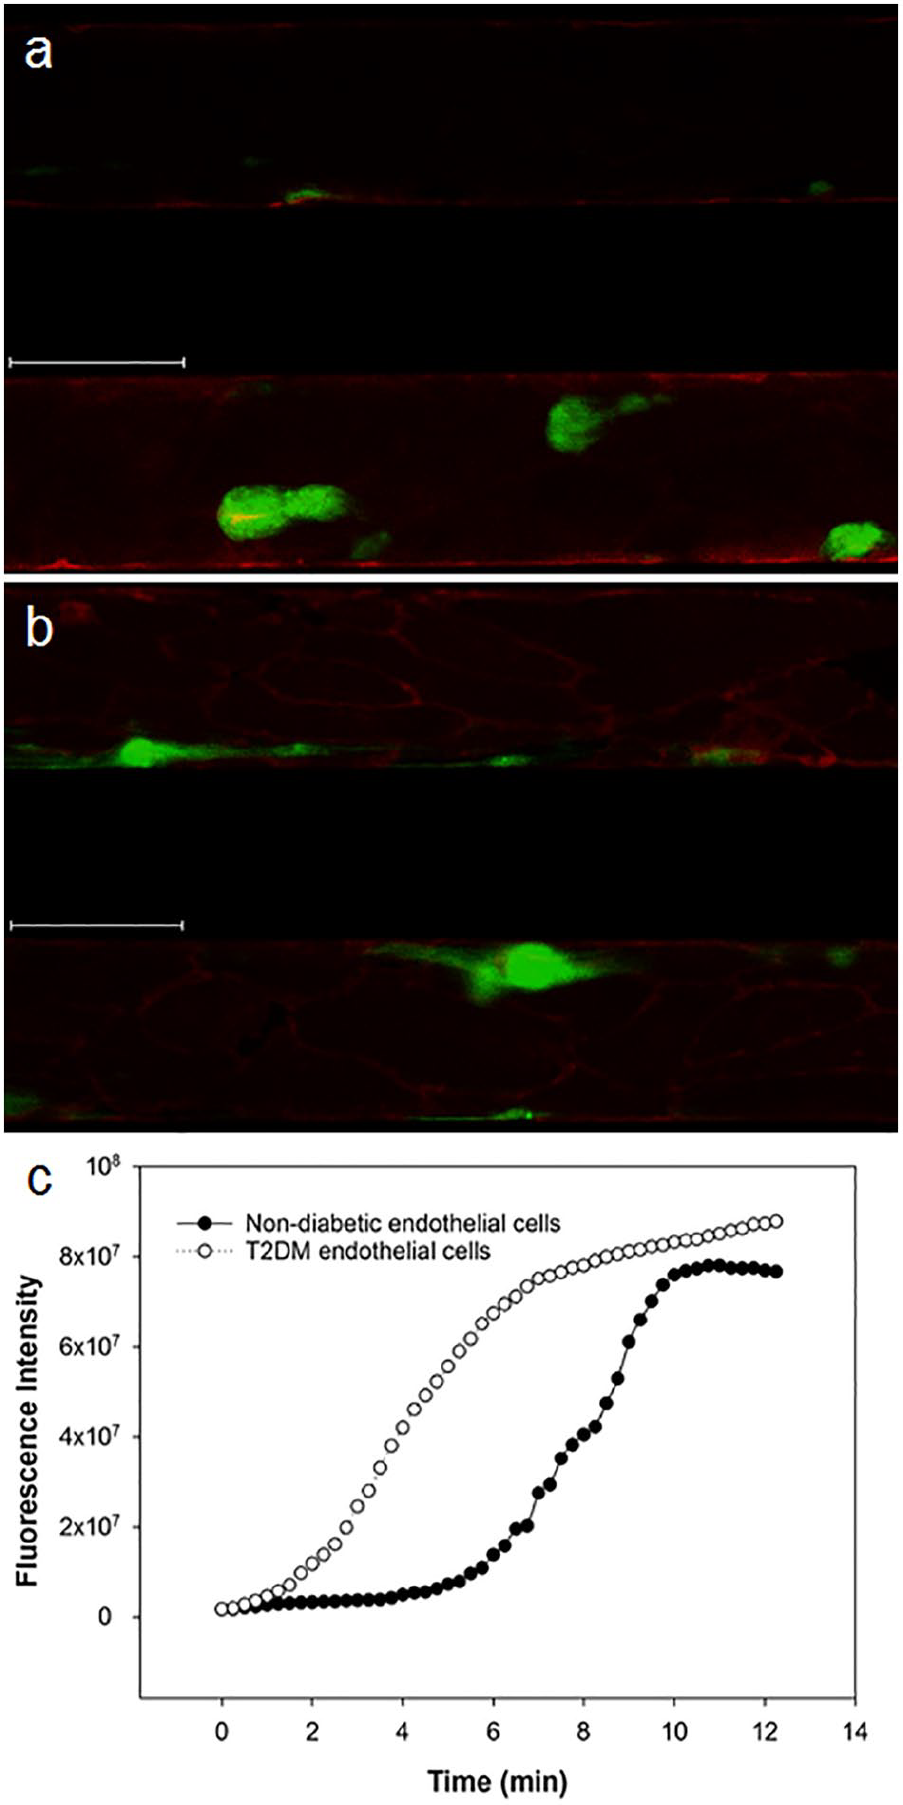
Exemplary images from one clot formation experiment in the microvascular flow model. The images illustrate how clot formation was detected in the microvascular flow model and how the quantitative evaluation was performed. Microchannels were coated in duplicates with (a) non-diabetic or (b) type 2 diabetic human microvascular endothelial cells. Microscopic images were taken at 10× magnification, 25.5 min after the blood was recalcified. Red stain: endothelial cells; green stain: deposited fibrin. Scale bar = 100 µm. (c) Corresponding fluorescence intensity curve over time, with each point being the mean of duplicates.
Statistical analysis
Statistical analysis was performed with IBM© SPSS© Statistics, version 26.0; IBM Corporation, Armonk, NY, USA). Numeric data are shown as mean (±SD) and were tested for normal distribution with the Shapiro–Wilk test. Normally distributed variables [body mass index (BMI), fructosamine, fibrinogen, PAI-1, C3] were compared between groups with the t-test, and data that were not normally distributed (age, HbA1c, diabetes duration, MBL, sC5b-9, AUC of clot formation) were compared with the Mann–Whitney U-test. Clot formation data from the microvascular flow model (AUC) were not always normally distributed and are therefore shown as median and interquartile range (IQR). Paired variables were tested with the paired t-test or with the Wilcoxon signed-rank test. Bivariate correlations were assessed with the Spearman correlation coefficient. The distributions of gender and number of smokers between groups were assessed with the chi-square test.
Results
In this study, we developed a diabetic microvascular flow model to investigate the effects of diabetic endothelial cells and diabetic whole blood on clot formation. We determined typical cellular and circulating biomarkers associated with diabetes to characterise the primary endothelial cells and blood samples we used in the microvascular flow model.
Expression of diabetes markers in primary HMVECs from donors with and without diabetes
The primary HMVECs were from seven deceased donors, among them were two individuals without diabetes (controls), three T1DM patients and two T2DM patients. The donor information supplied by the company is shown in Table 1. We quantified the gene expression of three cell markers associated with diabetes and diabetes-associated cardiovascular disease: fibronectin, PAI-1 and AGE receptor. Fibronectin was reported to be highly upregulated in endothelial cells from diabetes patients, and cellular fibronectin released into plasma was associated with prothrombotic clot properties.27–29 Similarly, expression of PAI-1 in endothelial cells was increased several fold in diabetes, in addition to the well-established elevation of PAI-1 plasma levels thought to be a link to the increased thrombotic risk in diabetes.28,30 Hyperglycaemia causes the formation of AGEs which act on several cell types, including endothelial cells, through the AGE receptor (AGER or RAGE). AGEs and AGER have been linked to endothelial dysfunction and vascular complications of diabetes.31–33 As shown in Figure 3, we observed a high interindividual variation of the expression in diabetic cells relative to the non-diabetic control cells. Among the two T2DM donors, all three diabetes markers were increased in the cells from one donor compared with the cells from the donors without diabetes, while the cells of the second T2DM cell donor showed a lower expression of all three marker genes. The gene expression in the endothelial cells from the three T1DM donors compared with the non-diabetic cells was also very heterogeneous and showed no consistent pattern.
Cell donor information obtained from Lonza.
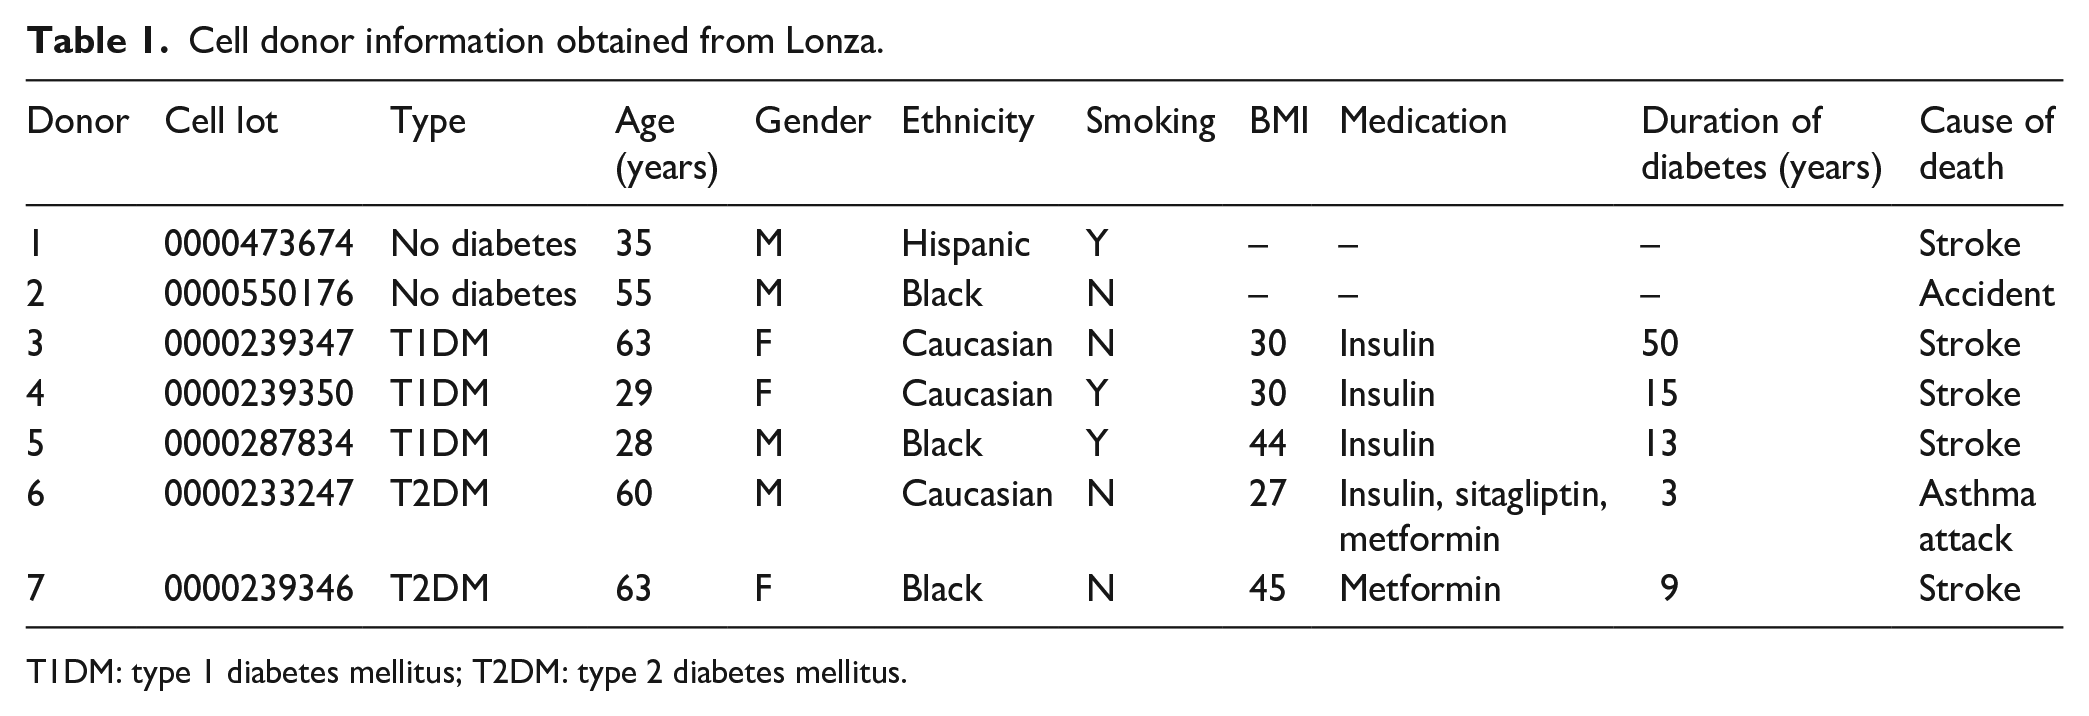
T1DM: type 1 diabetes mellitus; T2DM: type 2 diabetes mellitus.
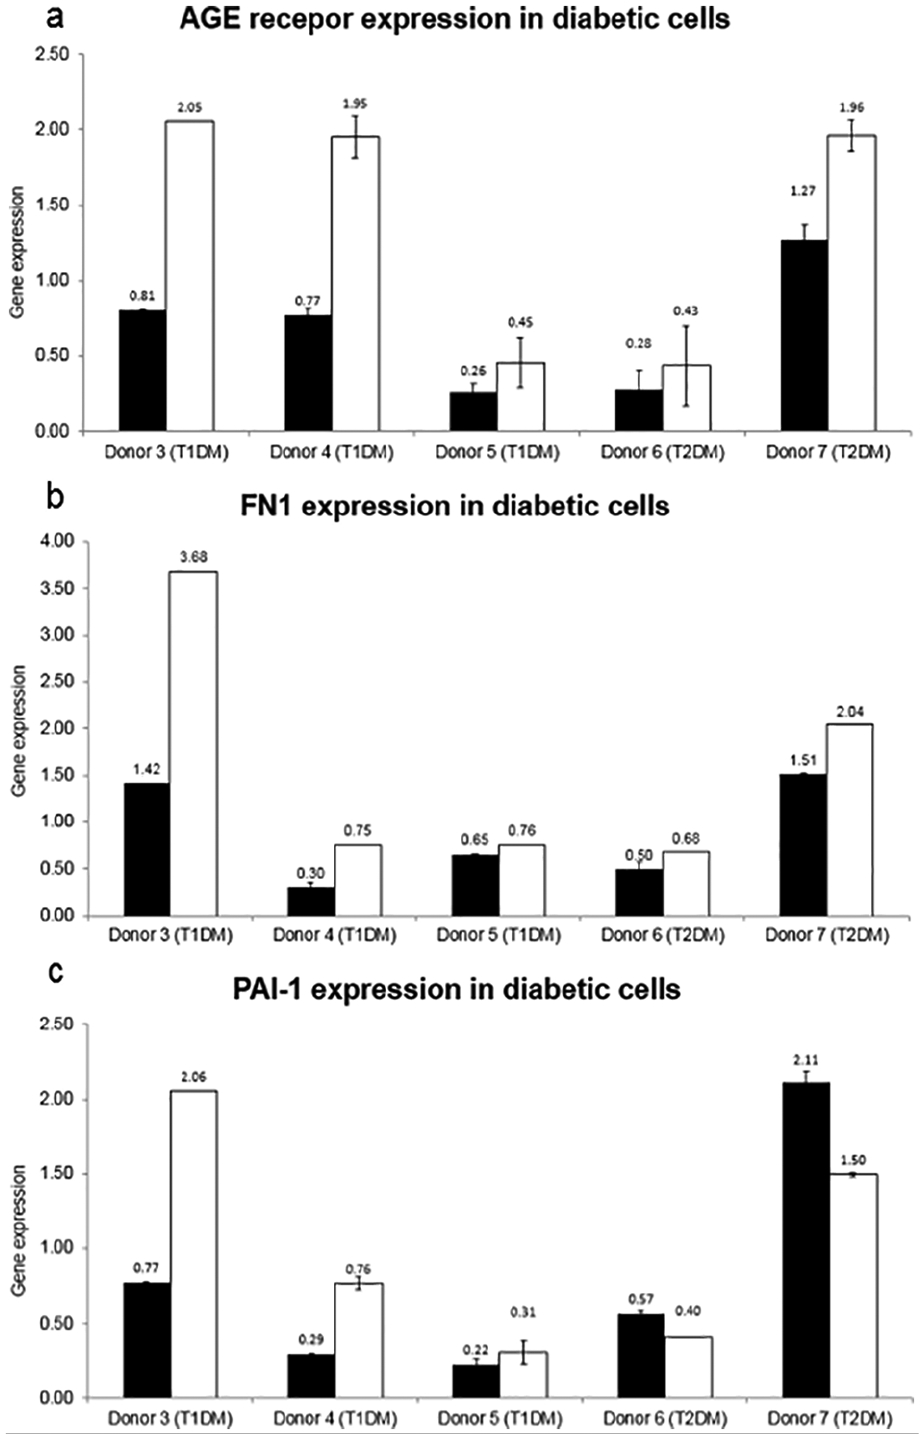
Expression of diabetic marker genes in diabetic and non-diabetic human microvascular endothelial cells. Individual gene expression in the cells from the donors with diabetes is shown relative to the expression in control cells from donor 1 without diabetes (depicted as black bars) and relative to donor 2 without diabetes (white bars). Error bars represent the standard deviation from two technical replicates. AGE receptor: advanced glycation end-product-specific receptor; FN1: fibronectin; PAI-1: plasminogen activator inhibitor-1; T1DM: type 1 diabetes mellitus; T2DM: type 2 diabetes mellitus.
Demographic and medical data of diabetes patients and control subjects
We included 10 patients with T1DM, 10 patients with T2DM and 20 control subjects without diabetes into the analysis. Characteristics of the diabetes patients and control subjects are shown in Table 2. All three groups were predominantly male and contained a high number of smokers. As expected, T2DM patients were significantly older than T1DM patients and controls. T2DM patients also had the highest BMI and HbA1c levels.
Demographic data, diabetes indices, coagulation and complement markers.
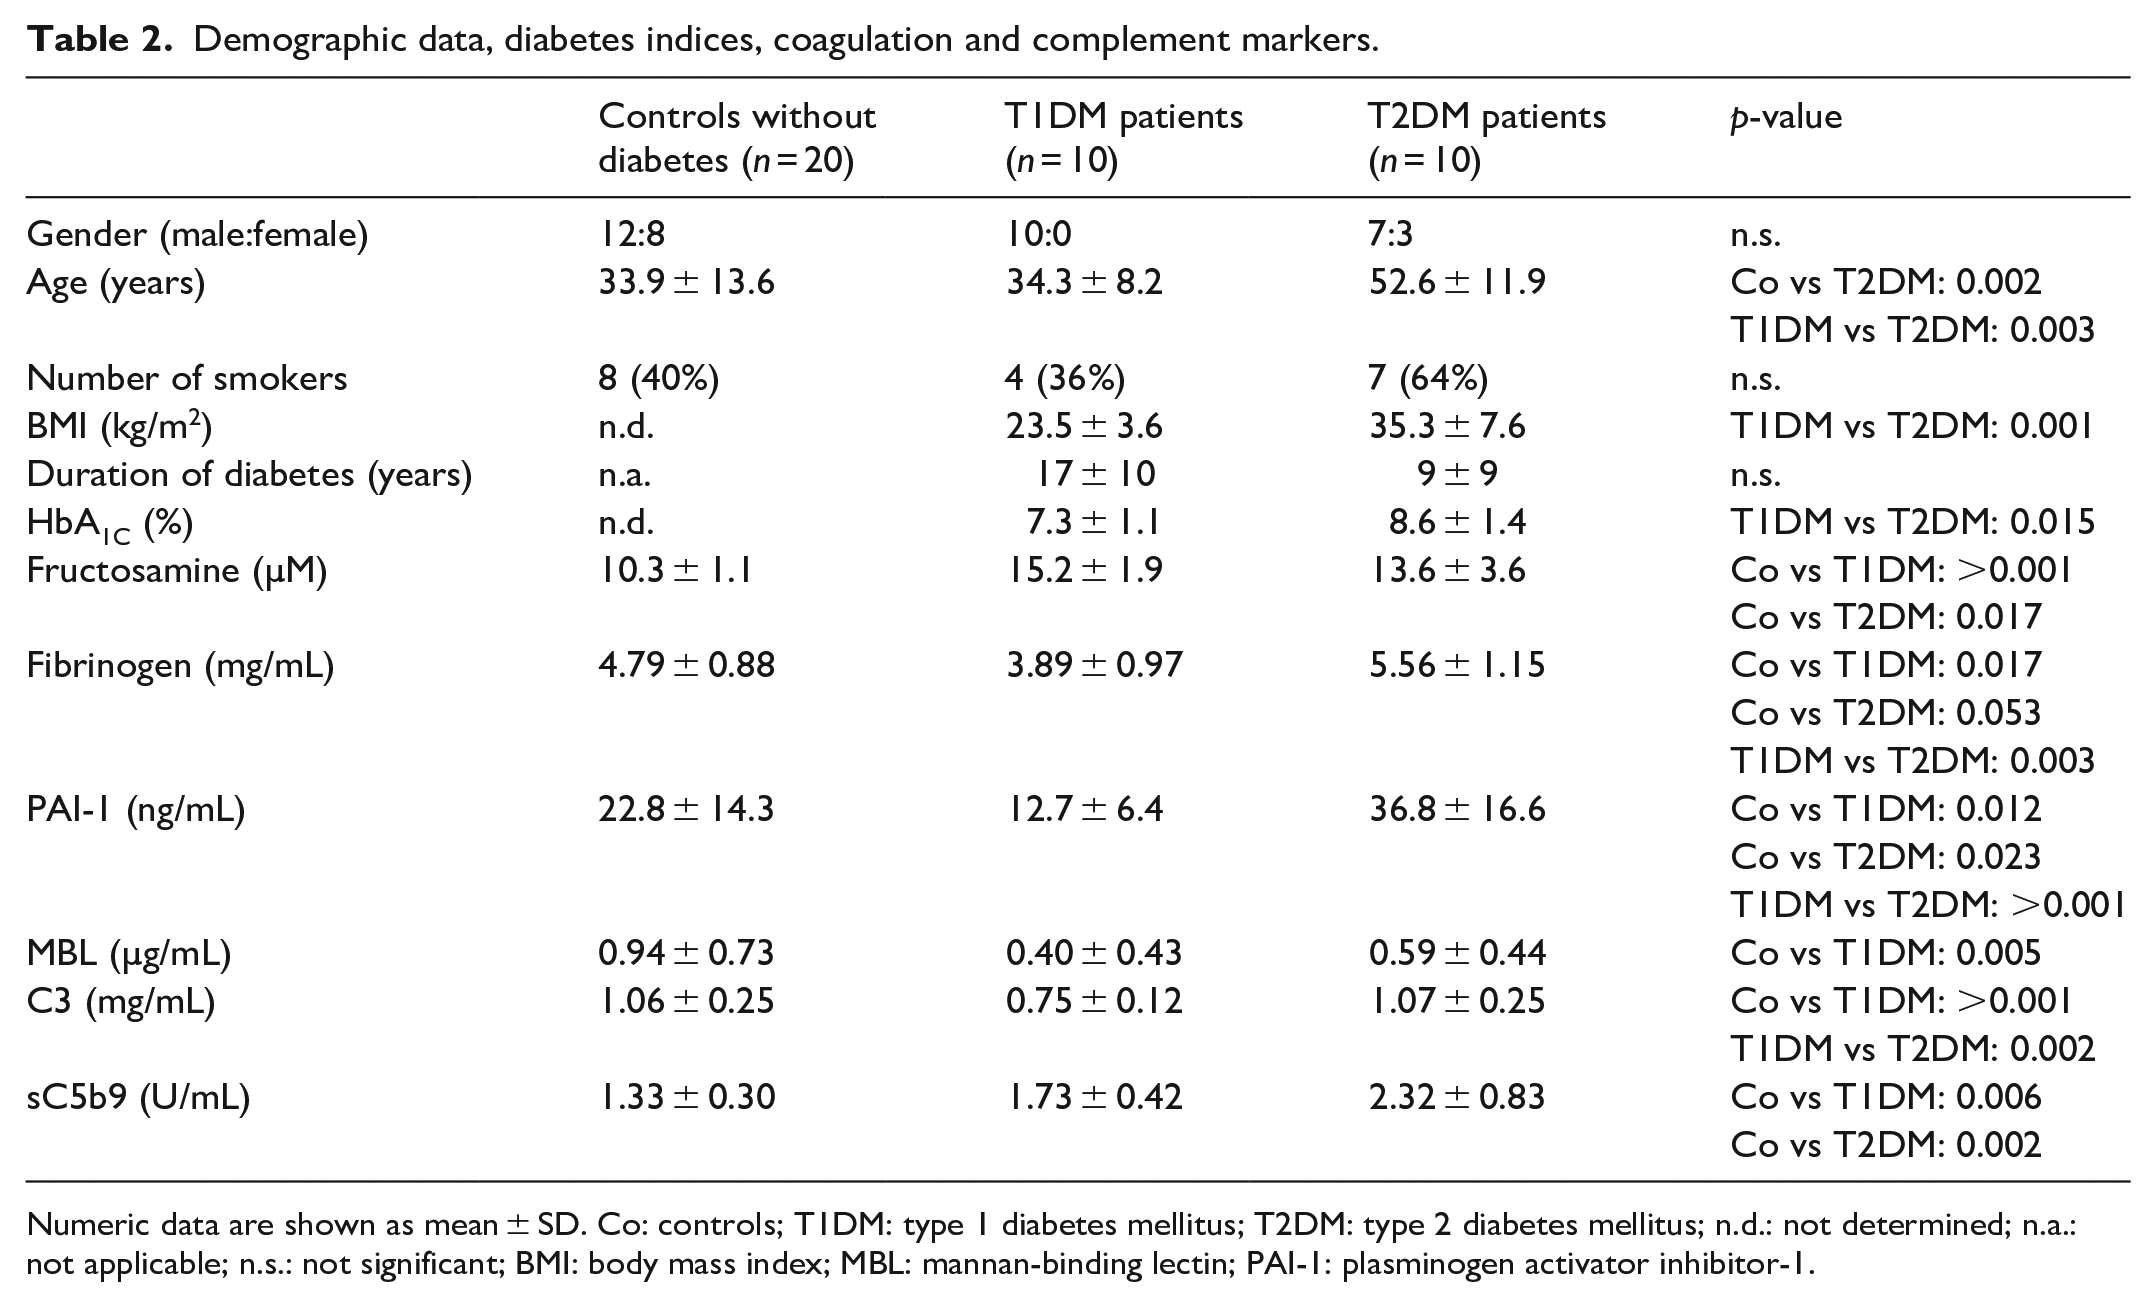
Numeric data are shown as mean ± SD. Co: controls; T1DM: type 1 diabetes mellitus; T2DM: type 2 diabetes mellitus; n.d.: not determined; n.a.: not applicable; n.s.: not significant; BMI: body mass index; MBL: mannan-binding lectin; PAI-1: plasminogen activator inhibitor-1.
Circulating biomarker analysis in non-diabetic and diabetic plasma samples
We measured several proteins of the coagulation/fibrinolysis (fibrinogen, PAI-1)20,21 and complement system (MBL, C3, sC5b-9)14,15 that are associated with diabetes and reflect the procoagulant and proinflammatory state. Fructosamine is a marker for non-enzymatic protein glycation. As shown in Table 2, fructosamine levels were significantly higher in diabetes patients than in controls. Fibrinogen, PAI-1 and sC5b-9 levels were highest in patients with T2DM. On the contrary, fibrinogen, PAI-1, MBL and C3 levels were lowest in patients with T1DM.
Clot formation in the diabetic microvascular flow model
As illustrated schematically in Figure 4, clot formation experiments with the microvascular flow model were always performed with one freshly drawn blood sample (from a control individual without diabetes, a T1DM patient, or a T2DM patient) that was used to perfuse parallel microchannels coated with non-diabetic endothelial cells and diabetic (type 1 or type 2) endothelial cells in duplicates.
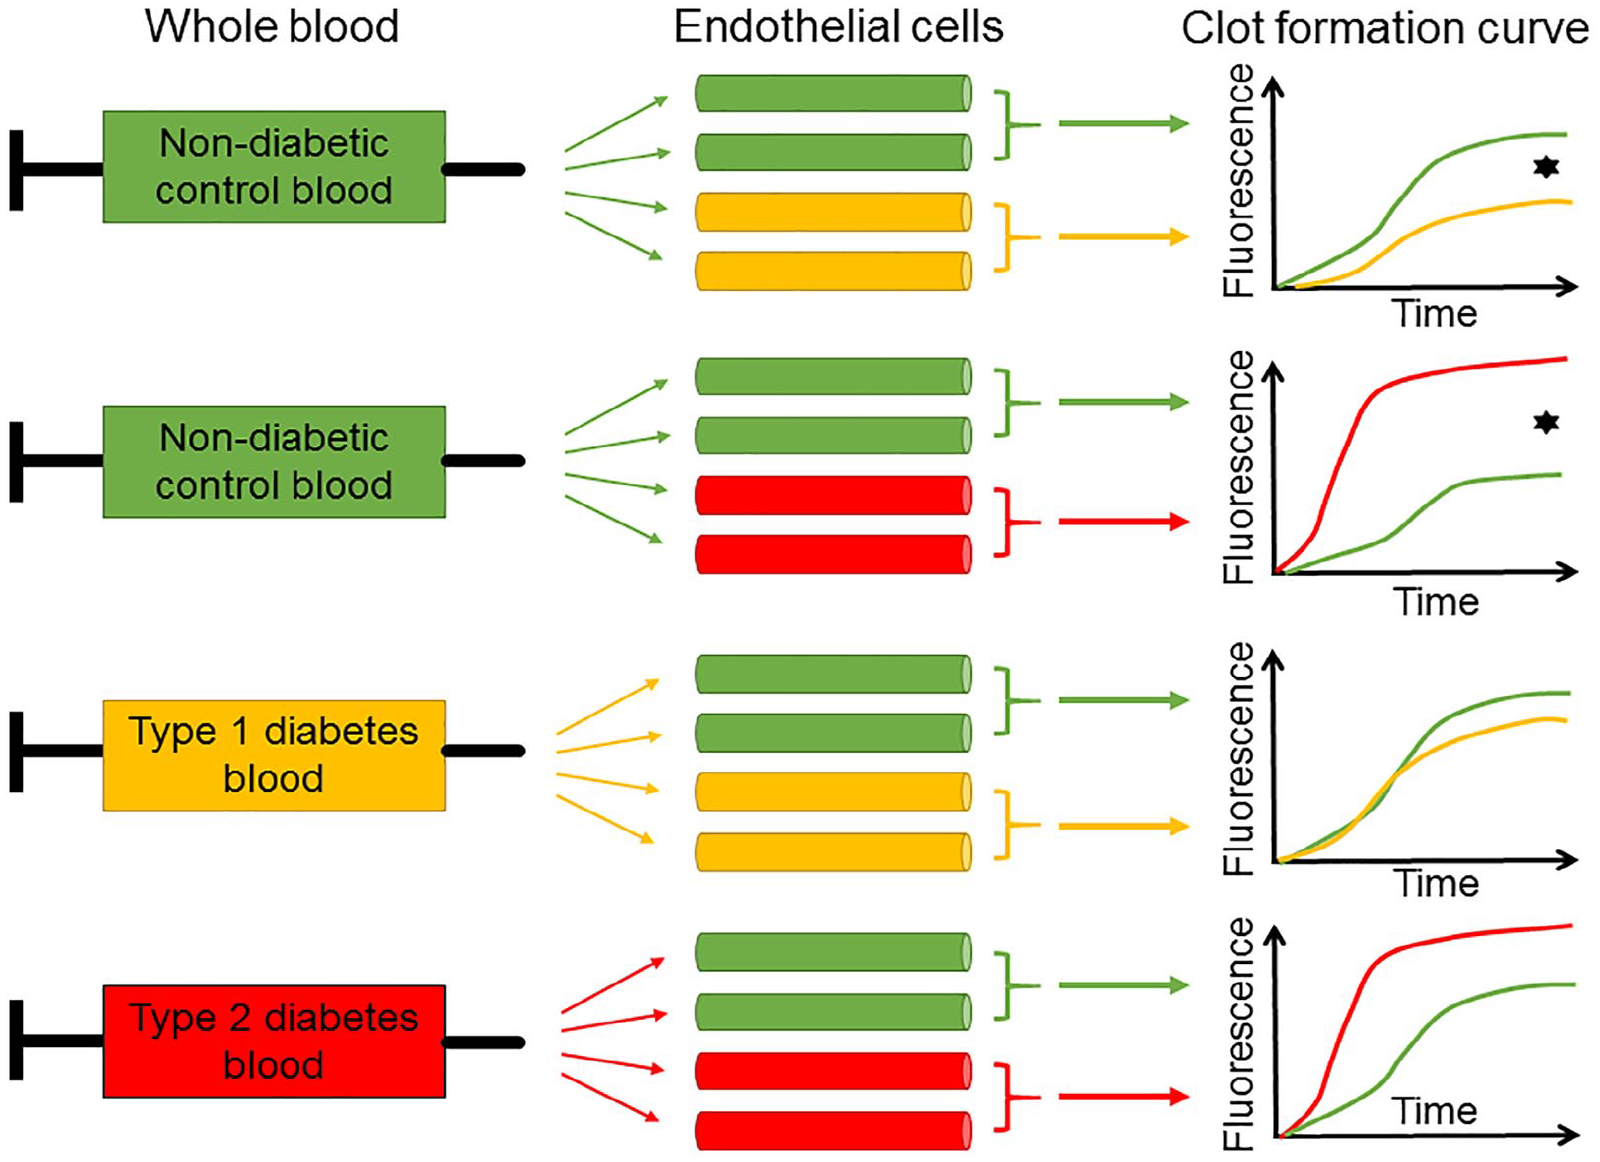
Schematic illustration of clot formation experiments in the diabetic microvascular flow model. This figure explains the complex study design but does not accurately reflect the results. Non-diabetic (green), type 1 diabetic (yellow) or type 2 diabetic (red) whole blood was used to perfuse parallel microchannels coated with non-diabetic (green), type 1 diabetic (yellow) or type 2 diabetic (red) primary human cardiac microvascular endothelial cells. Clot formation was recorded over time. The black star symbolises statistical significance.
In the T1DM model (Table 3), when non-diabetic blood was used, perfusion of microchannels coated with endothelial cells from T1DM donors showed a significantly lower clot formation compared to microchannels coated with non-diabetic cells. However, when whole blood from T1DM patients was used, there was no difference in clot formation compared with non-diabetic blood, neither in microchannels coated with non-diabetic endothelial cells nor in microchannels coated with T1DM endothelial cells.
Clot formation in type 1 diabetes.
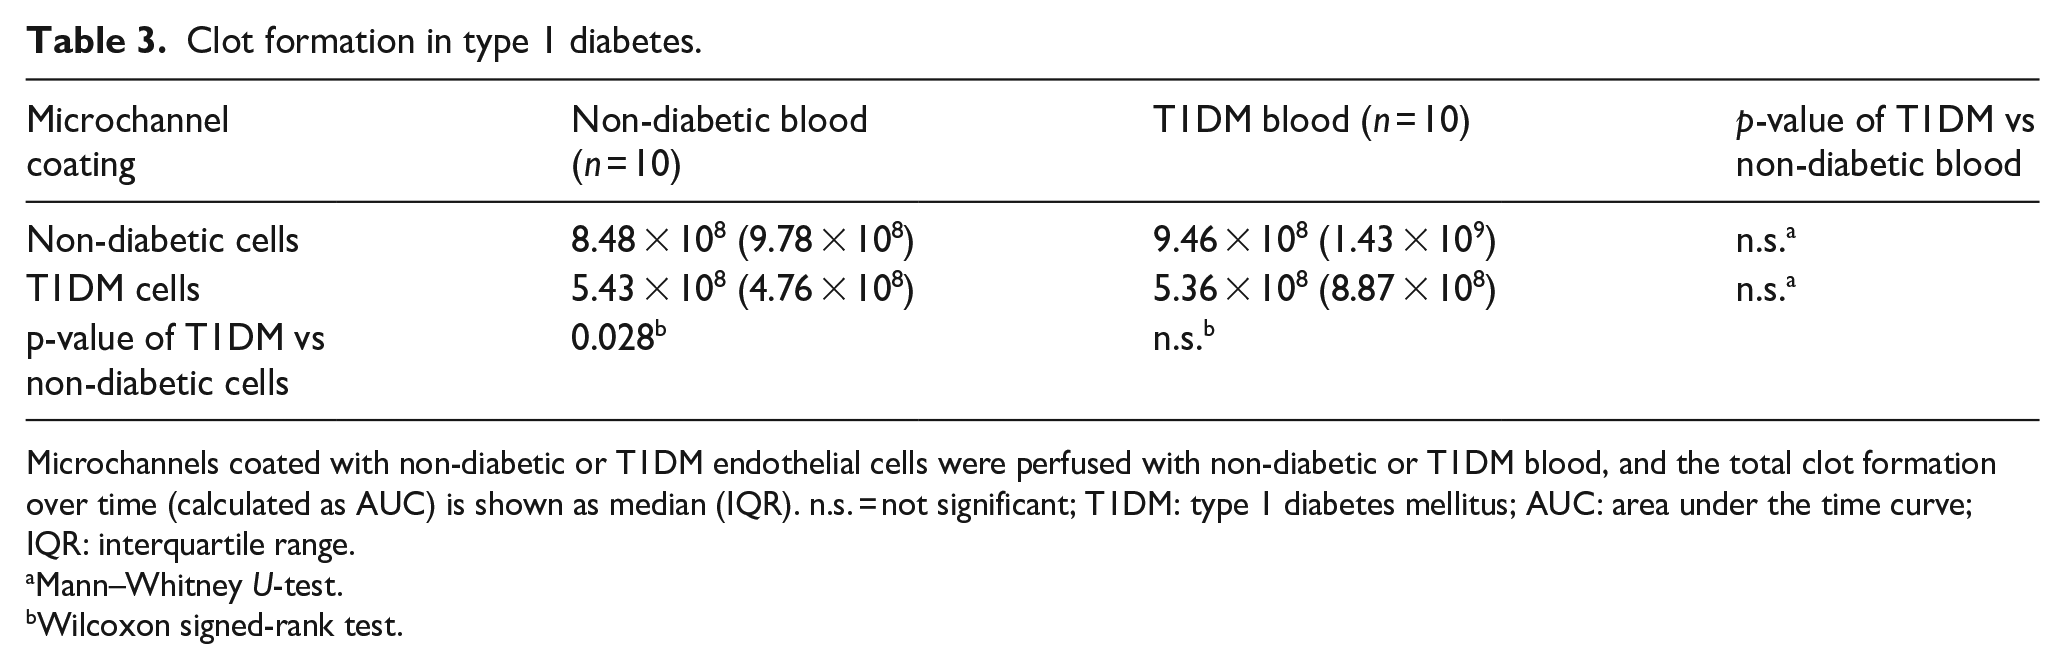
Microchannels coated with non-diabetic or T1DM endothelial cells were perfused with non-diabetic or T1DM blood, and the total clot formation over time (calculated as AUC) is shown as median (IQR). n.s. = not significant; T1DM: type 1 diabetes mellitus; AUC: area under the time curve; IQR: interquartile range.
Mann–Whitney U-test.
Wilcoxon signed-rank test.
In the T2DM model (Table 4), clot formation in non-diabetic whole blood was significantly increased in the presence of T2DM endothelial cells compared with non-diabetic endothelial cells. Again, there was no difference in clot formation between non-diabetic blood and blood from T2DM patients, neither in microchannels coated with non-diabetic endothelial cells nor in microchannels coated with T2DM endothelial cells.
Clot formation in type 2 diabetes.
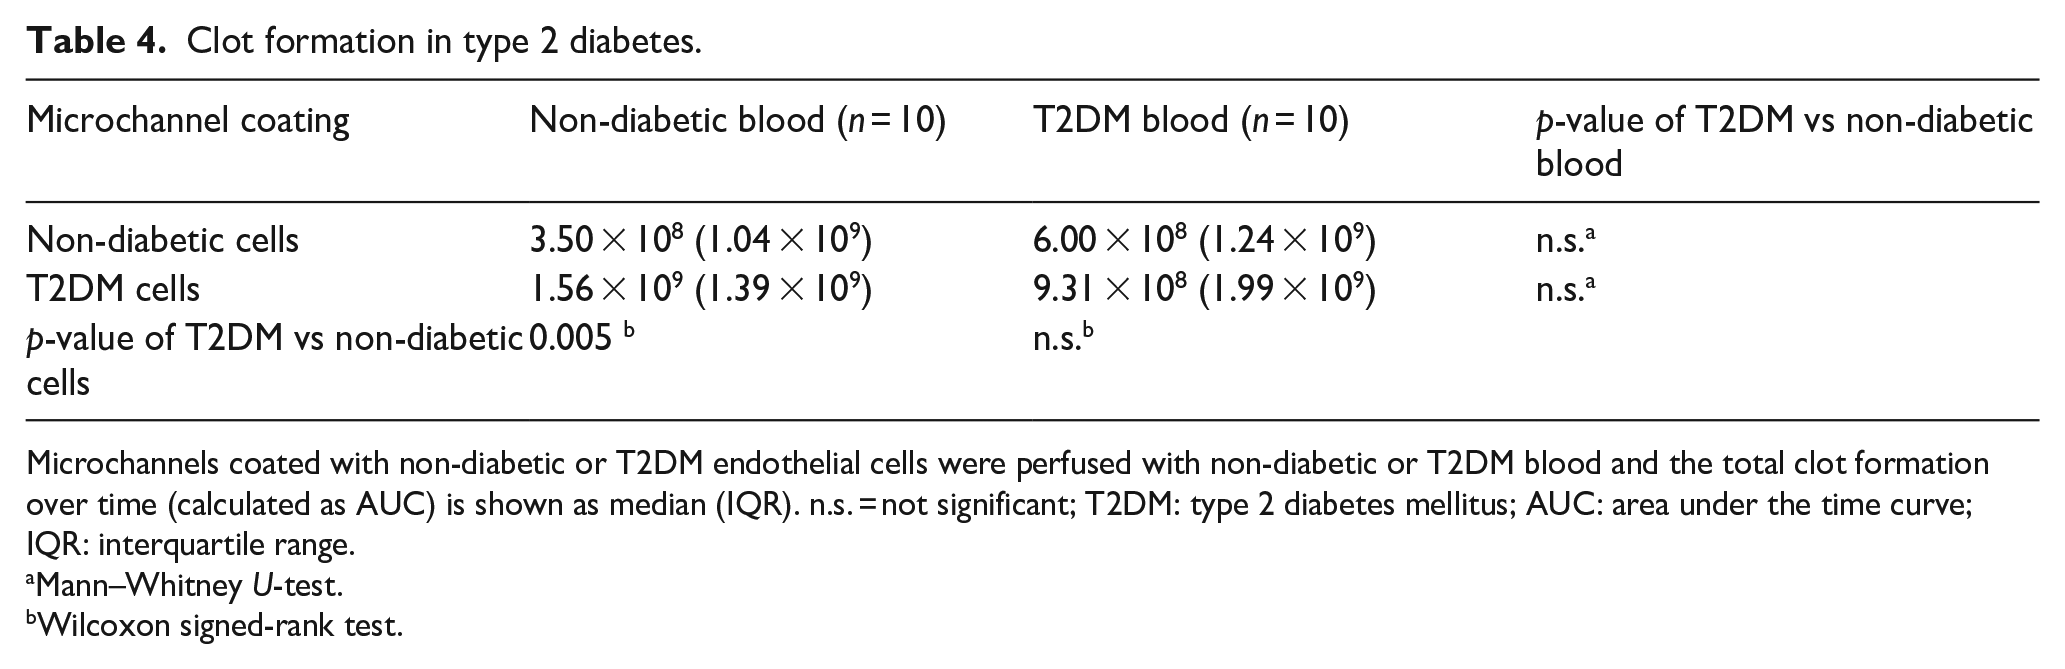
Microchannels coated with non-diabetic or T2DM endothelial cells were perfused with non-diabetic or T2DM blood and the total clot formation over time (calculated as AUC) is shown as median (IQR). n.s. = not significant; T2DM: type 2 diabetes mellitus; AUC: area under the time curve; IQR: interquartile range.
Mann–Whitney U-test.
Wilcoxon signed-rank test.
When we compared the three ‘pure’ combinations non-diabetic (i.e. non-diabetic cells and non-diabetic blood), T1DM (i.e. T1DM cells and T1DM blood), and T2DM (i.e. T2DM cells and T2DM blood), the T2DM setting showed a tendency towards increased clot formation compared with the non-diabetic and T1DM setting (Figure 5), but interindividual variability was high and the differences did not reach statistical significance.
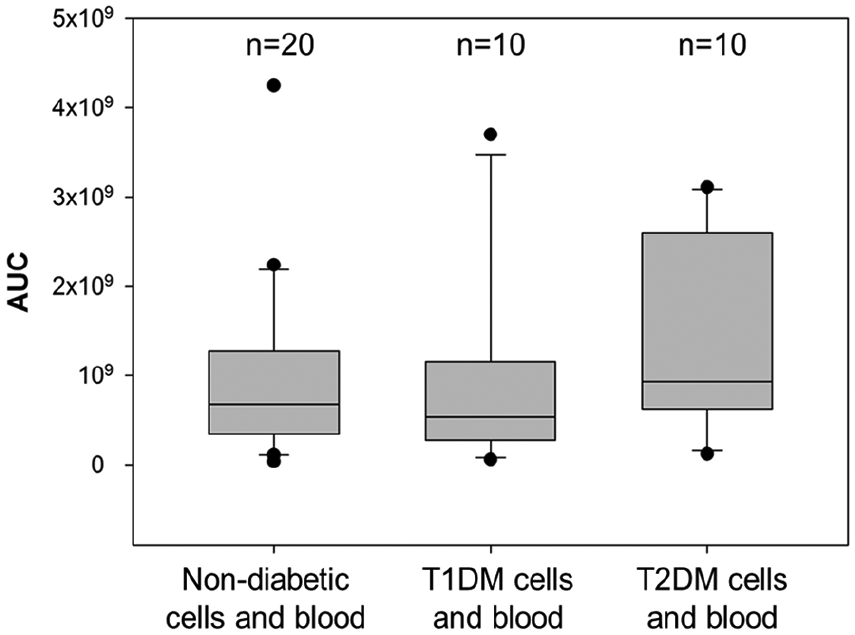
Comparison of clot formation between the pure non-diabetic, type 1 and type 2 diabetic models. Boxplots (representing median and interquartile range, with error bars showing the 10th and 90th percentile and black dots representing outliers) show the clot formation observed in non-diabetic cells perfused with non-diabetic blood, T1DM cells perfused with T1DM blood and T2DM cells perfused with T2DM blood.
Taken together, our results show for the first time that diabetic endothelial cells have a significant effect on clot formation when evaluated together with non-diabetic whole blood. This effect was, however, overridden when non-diabetic blood was replaced by diabetic blood, which may be attributed to the large interindividual variation observed in particular in diabetes patients or to certain characteristics in the blood that have a stronger effect on clot formation than the effects of diabetic endothelial cells. We, therefore, also investigated possible correlations between the analysed circulating biomarkers and clot formation. Yet none of the analysed biomarkers showed a significant correlation with the extent of clot formation (data not shown).
Discussion
Diabetes is a major cause of cardiovascular disease. In particular in T2DM, metabolic risk factors cluster and lead to a proinflammatory and prothrombotic state. But also T1DM is associated with an increased cardiovascular risk, and changes in plasma and cell surface proteins due to non-enzymatic glycation also occur as a response to hyperglycaemia in both diabetes types, as shown in our study by the elevated levels of fructosamine in both T1DM and T2DM patients versus individuals without diabetes. Taken together, diabetes is associated with elevated plasma concentrations of proinflammatory proteins (including complement components and activation products) and procoagulant/antifibrinolytic proteins, functional changes of plasma proteins, increased expression of certain cell surface proteins (e.g. adhesion proteins), hyperreactive thrombocytes, and endothelial dysfunction and endothelial damage. How all these changes interact and eventually affect blood clot formation in diabetes has to our knowledge never been studied in a model that integrates endothelial cells, blood cells and plasma in a close-to-physiological system with a physiological geometry and blood flow.
Our main novel finding was the significant effects of diabetic HMVECs on clot formation. It was striking that T2DM HMVECs led to a stronger clot formation, while the presence of T1DM cells reduced clot formation when perfused with non-diabetic whole blood. The procoagulant effect observed with T2DM HMVECs can be explained by endothelial dysfunction persisting even in cell culture due to the metabolic memory of endothelial cells caused by epigenetic modifications.11,34 But why did the T1DM HMVECs in our study show an opposite effect? Considering that T1DM is mostly diagnosed and controlled in early years – supported also by the fact that our T1DM blood donors had lower HbA1c, coagulation and inflammatory biomarkers than the T2DM donors – the epigenetic changes in T1DM HMVECs might be less pronounced than in T2DM HMVECs and therefore did not exhibit a procoagulant phenotype.
In order to characterise the primary HMVECs used in this study, we measured the expression of three markers, AGE receptor, fibronectin and PAI-1, which are differently expressed in and associated with diabetes.27–33 However, the high interindividual variation and small number made it difficult to draw a final conclusion.
We also observed a high interindividual variation in the circulating biomarkers. Our results are consistent with reports of elevated plasma levels of fibrinogen, PAI-130 and the complement activation marker sC5b-9 in diabetes.35,36 In contrast to published reports, including own results from an earlier study, that had shown elevated levels of C317,18 and MBL37,38 in diabetes, we observed lower MBL and C3 levels in plasma samples from T1DM patients and similar levels in T2DM samples compared to the control group. This unexpected finding might be explained by strong complement activation and consequently partial depletion of complement proteins, a hypothesis supported by high levels of sC5b-9 that showed an inverse correlation with MBL levels in our T1DM samples. Complement activation in diabetes can occur as a consequence of constant systemic inflammation in diabetes39,40 and also on glycated cell surface proteins which have been shown to activate the complement lectin pathway. 41 In addition, MBL plasma levels depend to a large extent on genetic polymorphisms, and MBL deficiency has been reported in up to 10%–20% of the Caucasian population.42,43 Whether the similarity and lack of differences in MBL and C3 levels between control individuals without diabetes and T2DM patients were also connected to lack of difference in clot formation between non-diabetic and T2DM blood seems unlikely but cannot be excluded. We also observed unexpectedly low levels of fibrinogen and PAI-1 in the T1DM group and relatively high levels in the control group. There may be several possible explanations, as these three proteins are all influenced by multiple environmental, acquired and genetic factors. Fibrinogen and also C3, of course, are acute phase proteins and undergo acute changes upon exposure to pathogens. PAI-1 levels are affected by the common 4G/5G promoter polymorphism. Our T1DM patients may also have a less pronounced cardiovascular risk profile due to a deliberately healthier lifestyle and good medical care. A major factor, however, may be the small sample size which is of course more sensitive to extreme values than a larger patient population. We hypothesise that the latter, a high interindividual variation combined with the small sample size, may be the main reason for the unusual biomarker results.
Our study has of course several limitations. Ideally we would have tested endothelial cells and blood from the same patient, but it is not possible to obtain cardiac microvascular endothelial cells from living patients. We therefore used cardiac microvascular endothelial cells from deceased donors who had no diabetes or diagnosed T1DM or T2DM. These primary endothelial cells proved perfectly viable in cell culture and grew to confluent monolayers in our microchannels. However, only two donors had died of non-vascular causes (accident and asthma attack), and the other donors including one control individual without diabetes had succumbed to stroke. Unfortunately we have no information on the type of stroke; however, an underlying arterial disease is very likely. We can also not exclude the possibility that death has affected the endothelial cells and may explain the inconsistent expression patterns of the cell markers we studied. Another limitation is the small number of different cell and blood donors, and with a high interindividual variation this makes it more difficult to reach consistent and significant results. On the other hand, our study setting may be closer to ‘real-life’ where the average patient does not exist.
Diabetes is a complex multifactorial disease that is difficult to express in only a few biomarkers. We believe that a comprehensive diagnosis, which also takes the proinflammatory and procoagulant state into account for an estimation of the imminent or future risk of cardiovascular complications, will become more important in the management of diabetes in the future. Medicine is moving towards personalised or precision medicine, and this is also under discussion for the management of diabetes.44,45 However, personalised medicine for a complex multifactorial disease such as T2DM is a great challenge. 45 Novel diagnostic systems and models similar to the one we have described here may help to assess an individual patient’s status and risk of complications and monitor multitargeted therapies.
Conclusion
We present for the first time a diabetic microvascular flow model as a new tool to study the complex interactions between endothelial cells, blood cells and plasma proteins and their effects on clot formation under physiological flow conditions. We have shown that endothelial cells affect clot formation in whole blood, with cells from T2DM donors promoting a stronger clot formation compared with cells from T1DM donors and donors without diabetes. In the future, models similar to ours may contribute to a personalised management of diabetes and identify patients at risk of thrombotic events, but more research is clearly needed to validate such models.
Footnotes
Acknowledgements
The authors would like to thank Dr Fabian Blank and Carlos Wotzkow from the Microscopy Imaging Center (Department for BioMedical Research, University of Bern) for their technical support in confocal microscopy. We thank Dr Volker Enzmann and Ms Stephanie Lötscher for their help and expertise with the quantitative polymerase chain reaction (qPCR) facility. We further thank Ms Claudia Quarroz and Mr Fabian Luther for expert blood sampling. We also thank Dr Karen Porter, University of Leeds, UK, for advice on culturing diabetic endothelial cells.
Author contributions
L.J. designed and performed the experiments, analysed the data and wrote the manuscript. A.M. recruited the diabetes patients and reviewed the manuscript. M.L. reviewed the manuscript. E.T.H. produced the wafers used for the device and reviewed the manuscript. W.L. developed the original microvascular flow model and reviewed the manuscript. V.S. designed the study, analysed the data and wrote the manuscript.
Declaration of conflicting interests
The author(s) declared no potential conflicts of interest with respect to the research, authorship and/or publication of this article.
Funding
The author(s) disclosed receipt of the following financial support for the research, authorship and/or publication of this article: This work was supported by grants from the Swiss National Science Foundation (grant 310030_166413) and OPO Foundation awarded to V. Schroeder.