
Abstract
Objective:
To study the structural changes in the choroid of diabetic patients following cataract surgery, using choroidal vascularity index and choroidal thickness.
Methods:
A prospective case–control study was conducted in 18 diabetic and 18 non-diabetic patients undergoing cataract surgery (phacoemulsification) in one eye. Enhanced depth imaging optical coherence tomography images were obtained before and after surgery. Niblack’s image binarization of images was performed to derive the choroidal vascularity index. Independent sample T-test compared the differences of choroidal vascularity index and choroidal thickness between diabetic and non-diabetic patients.
Results:
The baseline choroidal vascularity index was significantly lower in diabetic patients for both operated (mean difference vs non-diabetic: 0.0184, 95% CI: 0.004–0.0324, p = 0.012) and non-operated (mean difference vs non-diabetic: 0.0145, 95% CI: 0.003–0.0256, p = 0.012) eyes. Choroidal thickness increased following cataract surgery (diabetes: mean difference = 12.4, 95% CI: 0.70–24.0, adjusted p = 0.036; non-diabetic: mean difference = 21.0, 95% CI: 4.39–37.6, adjusted p = 0.011).
Conclusion:
Diabetic patients have reduced choroidal vascularity index than non-diabetic patients, suggestive of possible reduction in choroidal vascularity in diabetes. Choroidal thickness increased following cataract surgery in both diabetic and non-diabetic patients.
Introduction
Diabetes mellitus (DM) is a leading cause of blindness worldwide, with approximately 36.4% of patients suffering from some form of diabetic retinopathy (DR) and 10.2% afflicted with vision-threatening DR. 1 Patients also tend to develop visually significant cataracts earlier, and cataract surgery is essential in restoring vision and enabling diagnosis and monitoring of DR. 2 Patients with severe non-proliferative or proliferative DR tend to have less pronounced improvement in visual acuity and a longer period of visual rehabilitation following cataract surgery than those with milder disease. 3
Diabetes affects the microcirculation of the body, in particular, the eye as evident by the formation of microaneurysms, intraretinal haemorrhages, selective loss of pericytes from retinal capillaries and subsequent loss of endothelial cells. 4 The choroid, which is in close relation to the outer retinal layer, has also been shown to have anatomical abnormalities in diabetes. These changes include increased vascular tortuosity, microaneurysm formation, narrowing of choriocapillary lumen, endothelial cell loss and capillary fall-out.5–9 Animal studies of the choroid in rats with diabetes have shown diminished erythrocyte flow. 10 Choroidal blood flow has also been shown to vary with increasing levels of DR and in eyes with laser-treated proliferative DR.11,12
With the advent of non-invasive tools like enhanced depth optical imaging coherence tomography (EDI-OCT), choroidal thickness (CT) has been studied in various ocular diseases. Despite being proposed repeatedly as a plausible indicator of ocular and systemic health, there exist great discrepancies in the findings of CT changes in various ocular diseases.13–16 For instance, CT has been shown to vary in patients with DM and DR when compared with those without diabetes, but there is no consensus as to whether the CT increases or decreases in either condition.15–19 It is therefore paramount to develop more robust and reliable markers of choroid health.
More recently, structural changes in the choroid could be studied in detail using customized software and more detailed en-face choroidal scans.20,21 Sonoda et al. 22 described a novel method of differentiating and quantifying choroidal luminal area (LA), stromal area (SA) and sub foveal total choroidal area (TCA) through binarization of EDI-OCT images. Adapting from this technique, Agrawal et al. 23 coined the term choroidal vascularity index (CVI) as a parameter to specifically access the choroid’s vascular status. We have previously established normative CVI range in a population study and found that unlike CT, CVI is not influenced by various demographic factors such as age and sex. 23
Using CT and CVI, we aim to quantify the longitudinal changes in the choroid of diabetic patients after cataract surgery. The baseline differences between the choroids of patients with and without diabetes will also be established. Finally, we aim to study the validity and repeatability of the binarization technique and CVI as novel tools to study the choroid in diabetes.
Methods
Research and ethics committee approval was obtained prior to the commencement of the study. Informed consent was obtained from all patients and the study was conducted as per tenets set forth in the Declaration of Helsinki. The data sets generated and/or analysed during this study are available from the corresponding author on reasonable request.
Study subjects
This was a prospective case-controlled study of 18 type-2 DM patients and 18 non-diabetic patients who underwent cataract surgery in one eye at a tertiary referral eye care centre in Singapore from April 2013 till April 2015. The operated eyes were grouped as ‘diabetic operated’ and non-diabetic operated’. The fellow eyes (not operated) of all patients were divided into ‘diabetic-control’ and ‘non-diabetic-control’ groups.
All patients underwent a standard ophthalmologic examination with a dilated fundal examination. Fundus photos were taken and the severity of the diabetic eye disease was graded according to the Early Treatment Diabetic Retinopathy Study (ETDRS). 24 In addition, all patients had automated refraction and axial length (AL) measured with ZEISS IOL Master v. 700.
Patients with any prior ocular history that may affect CT, including age-related macular degeneration, arterial or vein occlusions, uveitis, glaucoma and other retinal disorders were excluded. Patients with myopia greater than −6.00 diopters or recent ocular surgery, laser or intravitreal injections within the last 3 months were also excluded.
We followed up all patients prospectively till 3 months after surgery. Patients were assessed during three visits with EDI-OCT images taken each time. Visit 1 established the baseline 3 months prior to surgery. Visit 2 and 3 were follow-ups at post-operative 1 and 3 months, respectively.
Cataract surgery
All patients underwent cataract surgery by phacoemulsification technique by the same surgeon; the duration of each operation was approximately 10 min. All patients had intraocular lens implantation in one eye using a standard technique under topical anaesthesia. None of the patients had any intra- or post-operative complications. All patients had acrylic lenses implanted into their capsular bags and had one month of topical steroids (prednisolone acetate eye drops every 3 h for a week, then 4 times a day for 3 weeks) following surgery.
Image acquisition
EDI-OCT scans of the macula were performed for both eyes of all patients using spectral-domain OCT (Spectralis HRA OCT, Heidelberg Engineering, Germany). Horizontal 6 mm line scans centred on the fovea were obtained (Figure 1).
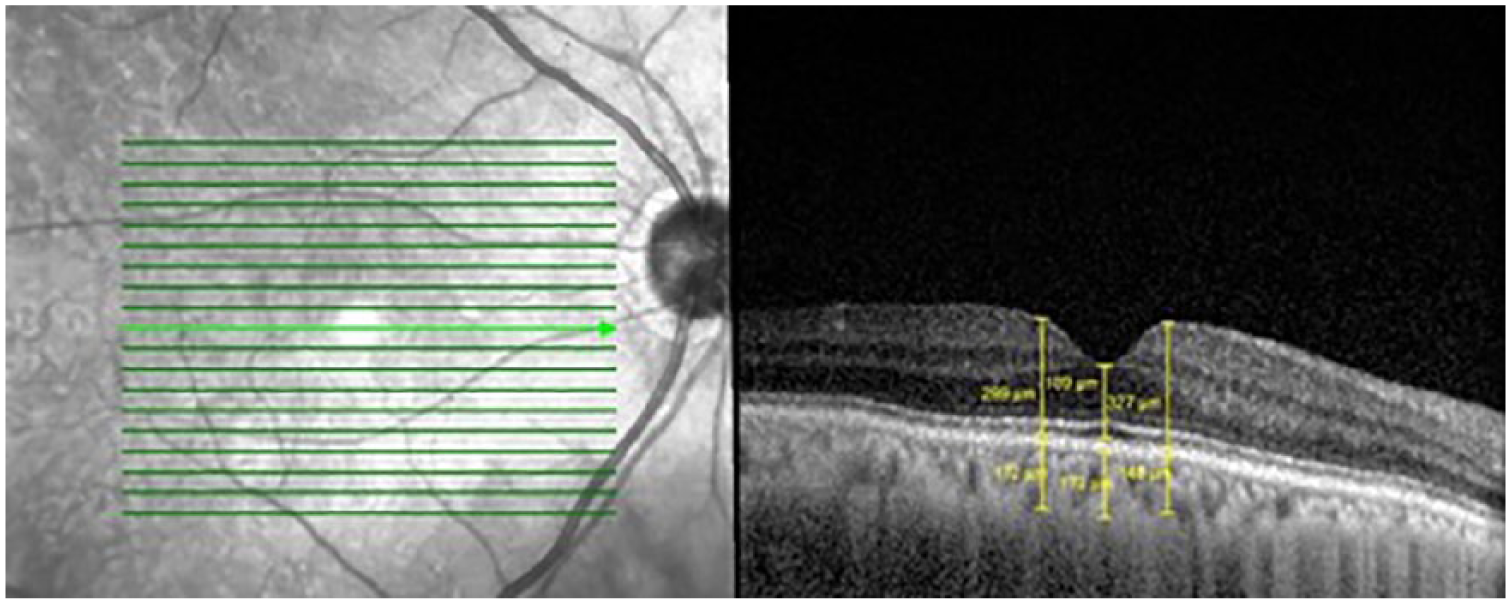
Choroidal thickness (CT) measurement of a diabetic patient’s operated eye.
CT measurement
Section through the fovea, indicated by the light green arrowed line, was selected (Figure 1). CT was measured using the in-built callipers tool at three points (sub foveal, 500 µm temporal and nasal to the fovea; Figure 1) and the average value was used for analysis. CT was defined as the vertical distance between the Bruch’s membrane and the choroidal-scleral interface.
Image binarization
One central scan passing through the fovea for both eyes of all patients was selected. The images were binarized and segmented using the protocol described by Sonoda et al. with modifications. The image binarization was done using public domain software ImageJ (http://imagej.nih.gov/ij,version2.0.0-rc.15/1.49j,date:2014-10-06).22,25
According to the segmental nature of choroidal blood supply, polygon tool was used to select a sub-foveal choroidal area of width 1500 μm centred on the fovea as the segmented representative of the macular region. 26 The selected area (TCA) was measured and added to the region of interest (ROI) manager.
The image was converted to 8 bit, and Niblack’s autolocal threshold was applied to binarize the image, giving mean pixel values with standard deviation for all the points (Figure 2(b)). Subsequently, the image was converted to RGB (red, green, blue) and a colour threshold was applied to select dark pixels. This selected area was also added to the ROI manager.
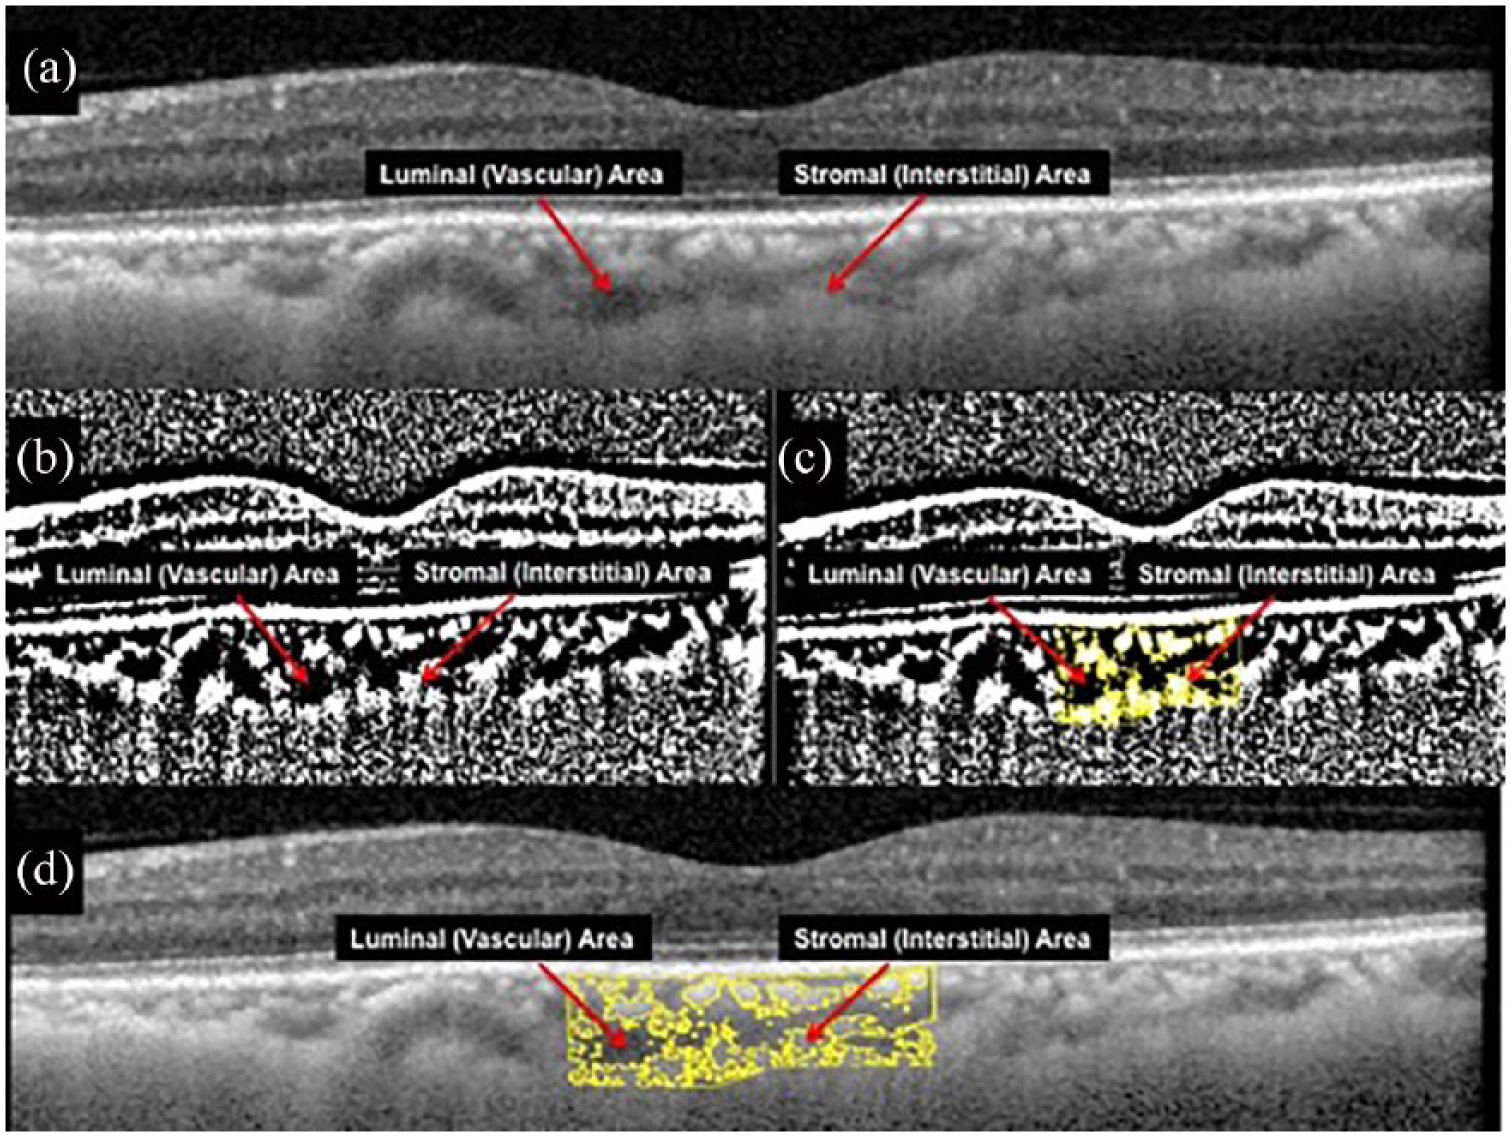
(a) EDI-OCT scan of the choroid demonstrating dark pixelated areas (assumed as luminal area) and light pixelated areas (assumed as stromal area). (b) Image binarization was performed using Niblack’s autolocal threshold on ImageJ (public domain software). (c) Selection of choroid scleral interface and segmentation of the sub foveal choroidal area was performed after image binarization. (d) An overlay image of region of interest (ROI) of the binarized segment of the choroid on EDI OCT scan showing good overlap between dark and light areas as seen on the OCT scans.
LA was determined by selecting the two previously added areas and merging with AND operation. TCA was defined as the selected sub-foveal choroidal area; LA or vascular area was defined as the area of dark pixelsp; and SA or interstitial area was defined as the area of light pixels (Figures 2(c) and (d)). CVI was defined as the ratio of LA to TCA.
The same image binarization protocol was used for all scans. Two graders analysed all images and final values obtained were averaged after checking for inter-rater agreement.
Inter-rater agreement
Two independent graders (N.K. and K.T.) masked from patient information segmented the 72 images from 36 subjects. The inter-rater reliability for image binarization was indicated by the absolute agreement model of the intra-class correlation coefficient (ICC). ICC value of less than 0.40 indicates poor to fair agreement, while a good agreement is indicated by ICC value of 0.81–1.00.
Statistical methods
Statistical analyses were performed using SPSS version 25.0. Analysis of variance (ANOVA) was used to test for differences among multiple data groups. Post hoc analysis was performed with Bonferroni adjustment. The effects of age, AL, refractive error, mean arterial pressure (MAP), mean ocular perfusion pressure and glycated haemoglobin (HbA1c) on CT, LA, SA, TCA and CVI were determined independently using Pearson’s correlation coefficient.
Categorical data were expressed as absolute numbers, and continuous data as mean ± standard deviation (SD) with 95% confidence intervals constructed. A p-value of <0.05 was considered to be statistically significant.
Results
A total of 40 patients were initially recruited. Two patients with diabetes were excluded: one due to poor OCT image quality from media opacity, and the other had cataract surgery in the fellow eye within the period of the study. Two non-diabetic patients were excluded: one was medically unfit to proceed with cataract surgery, and the other had poor OCT image quality from media opacity. A total of 36 patients (18 diabetic and 18 non-diabetic) completed the study. Table 1 displayed the full demographic data of both patient groups.
Demographic data of diabetic and non-diabetic patients.
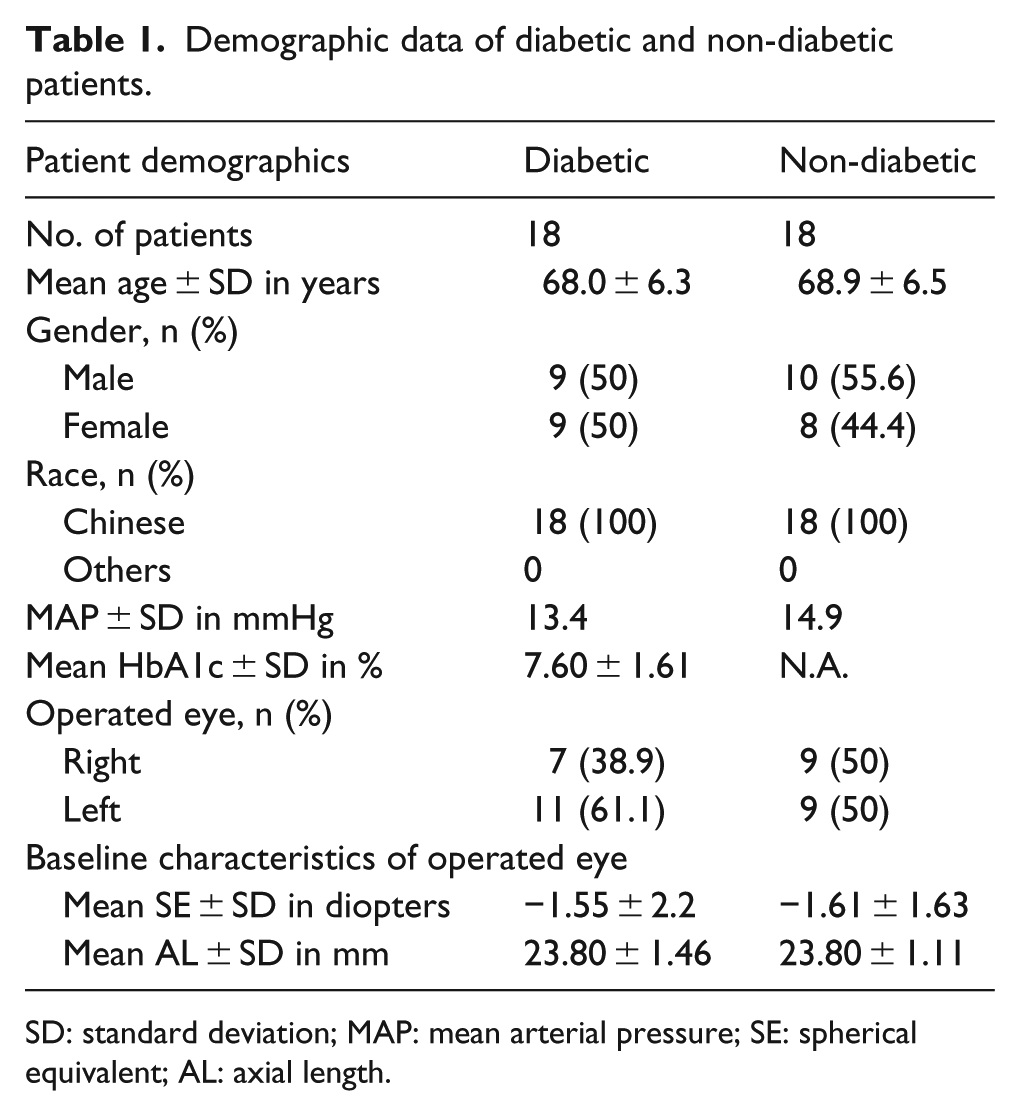
SD: standard deviation; MAP: mean arterial pressure; SE: spherical equivalent; AL: axial length.
All patients were ethnic Chinese. The number of male patients was 9 and 10 for diabetic and non-diabetic groups, respectively. The mean age of diabetic patients was 68.0 ± 6.3 years for diabetic and 68.9 ± 6.5 years for non-diabetic patients. The MAP was 13.4 mmHg for diabetic patients and 14.9 mmHg for non-diabetic patients. The mean spherical equivalent (SE) was similar in the operated eyes of both groups of patients (diabetic operated: –1.55 ± 2.20 D; non-diabetic operated: –1.61 ± 1.63 D).
HbA1c was selected to indicate the degree of disease control and was only measured in the group of patients with diabetes. Mean Hba1c was 9.6 (6.2–15.5) mmol/L with 11 (57.89%) patients on oral hypoglycemics and 1 (5.2%) patient on additional insulin therapy at the time of enrolment into the study. The average duration of treatment for diabetes was 86 (9–142) months. In the diabetic-operated group, 5 of 18 (27.8%) eyes had moderate DR and 4 of 5 (80%) such eyes had diabetic maculopathy. None of the patients had clinically significant macular oedema, and all of them were naive to treatment.
Inter-rater agreement
The graders segmented the images with a significantly high agreement. The ICC for CVI was 0.841 [95% confidence interval (CI): 0.710–0.916] for single measures and 0.914 (95% CI: 0.831–0.956) for average measures. The ICC for CT was 0.973 (95% CI: 0.947–0.986) for single measures, and 0.986 (95% CI: 0.973–0.993) for average measures. Since CVI was dependent on values of LA, SA and TCA, since CVI was shown to have a good inter-rater agreement, ICC was not computed for the latter three parameters.
CT
The mean CT at baseline for the diabetic-operated group was lower than non-diabetic-operated group (169.7 vs 177.4 µm, p = 0.727), but this difference was not statistically significant (Table 2). During follow-ups at 1 month (Visit 2) and 3 months (Visit 3) post-operatively, CT remained lower in the diabetic-operated group, but this difference was still not statistically significant (Visit 2: 182.2 vs 192.4 µm, p = 0.681; Visit 3: 182.1 vs 198.4 µm, p = 0.512) (Table 2).
Differences in mean choroidal thickness (CT), choroidal vascularity index (CVI), luminal area (LA), stromal area (SA), total choroidal area (TCA) between operated eyes of diabetic and non-diabetic patients.
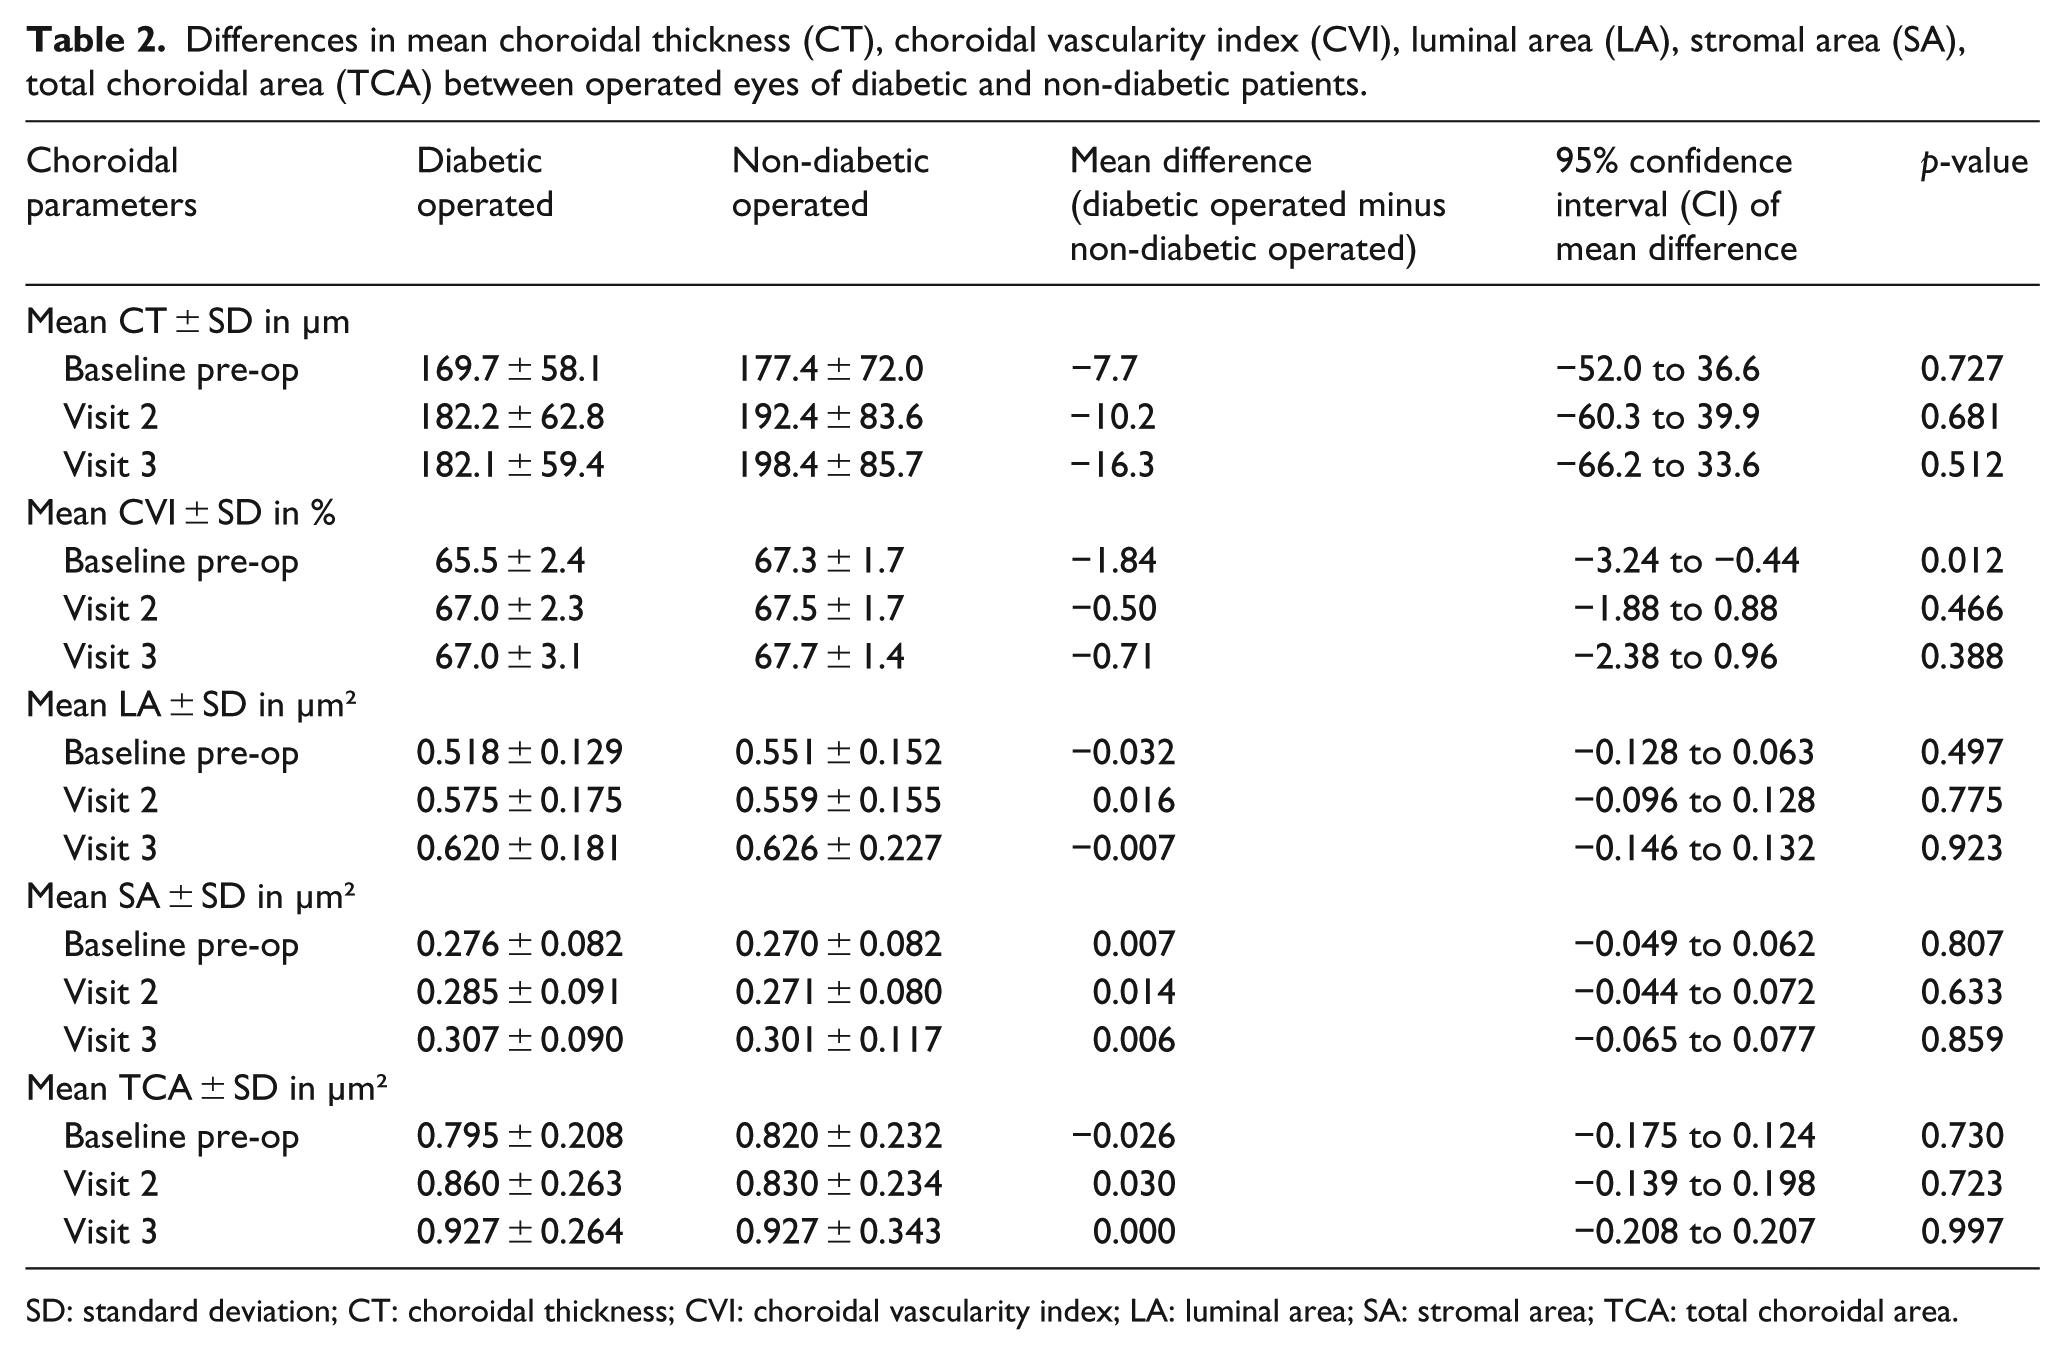
SD: standard deviation; CT: choroidal thickness; CVI: choroidal vascularity index; LA: luminal area; SA: stromal area; TCA: total choroidal area.
A one-way repeated-measures ANOVA suggested a statistically significant increase in CT after cataract surgery for the diabetic-operated group (p = 0.038) and non-diabetic-operated group (p = 0.004). In particular, there was a statistically significant increase in CT from Visit 1 to Visit 3 for both groups (diabetic operated: mean difference = 12.4 µm, 95% CI: 0.70–24.0, adjusted p = 0.036; non-diabetic operated: mean difference = 21.0 µm, 95% CI: 4.39–37.6, adjusted p = 0.011). Graphical representation of changes in CT is shown in Figure 3.
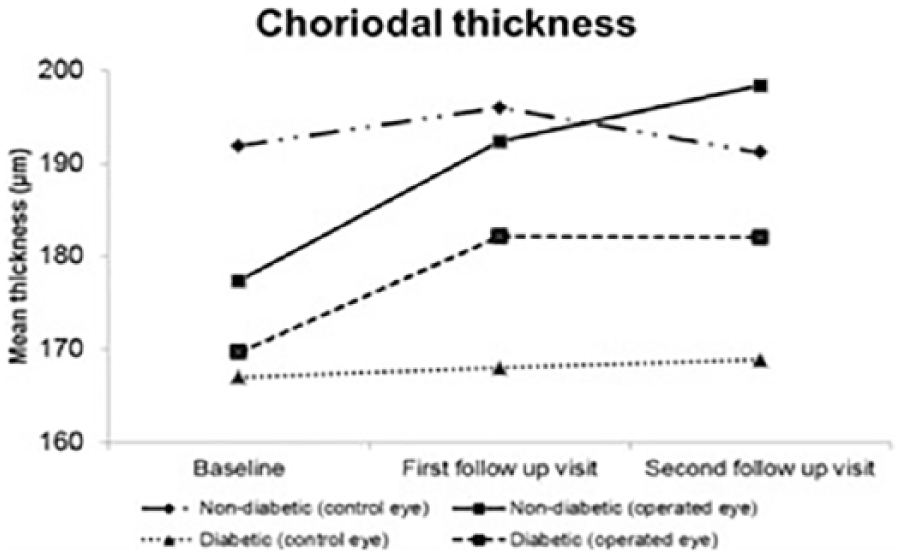
Graph of mean choroidal thickness (CT) for both operated and fellow control eyes of diabetic and non-diabetic patients at the three visits.
At all visits, there were no significant differences between CT of operated and control (fellow) eyes for both diabetic and non-diabetic patients (mean difference of CT for diabetic operated vs diabetic-control: Visit 1 = 2.71 µm, p = 0.780; Visit 2 = 14.1 µm, p = 0.213; Visit 3 = 13.2 µm, p = 0.183) (mean difference of CT for non-diabetic operated vs non-diabetic control: Visit 1 = –14.5 µm, p = 0.321, Visit 2 = –3.66 µm, p = 0.826, Visit 3 = 7.21 µm, p = 0.669).
For non-diabetic-operated group, that were statistically significant positive linear associations between CT and spherical equivalent at all visits (Visit 1: r = 0.610, p = 0.035; Visit 2: r = 0.597, p = 0.041; Visit 3: 0.589, p = 0.044). MAP displayed negative linear association with CT (r = –0.542, p = 0.030).
For diabetic-operated group, there were statistically significant negative linear associations between CT and AL at all visits (Visit 1: r = –0.595, p = 0.009; Visit 2: –0.703, p = 0.001; Visit 3: r = –0.629, p = 0.005). MAP displayed positive linear association with CT (r = 0.673, p = 0.004). There was no significant correlation between mean ocular perfusion pressure and CT.
CVI
At Visit 1 (pre-operative baseline), CVI was lower in the diabetic-operated group than the non-diabetic-operated group; CVI was also lower in the diabetic-control group than the non-diabetic-control group (operated: mean difference: –1.84%, p = 0.012; control: mean difference: –1.45%, p = 0.012).
At Visit 3, CVI increased in the diabetic-operated group than baseline; however, this difference was not statistically significant after Bonferroni adjustment (Visit 1: 65.5%, Visit 3: 67.0%, adjusted p = 0.074). As for the non-diabetic-operated group, CVI appears to be unchanged (Visit 1: 67.3%, Visit 3: 67.7%, p = 0.420; Figure 4).
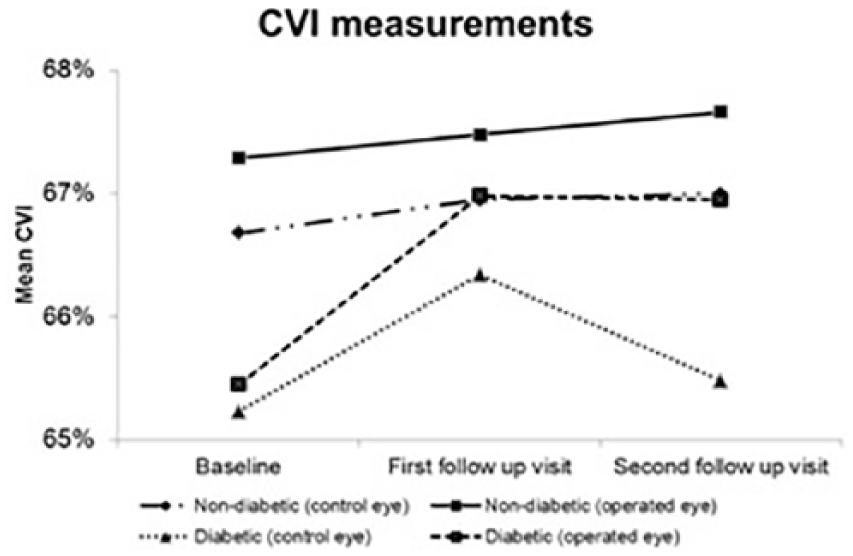
The mean choroidal vascularity index for both operated and control eyes of diabetic and non-diabetic patients at the three visits.
At all visits, there were no statistically significant differences in CVI between operated eyes and the fellow control eyes for the diabetes group. The same was observed in the non-diabetic group.
From Pearson’s correlation coefficients, there were no statistically significant linear associations between CVI and age, AL, MAP or HbA1c. The only statistically significant association was observed at Visit 2 for the non-diabetic-control group, it was a positive linear association between CVI and spherical equivalent (r = 0.597, p = 0.015).
LA, TCA and SA
Comparing the diabetic-operated and non-diabetic-operated groups, no statistically significant differences in LA, TCA, and SA were found at all visits (Table 2).
Analyses of individual subgroups are as follow. At Visit 3, LA increased in both the diabetic-operated group (Visit 3 vs Visit 1 mean difference = 0.101) and non-diabetic-operated group (Visit 3 vs Visit 1 mean difference = 0.075; Table 2). Post-hoc pairwise comparisons with Bonferroni adjustment found the increase in LA for the diabetic-operated group to be statistically significant (adjusted p = 0.038), while the increase in LA for the non-diabetic-operated group was not statistically significant (adjusted p = 0.078),
As for TCA, there were statistically significant increments in both the diabetic operated (Visit 3 vs Visit 1 mean difference = 0.132, p = 0.027) and non-diabetic operated (Visit 3 vs Visit 1 mean difference = 0.107, p = 0.027) groups at Visit 3. However, after Bonferroni adjustment, none of the increments were found to be statistically significant (diabetic-operated: adjusted p = 0.079; non-diabetic-operated: adjusted p = 0.122).
There were no significant changes in SA between visits in both diabetic and non-diabetic patient groups.
Specific to the diabetic-operated group, multiple statistically significant linear associations were found. First, there was a positive linear association between LA and spherical equivalent at visits 1 and 2 (Visit 1: r = 0.627, p = 0.039; Visit 2: r = 0.696, p = 0.017). Second, there was a negative linear association between LA and AL at all three visits (Visit 1: r = –0.474, p = 0.047; Visit 2: r = –0.660, p = 0.003; Visit 3: r = –0.547, p = 0.019). Third, there was a positive linear association between TCA and spherical equivalent at Visit 2 (r = 0.654, p = 0.029). Next, there was a negative linear association between TCA and AL at visits 2 and 3 (r = –0.644, p = 0.004; r = –0.541, p = 0.020). Finally, there was a negative linear association between SA and AL at visits 2 and 3 (Visit 2: r = –0.593, p = 0.009; Visit 3: r = –0.486, p = 0.041).
Statistically significant linear associations were also found between SA and MAP. Interestingly, the association was negative in the non–diabetic–operated group (r = –0.533, p = 0.034) but positive in the diabetic-operated group (r = 0.502, p = 0.048).
Finally, no statistically significant linear associations were found between LA, SA and TCA with age and disease control (HbA1c).
Discussion
To our knowledge, this is the first study to compare CVI in diabetic and non-diabetic patients undergoing cataract surgery using OCT as a non-invasive tool. We employed the method of image binarization as described by Sonoda et al. 22 to EDI-OCT scans and found it to be highly reproducible and comparable. The effect of diabetes on CT is not well established, and the published data have been conflicting.15,18,27 A similar study by Brito et al. 28 did not detect significant differences in CT between diabetic and non-diabetic eyes before and after cataract surgery. Our study found that while the choroid was thinner in diabetes, the difference was not statistically significant. However, CVI was found to be significantly smaller in the eyes of diabetic patients. Prior to the advent of EDI choroidal imaging, studies using indocyanine green angiography and laser Doppler flowmetry had qualitatively established that diabetes caused changes in choroidal circulation. Choroidal blood flow was also reduced with increasing severity of DR.29–34 Our finding of reduced CVI in diabetes suggests that there were either fewer blood vessels or a reduction in vessel diameter. This was in keeping with histopathological studies of the choroid in diabetes, which showed luminal narrowing, capillary drop out and focal scarring. 9 None of our patients had severe or proliferative DR; hence, the decrease in CT was not as marked as those reported in previous studies.15,18 The lack of corresponding reduction in CT for patients with diabetes suggests that CVI is a more sensitive tool at picking up early diabetic choroidopathy.
In patients with diabetes, MAP demonstrated a positive linear association with SA and CT. In contrast, a negative linear association was observed for patients without diabetes. We believe that the mean ocular perfusion pressure is more indicative of choroidal blood supply. Hence, current results have to be validated in a larger study, as we did not observe any significant correlation between mean ocular perfusion pressure and any of the choroidal parameters. Furthermore, the correlation between blood pressure and CT is unclear with some studies reporting no significant correlation.35–38
As mentioned, cataract surgery in patients with underlying retinal diseases such as DR or age-related macular degeneration had been associated with poorer visual outcomes due to the progression of underlying retinal disease. This has been attributed to alterations of angiogenic and antiangiogenic factors following cataract surgery. 33 Lens extraction in mice had been shown to result in the expression of pro-inflammatory genes in the posterior segment of the eye, in particular, the neurosensory retina. 39 Since the choroid is in close relation to the retina, there have been recent interests in studying the effect of cataract surgery on the choroid. One study found that CT in normal healthy eyes increased after cataract surgery. 40 Another study did not find any changes in CT at 1-month post cataract surgery in diabetic patients and healthy controls. 28 We found that CT increased from baseline to 3 months after cataract surgery for diabetic (169.7–182.1 µm) and non-diabetic patients (177.4–198.4 µm). When we studied the vascular and stromal components of the choroid using the image binarization technique as previously described, we found that LA increased after cataract surgery, while there were no significant changes in the SA. 22 The increase in CT was mirrored with an increase in CVI following cataract surgery in diabetic eyes although the difference did not achieve statistical significance after Bonferroni adjustment. We believe that changes in choroidal parameters following cataract surgery may be one of the possible contributory factor for increased incidence or worsening of choroidal disease such as late-onset age-related macular degeneration as reported in the Beaver Dam and Blue Mountains eye studies.41,42
The choroid is known to be thinner in myopic eyes.43,44 Sonoda et al. 45 was the first to show by a multivariate analysis that AL had a significant negative association with the cross-sectional choroidal area, LA and SA. The ratio of LA to SA was also significantly reduced in eyes with longer AL. 45 In this study, we found that LA, SA and TCA were significantly reduced in eyes with axial elongation. We also found a positive linear association between LA and TCA with increasing hyperopia. In addition, CVI increased with increasing hyperopia, while there was no association between CVI and axial elongation. This suggests that the vascularity of the choroid in myopic eyes is unchanged even though the choroid is thinner. The individual components of the choroid thin out due to the mechanical forces stretching it, but the ratio of LA to TCA remains constant. Our study did not include patients with high myopia; hence, future studies are needed to study the changes in LA, SA and TCA in such patients.
The strength of our study lies in the homogeneous ethnicity and similar gender distribution of patients, thereby reducing the confounding effects from demographic differences. The surgeries were also done by one single surgeon with standardized post-operative medications.
The limitations of our study are the relatively small sample size and the lack of standardization on the timing of image acquisition resulting in possible effects of diurnal variation on choroidal structures. The range of severity of DR was also confined to mild to moderate disease, thereby limiting the study of CT and its individual components in more severe disease states. Due to the small number of eyes that had DR, we did not examine the various choroidal parameters of patients according to the severity of DR. Currently, this technique only enabled a two-dimensional study of the choroid and the choroidal area studied spanned 1500 μm in width across the fovea may not be representative of the entire choroid. There is a lack of histological studies to support the assumption that the dark areas correspond to the vascular lumens and the light areas to the interstitial area. Further studies of the choroid comparing conventional laser Doppler flowmetry and indocyanine green angiography with this new technique of choroidal image binarization is required to correlate the choroidal blood flow and the vascularity of the choroid. Longer follow-up is also recommended in future studies to determine if the increase in CT and LA following cataract surgery persists beyond 3 months of surgery.
Conclusion
This is the first study comparing CT and CVI in diabetic patients who underwent cataract surgery. We have proven that our modified technique of binarization is repeatable and reliable. With that, we found CVI to be reduced in diabetes and that CVI has the potential to detect the development of DR at subclinical stages.
Footnotes
Author’s Note
Kara Anne Tan and Rupesh Agrawal are also affiliated with Ministry of Health Holdings, Singapore.
Declaration of conflicting interests
The author(s) declared no potential conflicts of interest with respect to the research, authorship and/or publication of this article.
Funding
The author(s) disclosed receipt of the following financial support for the research, authorship, and/or publication of this article: This study was funded by Pitch-For-Fund grant administered by Tan Tock Seng Hospital in 2012.