
Abstract
Aim:
To investigate the association between visceral adipose tissue loss and insulin resistance and hyperleptinemia in adolescents with obesity submitted to interdisciplinary weight-loss therapy.
Methods:
A total of 172 post-pubertal adolescents (body mass index greater than the 95th percentile of the Centers for Disease Control and Prevention reference growth charts) were recruited for the study. The adolescents were assigned to long-term weight-loss therapy. Body composition, visceral and subcutaneous fat, glucose metabolism, lipid profile, hepatic enzymes and leptin concentration were measured. After the therapy, the adolescents were allocated to three different groups according to the tertile of visceral fat reduction.
Results:
Positive effects on body composition were observed in all analysed groups independent of visceral fat reduction. It was found that visceral fat was an independent predictor of insulin resistance in the investigated population. Obese adolescents who lost a higher proportion of visceral adipose tissue (>1.8 cm) demonstrated improved metabolic and inflammatory parameters twice as much than those who presented smaller losses. Positive correlations between visceral fat reduction and glucose metabolism, lipid profile, hepatic enzymes and homeostasis model assessment of insulin resistance index were demonstrated.
Conclusion:
The magnitude of the reduction in visceral fat was an independent predictor of insulin resistance, hyperleptinemia and metabolic disorders related to obese adolescents.
Introduction
In his 1988 Banting Lecture, Dr Gerald Reaven1,2 presented the theory that insulin resistance played a key role in the aetiology and prognosis of a group of linked metabolic diseases, including, diabetes, hypertension and cardiovascular diseases. He named this group of symptoms ‘Syndrome X’, which later became known as metabolic syndrome (MetS). This has since been extensively studied in different conditions in the elderly, adults, adolescents and children.3–6
In addition, Dr Reaven 2 suggested that insulin resistance presenting compensatory hyperinsulinemia could lead not only to pathogenesis of noninsulin-dependent diabetes mellitus (NIDDM) but also to an increase in the risk of coronary heart disease (CHD).
To corroborate this, he presented an in-depth discussion of the mechanisms involved in Syndrome X, which result in an increased risk of cardiovascular disease (insulin resistance, compensatory hyperinsulinemia, glucose intolerance, increased triglycerides (TGs) and reduced high-density lipoprotein (HDL) cholesterol concentration). In addition, he extensively investigated insulin resistance syndrome and showed that a large cohort of metabolic abnormalities associated with insulin resistance/hyperinsulinemia can lead to numerous clinical manifestations, including type 2 diabetes, hypertension, cardiovascular disease, polycystic ovary syndrome, non-alcoholic fatty liver disease (NAFLD), certain types of cancer and sleep apnea.7–10 MetS involves a variety of altered metabolic and inflammatory processes, including increases in visceral adiposity. The identification of individuals with this condition is important so that interventions can target lifestyle changes to decrease not only the incidence of diabetes but also the risk of developing cardiovascular disease. 11 Our research team has already started to develop a multicomponent therapy trying to help adolescents with obesity recover their health, taking into account the multifactorial components involved in the aetiology of obesity and its comorbidities. 12 In this respect, we found that they presented high prevalences of insulin resistance (about 70%), dyslipidemias, carotid intima media thickness (cIMT) alterations, hyperleptinemia and hypoadiponectinemia, resulting in an increased prevalence of MetS13,14 with almost 30% of the adolescents having a diagnosis of MetS.14,15 Interestingly, there was a higher prevalence of NAFLD in adolescents with obesity, reaching 40% and 60% in girls and boys, respectively, aged between 14 and 19 years. 16
In addition, we were able to show that the most important factors in the aetiology of MetS and NAFLD development in these adolescents with obesity were insulin resistance and visceral adiposity.14,17 Moreover, de Lima Sanches et al., 13 showed that an improved insulin resistance index was an independent predictor of cIMT alterations in adolescents with obesity. In addition, Masquio et al. 14 demonstrated that the presence of MetS impaired the reduction in cIMT in adolescents with obesity and that hyperleptinemia correlated with the increased prevalence of NAFLD and the development of atherosclerosis. 18
However, as far as we are aware, the association between visceral adipose tissue reduction and the impact on insulin resistance and hyperleptinemia, according to the level of reduction, has not been explored in adolescents with obesity analysed after long-term interdisciplinary weight-loss therapy.
Methods
Population
This study uses data collected between 2004 and 2012 by the obesity study group. A total of 172 post-pubertal obese adolescents aged 15–19 years of both genders (102 girls and 70 boys) were recruited. The inclusion criteria were as follows: adolescents at Tanner stage five 19 , the presence of primary obesity and a body mass index (BMI) >95th percentile of the Centers for Disease Control and Prevention (CDC) reference growth charts. 20 Non-inclusion criteria were the use of birth control pills, cortisone, anti-epileptic drugs, a history of renal disease, alcohol intake, smoking and secondary obesity due to endocrine disorders. The study was conducted following the principles of the Declaration of Helsinki and was approved by the Ethics Committee on Research at the Universidade Federal de São Paulo, UNIFESP (152.281), clinical trial Id: NCT01358773. All procedures were explained to those responsible for the volunteers, and a free and informed consent form was signed.
Anthropometric measurements
The adolescents were weighed on a scale and after the plethysmograph was used for body composition. (BOD POD equipment - Cosmed, Life Measurement Instruments, Concord, CA, USA), with patients wearing the minimum clothing possible, and height was measured using a stadiometer (Sanny-model ES 2030). BMI was calculated by dividing the weight by height squared (kg/m²). Body composition, including fat mass (percentage and kilogrammes) and lean mass (percentage and kilogrammes) was obtained through air displacement plethysmography (BOD POD equipment). Waist circumference was obtained at the midpoint between the last rib and iliac crest. 21
Serum analysis
Blood samples were collected after an overnight fast in the outpatient clinic at approximately 08:00 h. After collection, the blood was centrifuged for 10 min at 5000 r/min and stored at −70°C for future analyses. The materials used for collection were disposable and adequately labelled. Blood was collected by a skilled and qualified technician. Insulin resistance was assessed according to the homeostasis model assessment of insulin resistance (HOMA-IR) index. The HOMA-IR was calculated as the product of the fasting blood glucose and the immunoreactive insulin (I) levels: [fasting blood glucose (mg/dL) × fasting insulin (mU/L)]/405. The quantitative insulin sensitivity check index (QUICKI) was calculated as [1/(log(fasting insulin) + log(fasting glucose)]. Total cholesterol (TC), TG, HDL, low-density lipoprotein (LDL), very low-density lipoprotein (VLDL) and hepatic enzymes were analysed using a commercial kit (CELM, Barueri, Brazil). Reference values adopted were as follows: glucose (60–110 mg/dL), insulin (<20 lU/mL), aspartate aminotransferase (AST, 10–40 U/L), alanine aminotransferase (ALT, 10–35 U/L), and c-glutamyl transferase (GGT, 17–30 U/L) as previously described by Sartorio et al.; 22 HOMA-IR (<3.16) according to Keskin et al.; 23 QUICKI (>0.339) according to Schwimmer et al.; 24 TC (<170 mg/dL), TG (33–129 mg/dL), HDL cholesterol (>38 mg/dL), LDL cholesterol (<130 mg/dL), VLDL cholesterol (10–50 mg/dL) according to Giuliano et al. 25
The leptin concentration was measured using a commercially available enzyme-linked immunosorbent assay kit from R&D Systems (Minneapolis, MN), according to the manufacturer’s instructions. Leptin values between 1 and 20 ng/mL for males and between 4.9 and 24 ng/mL for females, as previously described by Gutin et al., 26 were adopted.
The ratios of the lipoprotein levels (TC/HDL and TG/HDL) were calculated because these ratios have been described in the literature as predictors of cardiovascular disease and MetS in adults and in children.27–29
Visceral and subcutaneous adiposity measurements
The abdominal ultrasonography procedures and the measurements of visceral and subcutaneous fat tissue and fatty liver were performed by the same physician, who was blinded to the subject assignment groups at baseline and at follow-up 1 year after the start of the therapy. This physician was a specialist in imaging diagnostics. A 3.5 MHz multifrequency transducer (broadband) was used to reduce the risk of misclassification. The intra-examination coefficient of the variation for ultrasound (US) was 0.8%. US-determined subcutaneous fat was defined as the distance between the skin and the external face of the rectus abdominal muscle, and visceral fat was defined as the distance between the internal face of the same muscle and the anterior wall of the aorta. The cut-off points for the definition of visceral obesity by ultrasonography were based on the methodology previously described by Ribeiro-Filho et al. 30
Descriptive methodology of interdisciplinary intervention
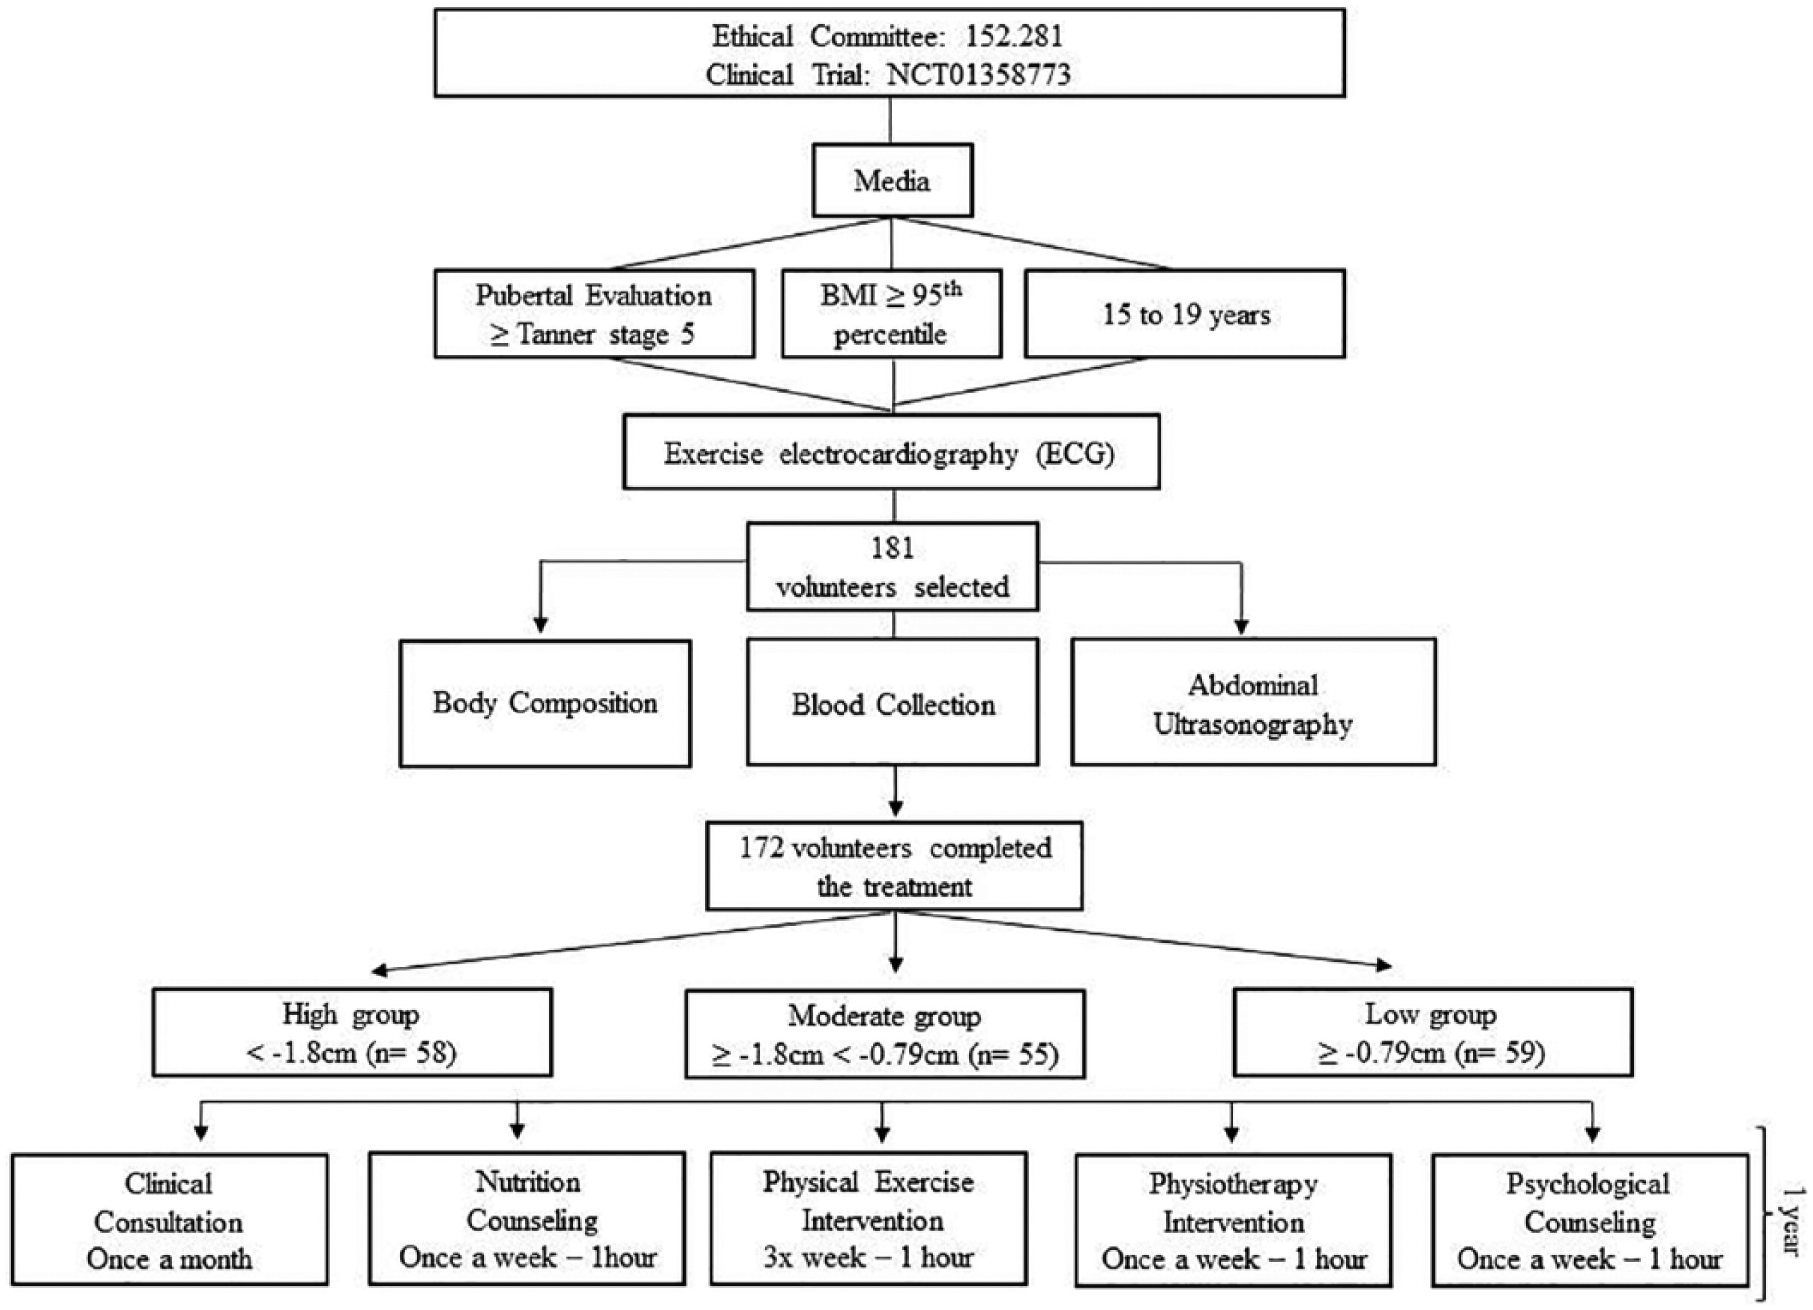
The interventions were conducted by an interdisciplinary group of health professionals. All adolescents performed the same tests both at the beginning and at the end of the study (Figure 1). Once each month, the adolescents visited the endocrinologist to evaluate the treatment. The adolescents participated in three, 2-h supervised therapy sessions per week (on non-consecutive days) combining physical exercise, physiotherapy, nutritional advice sessions and psychological therapy for 1 year (Figure 1).
Methodological design.
Clinical approach
All obese adolescents visited the endocrinologist with their parents once every month. The medical follow-up was based on the initial medical history and comprised a physical examination, and the measurement of blood pressure and body mass. The adherence of the adolescents to the interdisciplinary therapies was also assessed. The team discussed some possible changes in lifestyle to promote their health with the adolescents and their parents (Figure 1).
Physical exercise practice
Aerobic plus resistance training intervention
During the 1-year therapy period, the adolescents followed a combined physical exercise training therapy. The protocol was performed three times per week for 1 year and included 30 min of aerobic training plus 30 min of resistance training per session. The subjects were instructed to reverse the order of the physical exercises (aerobic and resistance) at each training session. The aerobic training consisted of running on a motor-driven treadmill (Life Fitness – model TR 9700HR) or riding an exercise bicycle at a cardiac frequency intensity representing ventilatory threshold 1 (VT1) (±4 bpm), which was determined by the results of an initial oxygen uptake test for aerobic exercises (ergoespirometry). The physical exercise therapy was based on the guidelines from the American College of Sports Medicine (ACSM). 31 Resistance training was also designed based on ACSM recommendations (Figure 1). 32
Nutrition counselling
Energy intake was set at the levels recommended by the Institute of Medicine’s dietary reference intake (DRI) for subjects with low levels of physical activity of the same age and gender following a balanced diet. 33 No pharmacotherapies or antioxidants were recommended. Once a week, adolescents had dietetics lessons educating participants on the food pyramid, were taught how to keep diet records and were given information on weight loss diets, fad diets, food labels, dietetics, fat-free foods, low-calorie foods and other related topics. They also had monthly individual consultations (Figure 1).
Physiotherapy intervention
The adolescents were monitored by a physiotherapist during the therapy in order to prevent musculoskeletal injuries. Once a week, the volunteers had lessons regarding such topics as posture, the prevention of musculoskeletal injuries, diaphragmatic breathing, hydrotherapy, isostretching, and balance.
Psychological counselling
Psychological therapy treatment plans were established based on validated questionnaires that considered some of the psychological problems caused by obesity, as described in the literature. These include depression, eating disorders, anxiety, decreased self-esteem and body image disorders. Interdisciplinary therapy consisted of a weekly 1-h group session. Individualized psychological therapy was recommended when it was necessary according to the psychological assessment (Figure 1).
Statistical analysis
Statistical analysis was performed using the Statistica 12 (StatSoft Inc, Tulsa, USA) software package. The adopted significant value was α ⩽ 5%. Data normality was verified with the Kolmogorov–Smirnov test. Data were expressed as mean ± standard deviation (SD). The effects of 1 year of interdisciplinary therapy were assessed using repeated measures analysis of variance (ANOVA) and Tukey post hoc test. Correlations were established through the Pearson’s test. Multivariate regression analysis was performed to look for independent predictors for insulin resistance.
After long-term weight-loss therapy, they were analysed according to the tertile of visceral fat reduction (delta values) – 1st tertile (high): more than 1.8 cm (n = 58); 2nd tertile (moderate): between 1.8 cm and 0.79 cm (n = 55); and 3rd tertile (low): less than or equal to 0.79 cm (n = 59).
Results
Baseline condition
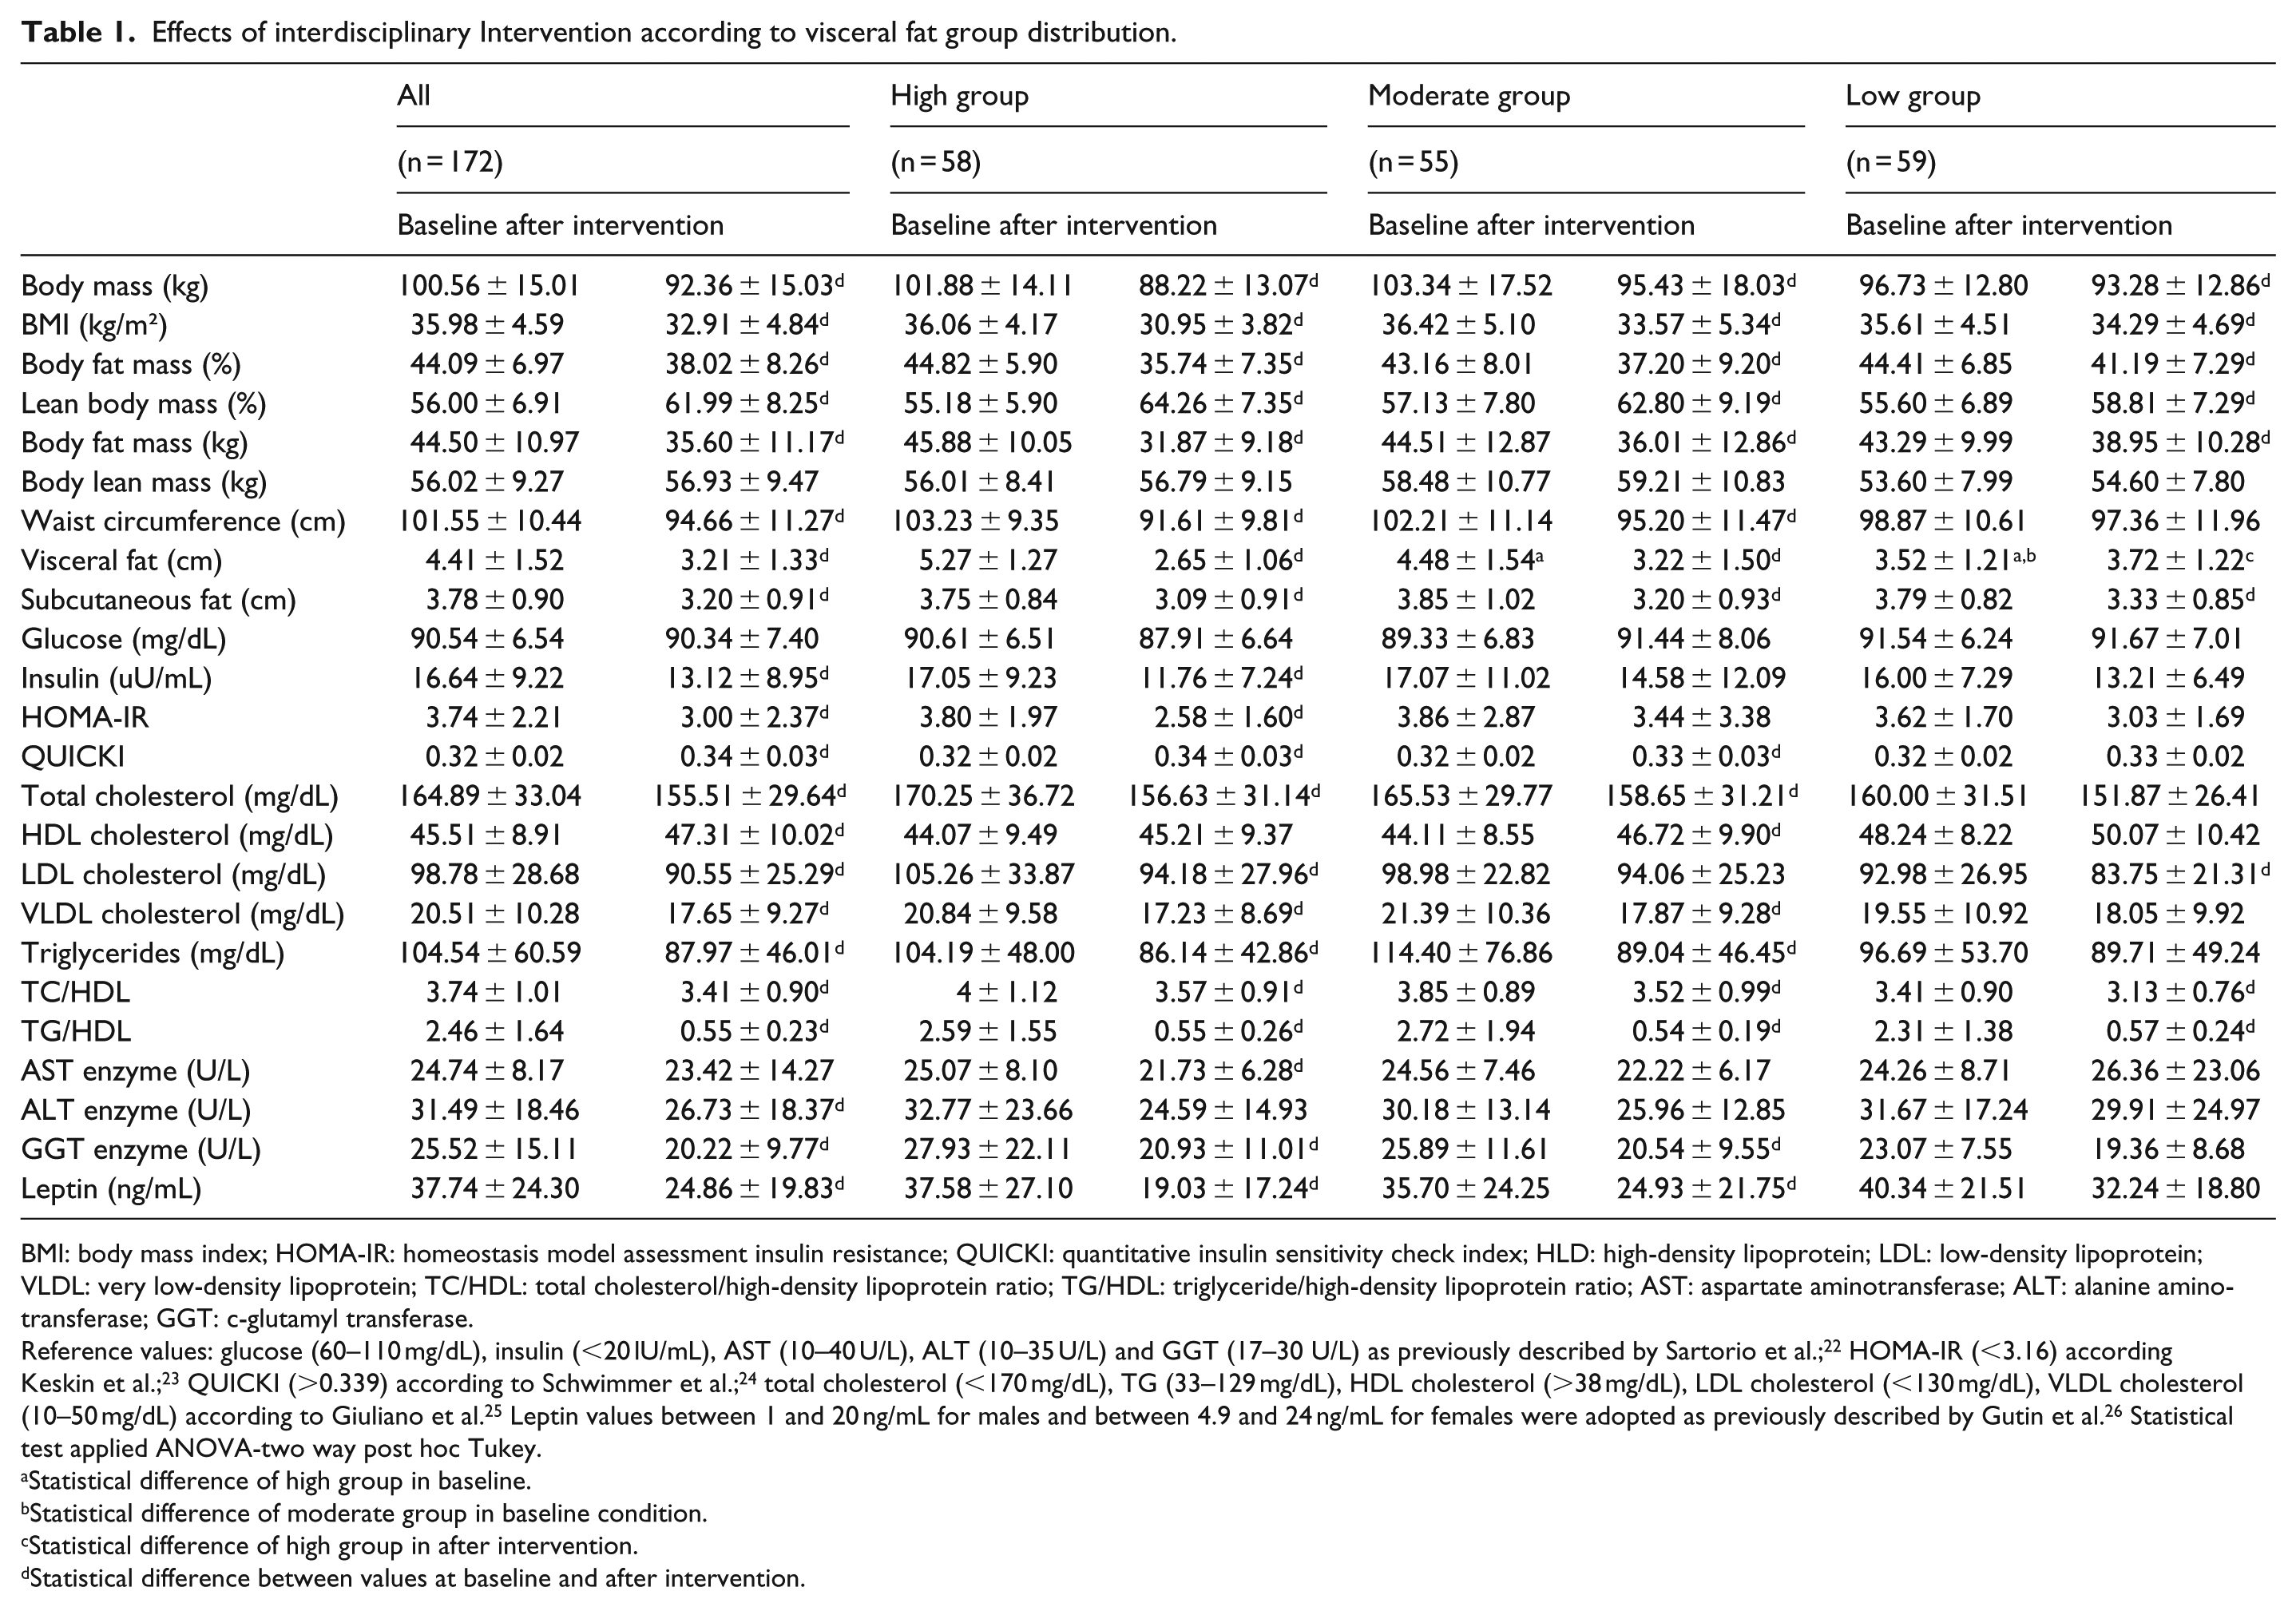
Analysing the baseline condition, the adolescents were paired according to BMI and body fat mass as shown in Table 1. This is relevant information that highlights the homogeneity of the sample studied at the initial moment of the interventions. It justifies that the differences that were found between the groups at the final moment are dependent on the effect of the therapy and the group evaluated, according the magnitude of reduction in visceral fat depot.
Effects of interdisciplinary Intervention according to visceral fat group distribution.
BMI: body mass index; HOMA-IR: homeostasis model assessment insulin resistance; QUICKI: quantitative insulin sensitivity check index; HLD: high-density lipoprotein; LDL: low-density lipoprotein; VLDL: very low-density lipoprotein; TC/HDL: total cholesterol/high-density lipoprotein ratio; TG/HDL: triglyceride/high-density lipoprotein ratio; AST: aspartate aminotransferase; ALT: alanine aminotransferase; GGT: c-glutamyl transferase.
Reference values: glucose (60–110 mg/dL), insulin (<20 lU/mL), AST (10–40 U/L), ALT (10–35 U/L) and GGT (17–30 U/L) as previously described by Sartorio et al.; 22 HOMA-IR (<3.16) according Keskin et al.; 23 QUICKI (>0.339) according to Schwimmer et al.; 24 total cholesterol (<170 mg/dL), TG (33–129 mg/dL), HDL cholesterol (>38 mg/dL), LDL cholesterol (<130 mg/dL), VLDL cholesterol (10–50 mg/dL) according to Giuliano et al. 25 Leptin values between 1 and 20 ng/mL for males and between 4.9 and 24 ng/mL for females were adopted as previously described by Gutin et al. 26 Statistical test applied ANOVA-two way post hoc Tukey.
Statistical difference of high group in baseline.
Statistical difference of moderate group in baseline condition.
Statistical difference of high group in after intervention.
Statistical difference between values at baseline and after intervention.
Effects of interdisciplinary intervention
All sample
Considering the total sample (n = 172), there were a statistically significant reduction in body mass (kg), BMI (kg/m²), body fat mass (% and kg), waist circumference (cm), visceral fat (cm), subcutaneous fat (cm), insulin (µU/mL), HOMA-IR, TC (mg/dL), LDL cholesterol (mg/dL), VLDL cholesterol (mg/dL), TGs (mg/dL), TC/HDL ratio, TG/HDL ratio, ALT enzyme (U/L), GGT enzyme (U/L) and leptin concentration (ng/mL). On the other hand, there were statistically significant increases in lean body mass (%), QUICKI and HDL cholesterol (mg/dL). For lean body mass (kg), glucose (mg/dL) and AST enzyme (U/L) no statistically significant changes were observed (Table 1).
High group (1st tertile: >1.8 cm)
Similarly to the all sample analysis, in the high group, there was a statistically significant reduction in body mass (kg), BMI (kg/m²), body fat mass (% and kg), waist circumference (cm), visceral fat (cm), subcutaneous fat (cm), insulin (µU/mL), HOMA-IR, TC (mg/dL), LDL cholesterol (mg/dL), VLDL cholesterol (mg/dL), TGs (mg/dL), TC/HDL ratio, TG/HDL ratio, AST enzyme (U/L), GGT enzyme (U/L) and leptin concentration (ng/mL). In addition, it is important to note that only in this group was the hyperleptinemia state normalized. On the other hand, there was a statistically significant increase in lean body mass (%) and QUICKI. For lean body mass (kg), glucose (mg/dL), HDL cholesterol (mg/dL) and ALT enzyme (U/L) no statistically significant changes were observed (Table 1).
Moderate group (2nd tertile: between 1.8 and 0.79 cm)
In the moderate group, there was a statistically significant reduction in body mass (kg), BMI (kg/m²), body fat mass (% and kg), waist circumference (cm), visceral fat (cm), subcutaneous fat (cm), TC (mg/dL), VLDL cholesterol (mg/dL), TGs (mg/dL), TC/HDL ratio, TG/HDL ratio, GGT enzyme (U/L) and leptin concentration (ng/mL). Although, this hormone was not normalized. On the other hand, there was a statistically significant increase in lean body mass (%), QUICKI and HDL cholesterol (mg/dL). For lean body mass (kg), glucose (mg/dL), insulin (µU/mL), HOMA-IR, LDL cholesterol (mg/dL), AST enzyme (U/L) and ALT enzyme (U/L) no statistically significant changes were observed (Table 1).
Low group (3rd tertile: less than or equal 0.79 cm)
In the low group, there was a statistically significant reduction in body mass (kg), BMI (kg/m²), body fat mass (% and kg), subcutaneous fat (cm), LDL cholesterol (mg/dL), TC/HDL ratio and TG/HDL ratio. On the other hand, there was a statistically significant increase in lean body mass (%) and visceral fat (cm). For lean body mass (kg), waist circumference (cm), glucose (mg/dL), insulin (µU/mL), HOMA-IR, QUICKI, TC (mg/dL), HDL cholesterol, VLDL cholesterol (mg/dL), TGs (mg/dL), and AST enzyme (U/L), ALT enzyme (U/L), GGT enzyme (U/L) and leptin concentration (ng/mL) no statistically significant changes were observed (Table 1).
Analysing the delta values
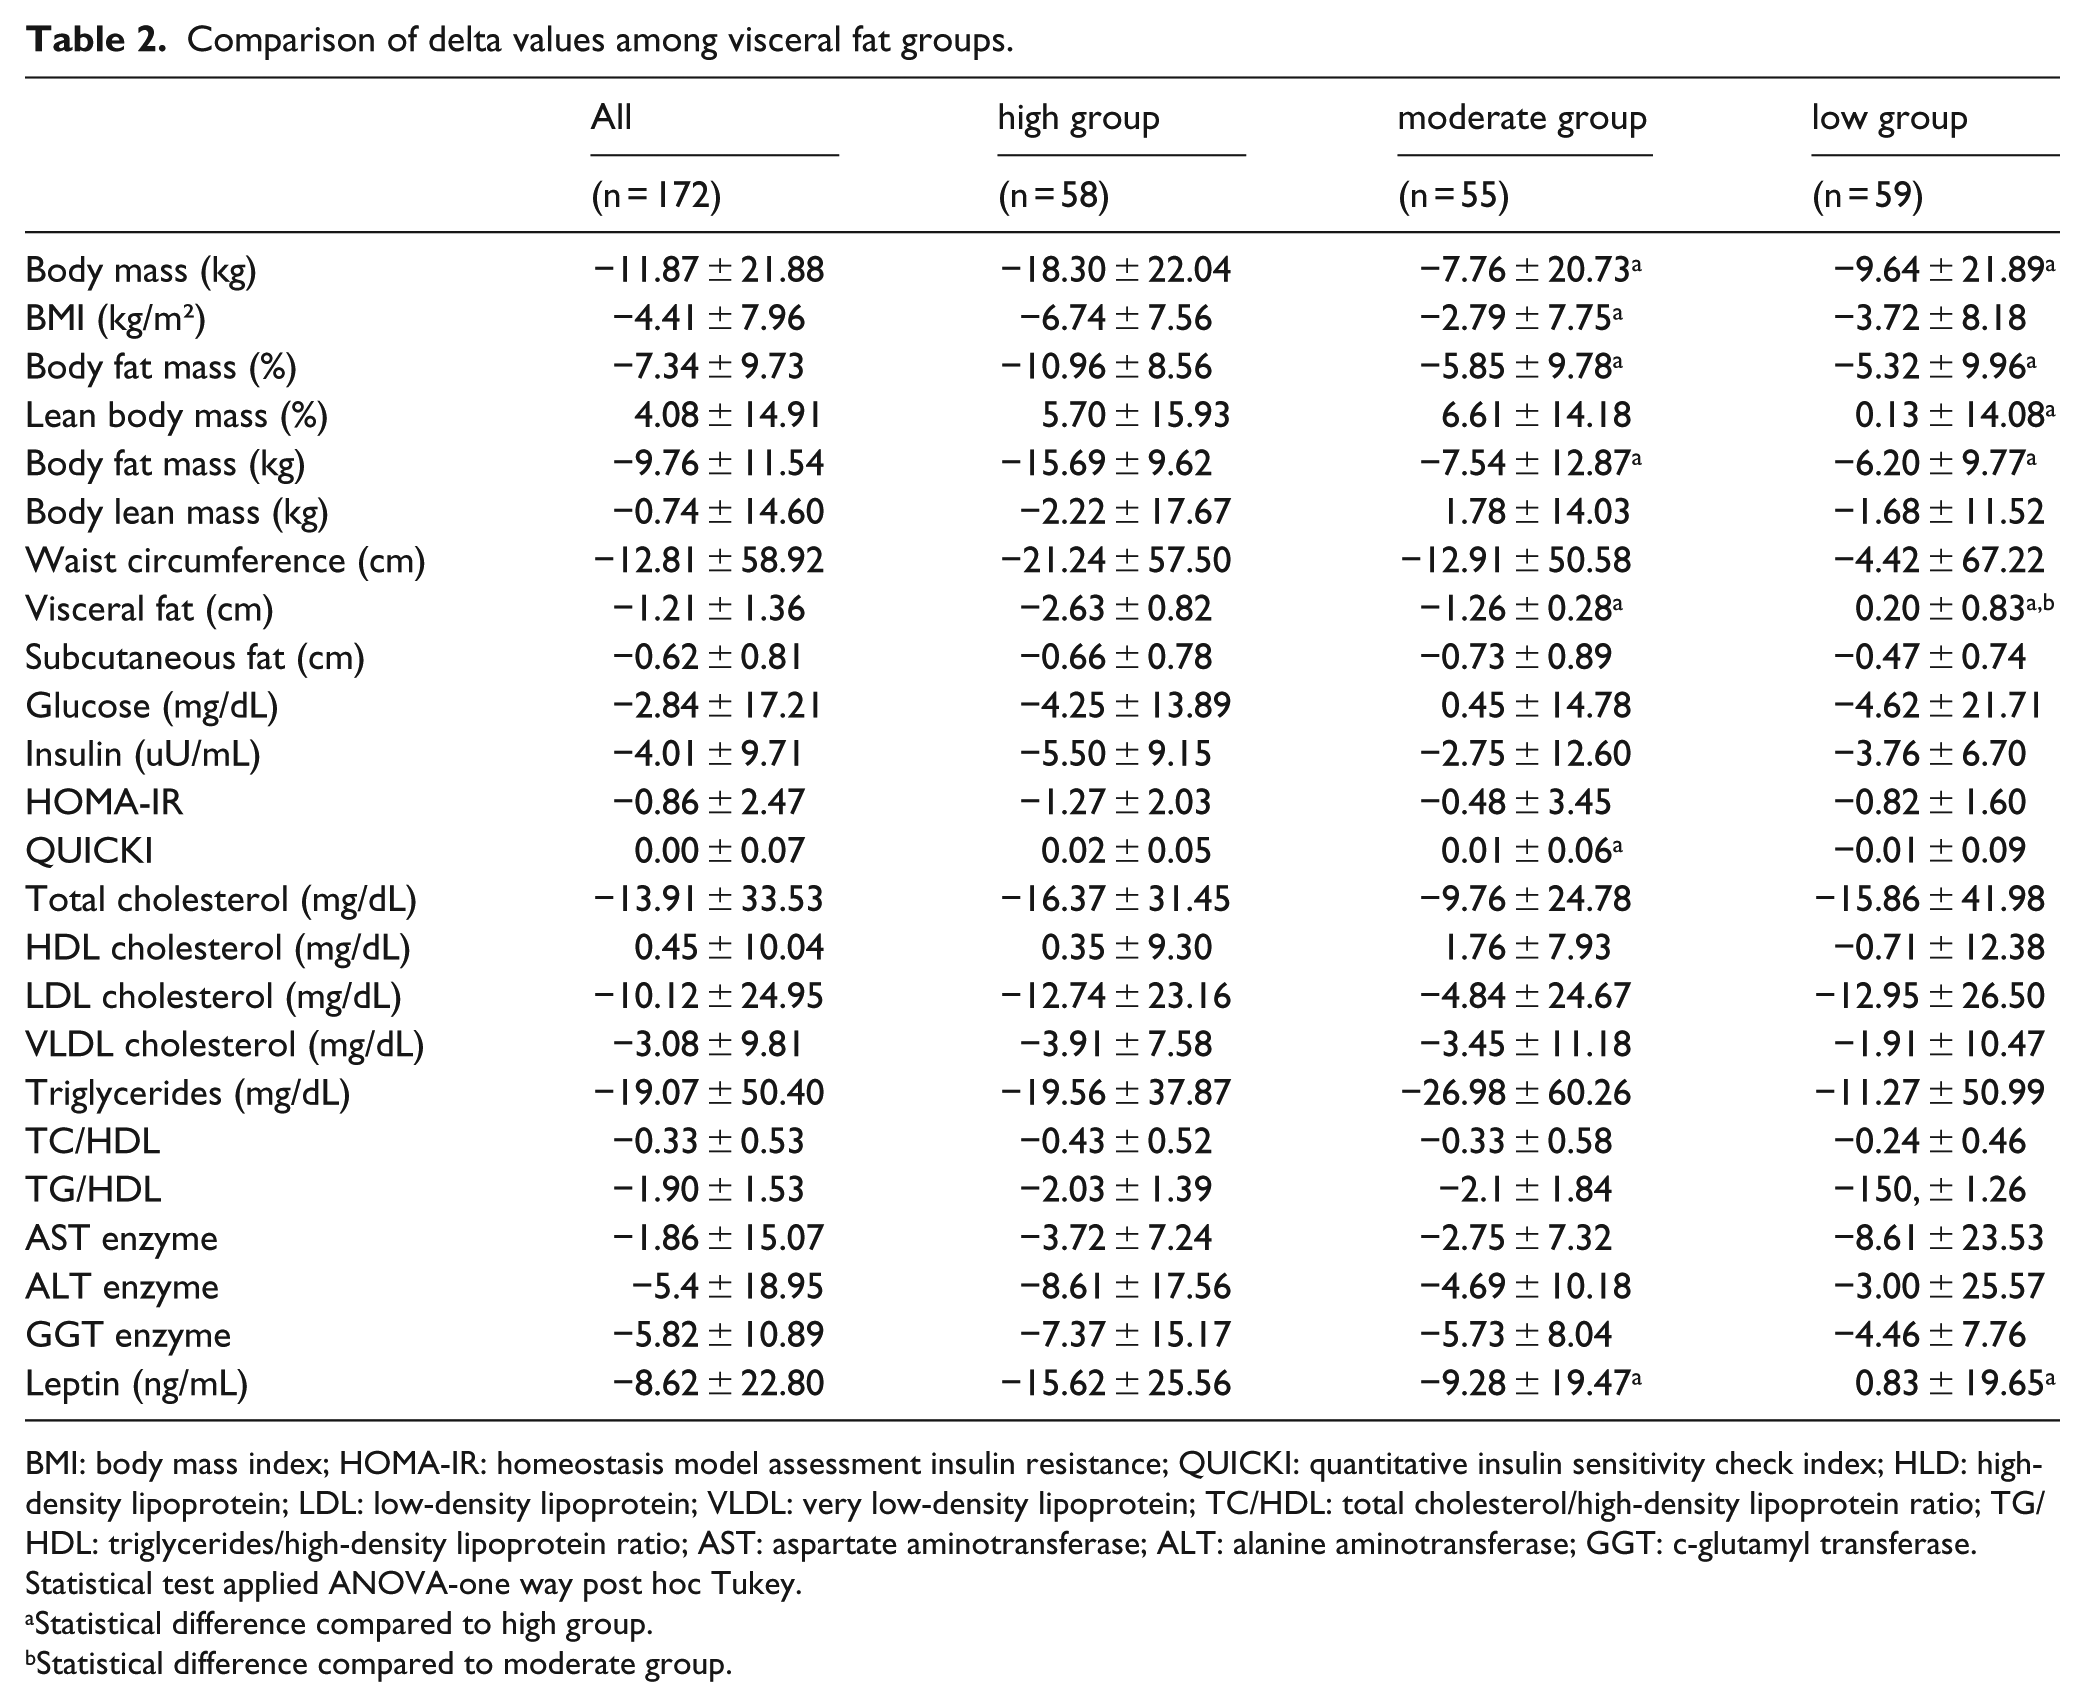
According to the delta values analysed, it is possible to note a greater effectiveness of high group than the moderate and low groups in promoting a reduction in body mass (kg), body fat mass (% and kg), visceral fat (cm) and leptin concentration (ng/mL). Interestingly, the programme was more effective in the high group in respect of improved BMI (kg/m²) and QUICKI than in the moderate group. For the variables lean body mass (kg), waist circumference (cm), subcutaneous fat (cm), glucose (mg/dL), insulin (µU/mL), HOMA-IR, TC (mg/dL), HDL cholesterol (mg/dL), LDL cholesterol (mg/dL), VLDL cholesterol (mg/dL), TGs (mg/dL), TC/HDL ratio, TG/HDL ratio, AST, ALT and GGT enzymes no significant differences were observed (Table 2).
Comparison of delta values among visceral fat groups.
BMI: body mass index; HOMA-IR: homeostasis model assessment insulin resistance; QUICKI: quantitative insulin sensitivity check index; HLD: high-density lipoprotein; LDL: low-density lipoprotein; VLDL: very low-density lipoprotein; TC/HDL: total cholesterol/high-density lipoprotein ratio; TG/HDL: triglycerides/high-density lipoprotein ratio; AST: aspartate aminotransferase; ALT: alanine aminotransferase; GGT: c-glutamyl transferase.
Statistical test applied ANOVA-one way post hoc Tukey.
Statistical difference compared to high group.
Statistical difference compared to moderate group.
Multivariate logistic regression analysis
In the regression analysis of the total sample, both visceral fat and BMI were predictors of increased insulin resistance. Moreover, for the high and moderate groups, the regression model demonstrated that only visceral fat was an independent predictor of an increase in the insulin resistance index (HOMA-IR). Considering the low group, only BMI (kg/m²) was an independent predictor of an increase in the insulin resistance index (HOMA-IR) (Table 3).
Multivariate logistic regression analysis of association between insulin resistance and body composition parameters.
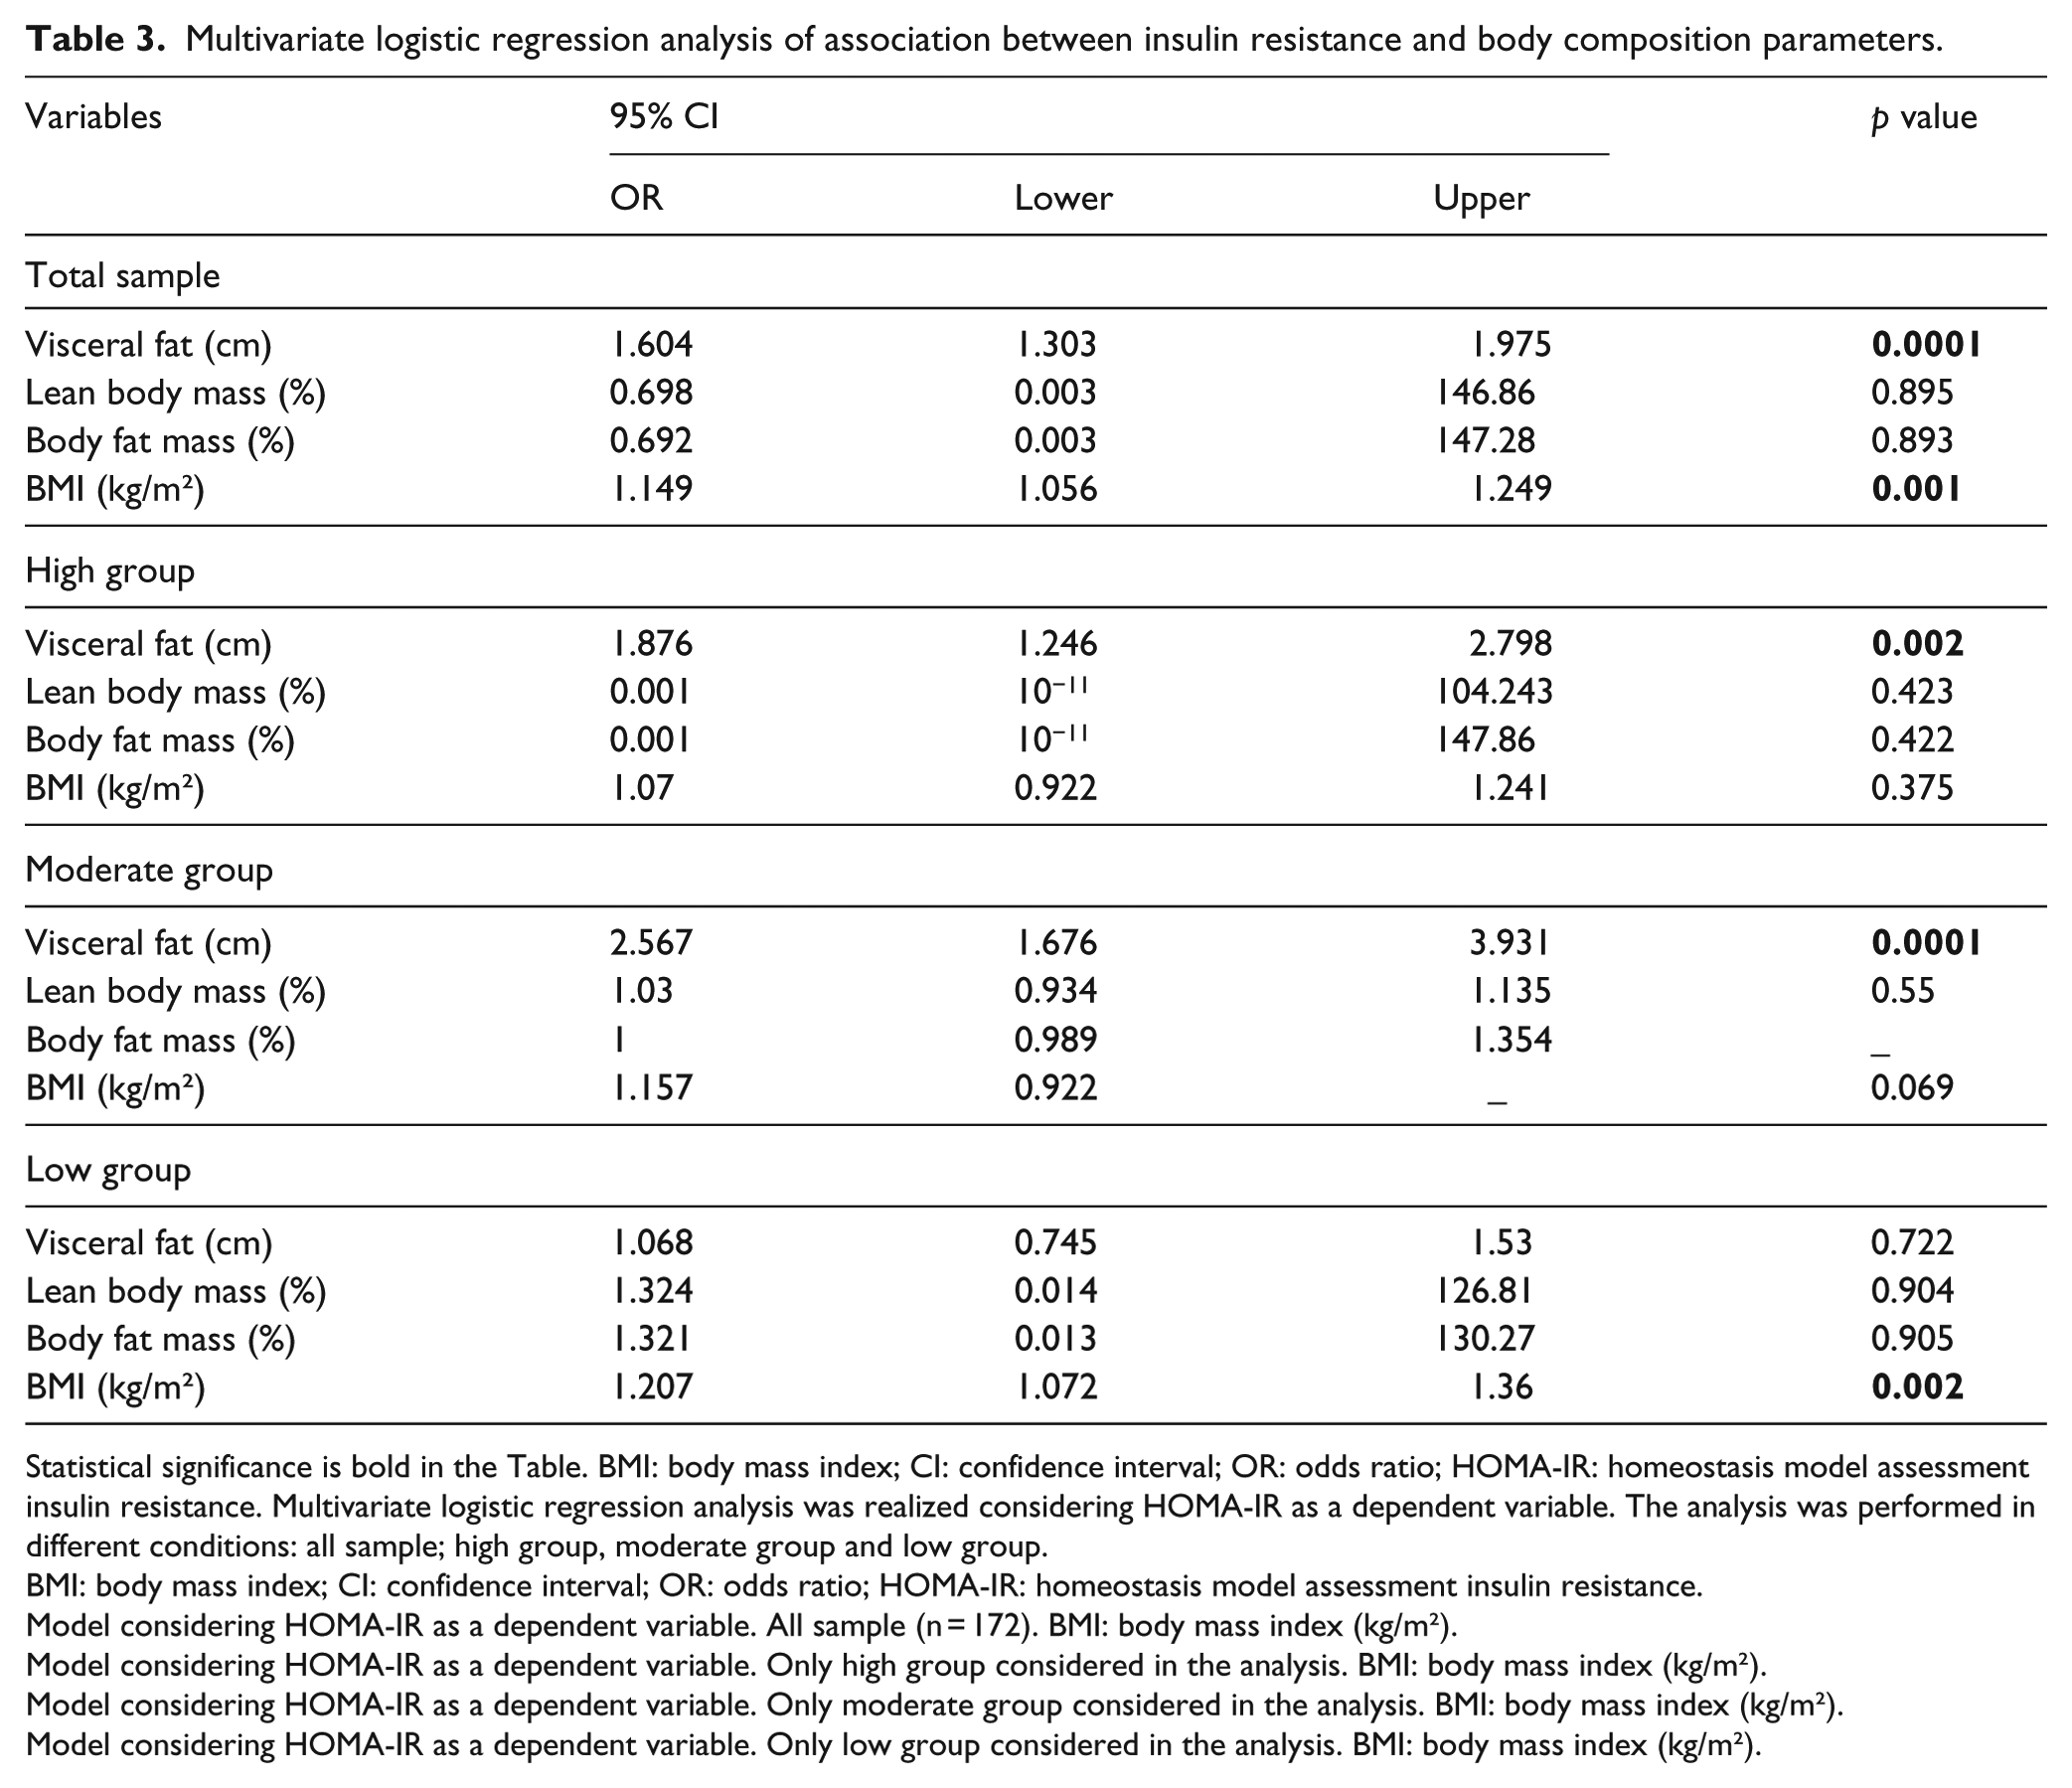
Statistical significance is bold in the Table. BMI: body mass index; CI: confidence interval; OR: odds ratio; HOMA-IR: homeostasis model assessment insulin resistance. Multivariate logistic regression analysis was realized considering HOMA-IR as a dependent variable. The analysis was performed in different conditions: all sample; high group, moderate group and low group.
BMI: body mass index; CI: confidence interval; OR: odds ratio; HOMA-IR: homeostasis model assessment insulin resistance.
Model considering HOMA-IR as a dependent variable. All sample (n = 172). BMI: body mass index (kg/m²).
Model considering HOMA-IR as a dependent variable. Only high group considered in the analysis. BMI: body mass index (kg/m²).
Model considering HOMA-IR as a dependent variable. Only moderate group considered in the analysis. BMI: body mass index (kg/m²).
Model considering HOMA-IR as a dependent variable. Only low group considered in the analysis. BMI: body mass index (kg/m²).
Correlations analysis
Performing the correlation analysis, as demonstrated in Figure 2(a) to (d), visceral fat (cm) was positively correlated with glucose (mg/dL): r = 0.22, p = 0.001; insulin (µU/L): r = 0.38, p = 0.0001 and HOMA-IR: r = 0.40, p = 0.001. Moreover, negative correlations were found between visceral fat and QUICKI: r = –0.38, p = 0.0001. Considering the lipid profile, as shown in Figure 3(a) to (d), there were positive correlations between visceral fat (cm) and TC (mg/dL): r = 0.23, p = 0.006; LDL cholesterol (mg/dL): r = 0.22, p = 0.01; VLDL cholesterol (mg/dL): r = 0.26, p = 0.002 and TGs (mg/dL): r = 0.26, p = 0.002. Regarding the hepatics enzymes, as shown in Figure 4(a) to (d), there were positive correlations between visceral fat (cm) and AST enzyme (U/L): r = 0.35, p = 0.0001; ALT enzyme (U/L): r = 0.37, p = 0.0001 and GGT enzyme (U/L): r = 0.46, p = 0.0001.
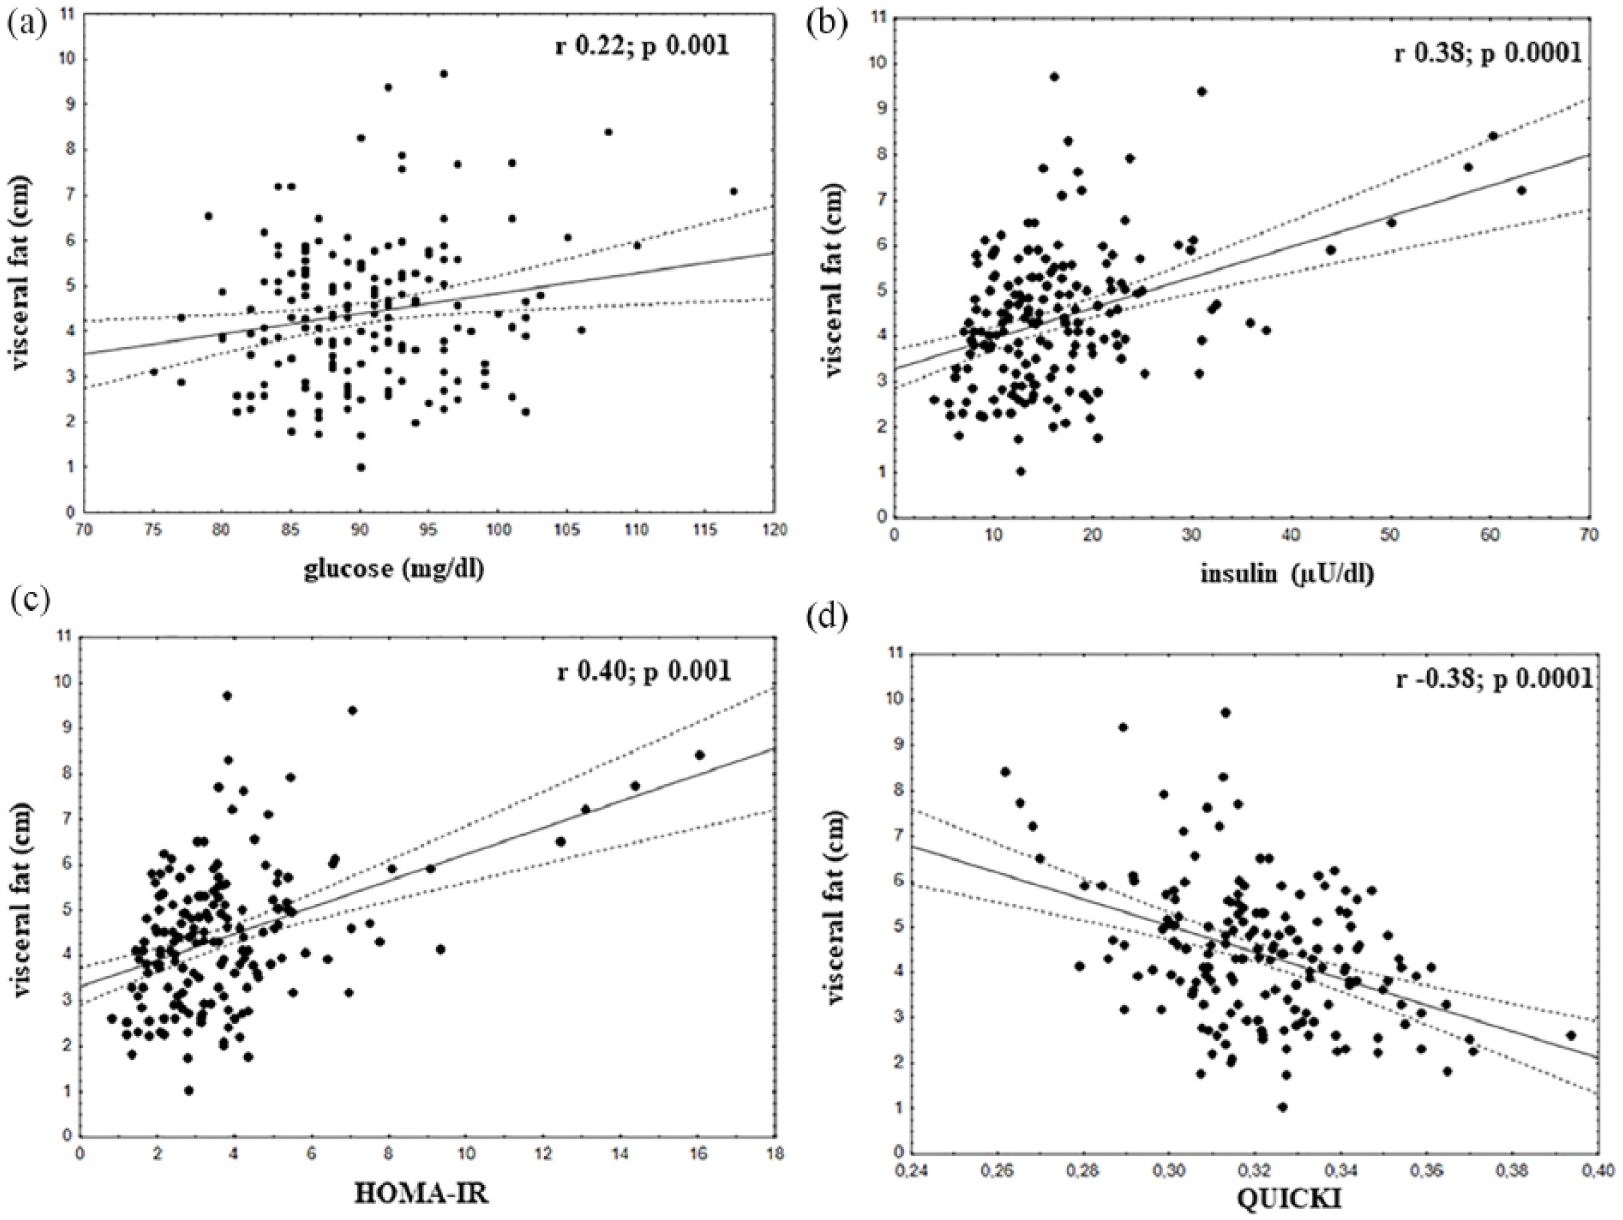
Correlations of visceral fat with: (a) glucose (mg/dL): r = 0.22, p = 0.001; (b) insulin (μU/L): r = 0.38, p = 0.0001; (c) HOMA-IR: r = 0.40, p = 0.001 and (d) QUICKI: r = −0.38, p = 0.0001.
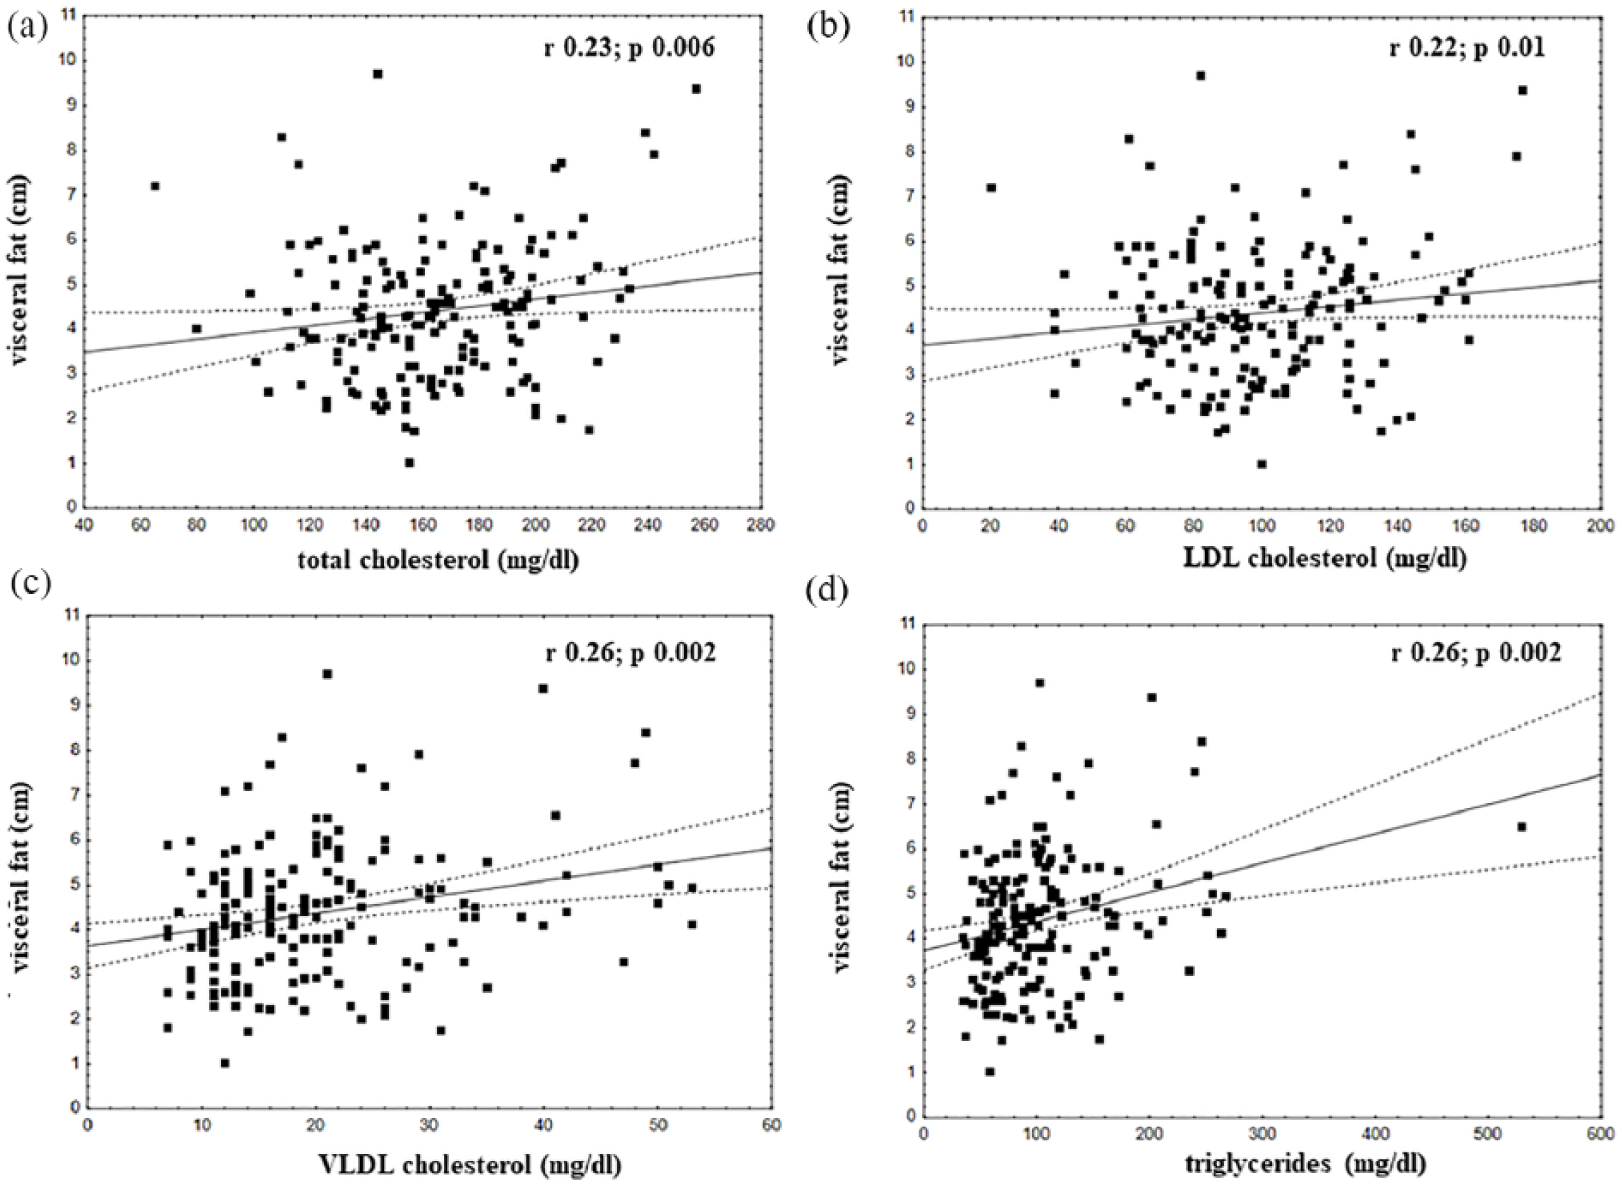
Correlations of visceral fat with: (a) total cholesterol (mg/dL): r = 0.23, p = 0.006; (b) LDL cholesterol (mg/dL): r = 0.22, p = 0.01; (c) VLDL cholesterol (mg/dL): r = 0.26, p = 0.002 and (d) triglycerides (mg/dL): r = 0.26, p = 0.002.
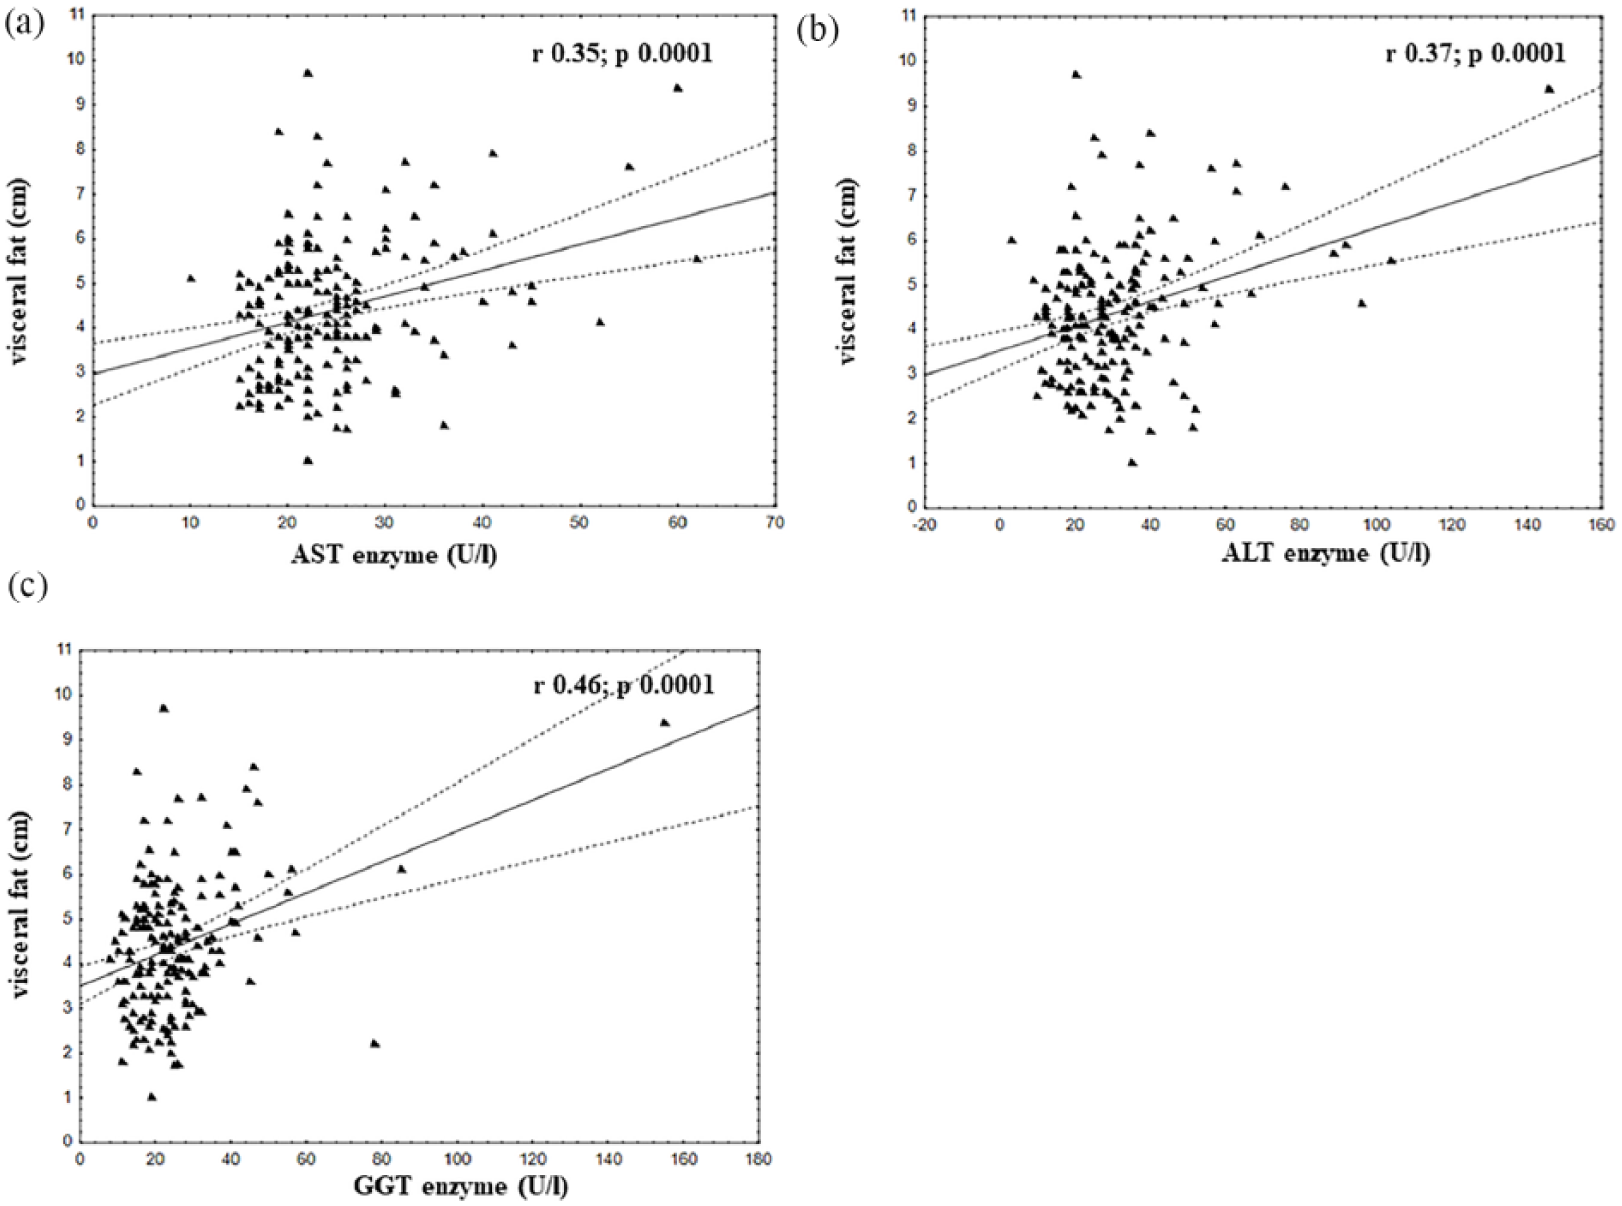
Correlations of visceral fat with: (a) AST enzyme (U/L): r = 0.35, p = 0.0001; (b) ALT enzyme (U/L): r = 0.37, p = 0.0001 and (c) GGT enzyme (U/L): r = 0.46, p = 0.0001.
Discussion
This study aimed to investigate the impact of visceral adipose tissue reductions, analysed in terms of their magnitude, on insulin resistance and hyperleptinemia in a sample of adolescents with obesity. Interestingly, the most important finding was that a greater reduction in visceral adipose tissue (>1.8 cm; according to the delta value analysis) was a cut-off point to obtain a significant decrease in insulin resistance and normalization of leptin concentration (Table 1).
Corroborating this, the multivariate logistic analysis showed that increased visceral fat is an independent predictor of increased insulin resistance in the groups with a high and moderate reduction of adipose deposits (Table 3). In a previous investigation, it was shown that improved HOMA-IR was an independent predictor of cIMT alterations in a sample of adolescents with obesity. 13 In fact, in this investigation, there was only a significant decrease in insulin resistance and insulin concentration in the group which presented a higher reduction in visceral fat after long-term interdisciplinary weight-loss therapy occurs.
Remarkably, our data indicate that when adolescents with obesity have a high or moderate decrease in the visceral adipose tissue, there are improvements in 20 and 16 analysed variables, respectively, including body composition and glucose and lipid metabolism. However, when there was only a small reduction in visceral adipose tissue, there were only improvements in nine parameters (Table 1).
These results show that reduced visceral adipose tissue after long-term weight-loss therapy is a key factor in the control of insulin resistance and a range of metabolic conditions, looking at a sample of obese adolescents with similar body mass, BMI, body fat and subcutaneous fat at baseline, as shown in Table 1. This strongly corroborates the thesis of Dr Reaven34–36 regarding insulin resistance as a key aspect in the development of many chronic diseases. Our research suggests that if these conditions are not treated early on in obese adolescents, they may develop not only insulin resistance but also MetS, 15 NAFLD, 37 sleep apnea, 38 bone metabolism 39 and cardiovascular disease. 13
The present study showed the key role of visceral fat in the modulation of metabolic and hormonal conditions in a sample of adolescents with obesity, including positive correlations with TC, LDL cholesterol, VLDL cholesterol, TGs, glucose, insulin, HOMA-IR and hepatic enzymes. Moreover, negative correlations between visceral fat were observed with the insulin sensitivity index (QUICKI) (Figures 2 to 4). The data demonstrate the intrinsic link between high visceral fat and insulin resistance in adolescents with obesity, which may lead to the development of metabolic alterations and a consequent increase in cardiovascular risk in this population.13,17,40
In addition, it is important to note that leptin levels, a potent biomarker of energy balance and inflammatory processes related to obesity, were significantly lower after both high and moderate reductions in visceral adipose tissue. In the group presenting a high reduction of visceral fat, the leptin values reached normal concentrations, while the adolescents with a moderate reduction continued to present hyperleptinemia. In agreement with our hypothesis, the group presenting a low delta reduction in deposits showed no significant change in leptin concentration (Table 1).
Importantly, hyperleptinemia can impair energy balance, specifically in its anorexigenic effects upregulating α-melanocyte-stimulating hormone (α-MSH). 41 Indeed, hyperleptinemia can weaken the anti-inflammatory effects of adiponectin, the key hormone involved in the modulation of glucose and lipid metabolism in insulin-sensitive tissues. 42
In summary, the metabolic and inflammatory parameters of the adolescents who lost a high proportion of visceral adipose tissue (>1.8 cm) improved, while they did not in those who had a small reduction (<0.79 cm). Therefore, long-term interdisciplinary therapy was shown to contribute to the control of related comorbidities.
In conclusion, the present study showed that the magnitude of reduction in visceral fat was an independent predictor for insulin resistance control, hyperleptinemia and a range of altered metabolic conditions observed in obese adolescents.
Footnotes
Declaration of conflicting interests
The author(s) declared no potential conflicts of interest with respect to the research, authorship and/or publication of this article.
Funding
The author(s) disclosed receipt of the following financial support for the research, authorship, and/or publication of this article: This study was supported by the Foundation of São Paulo Research–FAPESP (grant nos.: 2017∕07372-1; 2015/14309-9; 2013/08522-6; 2011/50414-0; 2011/50356-0; 2008/53069-0, Fundação de Amparo à Pesquisa do Estado de São Paulo–FAPESP), the National Council for Scientific and Technological Development – CNPq (grant nos.: 409943/2016-9 and 301322/2017-1) and the Coordination of Higher Education Personnel Training – CAPES.