
Abstract
Objective:
The identification of circulating microRNAs related to abnormal metabolic function may be useful in the context of ageing, adiposity and insulin resistance. The miR-33a/b has been shown to control the expression of genes involved in fatty acid biosynthesis, impaired metabolism and insulin resistance. In this study, we aimed to identify differences in circulating miR-33a/b levels according to age-related metabolic impairment and increased adiposity.
Methods:
This study included 80 individuals (30.2% with obesity, 70% females) classified according to insulin resistance (Stern’s criteria) and age [young (20–39 years) and senior (40–59 years)]. Body fat was evaluated using bioelectrical impedance, biochemical markers by colorimetric, enzymatic and immuno-turbidimetry methods. TaqMan measures of circulating miR-33a and miR-33b with quantitative reverse transcription polymerase chain reaction in serum were assessed in association with clinical outputs.
Results:
Circulating miR-33a and miR-33b levels showed significant association with fatness, the lipid profile and biomarkers of impaired glucose metabolism. Both miR-33a and miR-33b were associated with visceral adiposity index in non-insulin resistance and insulin resistance individuals. More important, for miR-33a circulating levels in senior group, receiver operating characteristic curve analyses showed area under the curve 0.804 (p = 0.010; 95% confidence interval = 0.655–0.952).
Conclusion:
Ageing influenced the relationship of circulating miR-33a and miR-33b with insulin resistance and increased adiposity.
Introduction
Insulin resistance (IR) is an illness described as the inability of cells to generate an efficient biological response to insulin, which results in impaired glucose tolerance and increased serum glucose concentrations. 1 IR has 25% of prevalence and is characterized by chronic clinical course, and the increase and irregular distribution of fat deposits, 2 previous to type 2 diabetes (T2D) and other diseases, IR is a pathology with a causal metabolic component, in which genes involved in the insulin signalling pathway in peripheral tissues are closely involved, being the absorption and metabolism of glucose and lipids in liver and adipose tissue of key relevance. 3
The insulin signalling pathways may be regulated by microRNAs (miRNA) that modulate the stability and translation of messenger RNAs (mRNA) by a particular mechanism of binding seeding sequences located in target genes, resulting in protein decay. 4 Once synthesized, some miRNA can be released into circulation via exosomes, vesicular bodies, lipoproteins, simple extrusion, or by apoptotic bodies.5,6 The most researches in the field have assessed the presence of circulating miRNA in many body fluids, being related to their impaired expression in tissues under physiological and pathological conditions. 7 Several studies have shown a correlation of particular circulating miRNA with the development of different pathologies, positioning them as valuable biomarkers in silent diseases such as dyslipidemia, IR and T2D.8,9
The miR-33 family (miR-33a and miR-33b) has been shown to control the expression of genes involved in the synthesis of cholesterol and fatty acids. 10 The miR-33a and miR-33b are encoded in intronic regions located within the sterol regulatory element-binding factor (SREBF) 1 and SREBF2 genes, respectively, 11 that encode for the transcription factors SREBP1 and SREBP2. Their expression levels are controlled by factors that regulate the host genes, that is, SREBP2 increases by 2 to 3 times when decreasing sterol, whereas SREBP1 is induced by the levels of insulin. 12 In this sense, the activity of miRNA family may be associated with the pathogenic process of IR both in the enlargement of a hyperplastic adipose tissue and at level of carbohydrate and lipid metabolism. 13
In one way, it is described that high levels of miR-33b could contribute to increased very-low-density lipoprotein cholesterol (VLDLc) and decreased high-density lipoprotein cholesterol (HDLc) levels and also both miRs can regulate insulin signalling pathways and glucose uptaking by targeting IRS2, SIRT6 and AMPK. 14
Nevertheless, the overlap of IR with ageing when increasing the adiposity and the appearance of metabolic complications can favour the levels of circulating miR-33 family which can negatively regulate the carbohydrate and lipid metabolism making the pathology scenario more unfavourable with the ageing.
Materials and methods
Study design
In a cross-sectional study, 80 individuals (70% females) aged 20–59 years were chosen by simple random sampling from the general population and classified according to Stern’s criteria as insulin resistant [IR, HOMA-IR > 4.65 or body mass index (BMI) > 27.5 kg/m2 and HOMA-IR > 3.6; 15 n = 25] or non-IR subjects (n = 55) and by the median of the age into two groups: 20–39 years as ‘young’ participants (n = 40) and 40–59 years as ‘senior’ participants (n = 40). For ethics conduct before enrolment, participants were informed about the study and signed a consent form following the Helsinki declaration guidelines 16 and the Institutional (Guadalajara University) Review Boards’ committees.
The inclusion criteria for the study were as follows: physical examination and medical history answer a structured questionnaire of demographical and clinical variables, to gather personal and family medical history. Individuals who at the time of the study did not present glucose intolerance, infectious diseases, hypertension, history of cardiovascular disease, malignancy and renal and metabolic diseases such as T2D were included. The individuals who had any pharmacological treatment were excluded. All individuals who fulfilled inclusion criteria were selected through assessment of general health status and vital signs.
Anthropometrical measurements
We evaluated body weight, total body fat mass and trunk fat mass (absolute, kg and relative %); they were determined by using bioelectrical impedance analysis (TANITA BC-418 segmental body composition analyzer, Japan) to the nearest 0.1 kg; body dimensions: height (cm) was measured to the nearest 1 mm by using a stadiometer (Seca GmbH & Co. KG., Hamburg, Germany), and waist circumference (WC), hip circumference (HC) 17 and coronal abdominal diameter (cm) were measured by using an anthropometric fibreglass tape (GULICK® length 0–180 cm precision ±0.1; USA). At the level of the iliac crest (L4–L5), sagittal abdominal diameter (SAD, cm) was measured using a sliding-beam, abdominal calliper (precision ± 0.1 cm; Holtain Ltd., UK) with the patient lying in a supine position in the examination table. 18 All these measurements were carried out by the same anthropometrist in duplicate following the procedures recommended by anthropometric indicators measurement guide. 19
To determine obesity and adiposity indexes, the following math calculations were used: BMI (kg/m2) = weight (kg)/height2 (m); body fat ratio (kg/m2) = total body fat mass (kg)/height2 (m); waist hip ratio = WC (cm)/HC (cm); waist to height ratio = WC (cm)/height (cm); conicity index = WC (cm)/0.109*√(weight (kg)/height (cm). Abdominal fat distribution: total abdominal area (cm2) = WC2/4π; abdominal volume index (L) = [2WC 2 + 0.7(WC – HC) 2 ]10,00; visceral adipose index: = [WC/36.58 + (1.896 × BMI))6(TG/0.81]6(1.52/HDLc) for males and for females = (WC/39.68 + (1.886 × BMI))6(TG/1.03)6(1.31/HDLc). 20
Metabolic and inflammation biomarkers
Individuals included in the study were fasting 12 h before collecting the blood samples, and we allowed the blood samples to clot at room temperature and then centrifuged at 1509 RCF (Rotanta 460R; Andreas Hettich GmbH & Co. KG., Germany) for 10 min at 20°C. Serum was collected and stored at −80°C for miRNA analysis and at −20°C for biochemical analysis. We quantified the serum concentration of glucose and lipid profile (mg/dL) including triglycerides (TG), total cholesterol (TC), HDLc, low-density lipoprotein cholesterol (LDLc) and VLDLc with the Friedewald et al. 21 formula, and apolipoproteins A-1 (Apo A-1) and B (Apo B), nonesterified fatty acids (NEFAs mmol/L) and C-reactive protein (mg/L) were quantified by routine colorimetric, enzymatic and immuno-turbidimetry methods (Randox Laboratories, UK). Through using commercial enzyme-linked immunosorbent assays, soluble levels of insulin (sensitivity of 0.399 µUI/mL; ALPCO, USA) were determined.
Based on the lipid profile measurement, we calculated the cholesterol indexes TG/HDLc, Apo B/Apo A-1 and insulin indexes: the homeostasis model assessment-insulin resistance (HOMA-IR) = [fasting serum glucose mg/dL × (fasting serum insulin µUI/mL)/405], 22 quantitative insulin sensitivity check index, QUICKI = [1/(log(fasting insulin, IU/mL) + log (fasting glucose, mg/dL)], HOMA-B = 20 × insulin (µUI/mL)/[glucose (mmol/L) – 3.5] and basal disposition index (DI) were calculated as HOMA-B/HOMA-IR.
Circulating levels of miR-33a and miR-33b analyses
The serum miRNA extraction was carried out with the method by organic solvents and the purification with silica membrane (cat. no. 217184, QIAGEN®). The complementary DNA (cDNA) was synthesized using the TaqMan® Advanced miRNA cDNA Synthesis Kit, and the relative expression levels were assessed with TaqMan® Fast Advanced Master Mix (cat. no. A28007 and 4444557, respectively; Applied Biosystems™); for each target gene, we used a specific TaqMan expression assay supplied by Applied Biosystems™. The target genes expression was normalized with hsa-miR-320a as endogenous reference gene. The relative expression fold change of target gene was calculated using 2−ΔCT method. To ensure accuracy of data, experiments were done in duplicate, and blank and internal controls were included in all reactions. Data were collected with applications of StepOne detector software (StepOne™ Real-Time PCR System; Applied Biosystems™, USA).
Statistical analysis
Data were analysed with statistics software IBM SPSS Statistics v24 (IBM Inc., USA) and GraphPad Prism v6.01 (2014; GraphPad Software, USA). Results are given as mean ± standard deviation (SD) or standard error of the mean (SE) according to the test used. Normal distribution of clinical and laboratory variables was evaluated with Z Kolmogorov–Smirnov test. A two-tailed p value less than 0.05 was considered statistically significant for following data analysis: (1) the clinical, adiposity and metabolic markers of the study groups were performed with unpaired Student’s t-test or analysis of variance (ANOVA) one-way test and Tukey post hoc, to compare quantitative data; (2) data from miR-33 family circulating levels were evaluated with Mann–Whitney U test, and rho Spearman correlation tests and multivariate regression analyses were performed to evaluate the prediction of age and gender on levels of miR-33a and (3) receiver operating characteristic (ROC) curve was generated for each miRNA circulating levels, and the area under the curve (AUC) value and 95% confidence intervals (CI) were calculated to determine the specificity and sensitivity.
Results
Clinical characteristics of the study participants
The frequency of individuals with obesity was 30.2%, with BMI ‾x = 35.2 kg/m2 ± 3.7 and biochemistry data of dyslipidemia in 95% of the IR cases compared to the non-IR individuals (data not shown). Also, IR subjects show low-grade inflammation evaluated by C-reactive protein concentration (7.5 mg/L ± 3.7), and senior subjects show a dysmetabolic profile versus young subjects determined by the increase in TC (217 mg/dL ± 46 vs 174 mg/dL ± 29; p < 0.001), LDLc (130 mg/dL ± 48 vs 105 mg/dL ± 39; p = 0.013), apolipoprotein A-1 (141 mg/dL ± 39 vs 121 mg/dL ± 34; p = 0.012), apolipoprotein B (85 mg/dL ± 32 vs 67 mg/dL ± 22; p = 0.003), fasting serum glucose (92 mg/dL ± 13 vs 84 mg/dL ± 18; p = 0.022) respectively, and HOMA-B and decreased DI and QUICKI indexes (Figure 1(b)).
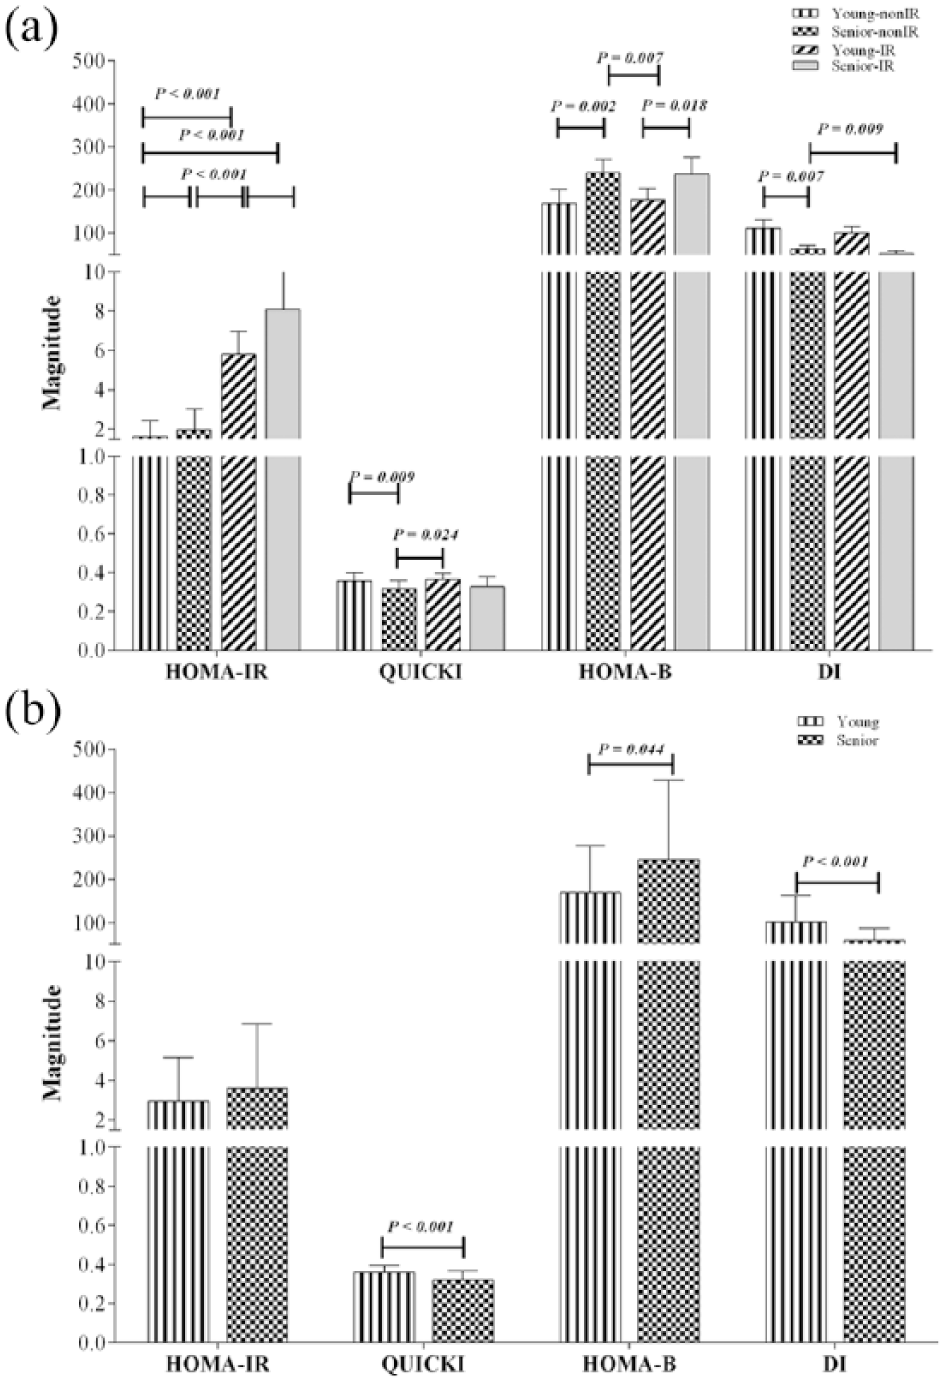
Insulin resistance indexes of the study group. Data are shown in
As expected, young participants without IR show significantly improved metabolism with regard to glucose homeostasis and the lipid profile. In contrary, in the evaluation of adiposity, increased fat deposits were observed in young-IR individuals when compared to other groups. However, senior-IR participants showed impaired lipid profile, when compared to young-IR and non-IR subjects (Table 1 and Supplementary data 1).
Adiposity evaluation, lipid profile and metabolic biomarkers of the study participants.
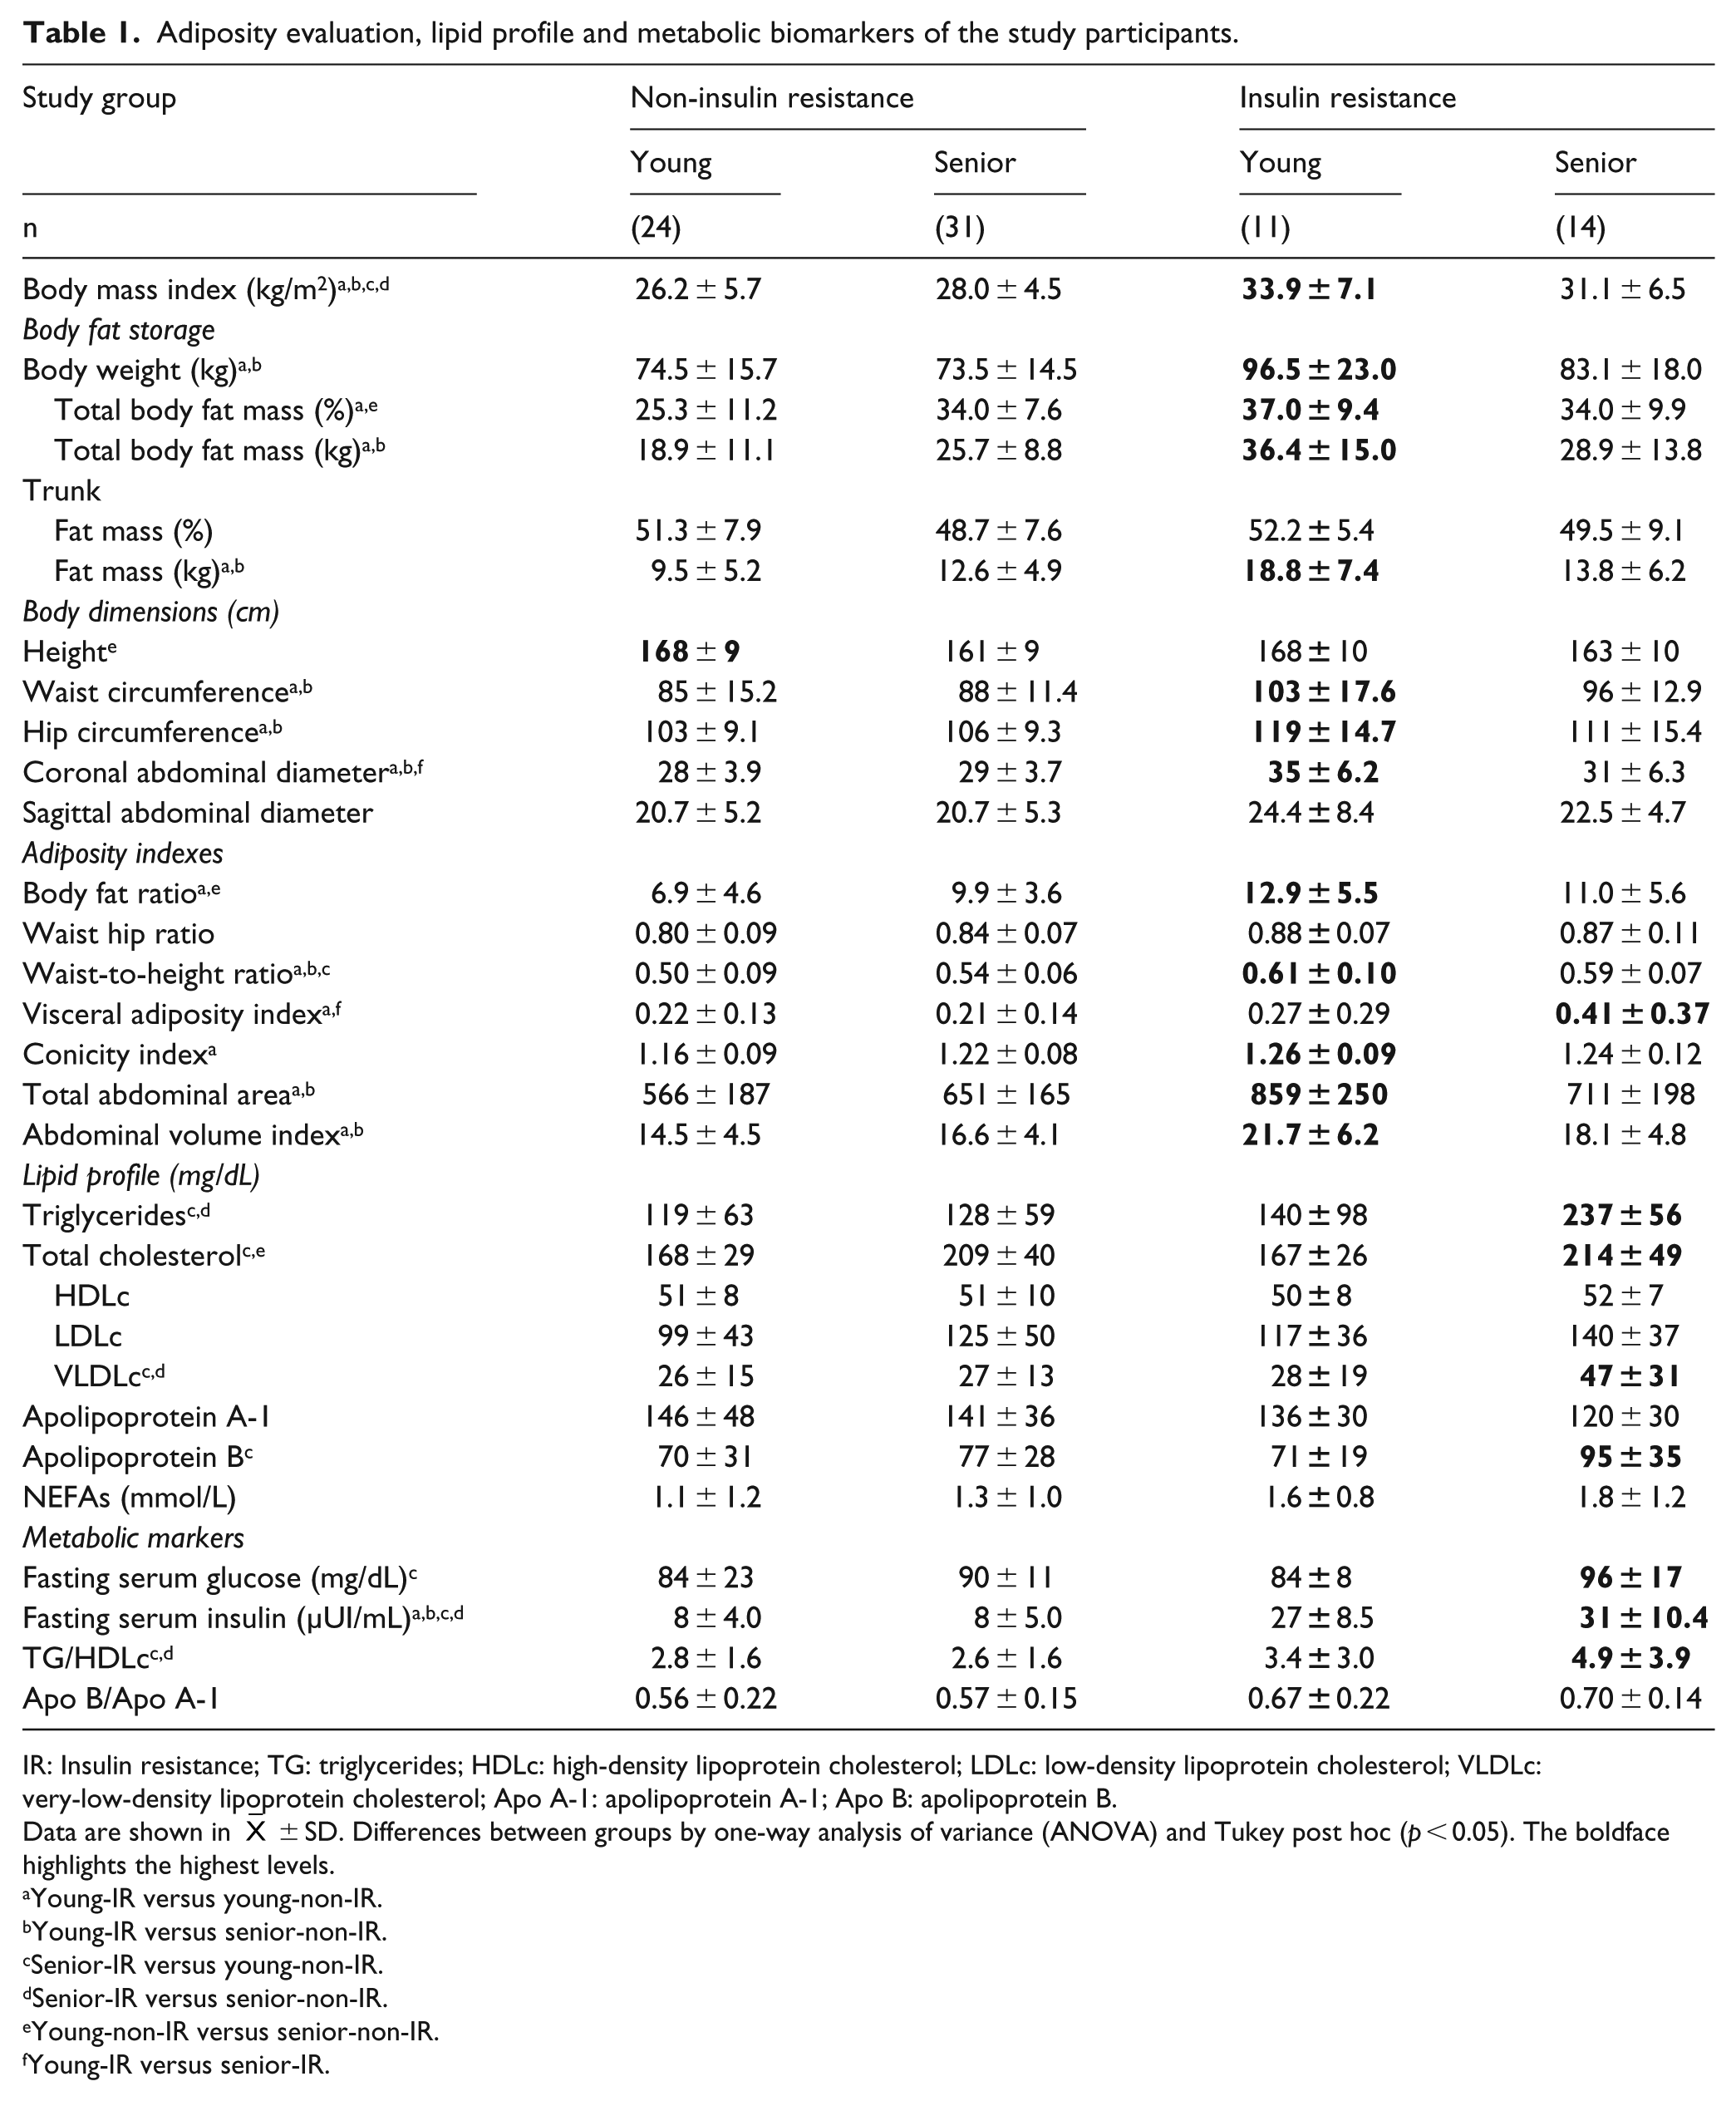
IR: Insulin resistance; TG: triglycerides; HDLc: high-density lipoprotein cholesterol; LDLc: low-density lipoprotein cholesterol; VLDLc: very-low-density lipoprotein cholesterol; Apo A-1: apolipoprotein A-1; Apo B: apolipoprotein B.
Data are shown in
Young-IR versus young-non-IR.
Young-IR versus senior-non-IR.
Senior-IR versus young-non-IR.
Senior-IR versus senior-non-IR.
Young-non-IR versus senior-non-IR.
Young-IR versus senior-IR.
The pathological adiposity is parallel to the unbalanced of the levels of metabolic markers, which was characterized by the increase in the body fat storage, lipids and insulin indexes in the clinical scenario of IR
Adiposity and fat mass distribution were also increased in the young-IR subjects; mainly they presented central obesity, with 3.6% more in the proportion of total body fat than that in the other groups. It is important to mention that senior-IR also showed unbalanced lipid profile, parallel to pathological adiposity and insulin indexes (Table 1 and Figure 1(a)).
Increased circulating levels of miR-33a and miR-33b in IR subjects after correcting for age and other confounders were opposite between them and were associated with ageing and IR
Increased levels of circulating miR-33a and miR-33b were consistently found in IR subjects when compared to non-IR participants (Figure 2(a)), whereas only miR-33a was increased in young versus senior individuals (Figure 2(b)). It is important to highlight that miR-33a was 10 times greater than miR-33b.
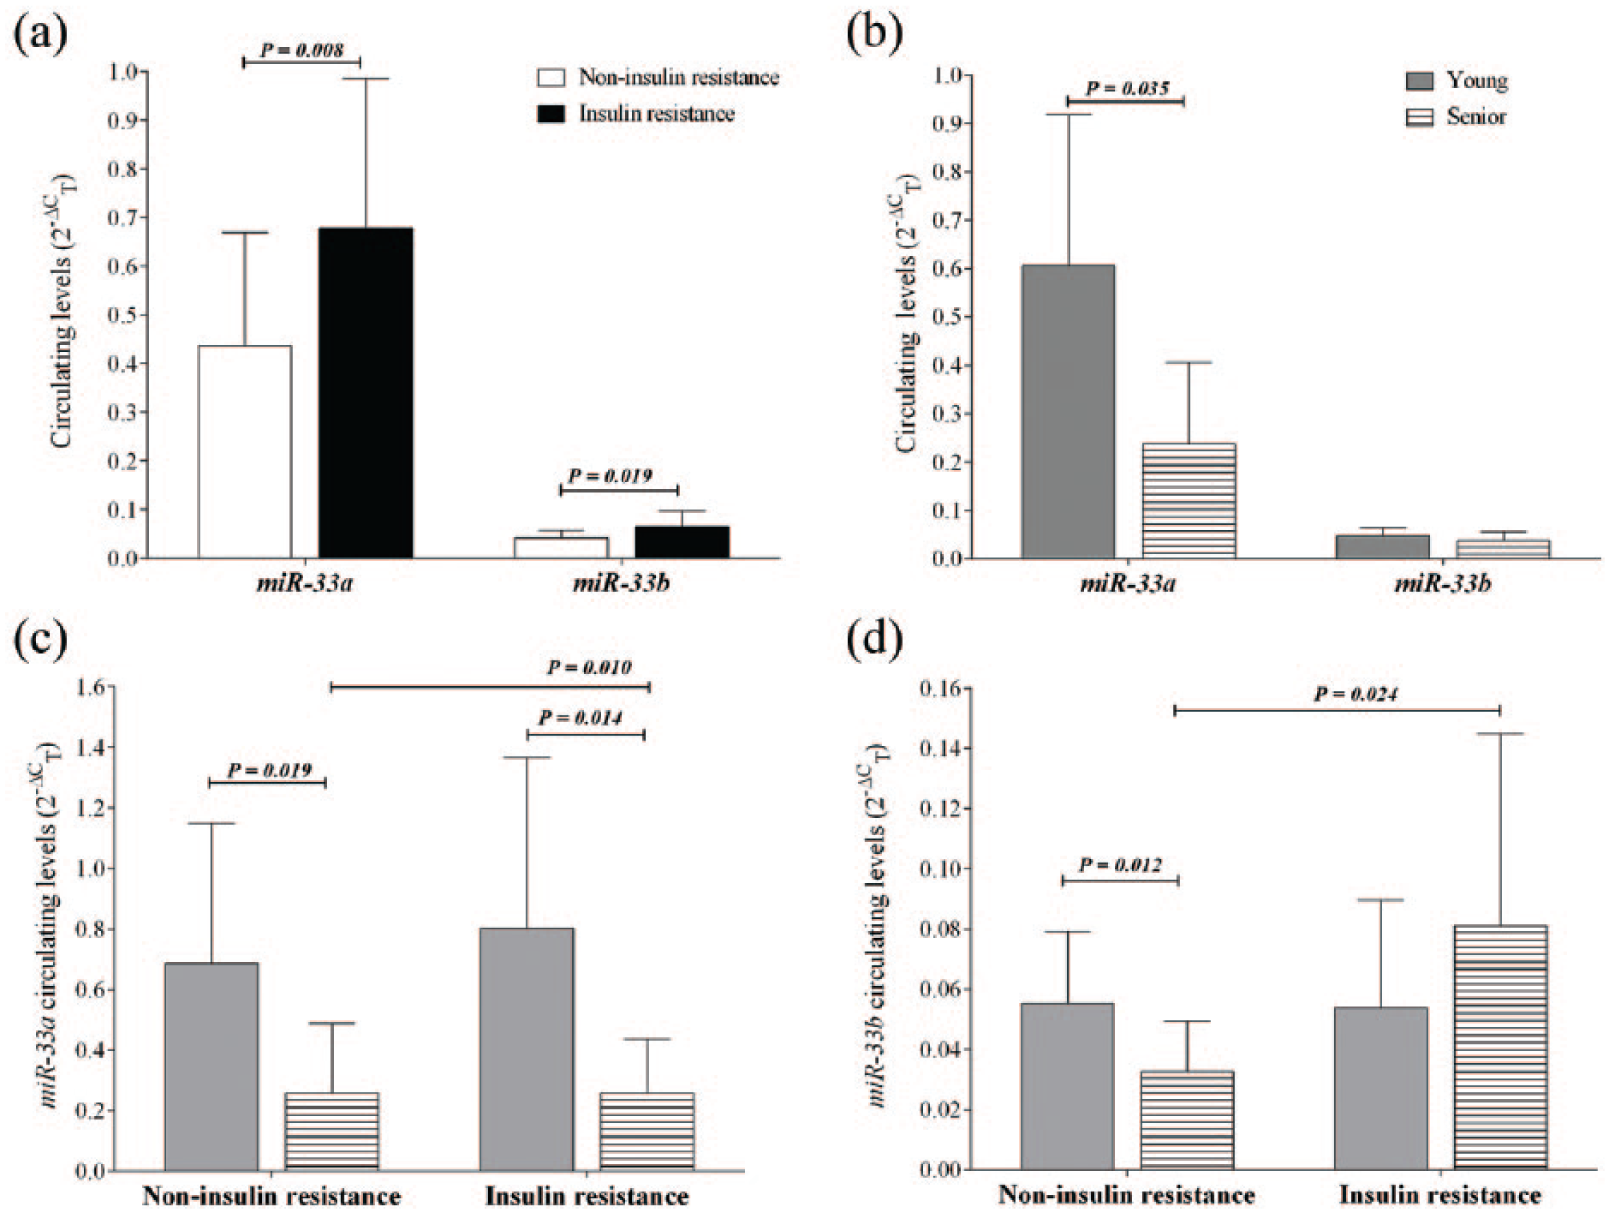
miR-33a and miR-33b circulating levels. Data are shown as
In a more detailed analysis, an increase in the circulating levels of miR-33b was observed in senior-IR individuals (Figure 2(d)), while there is a decrease in the circulating levels of miR-33a (Figure 2(c)); taking into account the age with a cut-off point as 40 years, in the subjects with and without IR miR-33a, circulating levels were higher in young subjects, while miR-33b was higher in young non-IR participants (Figure 2(c) and (d)).
To strengthen the results mentioned above and show apart the potential ability of miR-33 family circulating levels to discriminate the participation of ageing and IR, we carry out the construction of ROC curves showing the performance of circulating levels of miR-33a and miR-33b alone and together (Figure 3).
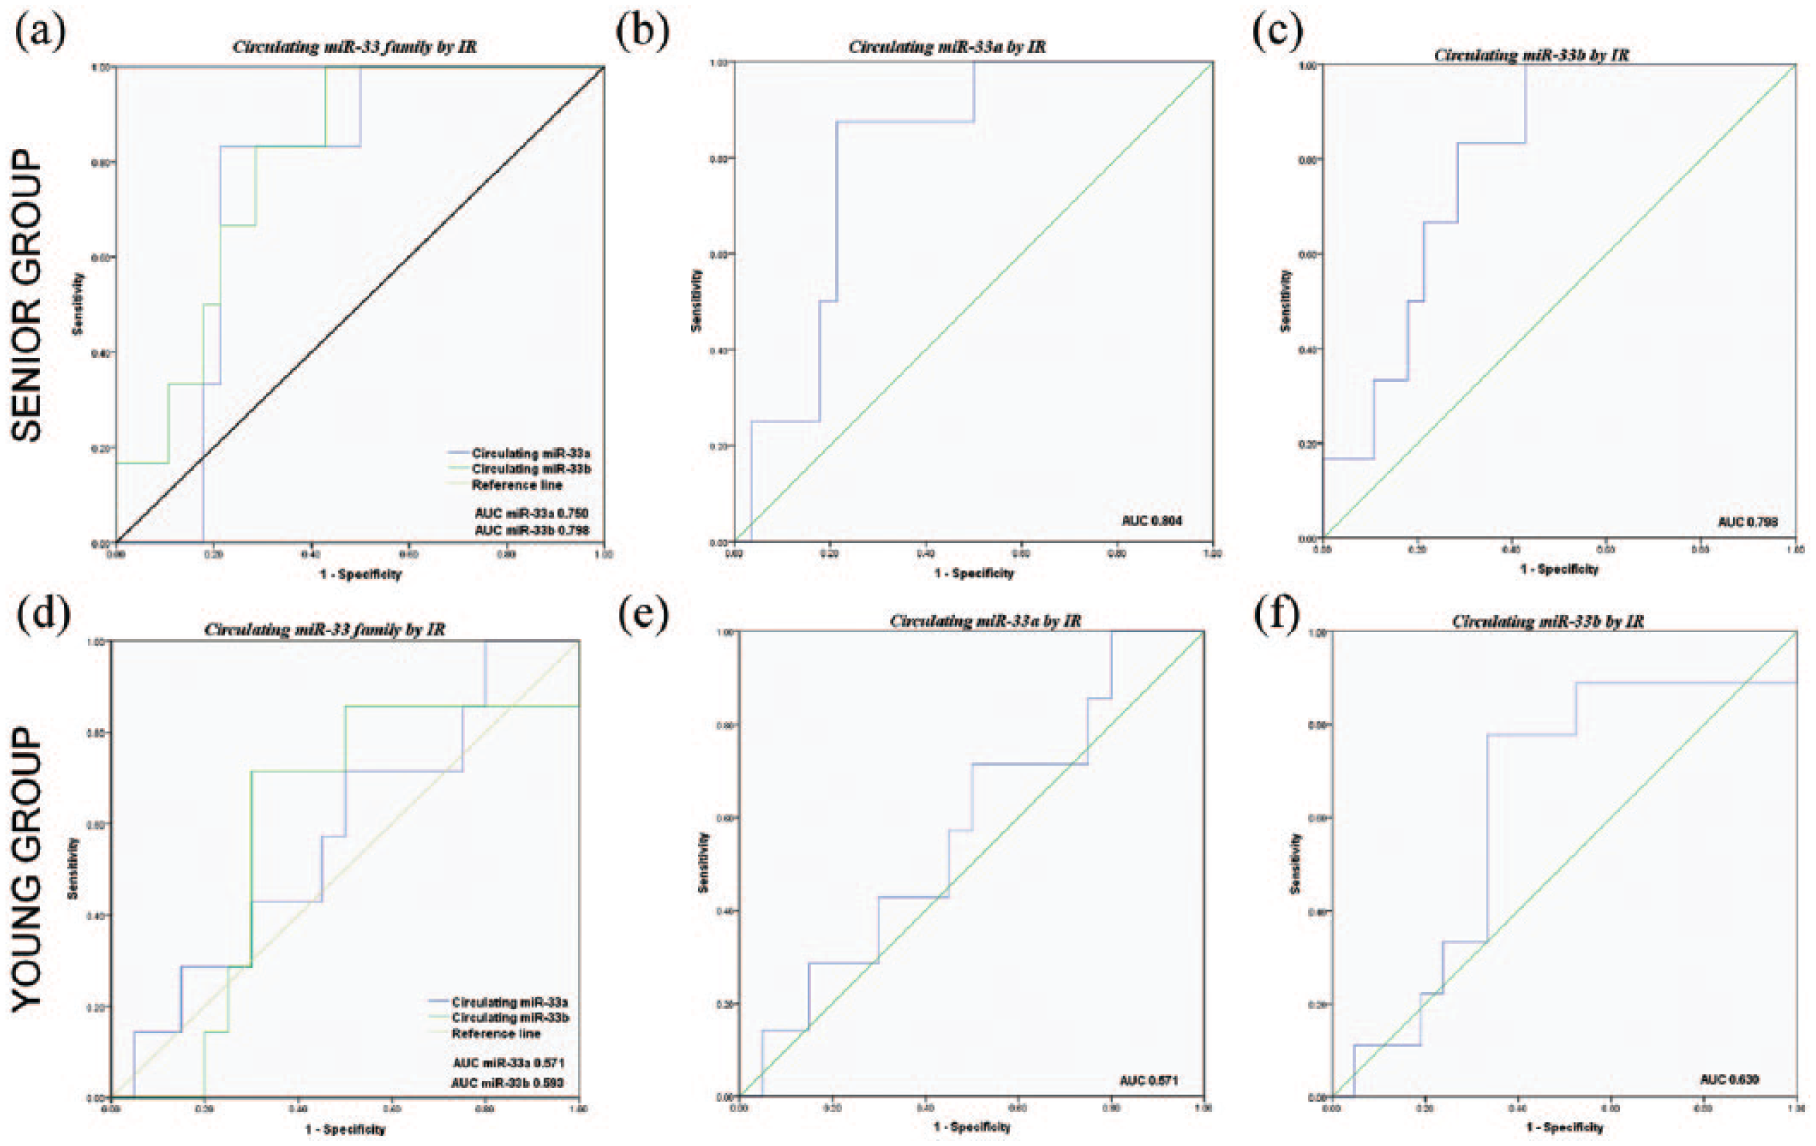
Ability of circulating miR-33 family presence to distinguish between insulin resistance and ageing. (a, b and c) ROC curves IR versus non-IR in senior group. (d, e and f) ROC curves IR versus non-IR in young group.
These analyzes show the values of AUC with the following discriminations, first: young of senior individuals and second: non-IR of IR individuals, and the results obtained were as follows:
AUC for miR-33a circulating levels 0.804 (p = 0.010) in senior and 0.571 (p = 0.580) in young individuals (Figure 3(b) and (e), respectively);
AUC for miR-33b circulating levels 0.798 (p = 0.024) in senior and 0.630 (p = 0.268) in young individuals (Figure 3(c) and (f), respectively);
AUC for both miR-33 family circulating levels jointly [miR-33a 0.750 (p = 0.058) and miR-33b 0.798 (p = 0.024) in senior and miR-33a 0.571 (p = 0.580) and miR-33b 0.593 (p = 0.472) in young individuals (Figure 3(a) and (d), respectively)].
Also, ROC curve analyses showed 95% CI = 0.655–0.952 for miR-33a and 95% CI = 0.640–0.955 for miR-33b in senior group.
The alternate and opposite correlations were observed for the overexpression of miR-33 family with the increase in the lipid profile and redistribution of fat mass
The circulating levels of miR-33a and miR-33b showed correlations with the accumulation and distribution of body fat, lipid profile and metabolic markers with the following scheme (Table 2):
Alternate or opposite correlations, for miR-33a circulating level, were observed, that is, in alternation in the IR group, lipid profile components, SAD and basal DI correlate positively, while in the non-IR group, they do not correlate, with the exception of the TC, which correlates negatively; in opposite correlation, in non-IR group, miR-33a correlates negatively with adiposity indexes and body dimensions, while in the IR group, they do not correlate.
In non-IR group, miR-33b circulating levels correlate negatively with parameters of lipid profile, while in IR group, they do not correlate.
miR-33a and miR-33b circulating levels correlate simultaneously with visceral adiposity index in IR individuals and in non-IR individuals, respectively.
The correlations with the parameters measured were inverse and on higher proportion for miR-33a circulating levels (rho from 51.4% to 67.3%, p < 0.01) than those for miR-33b circulating levels (rho from −40.2% to −29.9%, p < 0.05).
miR-33a and miR-33b circulating levels correlate between them in both groups with and without IR.
miR-33 family circulating level correlations.
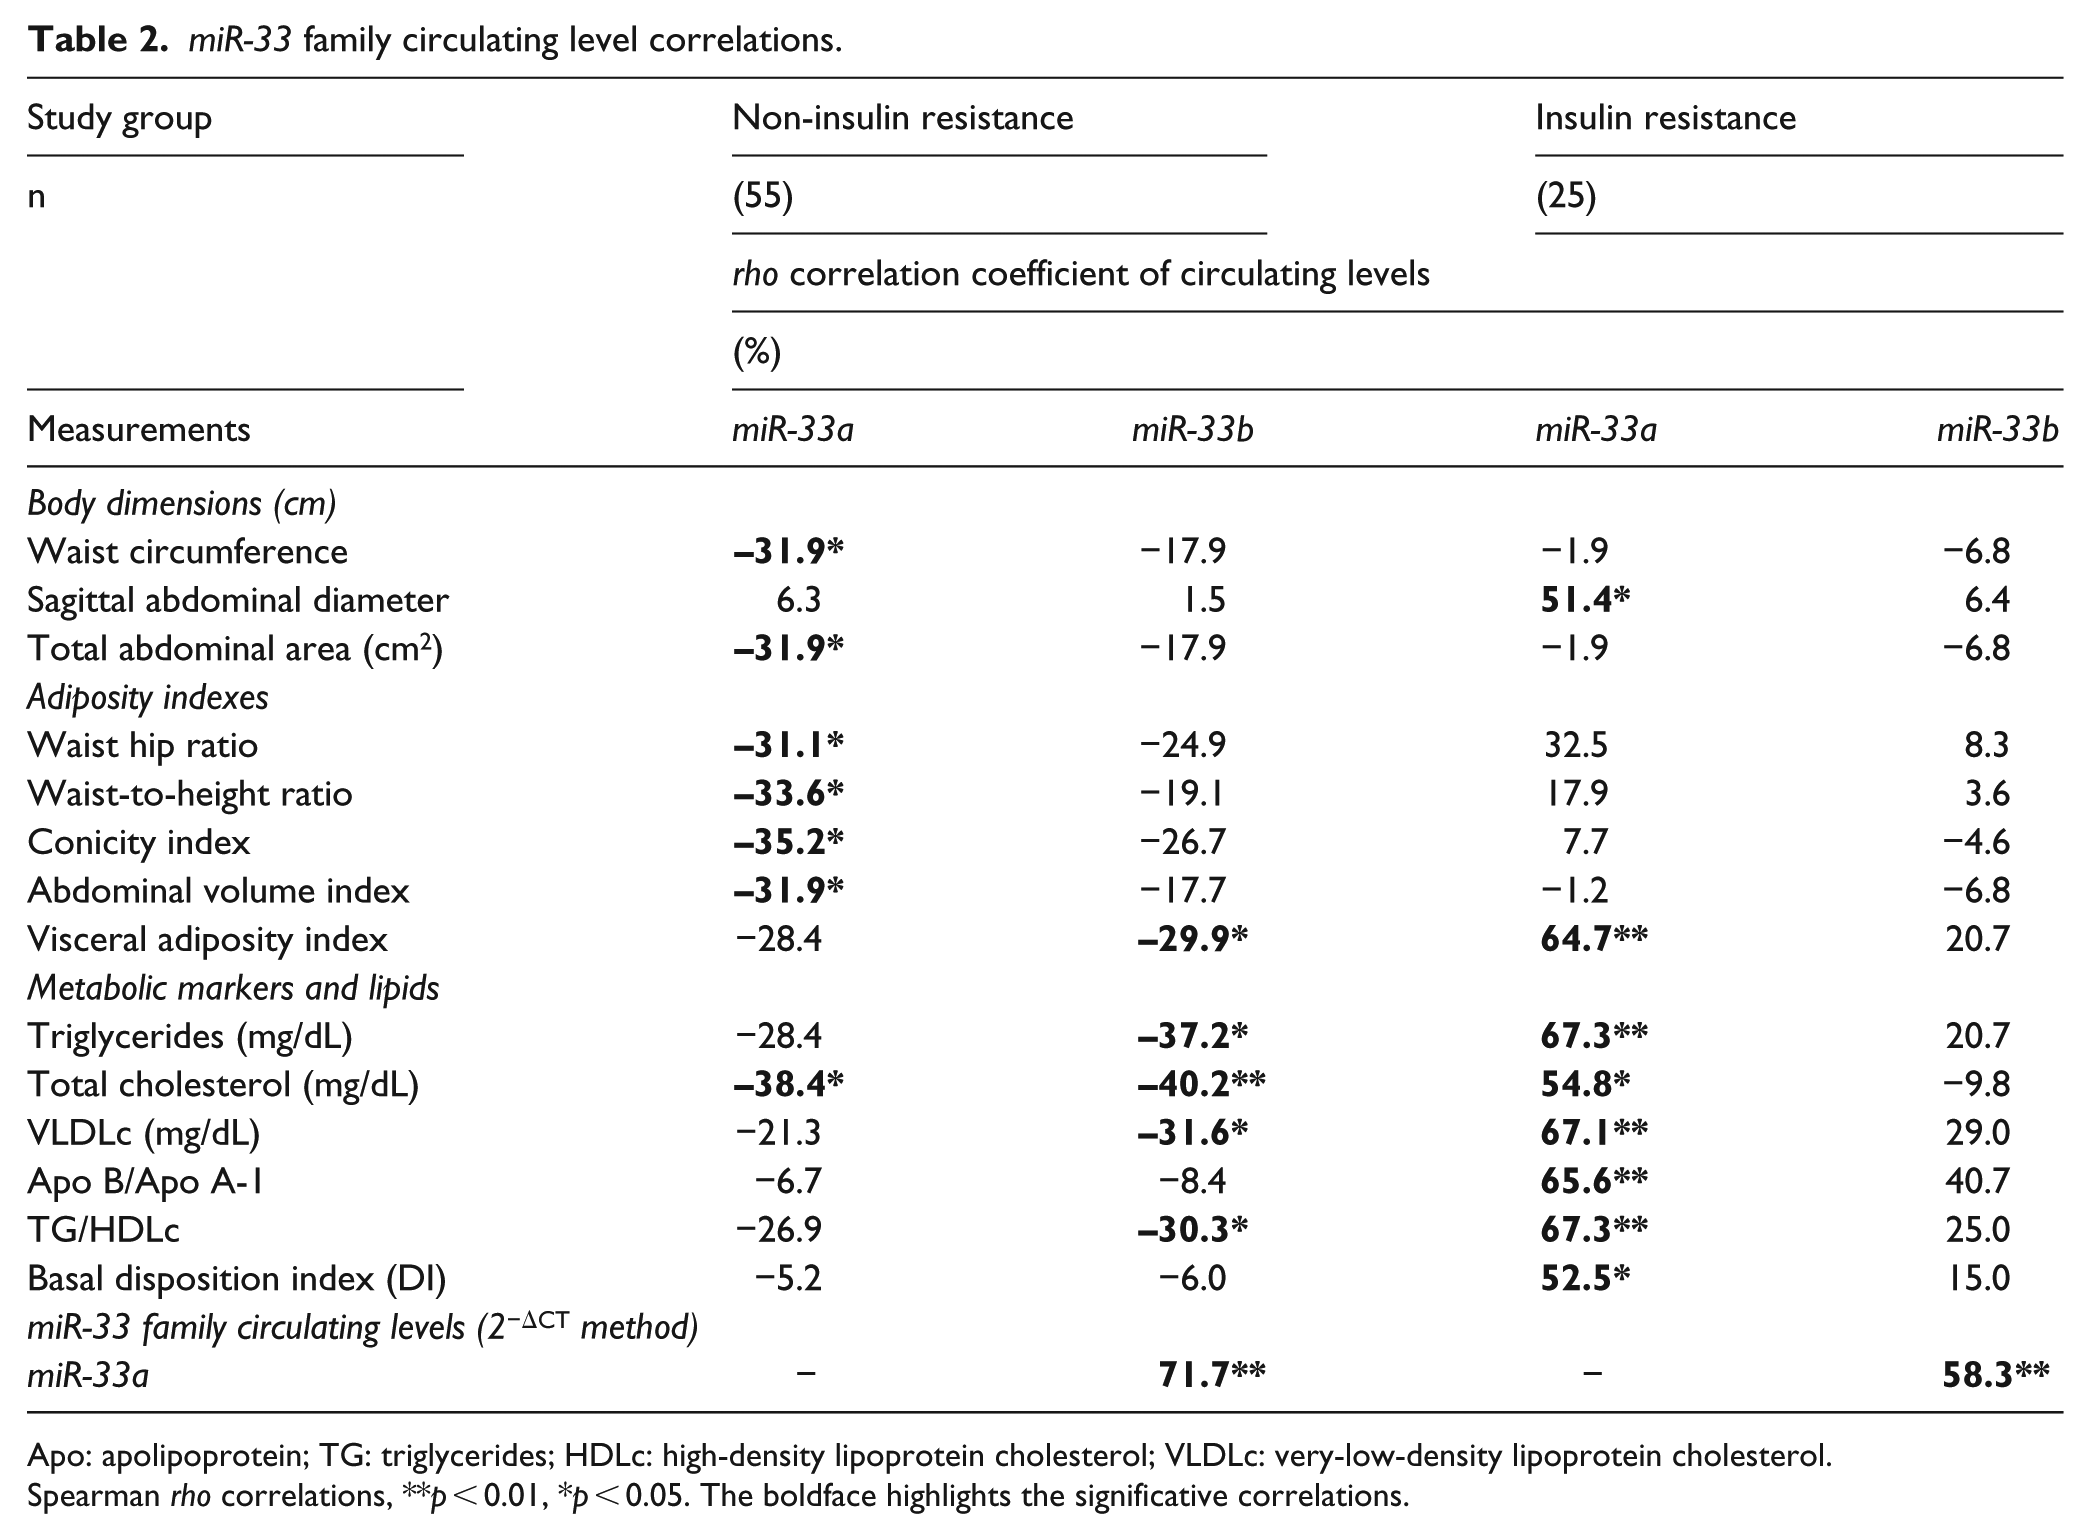
Apo: apolipoprotein; TG: triglycerides; HDLc: high-density lipoprotein cholesterol; VLDLc: very-low-density lipoprotein cholesterol.
Spearman rho correlations, **p < 0.01, *p < 0.05. The boldface highlights the significative correlations.
Additionally, we performed multiple regression analysis, where we normalized (ln-transform) data and found that SAD, basal DI and Apo B/Apo A-1 indexes predict 70.2% of the variation in miR-33a circulating levels (Table 3). The model adjusted by age and gender as covariable is [ln miR-33a = 0.322 × SAD + (10.694 × Apo B/Apo A1) + (0.034 × DI) + (–21.042)].
Multiple regressions between miR-33a circulating levels and insulin resistance.
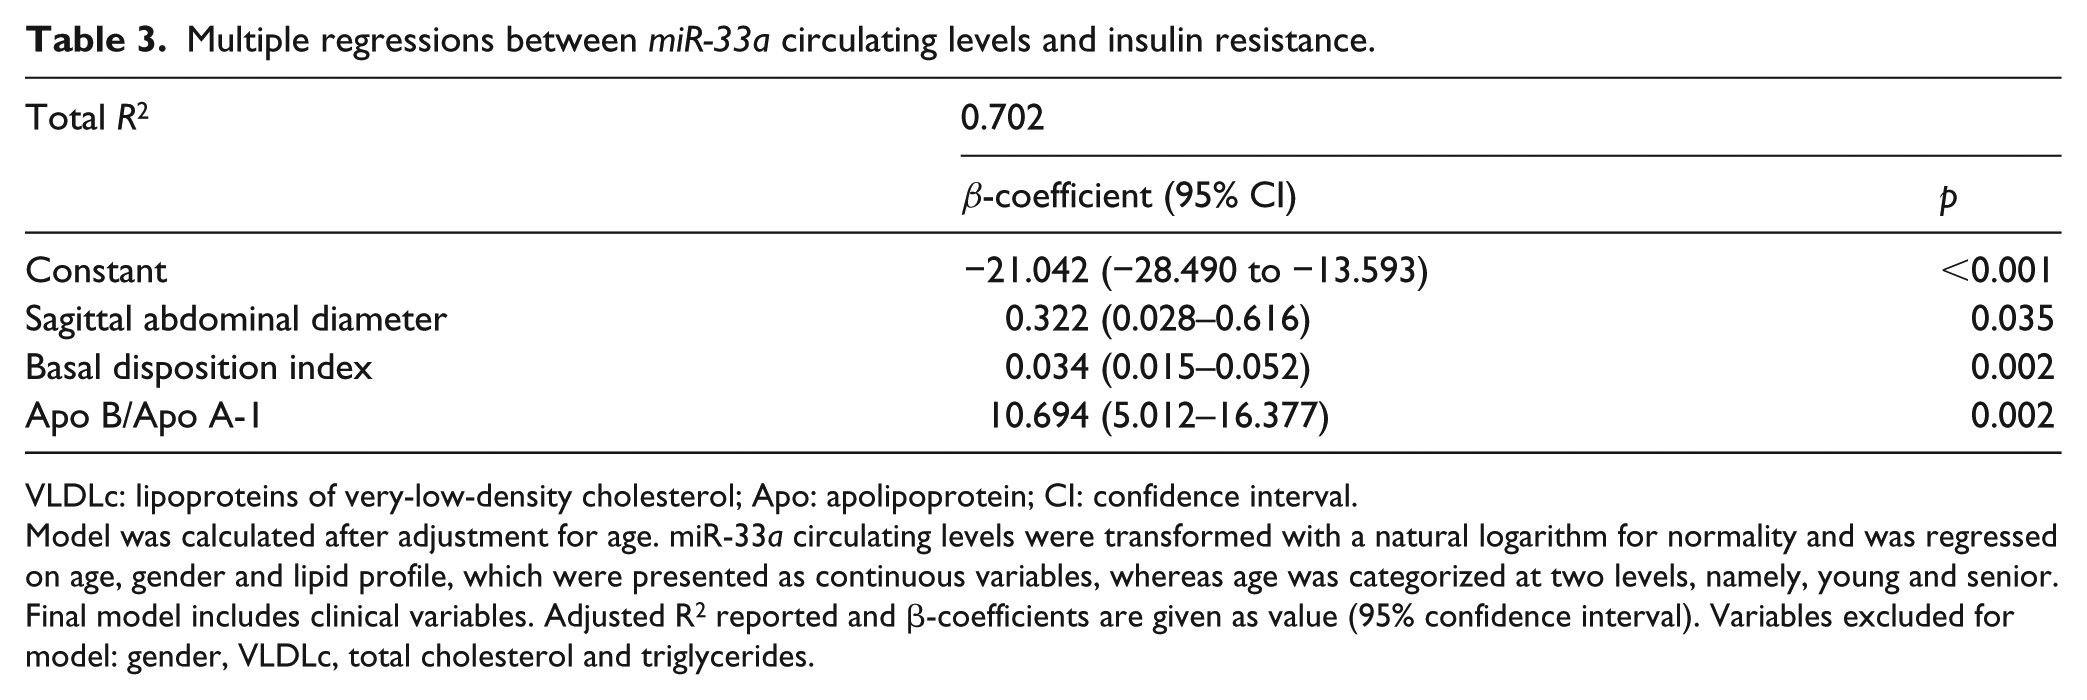
VLDLc: lipoproteins of very-low-density cholesterol; Apo: apolipoprotein; CI: confidence interval.
Model was calculated after adjustment for age. miR-33a circulating levels were transformed with a natural logarithm for normality and was regressed on age, gender and lipid profile, which were presented as continuous variables, whereas age was categorized at two levels, namely, young and senior. Final model includes clinical variables. Adjusted R2 reported and β-coefficients are given as value (95% confidence interval). Variables excluded for model: gender, VLDLc, total cholesterol and triglycerides.
Discussion
The efflux of cholesterol, the biogenesis of HDL, the transport of intracellular cholesterol, the oxidation of fatty acids, the signaling and response of insulin and the metabolism of glucose, besides the type of adipocyte, endocrine function, and lipolytic activity, have been attributed to the outcome abilities of regulatory miR-33 family, 23 since miR-33a expression increases when defective sterols, while miR-33b expression is induced by insulin and other factors. 24 From this conceptual point, here we examined the relationship of circulating levels of miR-33a/b with body adiposity and metabolic unbalance in the ageing scenario and its complex interaction with the presence of IR.
Broadly, on the stage of IR, miR-33a/b levels are increased. However, our results point to two important observations: first, on the scenario of IR, the relative abundance of serum miR-33a was lower in senior than in young individuals, contrary to opposite levels of miR-33b. Amid the impaired lipid profile and increased biomarkers of manifested metabolic dysregulation, the presence of miR-33a was unfavoured in senior participants, while young individuals showed increased fatness and increased miR-33a (but decreased miR-33b).
Second, in subjects without IR (non-IR), circulating levels of both miR-33a and miR-33b were lower in senior than in young individuals, while the adiposity and metabolic markers were equivalent between both, with the exclusion of total body fat mass.
Even though the potential limitations of this study include the small sample size and the relatively low IR frequency, possibly add a new outlook of the relationship between ageing and the molecular expression of miR-33 family. On this context, it has also been reported that the miRNAs can be differentially expressed during ageing 25 and that there may be differences in expression between older and younger organs and tissues. 26
In another context, we have previously reported frequencies of IR of 39% in individuals with excess of weight 2 and 62% in individuals with obesity in our population aged 20–59 years; 27 this cohort also included 31.3% of individuals with dyslipidemias. 28 These frequencies are in agreement with the group included for this study, and in which, risk factors for the development of IR were identified.
Here, it is worth mentioning that since the activation of the insulin signalling network is altered through the deficit in the effects on insulin sensitivity and the alteration of the regulation of glucose and lipid metabolism (defined as IR), it contributes to the pathogenesis of metabolic diseases, including T2D, cardiovascular diseases, hypertension and atherosclerosis.1,29,30 And even though the increase in body fat content occurs in all age groups and is pathogenically related to several chronic degenerative diseases, it has been shown that the ageing process is characterized by a state of chronic inflammation, which promotes the development of IR. This is an important distinction because the decrease in insulin sensitivity precedes development of T2D and other metabolic disease states.
Likewise, the results of this study show, as it has been reported, that ageing individuals, as a group, have more IR than younger people despite their adiposity status and that IR is associated with a more adverse global metabolic risk profile. Besides this, risk increases significantly in the senior-IR subgroup.
This fact is an important remark because we show that age adds at some point to the presentation or maintenance of IR; in this regard, the contribution of age to the development and establishment of the pathogenic process of IR was demonstrated by the experiments of Facchini et al. 31 and Ide et al., 32 in which they showed that mice exposed to hypersecretion of insulin stimulated by glucose develop IR at 9 weeks of age, but not before and it is exacerbated at 15 weeks of age.
In this respect, we show that in our study group, the pathological adiposity was parallel to the imbalance of the levels of metabolic markers, and it is characterized by the increase in the lipid profile and insulin indexes in the clinical scenario of IR with a differential profile according to the ageing.
This profile confirms that IR is a complex disease, involving multiple interacting factors in the cellular environment, and in which the irregular distribution of body adipose tissue presents a particular sensory characteristic in the metabolic pathways, the common denominator being dysregulation of lipid levels and the inflammatory state that occurs along the subclinical IR stage, which participate in the response to an early event occurring in adipose tissue, adipogenesis, which could be potentiated by the divergence of expression levels of miR-33a and miR-33b. 33
The biological mechanism that links IR with the family of miR-33 has been widely reported, 34 and it is shown that in hepatocytes, the uptake of lipoproteins increases under conditions in which intracellular cholesterol decreases, which induces the synthesis of SREBP2; this process favours the increase in endogenous cholesterol biosynthesis, and at the same time, the synthesis of SREBP1 is induced by IR or hyperinsulinemia, and this leads to an increase in triglyceride biosynthesis. 13
Consequently, the activation of SREBP induces the co-expression of miR-33 family, which leads to the decrease in HDLc levels by inhibiting ABCA1 (ATP-binding cassette, subfamily A, member 1), which reduces the insulin signalling targeting the IRS2 (insulin receptor substrate 2) and the cellular β-oxidation targeting different fatty acid oxidation enzymes. 35 According to this, the expression of miR-33 is closely related to the metabolism of HDLc. 36
In this study, we did not find differences in HDLc levels between individuals with and without IR, together with a significant increase in triglyceride and TC levels. Our previous works also show similar lipid profile and no differences in HDLc levels in our population with IR versus without IR.2,27,28 Amid of this fact, it was not possible to establish the clinical relationship between the circulating levels of the miR-33 family and HDLc.
However, according to the expectations, the increase in the serum levels of TC was observed when the miR-33a levels decreased in senior individuals, while in young individuals, it was the opposite. Parallel in the senior with IR, serum triglyceride levels increase when miR-33b levels increase. With these results, we can suggest that the biological relationship between TC and TG serum levels with the circulating miR-33 family is evidenced in the clinical scenario of IR in senior individuals.
It is important to note that in this work, the presence of circulating levels of miR-33a is further characterized, 10 times higher than the levels of miR33b. In the context of IR overlapping with ageing, the circulating levels of the miR-33 family presented in this study have not been previously reported; in this regard, there are two scenarios that we be able to distinguish: first, the reports that precede this study are related to miR-33 intracellular expression (endogenous) or circulating levels in other diseases,37,38 while in this study we focused on mature (circulating levels) miR-33 in individuals with the novo IR classification, and second, the individuals included in this study were characterized with IR according to a strict system, the Stern criteria; 15 in this sense, we cannot establish controversy with others studies.
In this study, a circulating miR-33 profile that was able to discriminate senior-IR individuals from senior-non-IR had been identified. Our results highlight what has already been reported, the importance of miR-33 in the metabolism of cholesterol and lipids, but also show that the increase in circulating miR-33a or miR-33b individually is sufficient to distinguish people with IR from those without IR, as long as they are over 40 years old, and moreover, the combination of both members of the miR-33 family also discriminates between individuals with IR and without IR. However, one limitation is that the progression of IR disease cannot be accurate.
In conclusion, the overexpression of miR-33a and miR-33b was associated with IR, which was characterized by the increase in the lipid profile and redistribution of amount of body fat mass. Even though the increase in body fat content occurs in all age population and is pathogenically related to several chronic-degenerative diseases, it has been shown that the ageing process is characterized by a state of chronic inflammation, which promotes the development of IR. This is an important distinction because the decrease in insulin sensitivity precedes development of T2D and others metabolic disease states.39,40
Therefore, in relation to our results, we suggest that young individuals with IR included in our study are in an interface in which the effect of the expression of miR-33 is not yet detectable, probably because there is a disorder in the process of adipogenesis. In contrast, older people may be more susceptible to the effects of IR and miR-33b increase/miR-33a decrease levels, and this is particularly interesting in the record of insulin sensitivity. Hence, increasing miR-33a levels may improve IR as an important and modifiable risk factor in older people.
In the conceptual framework described, this study is the first to show a widely divergent profile of the circulating miR-33 family associated with adiposity and metabolic markers in the context of IR overlapping on ageing. In senior IR individuals, circulating levels of miR-33a could be postulated as biomarker in the pathogenic process of IR.
Supplemental Material
TABLE_Sup._DATA_1 – Supplemental material for Ageing influences the relationship of circulating miR-33a and miR-33b levels with insulin resistance and adiposity
Supplemental material, TABLE_Sup._DATA_1 for Ageing influences the relationship of circulating miR-33a and miR-33b levels with insulin resistance and adiposity by Fernanda-Isadora Corona-Meraz, Mónica Vázquez-Del Mercado, Francisco José Ortega, Sandra-Luz Ruiz-Quezada, Milton-Omar Guzmán-Ornelas and Rosa-Elena Navarro-Hernández in Diabetes & Vascular Disease Research
Footnotes
Declaration of conflicting interests
The author(s) declared no potential conflicts of interest with respect to the research, authorship and/or publication of this article.
Funding
The author(s) disclosed receipt of the following financial support for the research, authorship and/or publication of this article: This work was supported by Grant CONACyT FOINS No. 2250-6 ‘Investigación en Fronteras de la Ciencia 2015-2’ 4/XIV-E/2015 to M.V.M. (FON.INST./276/2016), by PNPC-CONACyT UdG Doctoral Training in Biomedical Sciences to F.-I.C.-M. (2014–2017; Scholarship No. 305864) and UDG/PRO-SNI 2015/2017 to R.E.N.H.
Supplemental material
Supplemental material for this article is available online.
References
Supplementary Material
Please find the following supplemental material available below.
For Open Access articles published under a Creative Commons License, all supplemental material carries the same license as the article it is associated with.
For non-Open Access articles published, all supplemental material carries a non-exclusive license, and permission requests for re-use of supplemental material or any part of supplemental material shall be sent directly to the copyright owner as specified in the copyright notice associated with the article.