
Abstract
Type 1 diabetes can have deleterious effects on skeletal muscle and its microvasculature. Our laboratory has recently identified murine double minute-2 as a master regulator of muscle microvasculature by controlling expression levels of two key molecular actors of the angio-adaptive process: the pro-angiogenic vascular endothelial growth factor-A and the anti-angiogenic thrombospondin-1. Here, we show for the first time that in the soleus and plantaris muscles of the diabetes-prone BioBreeding rats, a rodent model of autoimmune type 1 diabetes, murine double minute-2 protein levels are significantly decreased, coinciding with elevated protein levels of thrombospondin-1 and its transcription factor forkhead box O1. Significant capillary regression was observed to similar extent in soleus and plantaris muscles of type 1 diabetic rats. Elevated blood glucose levels were correlated with the loss of capillaries, the reduction in murine double minute-2 expression and with the elevations in thrombospondin-1. Vascular endothelial growth factor-A protein levels were unaltered or even increased in diabetic animals, yet type 1 diabetic animals had less vascular endothelial growth factor receptor-2 abundance. The vascular endothelial growth factor-A/thrombospondin-1 ratio, a good indicator of skeletal muscle angio-adaptive environment, was decreased in type 1 diabetic muscle. Our results suggest that the murine double minute-2–forkhead box O1–thrombospondin-1 pathway plays an important role in angio-regulation of the skeletal muscle in the pathophysiological context of type 1 diabetes.
Keywords
Introduction
Type 1 diabetes (T1D) is an autoimmune disease that results in the destruction of pancreatic β cells and the loss of endogenous insulin production. Even with exogenous insulin therapy, control is often imperfect in T1D with extensive lifetime exposure to hyperglycaemia, which represents a major risk-factor for endothelial cell dysfunction, both directly and indirectly. 1 Consequently, T1D is associated with a number of microvascular complications affecting our smallest blood vessels, the capillaries. We and others have previously observed in rodent models of T1D a loss of capillaries in skeletal muscle.2,3 The skeletal muscle tissue is paramount for a variety of functions ranging from locomotion to the metabolic regulation of glycaemia. Skeletal muscle is the major site of glucose uptake in the postprandial state in healthy humans, accounting for ~80% of the body’s insulin-mediated glucose disposal. 4 Since capillaries are responsible for the delivery of oxygen and nutrients to skeletal myofibres, the capillary network is a key determinant of overall muscle functionality. A failure to deliver insulin, either endogenous (i.e. pancreatic) or exogenous (i.e. via needle or pump), to the target location (i.e. muscle) is now regarded as another reason for reduced insulin sensitivity, 5 but the role of the capillaries in this process in T1D is not fully understood.
With a remarkable plasticity, the capillary network can grow, regress or be maintained in order to adapt to the myofibres’ needs. Such skeletal muscle angio-adaptation is tightly regulated by a dynamic balance between pro- and anti-angiogenic molecules. 6 We have previously identified the E3 ubiquitin ligase murine double minute-2 (Mdm2) as indispensable for skeletal muscle capillary maintenance, physiological capillary growth (i.e. angiogenesis) and the pro-angiogenic activity of endothelial cells (i.e. cell migration).7–9 We have also shown that Mdm2 could be considered a master regulator of skeletal muscle angio-adaptation as it modulates both sides of the angio-adaptive balance, most notably, through the regulation of the pro-angiogenic vascular endothelial growth factor-A (VEGF-A) and the anti-angiogenic thrombospondin-1 (TSP-1).7–9 In the context of diabetes, our laboratory has recently shown that Mdm2 protein levels were significantly lowered in skeletal muscles of type 1 and 2 diabetic animals, coinciding with muscle capillary regression.3–7
Although very limited in number, previous studies that have investigated the impact of type 1 diabetes (TID) on skeletal muscle molecular angio-adaptation have exclusively utilized chemically induced diabetes through streptozotocin (STZ) injection in rodents. STZ is a highly toxic alkylating agent that leads to hyperglycaemia by accumulating in pancreatic β cells through glucose transporter-2 (GLUT-2), causing DNA alkylation and β-cell death.10,11 The onset of overt hyperglycaemia is rapid, occurring in as little as 48–72 h following STZ injection.10,12 The systemic administration of STZ therefore represents an easy and cost-effective diabetes-inducing approach. However, it raises questions regarding the toxicity of the substance in other tissues. 13 Indeed, the uptake of STZ by GLUT-2 is not specific to pancreatic β cells, therefore being potentially toxic to other tissues and organs, such as the kidney and liver, potentially leading to confounding experimental results.10,13,14 Alternatively, BioBreeding (BB) diabetic rats spontaneously develop T1D between 50 and 90 days of age, around the time of puberty, and present characteristics that closely resemble those of human patients with T1D, including exogenous insulin dependency, hyperglycaemia, polydipsia, polyuria and ketoacidosis.15–18 As is the case with T1D patients, the onset of diabetes in the BB rat is characterized by the infiltration of immune cells in the islets of Langerhans (insulitis), 19 preceding overt diabetes by 2–3 weeks. Subsequently, β cells of the pancreas are selectively destroyed resulting in a severe T1D phenotype. The selection of the BB rat model for our investigation is relevant since the skeletal muscle and its associated microvasculature undergo considerable growth and development during the age of onset in the BB rat and are likely impacted by the level of glycaemic control achieved. 20
To date, it is still unclear how T1D could affect the microcirculation in skeletal muscle. Here, we sought to determine whether capillary regression occurs in skeletal muscles from diabetes-prone BB rats in order to more closely mimic the installation of T1D seen in humans. We aimed to identify potential diabetes-induced alterations in key angio-regulatory molecules such as Mdm2, VEGF-A and TSP-1. Understanding deleterious adaptations that occur in skeletal muscle as a result of T1D is of great importance for both the treatment and prevention of diabetes-associated vascular pathology.
Materials and methods
Animal model
This study was approved by the York University Animal Care Committee and was conducted in accordance with the Canadian Council for Animal Care Guidelines. Animals were bred at Sunnybrook Research Institute, Toronto, Canada, courtesy of Dr Philippe Poussier (protocol #520). Diabetes-prone BioBreeding rats (DPBB, n = 20) and age-matched diabetes-resistant BioBreeding rats (DRBB, n = 22) were housed under temperature-controlled conditions in a 12-h light–dark cycle with ad libitum access to a standard rodent chow diet and water. DPBB animals typically become diabetic [blood glucose (BG) ⩾15 mM] at a young age (i.e. between 50 and 90 days post birth) and require insulin treatment to survive. Our blood glucose threshold for the determination of diabetes is in line with standard guidelines. 21 After diabetes was established, the animals’ blood sugar was maintained between 12 and 20 mM to simulate the fair to poor glycaemic control that is generally observed in youth living with the disease 22 using subcutaneous insulin pellets (LinShin Canada) for a period of 2 weeks. Briefly, under inhaled isoflurane anaesthetic, a 0.5-cm subcutaneous incision, just below the neck, was made and half-to-full insulin pellet was implanted (LinShin, Canada Inc., Toronto, ON, Canada), with a full pellet releasing about 2 U of insulin/24 h for up to 40 days. The incision wound was closed and treated with topical antibiotics and pain cream (Flamazine, Smith & Nephew, Mississauga, Ontario, Canada) prior to being placed back in their cage.
Glucose measurement
Whole blood glucose levels were measured daily using an AlphaTRAK2 glucose metre (Abbott Diabetes Care Inc., Alameda, CA, USA) from a sterile saphenous vein bleed. Blood glucose values reported here were recorded just prior to skeletal muscle harvest.
Skeletal muscle tissue isolation
After 2 weeks of insulin pellet implantation, animals were anaesthetized with inhaled isoflurane. Soleus and plantaris muscles were removed, weighted and immediately flash frozen in liquid nitrogen (protein measurements) or frozen in liquid nitrogen–cooled isopentane for histology. All samples were stored at (−80°C) until analysis.
Muscle capillarization analysis
Transverse 10-µm cryosections were obtained from the mid-belly of plantaris and soleus muscles from DRBB and DPBB rats using a cryostat set to −18°C (Leica CM1860, code # 14049146884, Leica Biosystems, Buffalo Grove, Illinois, USA) as previously described. 7 Capillaries were visualized after a brief fixation of cryosections in cold acetone followed by incubation with 5-bromo-4-chloro-3-indolyl phosphate/nitro blue tetrazolium (FAST BCIP/NBT; cat. no. B5655-25TAB; Sigma-Aldrich, Oakville, ON, Canada) for 45 min at 37°C to stain for alkaline phosphatase activity. Microscope slides were mounted with VectaMount (cat. no. H-5501; Vector Laboratories Inc., Burlingame, CA, USA). Images were acquired on an Arcturus PixCell II inverted microscope (serial no. 0573; Arcturus Engineering, Mountain View, CA, USA) at ×10 magnification and captured using QCapture software. For each muscle, the capillary-to-fibre ratio (C/F ratio) was determined after counting capillaries and myofibres in six independent images of a muscle cross section. Because the plantaris muscle is not homogeneous in its fibre-type composition, counting areas were chosen so they cover the entire muscle cross section. C/F ratio is calculated by dividing the number of capillaries in each image by the number of myofibres.
Western blotting
Immunoblotting was carried out on protein extracts from the plantaris and soleus muscles obtained from DRBB and DPBB rats as previously described.7,8 Protein concentrations for each sample were determined by the bicinchoninic acid assay, and denatured samples (30 µg/sample) were subjected to SDS-PAGE (sodium dodecyl sulphate polyacrylamide gel electrophoresis) and blotted onto nitrocellulose membranes (Whatman, BA95; Sigma-Aldrich). Quality of the transfer was confirmed by Ponceau S red staining. After blocking with 5% fat-free milk at room temperature for 45 min, the blots were probed overnight at 4°C with the following primary antibodies: antibody against Mdm2 was a non-commercial supernatant from the hybridoma (clone 2A10, previously described in the work Chen et al. 23 ); antibody against forkhead box O1 (FoxO1) was from Cell Signaling Technology (clone C29H4, #2880; Beverly, MA, USA); antibody against TSP-1 was from Invitrogen (clone A6.1, #MA5-13398; Burlington, ON, Canada); antibody against VEGF-A was from Millipore (clone VG1, #05-1117; Etobicoke, ON, Canada); antibodies against β-actin (#sc-47778) and vascular endothelial growth factor receptor-2 (VEGFR2; clone D-8, #sc-393163) were from Santa Cruz Biotechnology (Santa Cruz, CA, USA). After incubation with secondary antibodies horseradish peroxidase (HRP)-linked anti-mouse (#P0260; Dako, Carpinteria, CA, USA) or HRP-linked anti-rabbit antibody (#7074; Cell Signaling Technology), proteins were visualized with enhanced chemiluminescence (Millipore) on X-ray film (CL-XPosure Film, #34090; Thermo Scientific, Rockford, IL, USA). Blots were analysed with Carestream Software.
Statistical analysis
Statistical analyses were performed using Prism5 software (GraphPad, San Diego, CA, USA). Unpaired, two-tailed t tests were performed for blood glucose, C/F ratio and all western blot analyses. Correlation analyses between variables were performed with nonparametric two-tailed Pearson correlation with determination of Pearson r and r2. The p value of ⩽0.05 was considered to be statistically significant.
Results
T1D leads to hyperglycaemia and skeletal muscle capillary regression
As expected, DPBB rats spontaneously develop T1D, reflected by significantly higher blood glucose levels (+263%) measured at the time of muscle collection compared to DRBB animals (Figure 1(a); 6.51 ± 0.18 mmol/L in DRBB rats vs 23.64 ± 1.39 mmol/L in DPBB rats; p ⩽ 0.001). T1D leads to capillary regression in both plantaris (−15%) and soleus (−21%) muscles of DPBB rats as evidenced by measuring the C/F ratio (Figure 1(b); plantaris: 1.69 ± 0.038 in DRBB vs 1.43 ± 0.049 in DPBB; soleus: 1.92 ± 0.041 in DRBB vs 1.52 ± 0.063 in DPBB; p ⩽ 0.001). The level of skeletal muscle capillarization had a significant inverse correlation with blood glucose levels in both muscles analysed (Figure 1(c); r = −0.327, p < 0.05 in plantaris; r = −0.479, p < 0.01 in soleus), suggesting that hyperglycaemia is a strong predictor of capillary regression.
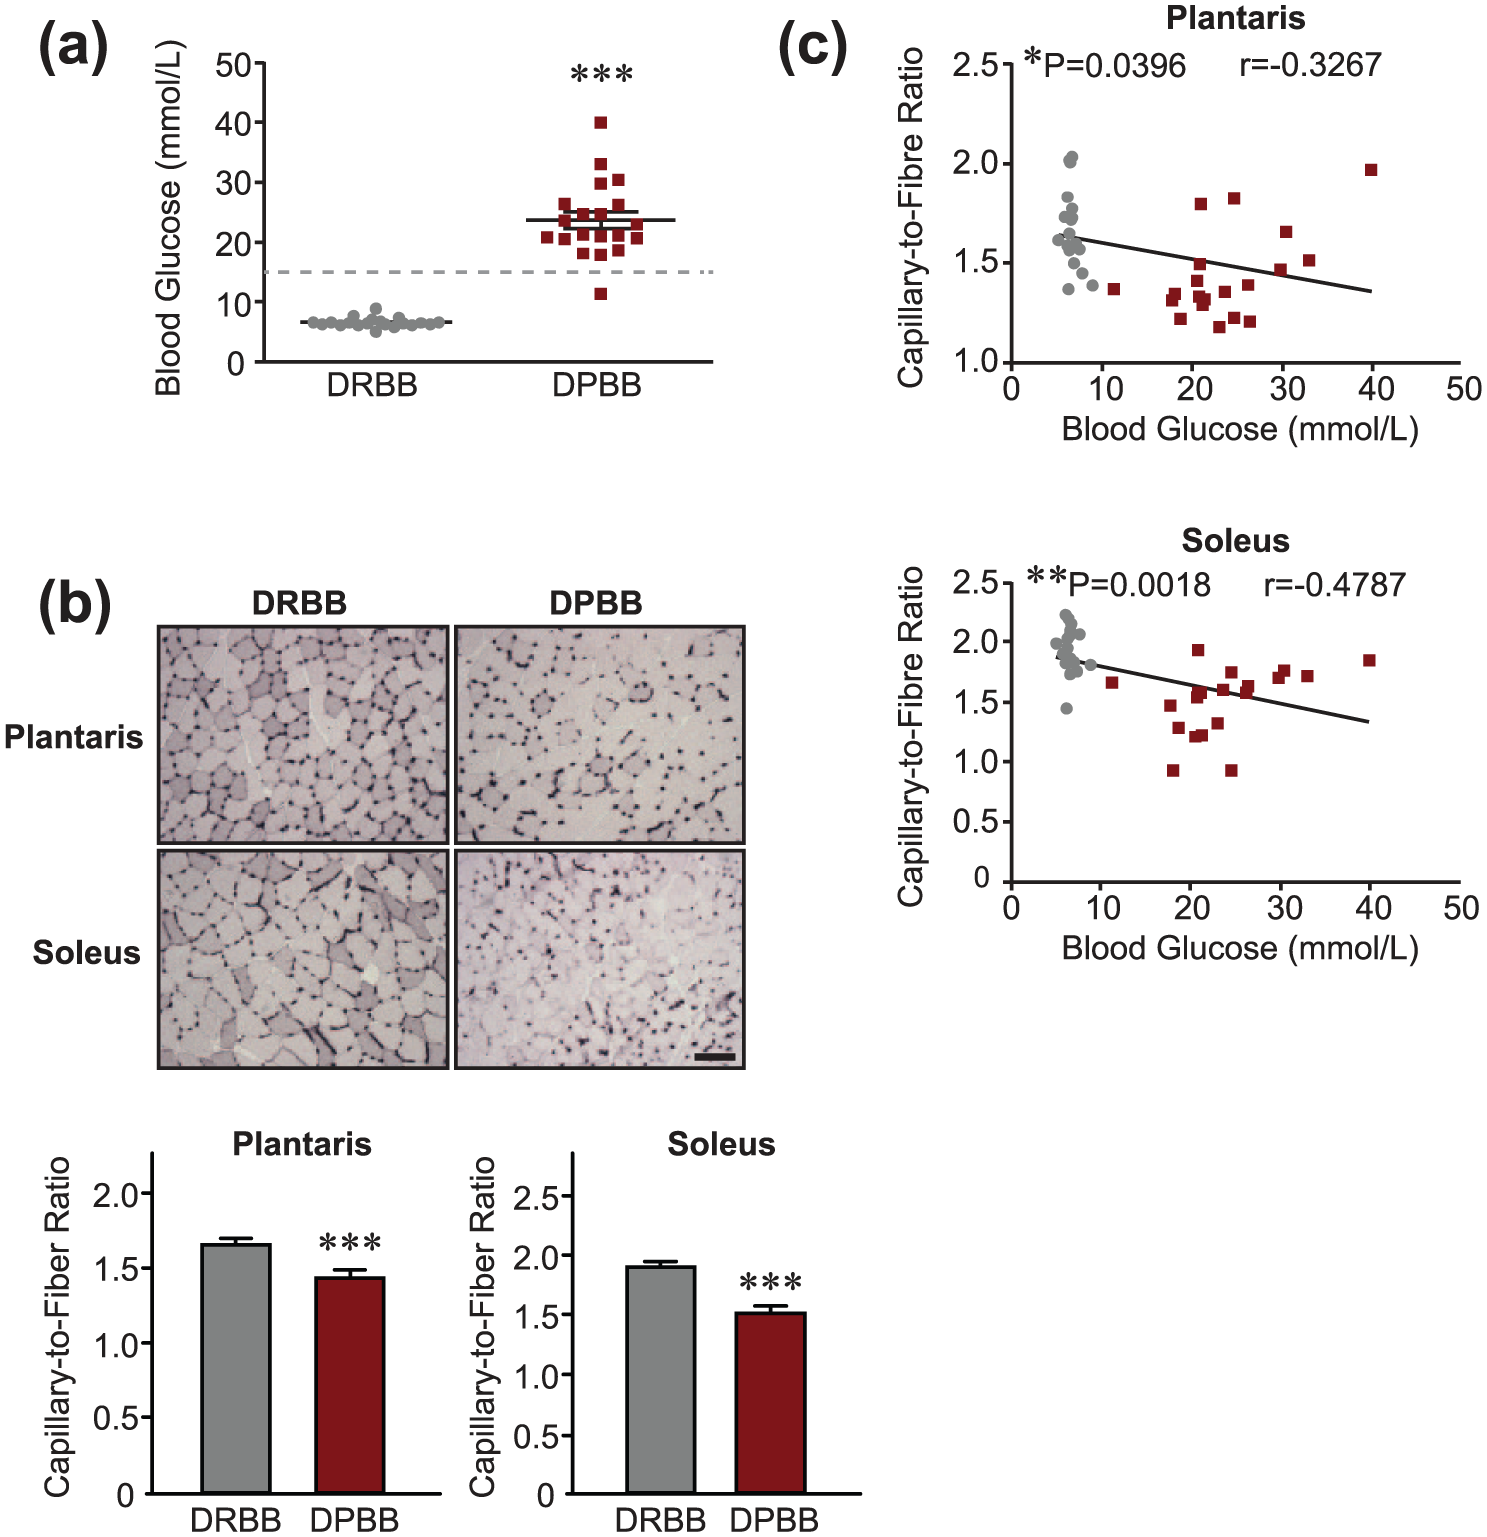
Type 1 diabetes in BB diabetes-prone rats results in hyperglycaemia and decreased skeletal muscle capillarization. (a) Blood glucose levels (mmol/L) in DRBB and DPBB rats (n = 21 DRBB rats and n = 20 DPBB rats). The dashed line corresponding to 15 mM blood glucose depicts the threshold where animals were considered diabetic. (b) Top: capillary staining in skeletal muscle cross sections from DRBB and DPBB rat plantaris and soleus muscles (scale bar = 100 µm; ×10 view). Bottom: determination of the C/F ratio. Data are represented as mean ± SEM (n = 21 DRBB rats and n = 20 DPBB rats). Unpaired two-tailed t tests indicate ***p ⩽ 0.001 vs DRBB rats. (c) Correlation analysis between blood glucose and C/F ratio in the animals used in (a) and (b) (n = 20 matched data points for each group and each muscle). Grey circles and maroon squares represent data points for DRBB and DPBB rats, respectively.
T1D results in lowered Mdm2 and increased anti-angiogenic FoxO1 and TSP-1 protein levels in skeletal muscle
As DPBB rats displayed a significant reduction in the number of skeletal muscle capillaries, with the severity of impairment related at least in part to the level of glucose control, we next aimed to determine which key angio-regulatory factors could be involved in the observed regression of capillaries. Diabetic DPBB rats had a significantly reduced expression of Mdm2 protein in both the plantaris (−19%) and soleus (−15%) muscles (Figure 2(a); plantaris: 0.77 ± 0.05 arbitrary units in DRBB rats vs 0.62 ± 0.04 arbitrary units in DPBB rats; soleus: 0.74 ± 0.04 arbitrary units in DRBB rats vs 0.63 ± 0.02 arbitrary units in DPBB rats; p < 0.05). Alongside decreased levels of Mdm2 protein in diabetic muscles, DPBB rats had ~80% more FoxO1 protein in the plantaris muscle compared to controls (Figure 2(b); 1.07 ± 0.09 in DRBB rats vs 1.92 ± 0.3 arbitrary units in DPBB rats; p < 0.05). Although not statistically significant, diabetic animals also tended to express more (~20%) FoxO1 protein in the soleus compared to control animals (Figure 2(b); 1.12 ± 0.06 in DRBB rats vs 1.31 ± 0.09 arbitrary units in DPBB rats; p = 0.075). Concomitant with the decrease in Mdm2 and the increase in FoxO1 expression, TSP-1 protein expression was drastically higher in skeletal muscles from diabetic DPBB rats compared to control rats (+172% and +67% in plantaris and soleus muscles, respectively) (Figure 2(c); plantaris: 0.32 ± 0.04 arbitrary units in DRBB rats vs 0.88 ± 0.1 arbitrary units in DPBB rats, p < 0.01; soleus: 0.91 ± 0.15 arbitrary units in DRBB rats vs 1.51 ± 0.13 arbitrary units in DPBB rats, p < 0.001).
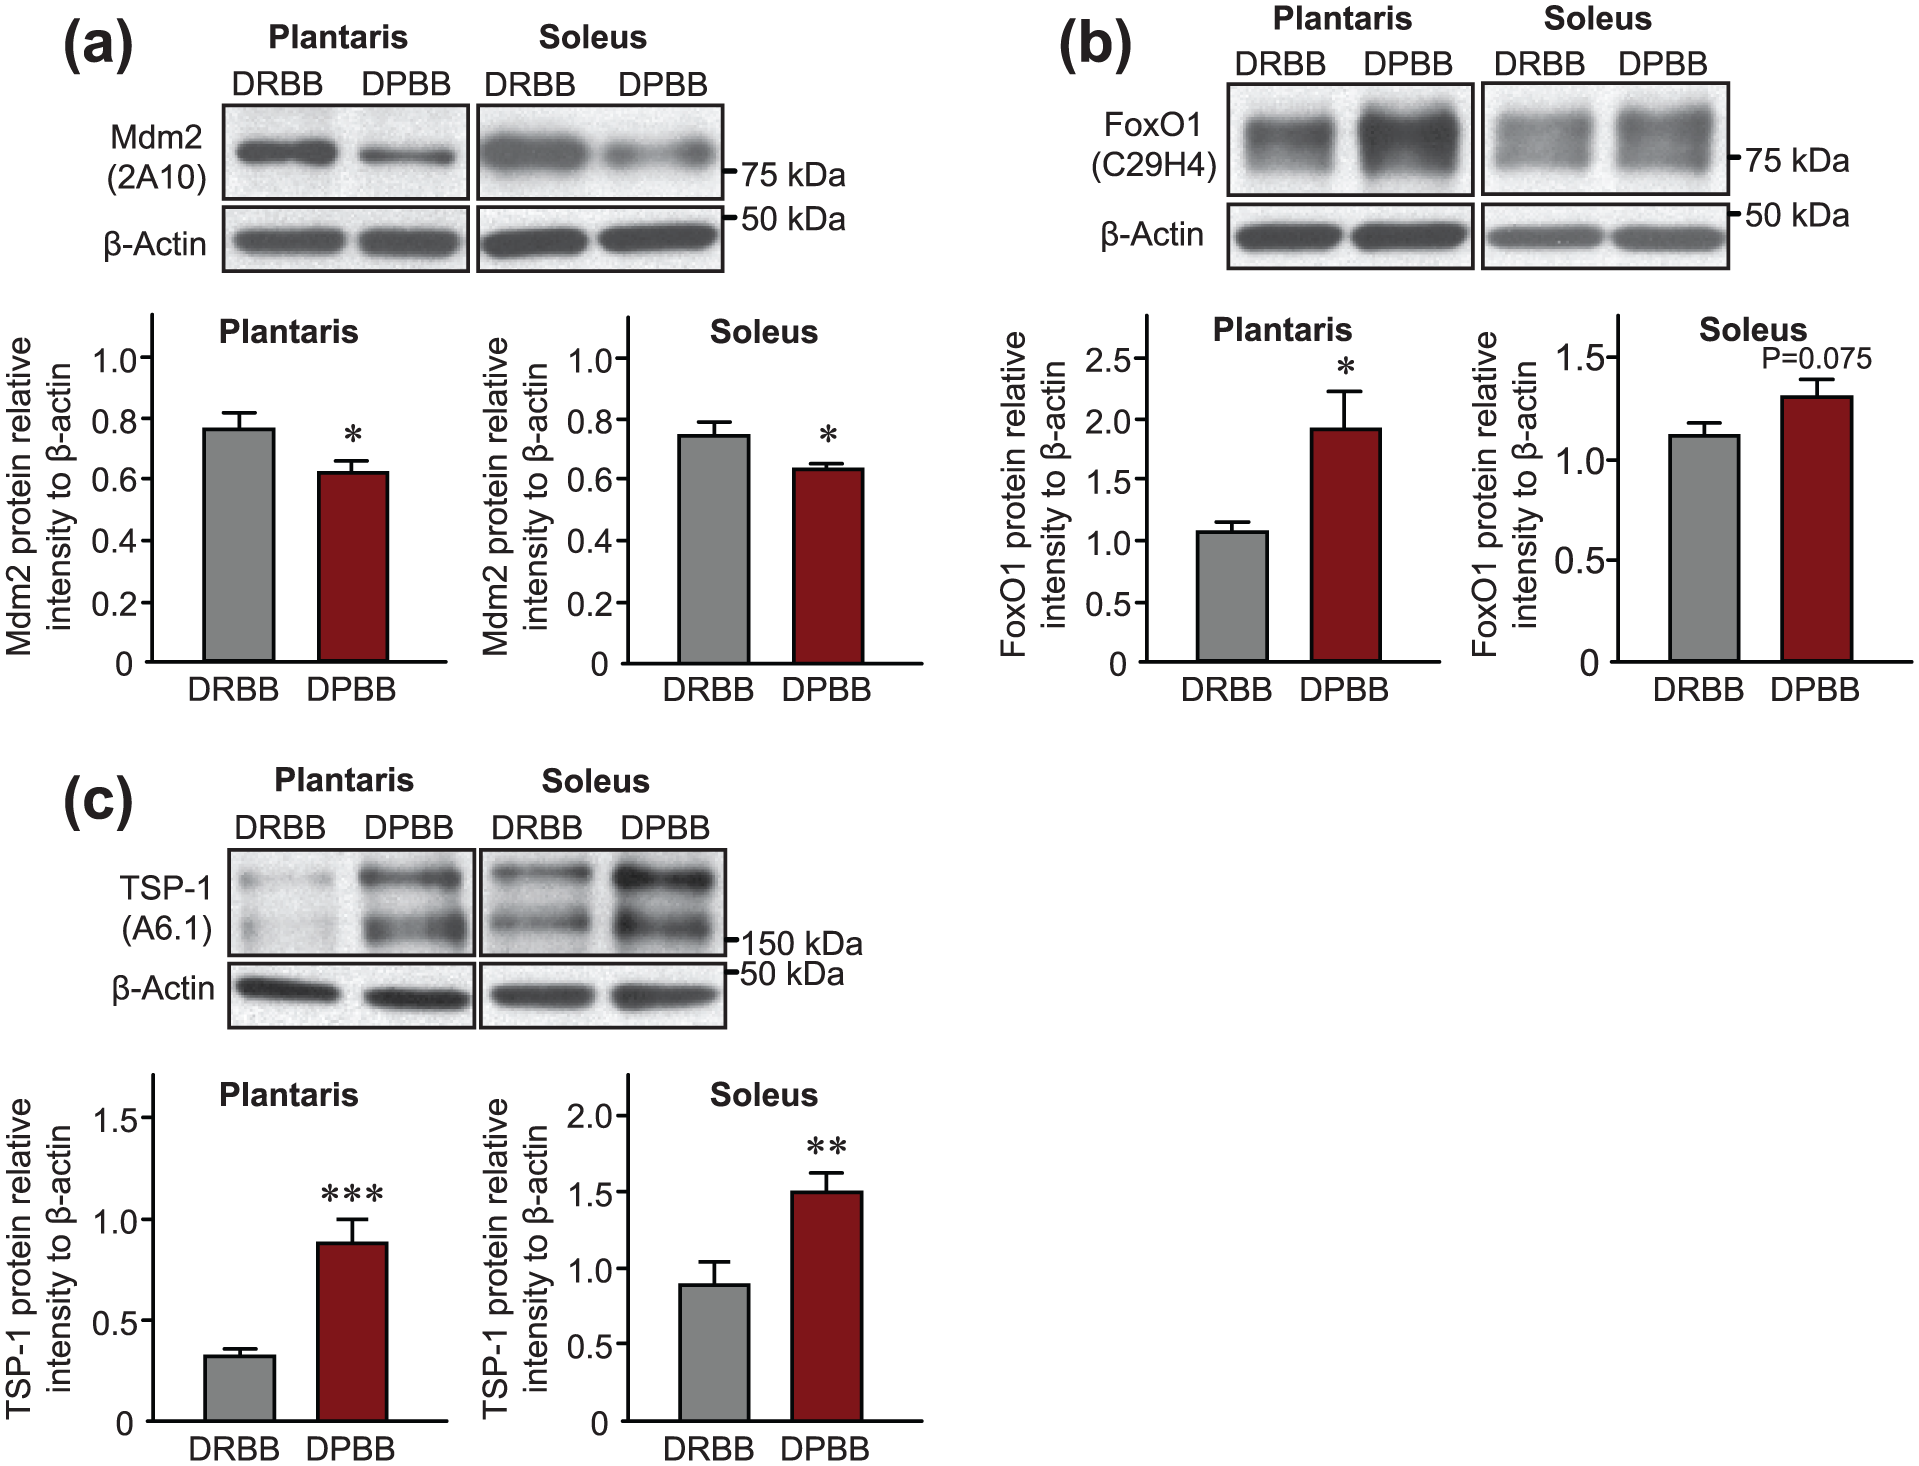
Type 1 diabetes alters protein expression levels of Mdm2, FoxO1 and TSP-1 in rat skeletal muscles. Representative immunoblots and densitometry analyses of protein expression are shown for (a) Mdm2, (b) FoxO1 and (c) TSP-1 in plantaris and soleus muscles from DPBB and DRBB rats. β-actin was used as a loading control. Data are represented as mean ± SEM (n = 22 DRBB rats and n = 20 DPBB rats). Unpaired two-tailed t tests indicate ***p ⩽ 0.001; **p ⩽ 0.01 and *p ⩽ 0.05 vs DRBB rats.
Hyperglycaemia is correlated with decreases in Mdm2 and elevations in TSP-1 protein expression
Correlation analyses were performed between blood glucose level, Mdm2 and TSP-1 protein expression in plantaris and soleus muscles from DPBB and DRBB rats. Interestingly, in the plantaris muscle, blood glucose levels were inversely correlated with Mdm2 protein expression (Figure 3(a); r = −0.312, p < 0.05). A similar finding was observed in the soleus muscle, although this relationship was on the boarder of statistical significance (Figure 3(a); r = −0.303, p = 0.054). In both the soleus and plantaris muscles, blood glucose was found to be positively correlated with TSP-1 protein levels (Figure 3(b); r = 0.557, p < 0.001 in plantaris; r = 0.481, p < 0.01 in soleus). Furthermore, in both muscles, Mdm2 and TSP-1 protein expressions were significantly, and inversely, correlated (Figure 3(c); r = −0.335, p < 0.05 in plantaris; r = −0.424, p < 0.01 in soleus).
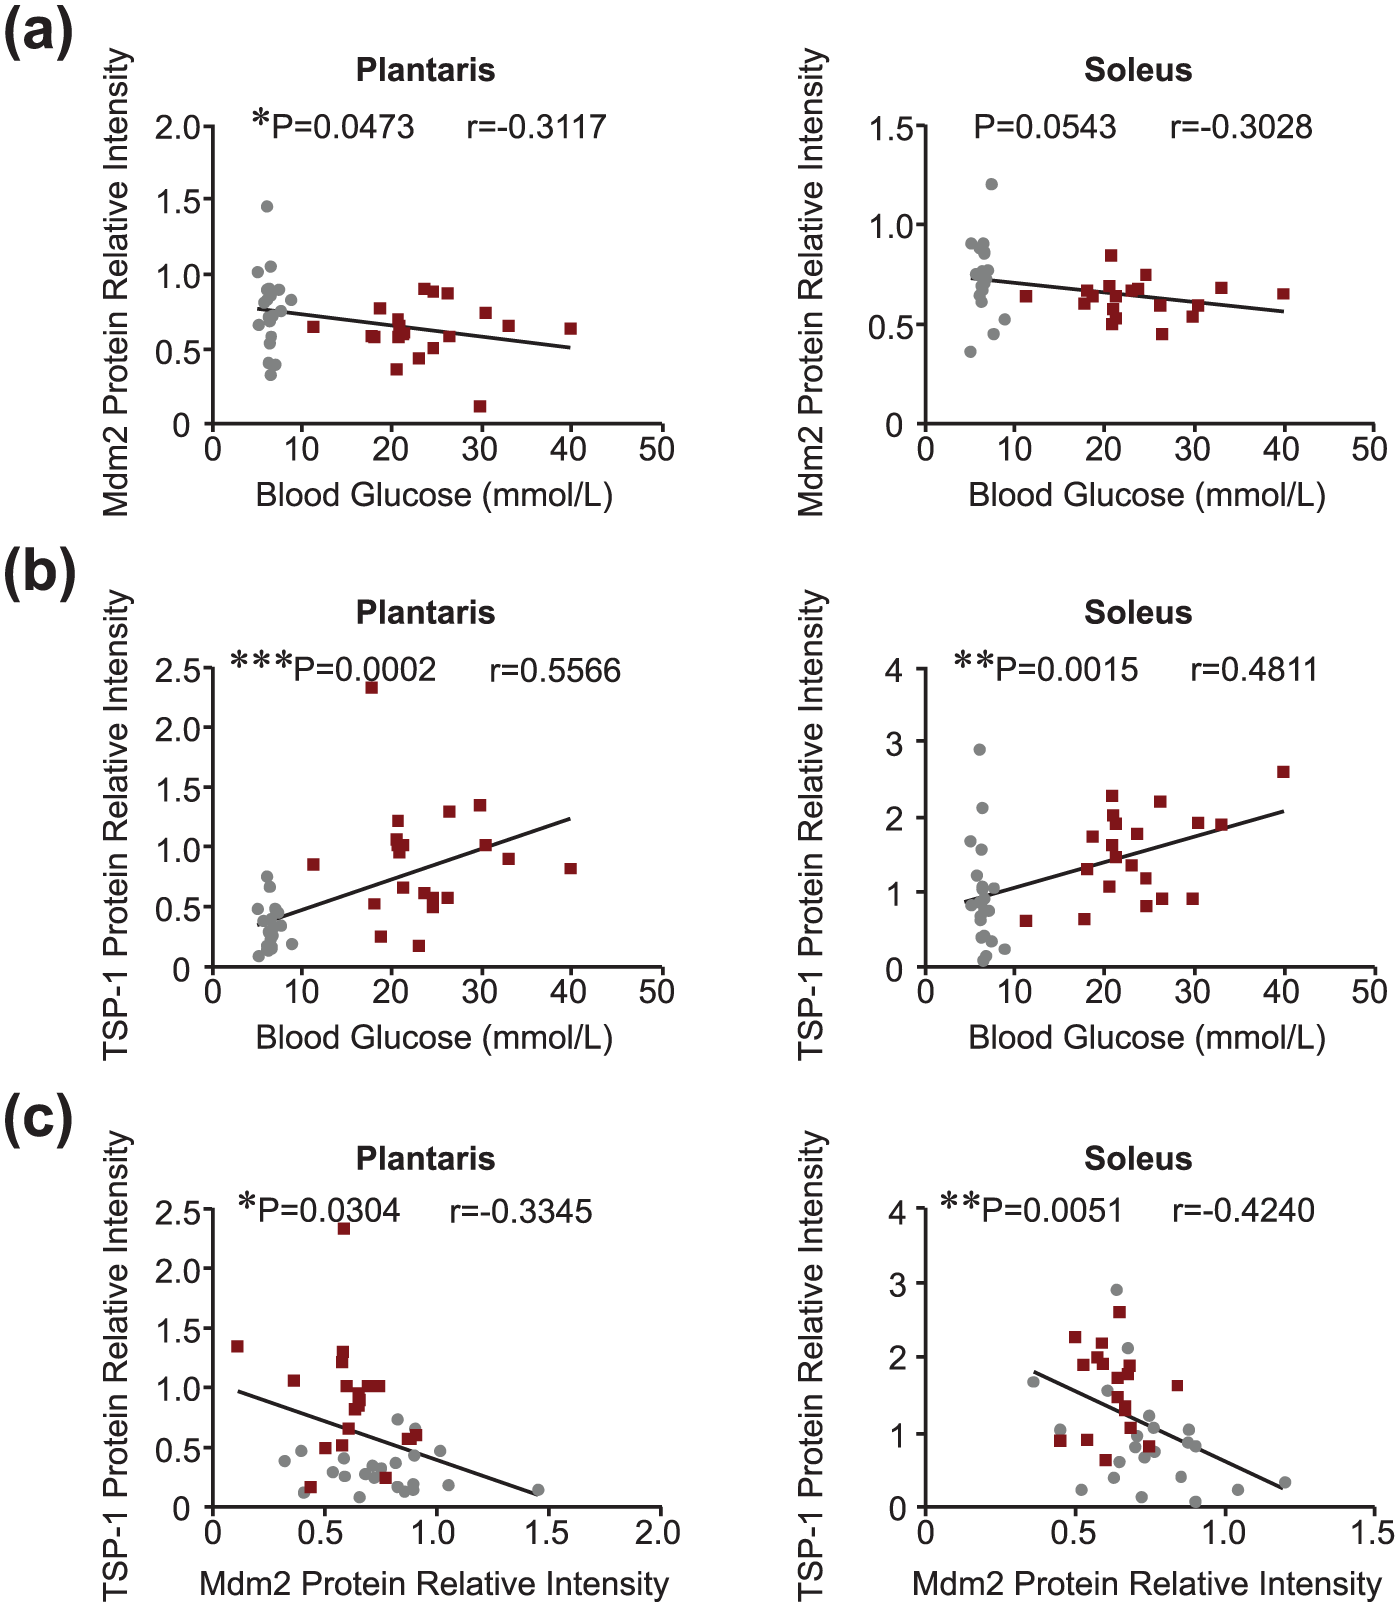
Blood glucose levels are strongly correlated with Mdm2 and TSP-1 protein expression in skeletal muscle. Correlation analysis between (a) blood glucose and Mdm2 protein, (b) blood glucose and TSP-1 protein and (c) Mdm2 and TSP-1 skeletal muscle protein levels in the plantaris and soleus muscles of BB rats, respectively (n = 21–22 matched data points per muscle in DRBB rats; n = 20 matched data points per muscle in DPBB rats). Grey circles and maroon squares represent data points for DRBB and DPBB rats, respectively.
The VEGF-A/TSP-1 ratio is drastically reduced in skeletal muscles of T1D animals
Interestingly, DPBB rats show no change (soleus) or even an increase (plantaris) in VEGF-A protein expression level compared to non-diabetic animals (Figure 4(a); plantaris: +29.7%, 0.37 ± 0.02 arbitrary units in DRBB rats vs 0.48 ± 0.04 arbitrary units in DPBB rats, p < 0.05; soleus: 1.14 ± 0.04 vs 1.12 ± 0.04 arbitrary units in DRBB and DPBB rats, respectively, p = 0.68). We have previously described that the VEGF-A/TSP-1 ratio is a good indicator of the angio-adaptive balance in rodent and human skeletal muscles.6,7,9,24 Here, and despite either no alteration (soleus) or even an increase (plantaris) in VEGF-A protein expression, the VEGF-A/TSP-1 ratio was strongly reduced in the plantaris (−52%) and soleus (−71%) muscles of T1D rats compared to non-diabetic animals (Figure 4(b); plantaris: 1.52 ± 0.2 arbitrary units in DRBB rats vs 0.74 ± 0.15 arbitrary units in DPBB rats, p < 0.01; soleus: 2.92 ± 0.9 arbitrary units in DRBB rats vs 0.87 ± 0.09 arbitrary units in DPBB rats, p < 0.05).
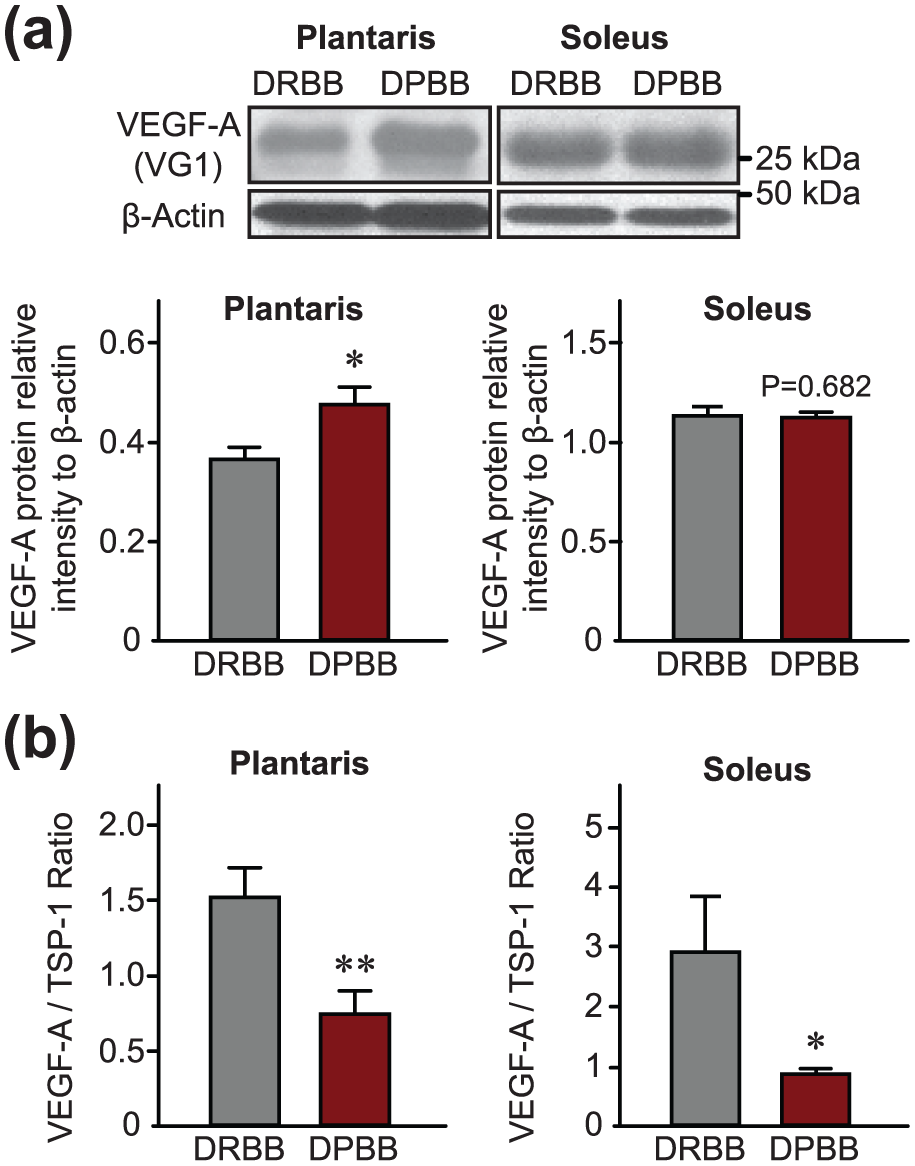
The ratio between TSP-1 and VEGF-A protein levels, and not VEGF-A alone, is a strong reflection of capillary regression in skeletal muscles from diabetic animals. (a) Representative immunoblots and densitometry analyses of VEGF-A protein expression (n = 22 DRBB rats and n = 20 DPBB rats) and (b) the ratio of VEGF-A/TSP-1 protein expression in plantaris and soleus muscles from DRBB and DPBB rats, respectively (n = 22 DRBB rats and n = 20 DPBB rats). β-actin was used as a loading control. Data are represented as mean ± SEM. Unpaired two-tailed t tests indicate **p ⩽ 0.01 and *p ⩽ 0.05 versus resistant rats.
VEGF receptor-2 protein levels are decreased in T1D muscle
In the soleus, a significant decrease (−32%) in VEGFR2 protein level was observed in DPBB rats compared to DRBB controls (Figure 5(a); 0.35 ± 0.03 arbitrary units in DRBB rats vs 0.24 ± 0.02 arbitrary units in DPBB rats, p < 0.01). Although not statistically significant, VEGFR2 protein expression was also reduced by ~30% in the plantaris of diabetic animals (Figure 5(a); 0.16 ± 0.02 arbitrary units in DRBB rats vs 0.11 ± 0.01 arbitrary units in DPBB rats, p = 0.06). Interestingly, a significant and inverse correlation was found between VEGFR2 protein and blood glucose levels in the soleus (Figure 5(b); r = −0.427, p < 0.01), while a near-significant correlation was observed in the plantaris (Figure 5(b); r = −0.307, p = 0.051).
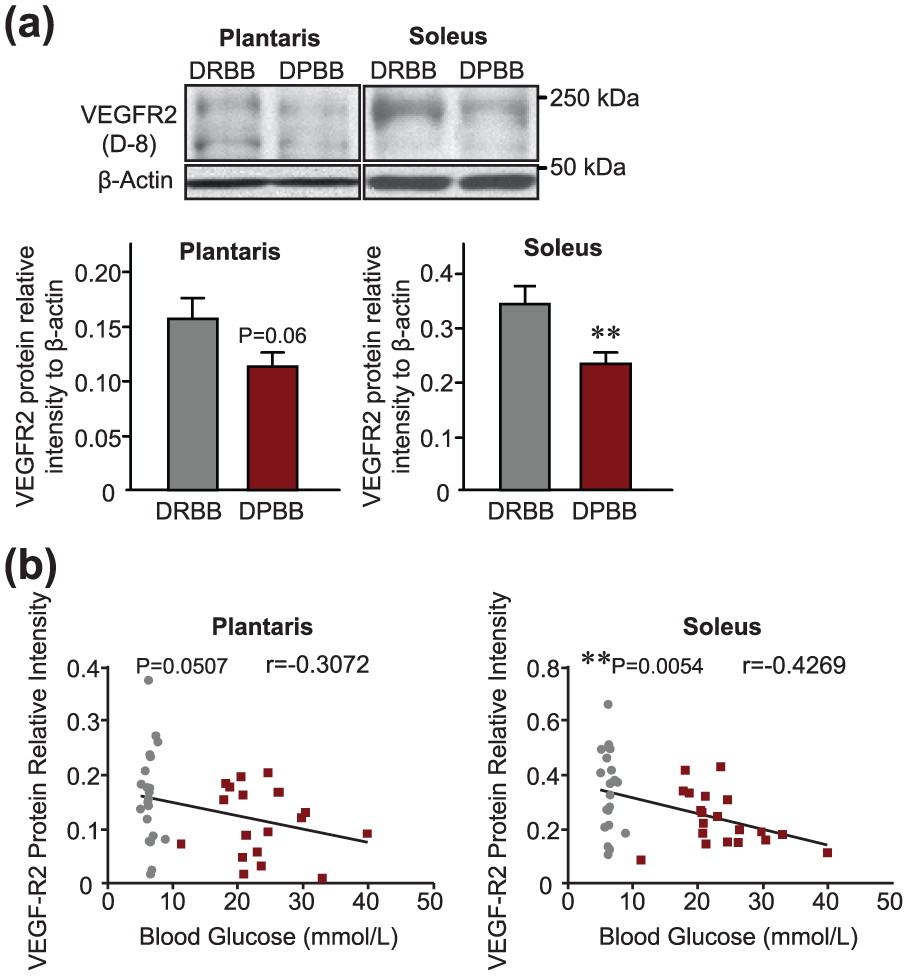
VEGF receptor-2 protein expression is decreased in skeletal muscles of type 1 diabetic animals and is inversely correlated with blood glucose levels. (a) Representative immunoblots and densitometry analyses of VEGF receptor-2 (VEGFR2) protein expression in plantaris and soleus muscles from DRBB and DPBB rats (n = 22 DRBB rats and n = 20 DPBB rats). β-actin was used as a loading control. Data are represented as mean ± SEM. Unpaired two-tailed t tests indicate **p ⩽ 0.01 versus resistant rats. (b) Correlation analysis between blood glucose and VEGFR2 protein expression in the plantaris and soleus muscles of BB rats, respectively (n = 21 matched data points per muscle in DRBB rats; n = 20 matched data points per muscle in DPBB rats). Grey circles and maroon squares represent data points for DRBB and DPBB rats, respectively.
Discussion
It is well-documented that T1D leads to an array of microvascular-related pathologies including retinopathy, neuropathy and nephropathy. 25 However, very little research exists examining the molecular actors regulating skeletal muscle microvasculature in T1D. Those limited existing studies were based on STZ injection as a means to induce diabetes in rodent models. STZ can not only lead to destruction of pancreatic β cells and subsequent hyperglycaemia but also can promote direct damage to other organs and tissues including skeletal muscle. 26 Alternatively, BB rats represent a chronic condition with the onset of diabetes occurring pathophysiologically as a result of autoimmune-mediated destruction of pancreatic β cells, similar to the disease progression in humans. In our study, we showed for the first time using BB rats that poor blood glucose control is associated with capillary regression and alterations in key angio-regulatory molecules in skeletal muscle. As summarized in Figure 6, we propose that dysglycaemia (approximately twofold to threefold higher value than normal despite exogenous insulin therapy) led to capillary regression likely as a result of decreased Mdm2 and VEGFR2 levels and elevated FoxO1 and TSP-1. Alterations in Mdm2 expression and the VEGF-A/TSP-1 ratio were very similar between the soleus and plantaris muscles, with the ratio reflecting a shift of the angio-adaptive balance towards an anti-angiogenic environment in T1D muscle.
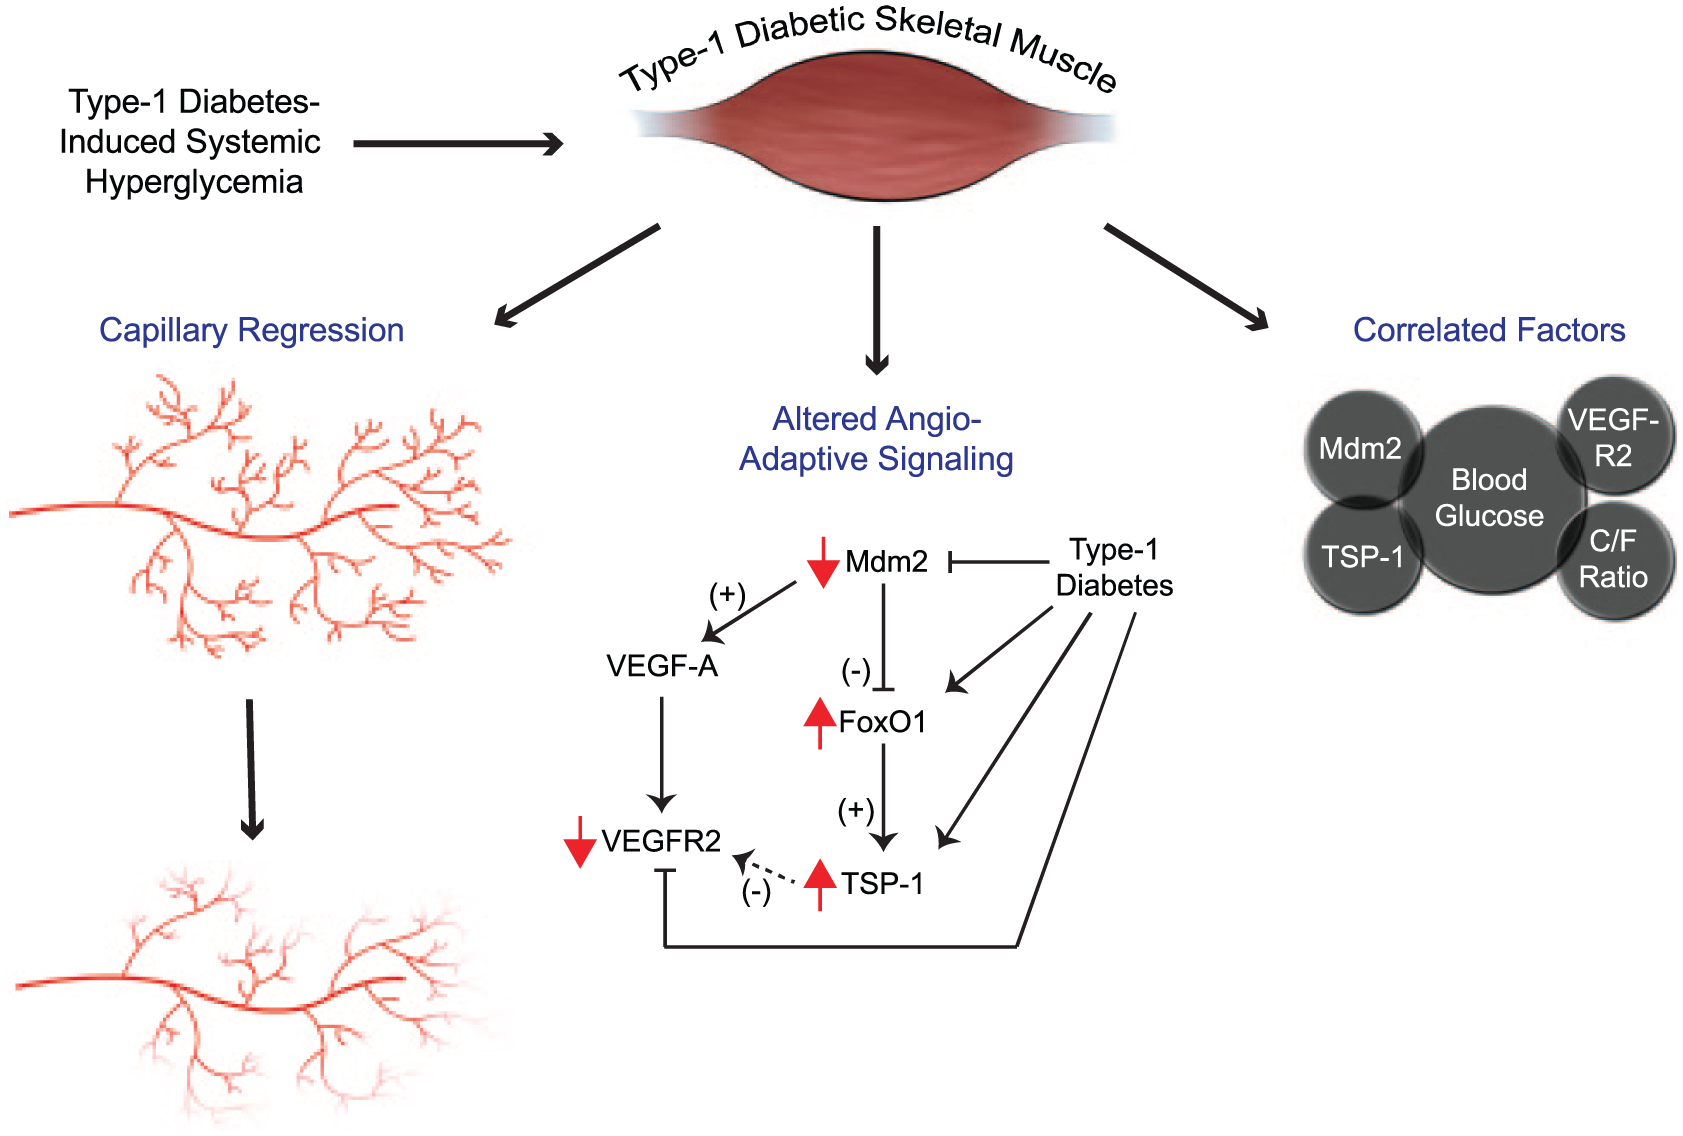
The BB rat model of type 1 diabetes results in hyperglycaemia, skeletal muscle capillary regression and altered angio-adaptive signalling. Type 1 diabetes in BB diabetes-prone rats results in significant elevation of blood glucose levels. This chronic hyperglycaemic state induces angio-adaptive alterations observable at the tissue level such as capillary regression (C/F ratio) as well as at the molecular level with changes in the angio-adaptive signalling. Mdm2 serves as a negative regulator of FoxO1; therefore, in the diabetic state, a downregulation of Mdm2 could lead to elevated FoxO1 and its transcriptional target TSP-1, a critical anti-angiogenic factor in skeletal muscle tissue. VEGF-A, however, is not lowered in the skeletal muscle of diabetic animals, whereas the expression of its receptor, VEGFR2, is significantly reduced. Interestingly, several significant correlations were found between some of these parameters (blood glucose level, capillaries, molecular markers) measured individually.
Our laboratory has recently identified Mdm2 as essential for the maintenance and plasticity of skeletal muscle microvasculature. In transgenic mice expressing about 60% less Mdm2 compared to their wild-type littermates, Mdm2 reduction resulted in a 20% lower skeletal muscle capillarization. 7 We also showed that Mdm2 was strongly associated with the level of skeletal muscle capillarization and endothelial markers in both rodents and humans.7,8 Mdm2 can be considered a ‘master regulator’ of the angio-adaptive balance affecting both pro- and anti-angiogenic factors (i.e. VEGF-A and TSP-1). VEGF-A is the most widely studied pro-angiogenic factor, promoting endothelial cell survival, proliferation and migration.9,27–29 It has been suggested that Mdm2 could stabilize hypoxia-inducible factor-1α (HIF-1α), a transcription factor for VEGF-A, thereby promoting VEGF-A expression.30–33 Apart from the HIF-1α/VEGF-A pathway, we have recently demonstrated that Mdm2 can directly bind to and negatively regulate the activity of the transcription factor FoxO1 and thus the expression of its downstream target TSP-1, a potent anti-angiogenic factor in skeletal muscle.7,9,34,35 Interestingly, it has also been evidenced that overexpression of FoxO1 in endothelial cells led to a decrease in VEGF-A messenger RNA (mRNA) levels suggesting that FoxO1 could regulate not only TSP-1 but rather both sides of angio-adaptive balance. 36
We have previously reported that Mdm2 protein expression was altered in skeletal muscle from Zucker diabetic fatty (ZDF) rats, a common model of obesity and type 2 diabetes. In ZDF plantaris muscles, Mdm2 was significantly lowered and a concomitant increase in FoxO1 protein levels was observed. 7 More recently, we reported a significant decrease in Mdm2 protein levels in both the tibialis anterior and soleus muscles of STZ-treated T1D rats. 3 In this study, we observed a decreased Mdm2 protein level in both soleus and plantaris muscles of DPBB rats. Taken together, our laboratory has investigated three separate models of diabetes (including both type 1 and type 2) in which skeletal muscle capillary regression has occurred. In each model, a significant reduction in Mdm2 protein levels was detected. The observed reductions in Mdm2 could potentially explain the loss of capillaries in T1D animals through Mdm2-dependent regulation of VEGF-A, FoxO1 and TSP-1.
A previous study from Kivelä et al. 2 demonstrated that T1D induction by STZ injection significantly decreased mRNA and protein levels of VEGF-A and mRNA levels of VEGFR2 in the mouse calf muscle complex. Similar to their findings, we show here reductions in VEGFR2 protein expression in diabetic muscles. However, in our study, VEGF-A protein levels remained either unchanged (soleus) or even elevated (plantaris) in DPBB rats. Kivelä et al. 2 also show that TSP-1 mRNA was significantly higher in diabetic mice compared to healthy controls, yet did not measure TSP-1 at the protein level. Here, we show that T1D leads to significant elevations in both FoxO1 and TSP-1, and that Mdm2 and TSP-1 protein expressions (the respective start and end point of the Mdm2–FoxO1–TSP-1 signalling axis) were significantly and inversely correlated. We have recently established that the VEGF-A to TSP-1 ratio is a good indication of the overall angiogenic environment.6,7,9,24 In both muscles, this ratio was decreased regardless of VEGF-A protein levels, reflecting an anti-angiogenic microenvironment in the skeletal muscle tissue essentially driven by the elevated TSP-1. In addition, previous studies demonstrated that TSP-1 can negatively regulate VEGFR2 through inhibition of VEGF-A–dependent VEGFR2 phosphorylation and activation in microvascular endothelial cells.37,38 Thus, an intriguing hypothesis could be made that the observed elevations in TSP-1 might inhibit VEGFR2 sensitivity to VEGF-A in diabetic muscles, concomitantly with an already diminished VEGFR2 protein abundance. Further investigation would be needed to elucidate this potentially novel regulatory relationship in T1D.
Our findings that some capillary regression occurred in T1D rats despite unchanged or increased VEGF-A expression levels is not surprising. Using hindlimb unloading as a well-established rodent model for muscle atrophy, we demonstrated that plantaris and soleus muscles, despite similar levels of myofibre atrophy, present very distinct angio-adaptive responses. 24 In the plantaris, where capillarization was maintained, VEGF-A levels were found to be increased. In contrast, capillary regression occurred in the soleus muscle despite no decrease in VEGF-A but concomitantly to a strong increase in TSP-1 and reduction in VEGFR2. Taken together, it appears that anti-angiogenic factors (i.e. TSP-1) are equally important, if not more influential, than their pro-angiogenic counterparts in regulating skeletal muscle angio-adaptation to physiological as well as pathological conditions such as type 1 and type 2 diabetes.
Here, we identified a novel relationship whereby the magnitude of capillary regression in skeletal muscle may be predicted by the level of glycaemic control in T1D. This relationship between muscle capillarization and blood glucose level is of importance since reduced capillarization may exacerbate poor glycaemic regulation in patients with diabetes. The loss of capillaries in response to diabetic dysglycaemia may be preceded by pathological alterations in angio-regulatory factors that are sensitive to glucose control. We have previously demonstrated that Mdm2 is at the fork between pro-angiogenic VEGF-A and anti-angiogenic TSP-1 signals. Our present results suggest that Mdm2–FoxO1–TSP-1 signalling may represent a strong molecular determinant of this pathological adaptation of capillary regression in T1D skeletal muscle. Our findings provide merit for future studies investigating the Mdm2 signalling axis as related to capillary regulation in the skeletal muscle of humans living with type 1 diabetes.
TID results in significant capillary regression in both the soleus and plantaris muscles of BioBreeding diabetic rats.
This capillary impairment was significantly correlated with blood glucose levels.
Mdm2 protein was found to be decreased in diabetic muscles, corresponding with increased FoxO1 and TSP-1 protein levels.
Despite no change or even elevated VEGF-A protein, the VEGF-A/TSP-1 ratio and VEGFR2 protein levels were significantly less in the diabetic animals.
Significant correlations were observed between changes in blood glucose and Mdm2, TSP-1, VEGFR2 and the capillary-to-fibre ratio.
Footnotes
Declaration of conflicting interests
The author(s) declared no potential conflicts of interest with respect to the research, authorship and/or publication of this article.
Funding
The author(s) disclosed receipt of the following financial support for the research, authorship, and/or publication of this article: The author(s) disclosed receipt of the following financial support for the research, authorship, and/or publication of this article: This work was supported by Natural Sciences and Engineering Research Council of Canada grants to O.B. (RGPIN-2017-05675) and M.C.R. (#261306).