
Abstract
Background:
Previous studies have indicated an association between interleukin-18 and glucose. Interleukin-18 becomes active when cleaved by caspase-1, activated by the NLR family pyrin domain containing-3 inflammasome.
Aim:
To investigate associations between glucometabolic variables and serum levels of interleukin-18 and genetic expression of interleukin-18, caspase-1 and NLR family pyrin domain containing-3 in adipose tissue and circulating leukocytes, and whether these mediators are related to the amount of abdominal adipose tissue .
Materials and Methods:
Fasting blood samples and subcutaneous adipose tissue were collected in a cohort of 103 middle-aged men. Serum levels of interleukin-18 were determined by enzyme-linked immunosorbent assay, gene expression by real-time polymerase chain reaction and insulin sensitivity by glucose clamp. The distribution of abdominal adipose tissue, separated into superficial- and deep subcutaneous, and visceral adipose tissue, was assessed by computed tomography scan.
Results:
Glucometabolic variables correlated significantly to serum levels of interleukin-18, and to the expression of interleukin-18 and NLR family pyrin domain containing-3 in subcutaneous adipose tissue (p < 0.05). Significant correlations were further observed between the amount of fat in the different compartments of abdominal adipose tissue and both serum levels of interleukin-18 and genetic expression of interleukin-18 and NLR family pyrin domain containing-3 in adipose tissue.
Conclusion:
The results implicate that the glucometabolic state is of importance for the inflammasome-related inflammation expressed both circulatory and genetically in subcutaneous adipose tissue, the latter highly reflected in the amount of abdominal adipose tissue.
Keywords
Introduction
Insulin resistance plays a key role in the development of type 2 diabetes mellitus (T2DM). 1 Studies have shown insulin resistance to be detectable and predictable years before the T2DM diagnosis, especially in first-degree relatives. 2 Chronic low-grade inflammation is observed as a denominator between insulin resistance and T2DM, and also obesity. 3 The adipose tissue (AT) is now established as an active endocrine organ that secretes immune-modulating proteins, adipokines, important in a variety of biological processes including insulin secretion. 3 The AT is mainly composed of adipocytes, but also monocytes, macrophages, T-cells, fibroblasts and vascular cells are present. 4 With overweight, expansion of the AT and increased recruitment of pro-inflammatory T-cells and M1 macrophages occur at the expense of anti-inflammatory M2 macrophages, 5 and experimental studies have shown pro-inflammatory mediators from the AT to be linked to the development of insulin resistance.6,7 AT is distributed throughout the whole body, whereof the abdominal AT has especially been associated with insulin resistance and cardiovascular disease.8,9 The abdominal AT can be divided into visceral adipose tissue (VAT) and subcutaneous adipose tissue (SAT). The latter can further be separated by the Scarpa’s fascia into superficial subcutaneous adipose tissue (sSAT) and deep subcutaneous adipose tissue (dSAT). VAT and dSAT have been reported to have similar and more pro-inflammatory profile than sSAT and have further been associated with insulin resistance and atherosclerosis.9–11
Interleukin (IL)-18 is among the pro-inflammatory cytokines that have been associated with insulin resistance, hyperglycaemia, T2DM and obesity.12–14 IL-18 is a member of the IL-1 family of cytokines and is expressed as an inactive precursor which becomes biologically active when cleaved by caspase-1, which in turn is activated by the assembling of the NLR family pyrin domain containing-3 (NLRP3) inflammasome. 15 The mechanisms behind the regulation of the NLRP3 inflammasome are not fully understood, but in addition to several endogenous and exogenous danger signals, including danger-associated molecular patterns (DAMPs), 16 glucose per se has been suggested to be an inducer of this pathway. 13
To further explore the IL-18 regulatory pathway related to insulin resistance, the aim of the present study was to investigate whether glucometabolic variables are associated with circulating levels of IL-18 (serum levels of interleukin-18 (sIL-18)) and gene expression levels of IL-18, NLRP3 and Caspase-1 in subcutaneous AT and in circulating leukocytes. In addition, we investigated any relationship between the measured biomarkers and the amount and distribution of abdominal AT, assessed by computed tomography (CT).
Materials and methods
The present investigation is a follow-up study of a homogeneous cohort of 103 middle-aged Caucasian men, initially recruited from the yearly military draft in Oslo and Akershus, Norway. The initial study was conducted about 20 years earlier, previously described in details. 17 All men gave their informed written consent to participate. The study was approved by the Regional Committee Medical and Health Research Ethics, and conducted in accordance with the Helsinki Declaration. At the time of follow-up, venous blood samples were drawn between 8 and 11 a.m. after overnight fasting. Fasting glucose, HbA1c, insulin, c-peptide and serum lipids were measured by conventional routine methods. Serum was prepared within 1 h at 2500g for 10 min and kept frozen at −80°C until analysis. PAXgene tubes (PreAnalytix, Hombrechtikon, Switzerland) were collected for gene expression analysis in whole blood, left at room temperature for at least 2 h and then frozen at −80°C until RNA extraction. As leukocytes are the main source of nuclear DNA mediating gene expression, the term gene expression from circulating leukocytes is used throughout.
Subcutaneous AT samples were taken from the gluteal region and immediately stored at −80°C until RNA extraction. sIL-18 was measured by commercially available enzyme-linked immunosorbent assay (ELISA) (MBL, Medical & Biological Laboratories CO., LTD., Nagoya, Japan). Whether the kit measures both free IL-18 and that bound to IL-18 binding protein (IL-18BP) cannot be clarified by the manufacturer. 18 The inter-assay coefficient of variation (CV) in our laboratory was 2.6%.
Gene expression analyses
Total RNA was isolated from subcutaneous AT by use of the RNeasy Lipid Tissue Mini Kit and QIAcube according to the manufacturer protocol (Qiagen, GmbH, Hilden). The PAXgene® Blood RNA Kit (PreAnalytix, Qiagen, GmbH), with an extra cleaning step (RNeasy® MinElute® Cleanup Kit, Qiagen) was used to isolate total RNA. RNA quality and quantity (ng/µL) were determined by the NanoDrop™ 1000 Spectrophotometer (Thermo Scientific, Wilmington, Delaware, USA). cDNA was synthesised from equal amount of RNA with qScript™ cDNA superMix (Quanta Biosciences, Gaithersburg, Maryland, USA). Real-time polymerase chain reaction (PCR) was performed on a ViiA™ 7 instrument (Applied Biosystems, Foster City, CA, USA) using TaqMan® Universal PCR Master Mix (P/N 4324018) and the following TaqMan assays: IL-18 (Hs00155517_m1), NLRP3 (Hs00918082_m1) and caspase-1 (Hs00354836_m1) (Applied Biosystems). β2-microglobulin (HS99999907_m1) (Applied Biosystems) was used as endogenous control, and mRNA levels were determined by relative quantification (RQ) using the ΔΔCT method. 19
Glucose clamp
To assess insulin resistance, glucose disposal rate (GDR), a measure of insulin sensitivity, was determined by a 120 min hyperinsulinaemic isoglycaemic glucose clamp, modified after the method first described by DeFronzo et al., 20 and used as previously described in details. 21 In brief, the fasting glucose value was calculated from the average of three blood glucose values (Accu-Chek Performa metre system, Roche, Mannheim, Germany) in blood drawn from catheterisation of the left antecubital vein. A human insulin analogue (Insulin Lispro, Eli Lilly, Houten, The Netherlands) (30 IE) was infused at a constant infusion rate at 1 mU/min/kg body weight. Glucose infusion was started 5 min later with 20 mL/h for 5 min, 30 mL/h the next 5 min and then adjusted according to the blood glucose values measured every 5 min to keep the participants at their fasting levels. GDR was calculated from the average glucose infusion rate from the last 20 min of the clamp divided by body weight (mg/kg/min).
CT
The method has previously been described in details. 22 Briefly, the participant were lying with arms extended above the head and the CT scan was conducted at the level of L3/4, using a Siemens Somatom Sensation 64 CT Scanner (Erlangen, Germany) with the CT parameters set to 120 kV, 200 mAs and slice thickness of 5 mm. The software programme Osirix (Pixmo, Geneva, Switzerland) was used for analyses of the DICOM images. The amount, in square centimetre (cm2) of dSAT and sSAT was assessed by tracking the circumferences divided by a membranous layer (Scarpa’s fascia). The muscle compartment including the spine, was assessed by tracking the circumferences between the dSAT and the inner abdominal wall. Then VAT was calculated by highlighting the pixels containing fat (−30 to −190 Hounsfield Units). The radiologist reading the CT scan was blinded to the other study results.
Statistics
As most variables were skewed distributed, non-parametric methods have been used throughout. Data are presented as proportions and medians (25, 75 percentiles) if not otherwise stated. Spearman’s rho was performed to evaluate correlations between parameters and Mann–Whitney U test was used for comparing groups. p-Value < 0.05 was considered to be statistically significant. As the cohort consisted of men with similar age, and the metabolic variables investigated were closely inter-related, no adjustments for the observed associations have been performed. SPSS version 23 (SPSS Inc., IL, USA) was used for all analyses.
Results
Characteristics of the study population are shown in Table 1. All glucometabolic variables, lipid variables and measured blood pressure were within the normal range. Family history of diabetes was recorded in 20%, assessed by questionnaire. Serum for IL-18 and PAXgene tubes were available in all 103 participants, whereas gene expression in AT was successfully analysed in 73, mainly due to lack of samples from the rest 30 participants.
Demographic characteristics of the total study population (n = 103).
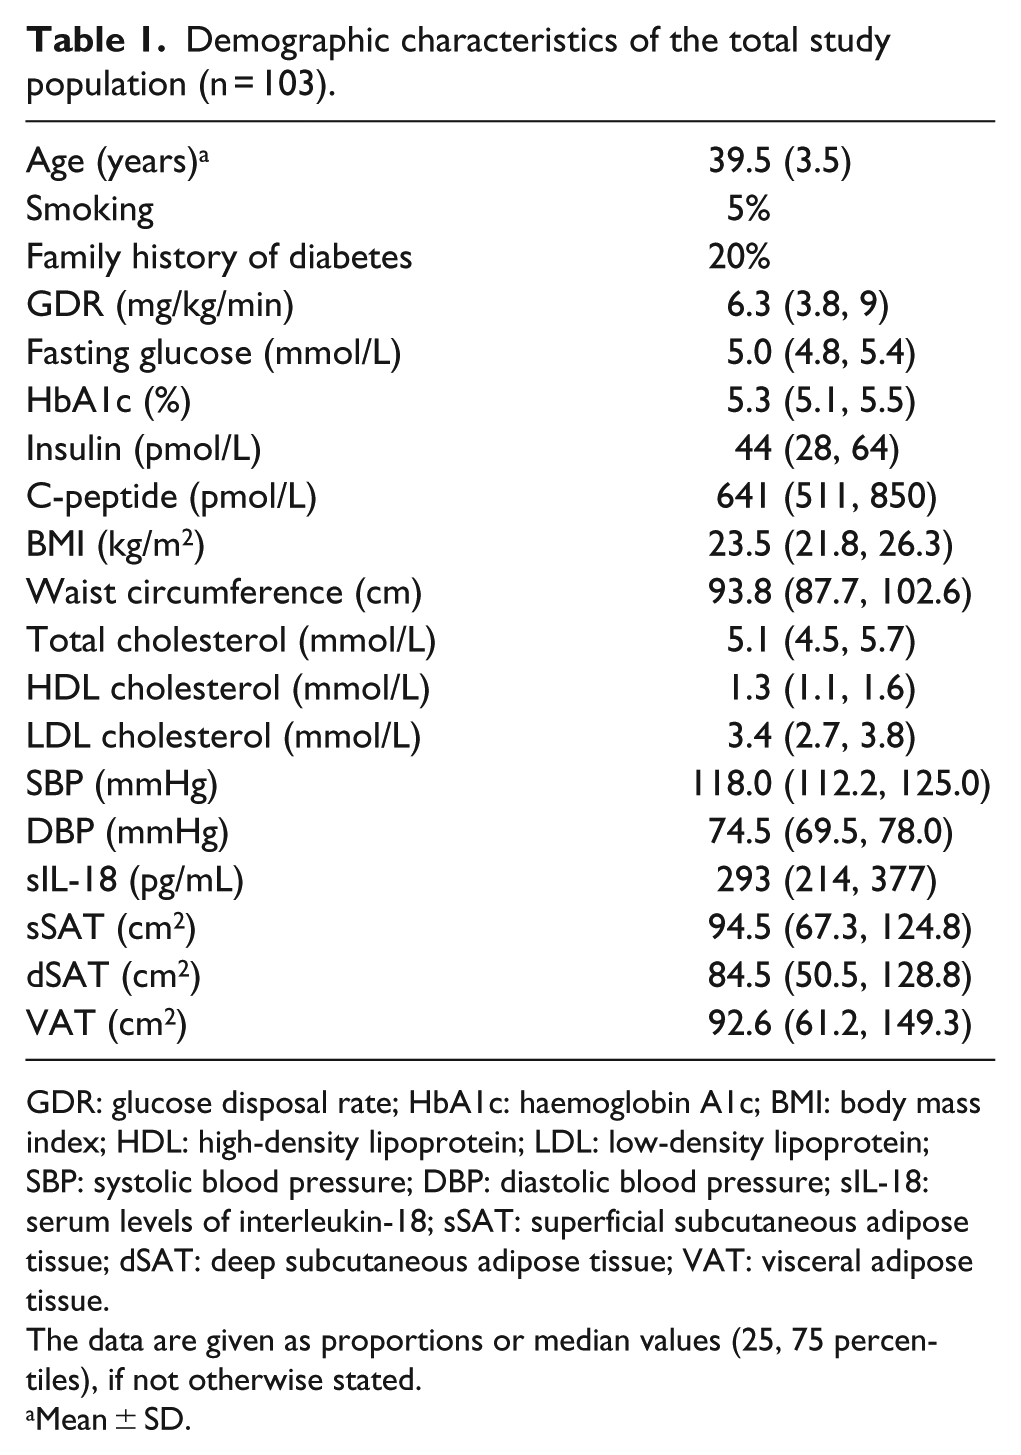
GDR: glucose disposal rate; HbA1c: haemoglobin A1c; BMI: body mass index; HDL: high-density lipoprotein; LDL: low-density lipoprotein; SBP: systolic blood pressure; DBP: diastolic blood pressure; sIL-18: serum levels of interleukin-18; sSAT: superficial subcutaneous adipose tissue; dSAT: deep subcutaneous adipose tissue; VAT: visceral adipose tissue.
The data are given as proportions or median values (25, 75 percentiles), if not otherwise stated.
Mean ± SD.
Correlations between the glucometabolic variable and the measured biomarkers
As shown in Table 2, we could demonstrate significant correlations between all the glucometabolic variables, except fasting glucose, and sIL-18, as well as gene expression of IL-18 and NLRP3 in AT (p ⩽ 0.05, all). In circulating leukocytes, NLRP3 expression was, however, inversely correlated to the glucometabolic variables (p ⩽ 0.05, all) except for GDR, which was positively correlated, as was also the expression of IL-18. No correlations to caspase-1 expression were observed. The relation between glucometabolic variables and family history of diabetes has previously been published, showing that men with a family history of diabetes had reduced insulin sensitivity. 23 sIL-18 and AT gene expression of IL-18, but not NLRP3 and caspase-1, were significantly higher in those with a family history of diabetes (n = 20) (370 vs 272 pg/mL, p < 0.01 and RQ 1.8 vs 1.0, p < 0.05, respectively). No differences between the groups were observed in leukocyte gene expression.
Correlations between glucometabolic variables and sIL-18 and the regulatory genes expressed in subcutaneous adipose tissue (AT) and circulating leukocytes (L).
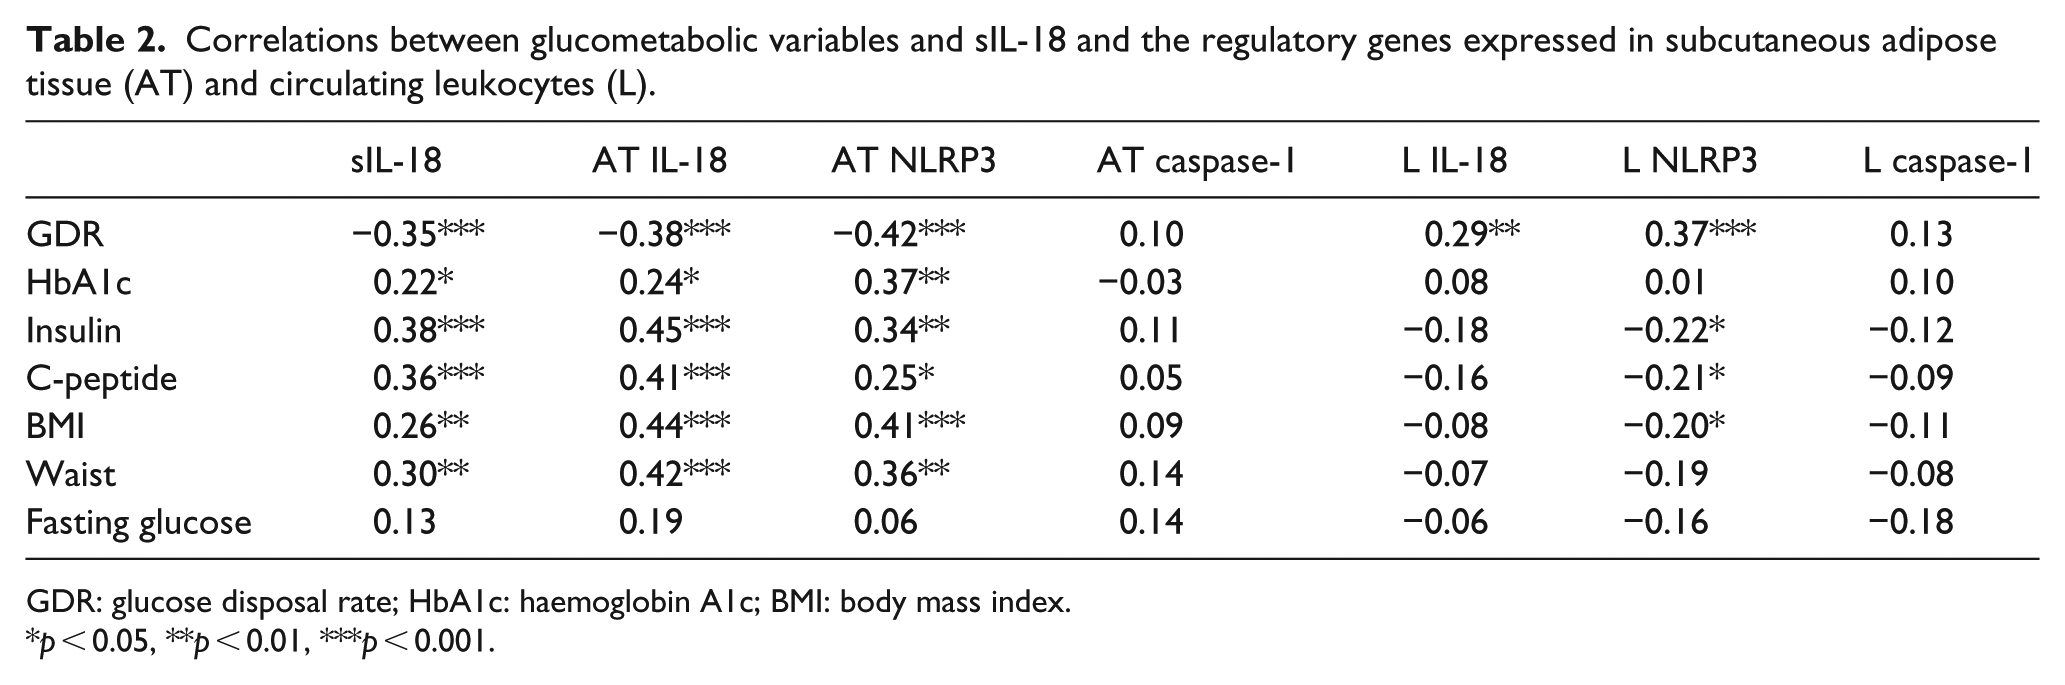
GDR: glucose disposal rate; HbA1c: haemoglobin A1c; BMI: body mass index.
p < 0.05, **p < 0.01, ***p < 0.001.
Correlations between the measured biomarkers and the amount of abdominal adipose tissue
sIL-18 and the expression of IL-18 in AT were significantly correlated to the amount of AT assessed by CT in all compartments of abdominal AT [sSAT, dSAT and VAT (p < 0.05, all)] (Table 3). Likewise, AT expression of NLRP3 was significantly correlated to the amount of sSAT and dSAT (p < 0.01, both). When dividing the different AT compartments into quartiles of amount fat and dichotomising between the lowest and highest quartiles, either at median or between the third and fourth quartile, we could show significantly higher levels of sIL-18 in the highest quartiles of all compartments (Figure 1(a)). The same pattern was found for AT expression of IL-18 and NLRP3 (Figure 1(b) and (c)). Expression of caspase-1 did not correlate significantly to the amount of fat in any of the compartments, nor did expression of the investigated markers in circulating leukocytes, except from a weak, inverse correlation between NLRP3 and VAT (Table 3).
Correlations between sIL-18 and the regulatory genes expressed in subcutaneous adipose tissue (AT) and circulating leukocytes (L) and the different abdominal adipose tissue compartments assessed by axial CT scan.
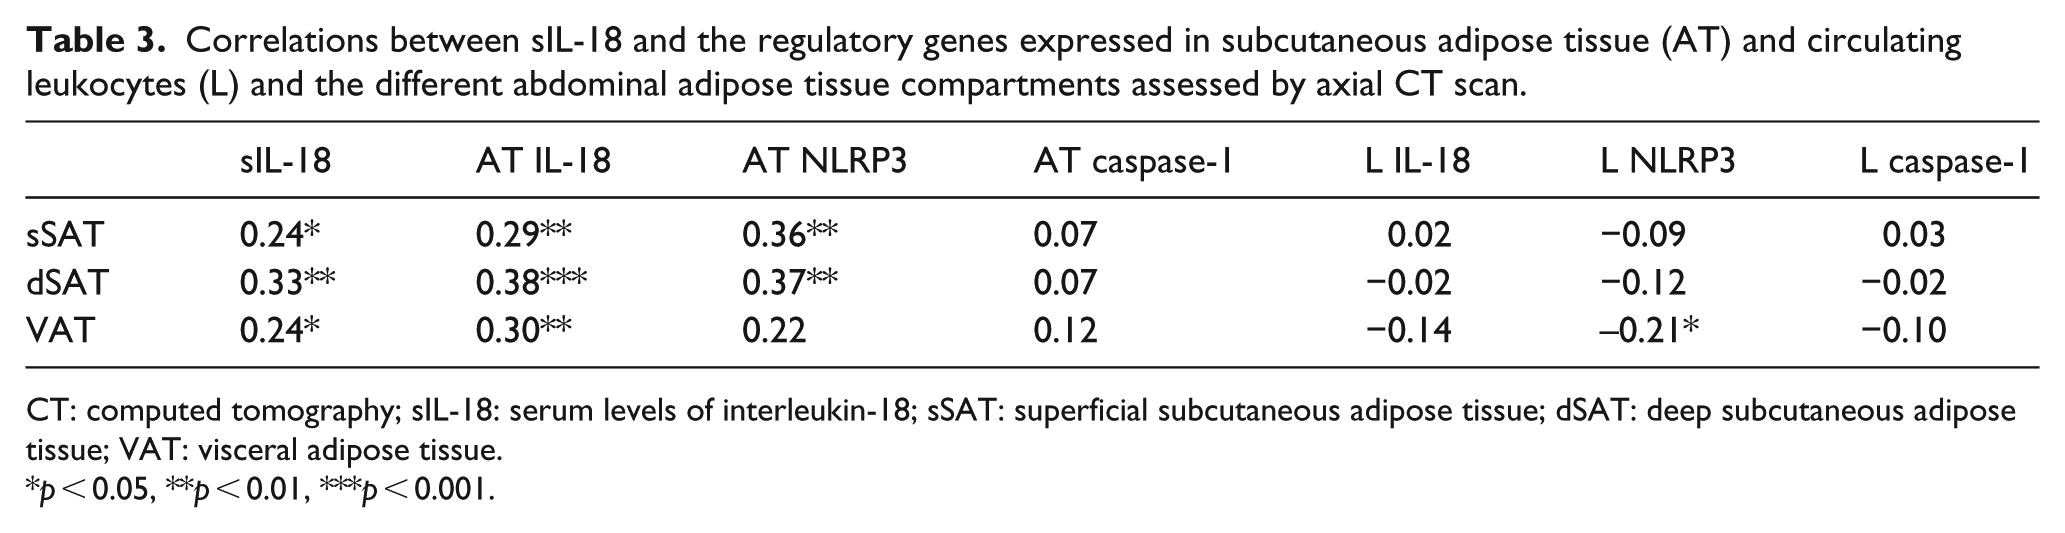
CT: computed tomography; sIL-18: serum levels of interleukin-18; sSAT: superficial subcutaneous adipose tissue; dSAT: deep subcutaneous adipose tissue; VAT: visceral adipose tissue.
p < 0.05, **p < 0.01, ***p < 0.001.
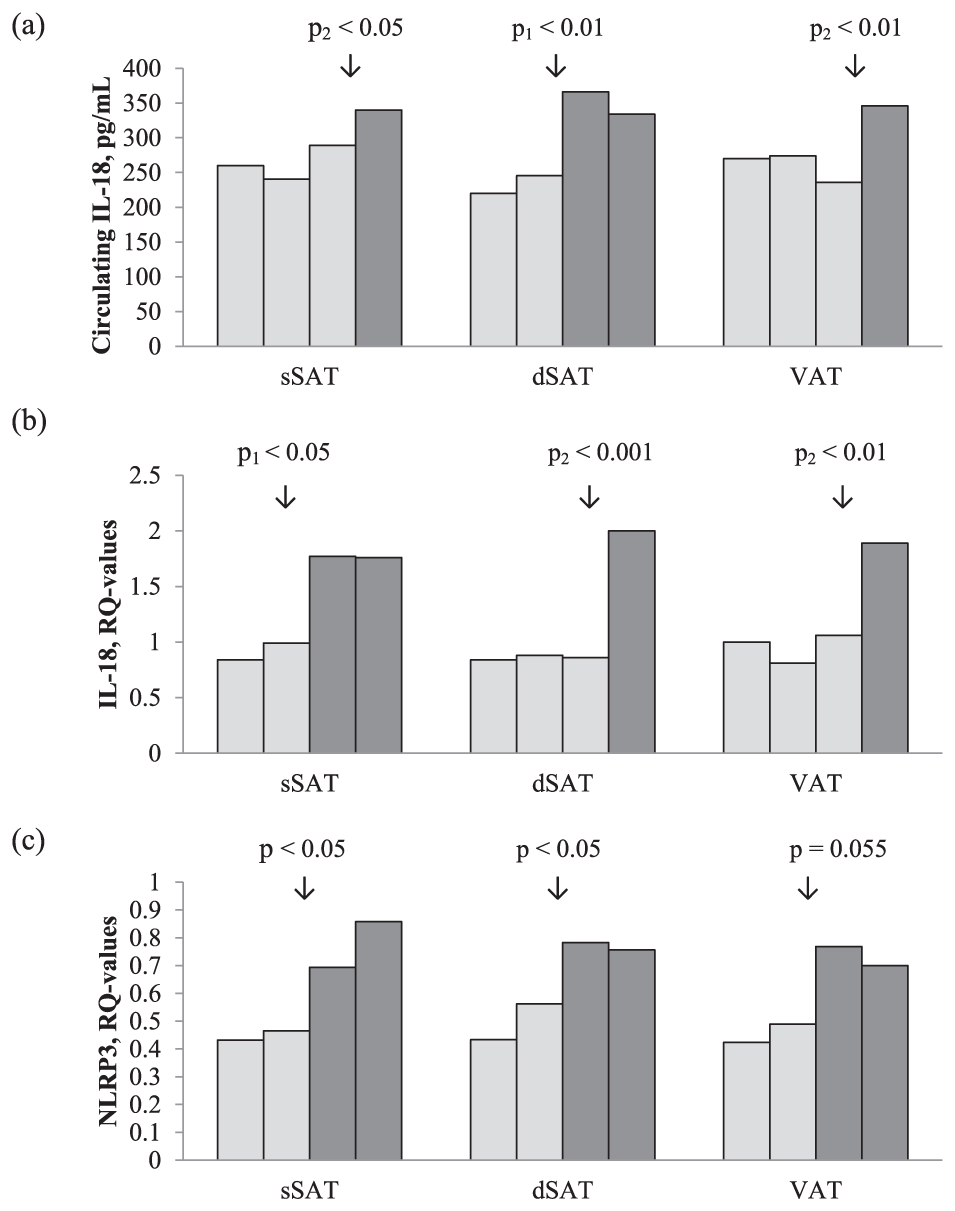
(a) Circulating IL-18 in quartiles of the three abdominal adipose tissue compartments sSAT, dSAT and VAT (measured by CT, cm2). The data were dichotomised based on visualisation by the figure bars. The p1-value refers to the difference between two groups (Mann–Whitney U test) dichotomised by median and the p2-value refers to the difference between the two groups (Mann–Whitney U test) dichotomised between the third and fourth quartile. (b) Gene expression of IL-18 in quartiles of the three abdominal adipose tissue compartments sSAT, dSAT and VAT (measured by CT, cm2). The data were dichotomised based on visualisation by the figure bars. The p1-value refers to the difference between two groups (Mann–Whitney U test) dichotomised by median and the p2-value refers to the difference between the two groups (Mann–Whitney U test) dichotomised between the third and fourth quartile. (c) Gene expression of NLRP3 in quartiles of the three abdominal adipose tissue compartments sSAT, dSAT and VAT (measured by CT, cm2). The data were dichotomised based on visualisation by the figure bars. The p-value refers to the difference between two groups (Mann–Whitney U test) dichotomised by median.
Correlations between the inflammasome related variables
As shown in Table 4, sIL-18 correlated significantly to AT expression of NLRP3 (p < 0.05) and borderline to IL-18 (p = 0.054), whereas inverse correlations were observed to the expression of NLRP3, caspase-1 and IL-18 in circulating leukocytes (p < 0.05, all). In AT, IL-18 expression was significantly correlated to NLRP3 expression (p < 0.001) and in circulating leukocytes IL-18, NLRP3 and caspase-1 expression were significantly correlated to each other (<0.001, all).
Inter correlations (Spearman’s rho) between sIL-18 and the regulatory genes expressed in subcutaneous adipose tissue (AT) and circulating leukocytes (L).
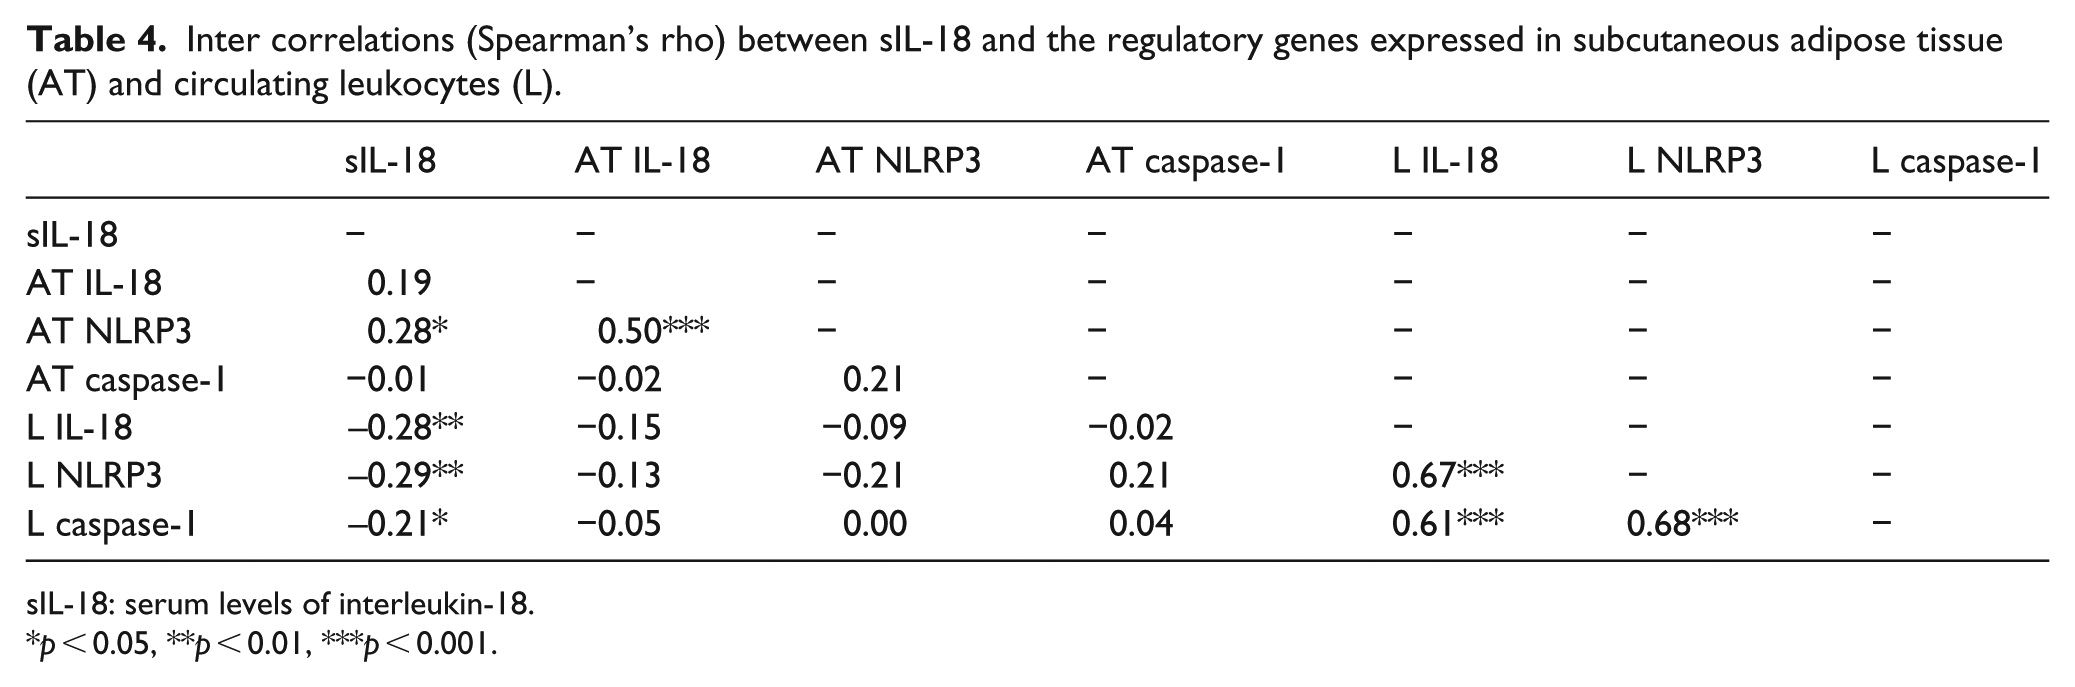
sIL-18: serum levels of interleukin-18.
p < 0.05, **p < 0.01, ***p < 0.001.
Discussion
In our population of relatively healthy middle-aged men, we could show that glucometabolic variables, including insulin sensitivity assessed by glucose clamp, were significantly associated with both sIL-18 and the genetically expressed IL-18 and its regulator NLRP3 in subcutaneous AT. Significant associations were additionally demonstrated between sIL-18 and genetic expression of both IL-18 and NLRP3 in AT and also the amount of AT in the different abdominal compartments, assessed by CT. The inflammasome-related variables were also significantly related to each other. The rather strong associations found between IL-18, both in the circulation and in AT, and the measured glucometabolic variables (GDR, HbA1c, insulin, C-peptide, body mass index (BMI) and waist circumference) are supportive to the previously reported associations between these inflammatory marker and insulin resistance, T2DM and obesity. 12 Also, in line with our results, expression of NLRP3 in abdominal subcutaneous AT has been shown to strongly associate with insulin resistance, assessed by hyperinsulinaemic euglycaemic clamp in a small group (n = 19) of both lean and obese men. 24 Furthermore, activation of the NLRP3 inflammasome in AT from obese mice was shown to promote macrophage-mediated T cell activation, with further regulation of the IL-18 production and reduced insulin sensitivity, 16 indicative of these mediators to play an important role in insulin resistance.
We could not find any significant correlation between IL-18 and its regulators and fasting glucose per se in our population, which might be due to glucose values being within a normal and limited range. On the other hand, despite our young healthy population with normal glucose values, we found a strong and significant inverse correlation to GDR, the gold standard measurement on insulin sensitivity. Accordingly, we also found that both sIL-18 and AT gene expression of IL-18 were elevated in subjects with familiar history of diabetes. In a larger study in an apparently healthy population, it was, however, found that sIL-18 was positively correlated with fasting glucose in individuals both with obesity and T2DM. 25
Elevated gene expression of IL-18 in subcutaneous AT from individuals with metabolic syndrome (MetS) has been reported, and fasting glucose was the MetS component found to be of greatest importance. 13 In another study on macrophages stimulated with high glucose concentration, it was observed an increase in the pro-inflammatory macrophage phenotype, M1, and significantly increased gene expression of NLRP3, caspase-1 and IL-1β compared to cells exposed to a glucose level resembling the levels in healthy individuals, 26 similar to the levels in our population, indicating that high glucose level plays a role. Furthermore, in line with our results association between C-peptide and the inflammasome markers, C-peptide was shown to have pro-inflammatory effects in insulin resistance and T2DM.27,28 C-peptide has also been suggested to be a mediator of atherosclerosis in patients with T2DM based on co-localisation of C-peptide and CD14+ lymphocytes in vascular lesions. 27 C-peptide has further also been shown to have chemotactic properties. 27 The observed lack of correlation between the glucometabolic variables and AT expression of caspase-1 might be explained by that caspase-1 is not upregulated in healthy subjects to the same degree, as shown in studies on diabetics or obese. In a study on obese individuals, it was shown that the caspase-1 gene expression in VAT and SAT was similar, while the caspase-1 activity was significantly higher in VAT; 29 thus, the activity rather than the regulatory level might be more relevant. The observed significant upregulation of IL-18 and NLRP3 in AT and downregulation in circulating leukocytes, along with higher levels of sIL-18 found in our study, indicate that the main source of sIL-18 is the AT. We can, however, not sort out whether the source is adipocytes per se or the infiltrated pro-inflammatory cells in our study. It has previously been shown that AT spontaneously secretes IL-18 and with higher secretion in adipocytes from obese donors compared to lean donors. 30 This might also explain the significant correlation observed between sIL-18 and BMI in the present study, which is supported by previous findings of reduction in sIL-18 after weight loss. 31 This is further supported by the significant associations found in our study, between the amount of AT in the different abdominal compartments assessed by CT and sIL-18 and the regulatory levels of both IL-18 and NLRP3 in the AT, but not in circulating leukocytes. The inverse relation observed between circulating IL-18 and expression of IL-18 and its regulators in circulating leukocytes might indicate downregulation of these genes by negative feedback mechanisms. The more pronounced correlations found between sIL-18 and gene expression of both IL-18 and NLPR3 in dSAT compared to sSAT, are in accordance with previous reports on dSAT found to be more metabolically unfavourable than sSAT. 11 Also in line with our results, sIL-18 has been shown to correlate to abdominal visceral fat assessed by CT in subjects with T2DM. 14
Limitation
Our study is limited since only Caucasian men within a homogeneous age are included and the results can therefore not be applied without further investigation in a broader layer of the population. As this was a cross-sectional study, we are not able to determine any causality between these highly related factors. The study is also limited by the fact that it cannot be clarified whether the measured sIL-18 also includes that bound to IL-18BP, as mentioned in the method chapter. However, this method for sIL-18 determination has been used in several clinical studies on humans, also when assessing sIL-18 as a biomarker related to clinical outcome, without distinction between the free and bound fraction of IL-18.18,25,32,33 Although we have focused on the regulation by NLRP3 in our study, any influence by other inflammasomes cannot be excluded as NLRP1 recently was suggested to be a major inflammasome regulating IL-18 in a murine model of obesity. 34
Conclusion
In our study of healthy middle-aged men, circulating levels of IL-18 and the inflammasome-related regulators in subcutaneous AT were found to be highly related to glucometabolic variables including BMI and insulin sensitivity, as well as to the amount of abdominal AT. The results implicate that the glucometabolic state is of great importance on both the circulating level of IL-18 and the genetic expression of IL-18 and NLRP3 in AT. The latter upregulation was shown to be reflected in the amount of abdominal AT, supporting previous findings of subcutaneous AT to be inflammatory active.
Footnotes
Acknowledgements
The authors are thankful to Sigrid N Skaarn who included and examined the patients in the follow-up part of the study. The authors also want to thank Vibeke Norheim Kjær and Ulla P Hjørnholm at Section of Cardiovascular and Renal Research, Oslo University Hospital, Ullevål for excellent contribution to the study.
Declaration of conflicting interests
The author(s) declared no potential conflicts of interest with respect to the research, authorship, and/or publication of this article.
Funding
This work was supported by Stein Erik Hagens Foundation for Cardiovascular Research, Oslo, Norway.