
Abstract
Laboratory evidence suggests that urea suppresses insulin secretion and sensitivity. Emerging epidemiologic evidence suggests that higher levels of urea are associated with increased risk of incident diabetes mellitus. However, whether elevated levels of blood urea nitrogen are associated with increased risk of insulin use among people with diabetes is unknown. We used the Department of Veterans Affairs databases to assemble a cohort of 197,994 incident users of non-insulin hypoglycaemic agents with an estimated glomerular filtration rate > 60 mL/min per 1.73 m2 and followed them for a median of 4.93 years. Spline analyses suggested that the relationship between blood urea nitrogen and the risk of insulin use was neutral below blood urea nitrogen level of 25 mg/dL and increased exponentially with blood urea nitrogen levels above 25 mg/dL. In survival models, compared to those with blood urea nitrogen ⩽ 25 mg/dL, those with blood urea nitrogen > 25 mg/dL had an increased risk of insulin use (hazard ratio = 1.40; confidence interval = 1.30–1.50). The risk of insulin use was increased in models which accounted for haemoglobin A1c at time zero (hazard ratio = 1.39; confidence interval = 1.28–1.50) and as a time-varying variable (hazard ratio = 1.38; confidence interval = 1.28–1.50). Two-step residual estimation analyses showed that, independent of the impact of estimated glomerular filtration rate, every 10-mg/dL increase in blood urea nitrogen concentration was associated with increased risk of insulin use (hazard ratio = 1.16; confidence interval = 1.12–1.20). Our results suggest that, among people with diabetes, higher levels of blood urea nitrogen are associated with an increased risk of insulin use.
Introduction
Laboratory evidence developed in cell culture and murine models suggests that urea suppresses insulin secretion and reduces insulin sensitivity1,2. D’Apolito et al. 1 showed that cultured adipocytes treated with urea (at disease-relevant concentrations) exhibited decreased insulin sensitivity. In a mouse model of surgically induced kidney failure, uremic mice (with elevated serum urea) exhibited insulin resistance and glucose intolerance, and urea infusion resulted in insulin resistance in normal mice. 1 In seminal work, Koppe et al. reported that defective insulin secretion in uremic mice is mechanistically caused by elevated levels of circulating urea.2,3
Guided by the experimental observations of D’Apolito et al. 1 and Koppe et al., 2 we recently described in a large epidemiological cohort study an association between elevated levels of blood urea nitrogen (BUN) and risk of incident diabetes.3,4 Given the experimental evidence that urea suppresses insulin secretion and sensitivity, the epidemiologic evidence in humans of an association between urea and risk of diabetes, and the knowledge that most oral hypoglycaemic agents and most non-insulin hypoglycaemic injectable agents act by either stimulating insulin secretion or enhancing insulin sensitivity or both, we hypothesized that elevated levels of urea lead to an increased risk of failure of non-insulin hypoglycaemic agents and an increased risk of requiring insulin initiation (where the failure of non-insulin hypoglycaemic agents is likely a result of ineffective stimulation of insulin secretion or an inadequate increase in insulin sensitivity or both). Given that the medical decision to switch from non-insulin hypoglycaemic agents to insulin or addition of insulin to the regimen may also be influenced by the degree of kidney function (where some hypoglycaemic agents are contraindicated), we opted to study our research question in a cohort of participants with relatively preserved kidney function. To examine this hypothesis, we took a big data approach and used the United States Department of Veterans Affairs (VA) databases to build a national cohort of 197,994 US Veterans with diabetes, incident use of non-insulin hypoglycaemic agents, and an estimated glomerular filtration rate (eGFR) of more than 60 mL/min per 1.73 m2 and followed them over time to characterize the association of BUN and risk of insulin use.
Materials and methods
Cohort participants
We used the United States Department of Veterans Affairs databases to select a cohort of participants who received any non-insulin diabetes medication between 1 October 2002 and 30 September 2009, and had continuous use of the medication for more than 90 days with less than a 30-day gap between prescriptions (N = 1,279,852). The first prescription date within this period was designated as time zero (T0). From this, we then further selected those incident users who were enrolled in VA health care system for more than 3 years before T0 (N = 752,115) and did not receive any diabetes medication including insulin within 3 years before T0 (N = 344,740). Cohort participants were also required to have outpatient BUN measurement within 1 year before T0 (N = 289,081). We further removed those with missing outpatient eGFR, outpatient serum carbon dioxide, height and weight, and those who experienced dialysis or kidney transplant before T0 (N = 250,175). In order to remove the potential bias from prescription contraindicated in kidney disease, we excluded those with baseline eGFR less than 60 mL/min per 1.73 m2 yielding the final analytic cohort of 197,994 participants (Figure 1). Cohort participants were followed for 5 years and censored at the date of death, dialysis, kidney transplant or eGFR less than 60 mL/min per 1.73 m2 during the follow-up. The study was approved by the Institutional Review Board of the VA St Louis Health Care System, St Louis, MO.
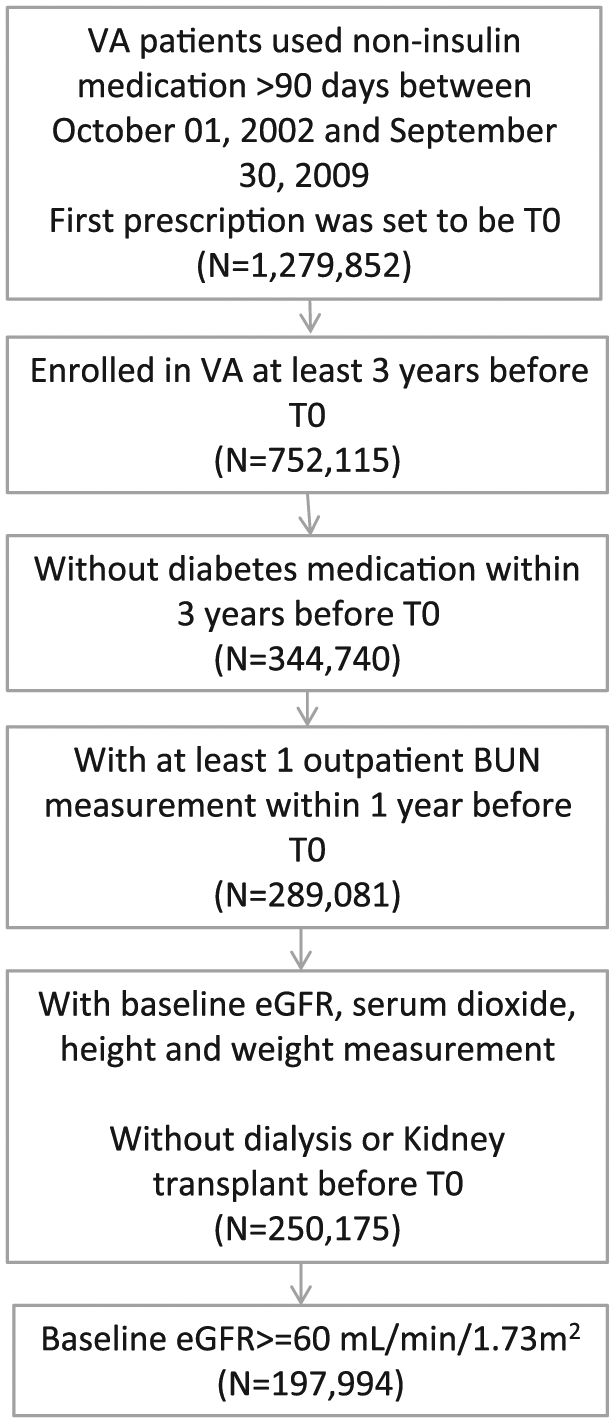
Flowchart of cohort assembly.
Data sources
The VA Corporate Data Warehouse Outpatient Pharmacy domain provided information on outpatient prescriptions including medication name, prescription date and days supplied.5–7 Veterans Health Administration (VHA) Medical SAS Inpatient and Outpatient Datasets that contain national VHA health care encounters data were used to collect information on ICD-9-CM diagnostic codes. 8 VHA’s Managerial Cost Accounting System and Corporate Data Warehouse Lab Chemistry domain provided information of laboratory results.5,9–12 The Medical SAS datasets, VA Beneficiary Identification Records Locator Subsystem files and Vital Status datasets provided data on demographic characteristics. 8 The Vital Signs domain provided information on height and weight. Information on dialysis and kidney transplant was obtained from the United States Renal Database System. 13
Outcome
The outcome for this study was incident insulin use. Insulin use was defined as outpatient insulin prescription during follow-up.
Primary predictor variables
The primary predictor variable was time-varying outpatient BUN. BUN levels were classified into high (BUN > 25 mg/dL) and low (BUN ⩽ 25 mg/dL) categories, 14 or as continuous with a spline function.
Covariates
Covariate selection was informed by prior studies.4–12,10,15–21 Time-varying covariates were measured when participants encountered with VA health care system from 3 years before T0 till the end of the follow-up. Comorbidities included cardiovascular disease, peripheral artery disease, cerebrovascular disease, chronic lung disease, dementia, cancer, hypertension, hyperlipidaemia, hepatitis C, HIV and gastrointestinal (GI) bleeding. Hepatitis C and HIV were assigned based on laboratory results, while all other comorbidities were assigned based on relevant ICD-9-CM diagnostic codes.6,7,15,16,18–20 Comorbidities were considered to exist till the end of the follow-up once diagnosed before or during the follow-up. Body mass index (BMI) was calculated from height and weight and categorized into underweight (BMI < 18.5 kg/m2), normal (18.5 kg/m2 ⩽ BMI < 25 kg/m2), overweight (25 kg/m2 ⩽ BMI < 30 kg/m2) and obese (BMI ⩾ 30 kg/m2). Albuminuria status was a dichotomous variable where a microalbumin/creatinine ratio more than 30 mg/g was considered albuminuria. Serum carbon dioxide was treated as a continuous variable. BMI, albuminuria and serum carbon dioxide were imputed based on the last observation carried forward. The numbers of hospitalizations and outpatient encounters were accumulated beginning from 3 years before T0. Diabetes medications used within a 30-day period were grouped into four dichotomous variables: biguanides, sulfonylureas, thiazolidinedione and others, which included sodium-glucose cotransporter 2 (SGLT2) inhibitors, dipeptidyl peptidase 4 (DPP-4) inhibitors, alpha-glucosidase inhibitors, glucagon-like peptide 1 receptor and amylin analogues. Steroids and other medications that may increase the risk of diabetes mellitus (including tacrolimus, cyclosporine, nicotinic acid and some antiretrovirals) were treated as dichotomous variables. Fiscal year was defined as categorical in the model to account for potential prescription pattern change over time. Besides time-varying variables, time-independent variables including age, race defined as white, black and other, and gender were also included in the multivariate analyses as covariates.
Statistical analyses
Cohort characteristics at T0 were described based on counts and percentages for categorical variables, means and standard deviations, and medians and interquartile ranges for continuous variables. Standardized differences were used to examine differences between groups. The time-varying direct adjusted insulin-free survival curves, which take into account the change in exposure status over time and adjusted for covariates, were used to describe the survival rate in different time-varying BUN categories. 22
Time-varying multivariate Cox survival models, where the values of predictors and covariates could vary over time, were used to examine the relationship between BUN and risk of incident insulin use. The time unit of the survival analyses was set at 30 days, and an outcome during the current time unit was predicted by predictor status one time unit before to reduce the possibility of reverse causality. To examine the non-linear relationship, spline analyses were conducted where BUN was treated as a cubic spline function. 23 In spline analyses, 0.1 percentiles from both tails were excluded to avoid the influence of extreme values. Based on the spline analysis, BUN was then categorized, subsequently serving as the primary predictor in other models. Given the association between BUN and eGFR, we also applied a two-stage residual inclusion method to examine the effect of BUN uncorrelated with eGFR. 24 In the first stage, BUN was regressed on the eGFR at each time point to obtain residual BUN unrelated to eGFR. In the second stage, the time-varying residuals were used as the primary predictor in a Cox survival model while controlling for covariates. All models controlled for age, race, gender, chronic lung disease, peripheral artery disease, cardiovascular disease, cerebrovascular disease, dementia, hyperlipidaemia, hepatitis C, HIV, cancer, GI bleeding, BMI, serum carbon dioxide, number of hospitalizations, number of outpatient encounters, albuminuria, biguanides, sulfonylureas, thiazolidinedione, other non-insulin hypoglycaemic medications, steroids and other medications that may increase the risk of diabetes mellitus. Quadratic and cubic terms of the number of hospitalizations and the number of outpatient encounters were added to the models to account for the non-linear relationship and better control for participants’ overall health status. Death, kidney transplant, dialysis and eGFR < 60 mL/min per 1.73 m2 during follow-up were considered competing risks; therefore, in all the analyses, we used the competing risk models to estimate the cause-specific hazards.25–27
Within those with available data, we examined the association between BUN and use of insulin additionally controlled for haemoglobin A1c (HbA1c) level at T0 or as a time-varying variable in separate models. Interaction terms were employed in the models to examine the association between BUN and incident use of insulin given different non-insulin hypoglycaemic medication classes. In addition, we applied marginal structural modelling to account for the potential bias from time-dependent covariates, that is, covariates at certain time point predict both subsequent outcome and primary exposure.28,29 To apply the method, we built four separate pooled logistic regressions to compute each participant’s probability of not being censored or the probability of experiencing high BUN at every time point, given time-varying covariates or T0 covariates. Weights for each person-time point were then computed by the inverse possibility of not being censored and having the BUN history given time-varying variables. We further multiplied the weight with the possibility of not being censored and having the BUN history given T0 variables only to obtain stabilized weights. Stabilized weights were truncated at 5 and 95 percentiles to reduce variance. 30 A generalized estimating equation was used in the final step to examine the association between BUN and use of insulin in the weighted cohort.
Baseline characteristics of the overall cohort, according to BUN category (⩽25 and >25 mg/dL) at the time of cohort entry (T0).
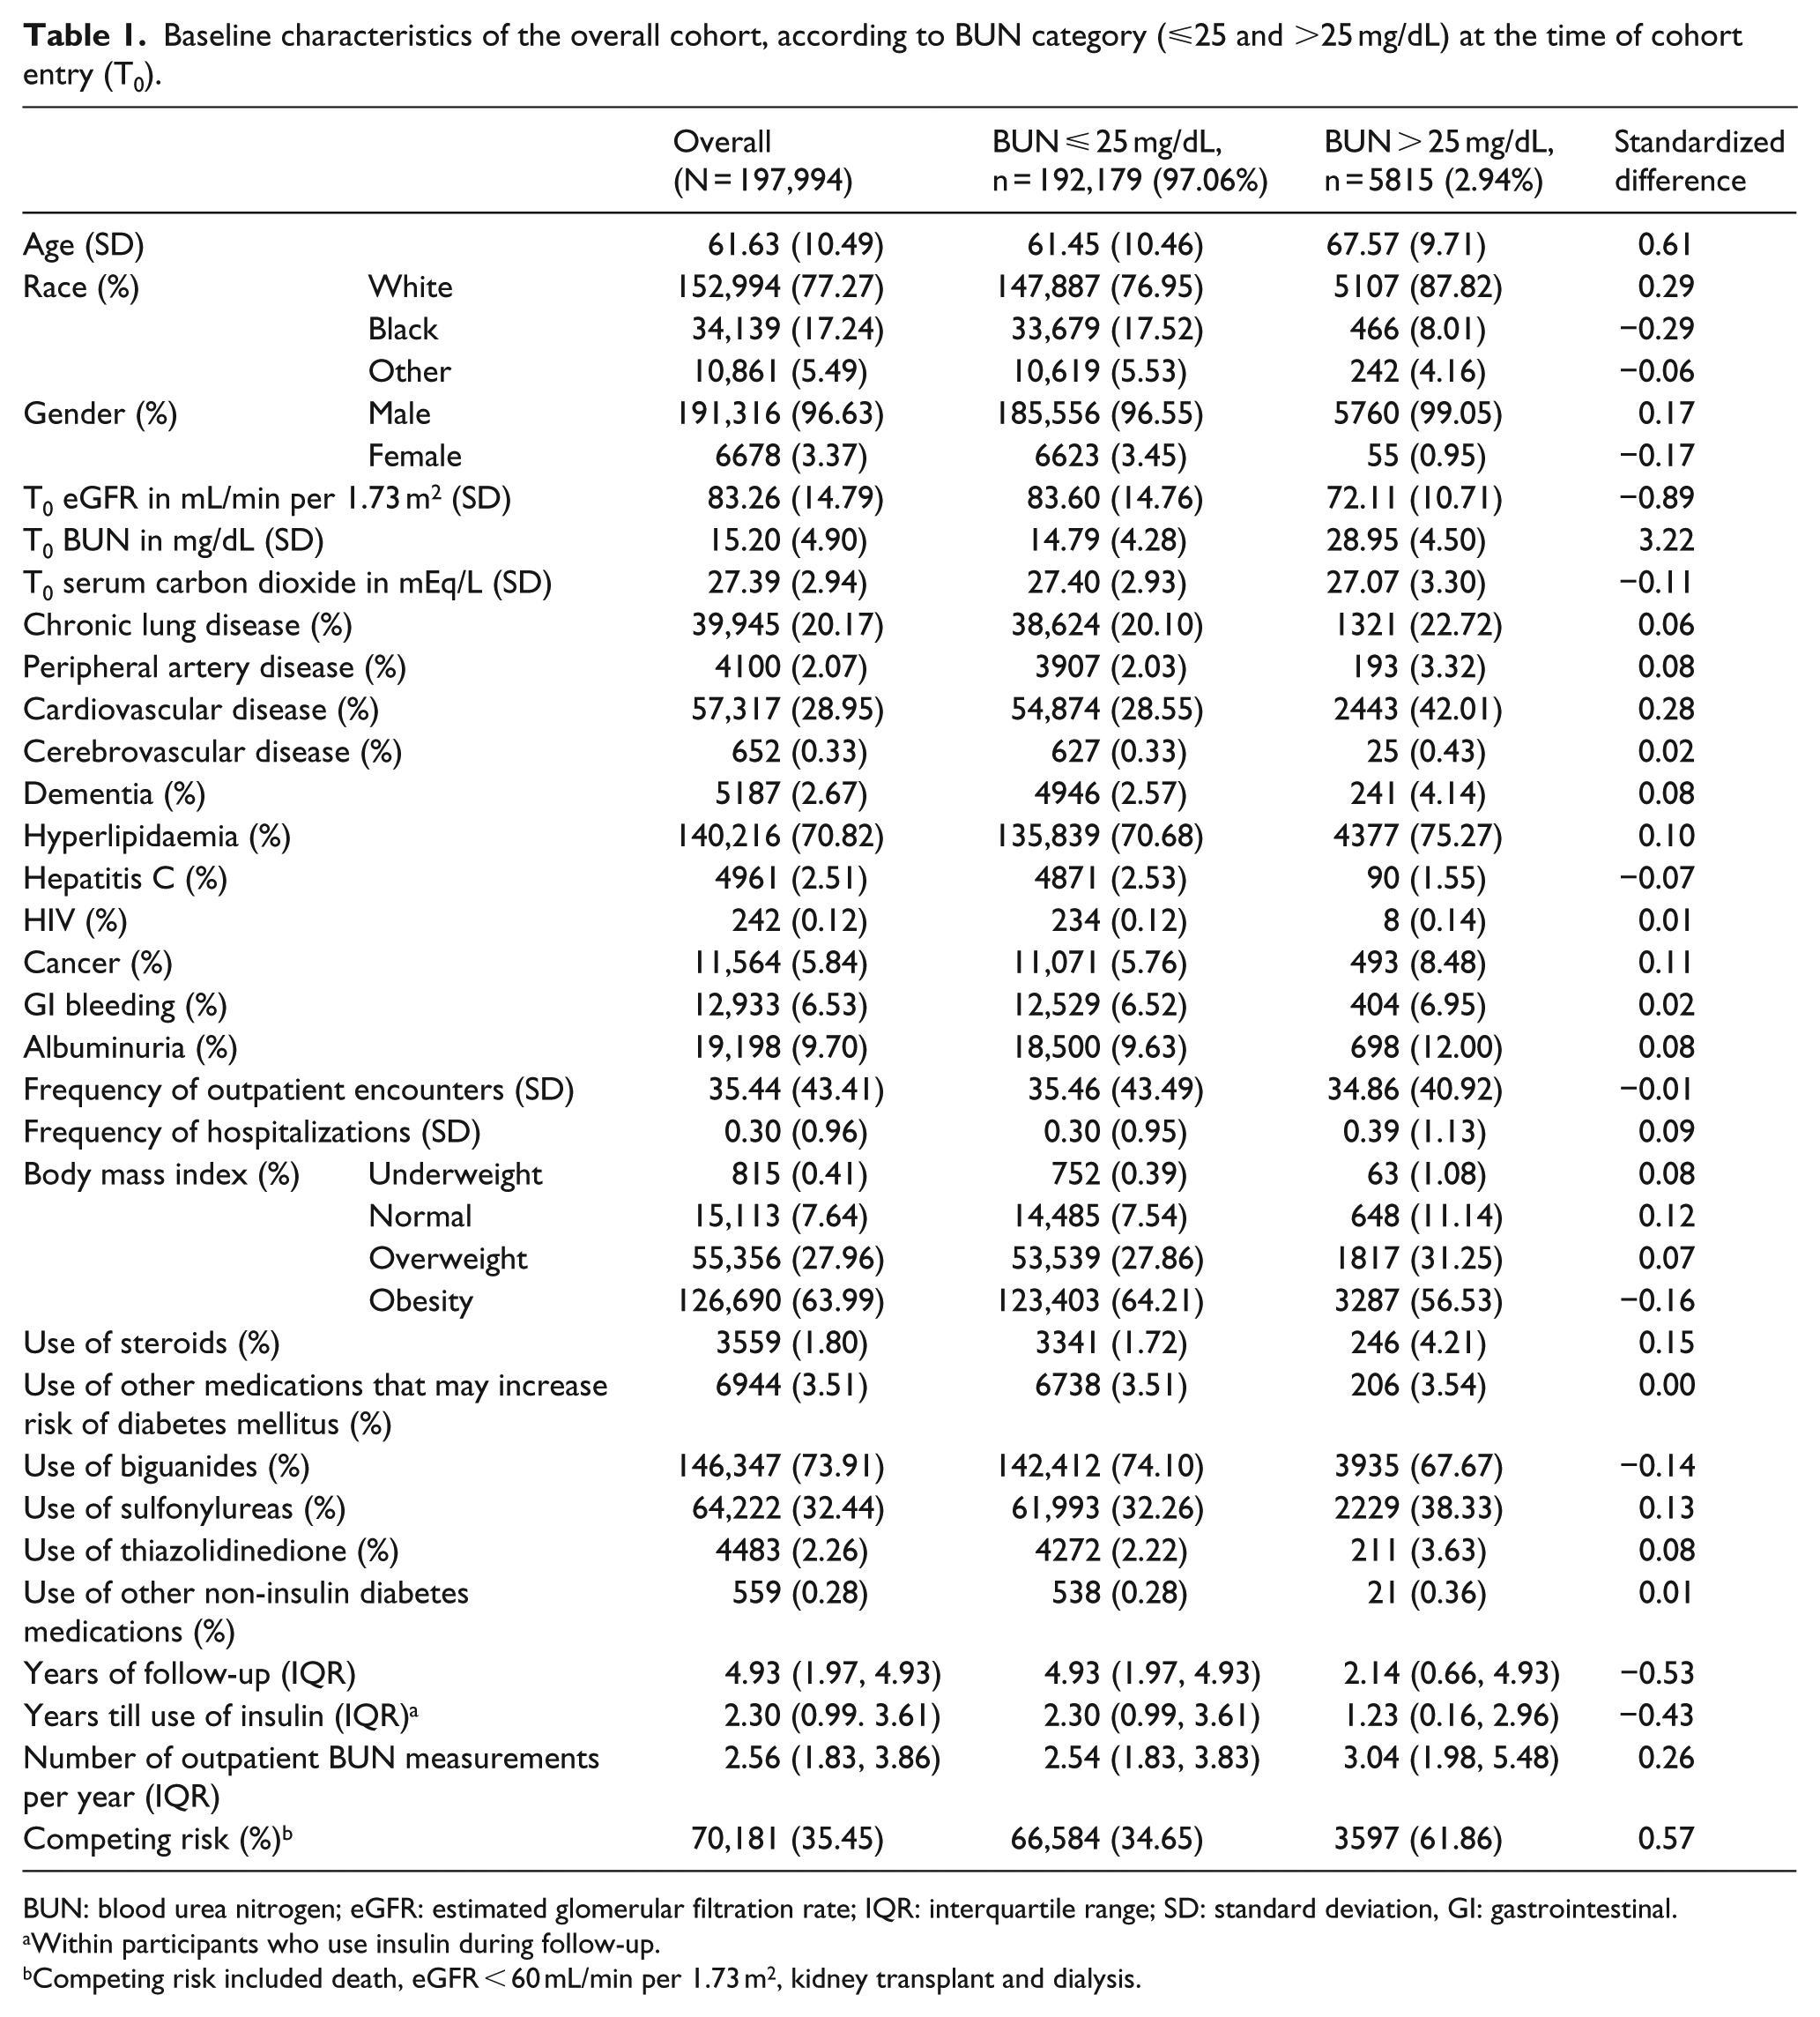
BUN: blood urea nitrogen; eGFR: estimated glomerular filtration rate; IQR: interquartile range; SD: standard deviation, GI: gastrointestinal.
Within participants who use insulin during follow-up.
Competing risk included death, eGFR < 60 mL/min per 1.73 m2, kidney transplant and dialysis.
In all analyses, type 1 error rate was set at α = 0.05 and a 95% confidence interval (CI) that does not include 1.00 was considered statistically significant. All analyses were performed using SAS Enterprise Guide version 7.1.
Sensitivity analyses
To evaluate the robustness of the association between BUN and risk of incident insulin use, we conducted multiple sensitivity analyses. (1) In separate models, we excluded those who received insulin within 30 and 90 days after incident non-insulin hypoglycaemic medication use. (2) We used alternative cutoff points to categorize BUN as BUN ⩽ 15 mg/dL, 15 ⩽ BUN < 25 mg/dL and BUN > 25 mg/dL. (3) To account for the potential confounding related to the frequency of BUN measurements and frequency of HbA1c measurements, we additionally controlled for time-updated number of BUN measurements or number of HbA1c measurements during follow-up with quadratic and cubic terms. (4) We built a stratified model to evaluate the association of BUN and use of insulin within different BMI categories. (5) To examine our hypothesis among those with reduced eGFR, we repeated the analyses using a cohort with T0 eGFR between 30 and 60 mL/min per 1.73 m2 where, in lieu of censoring at the time when eGFR < 60 mL/min per 1.73 m2, we censored these participants at the time when their eGFR < 30 mL/min per 1.73 m2.
Results
There were 197,994 participants in the overall cohort, 192,179 (97.06%) and 5815 (2.94%) with T0 BUN ⩽ 25 mg/dL and BUN > 25 mg/dL, respectively. The majority of cohort participants are of white race and male gender. There were 146,347 (73.91%) on biguanides, 64,222 (32.44%) on sulfonylureas, 4483 (2.26%) on thiazolidinedione and 559 (0.28%) on other non-insulin hypoglycaemic agents. Participants in the higher BUN group had a lower eGFR and a higher burden of cardiovascular disease. During time in cohort, the occurrence of competing risk (which included death, eGFR < 60 mL/min per 1.73 m2, kidney transplant and dialysis) was higher among those with BUN > 25 mg/dL. In the overall cohort, the incident rate of insulin use was 3.32 (3.27-3.36) per 100 person-years; it was 3.30 (3.26-3.35) and 3.80 (3.54-4.08) per 100 person-years in those with BUN ⩽ 25 mg/dL and BUN > 25 mg/dL, respectively. Adjusted incident rate for insulin use was 3.15 (3.11-3.18) per 100 person-years in the overall cohort and 2.74 (2.70-2.79) and 3.55 (3.50-3.60) per 100 person-years in BUN ⩽ 25 mg/dL and BUN > 25 mg/dL, respectively. The adjusted insulin-free survival probability is depicted in Figure 2.
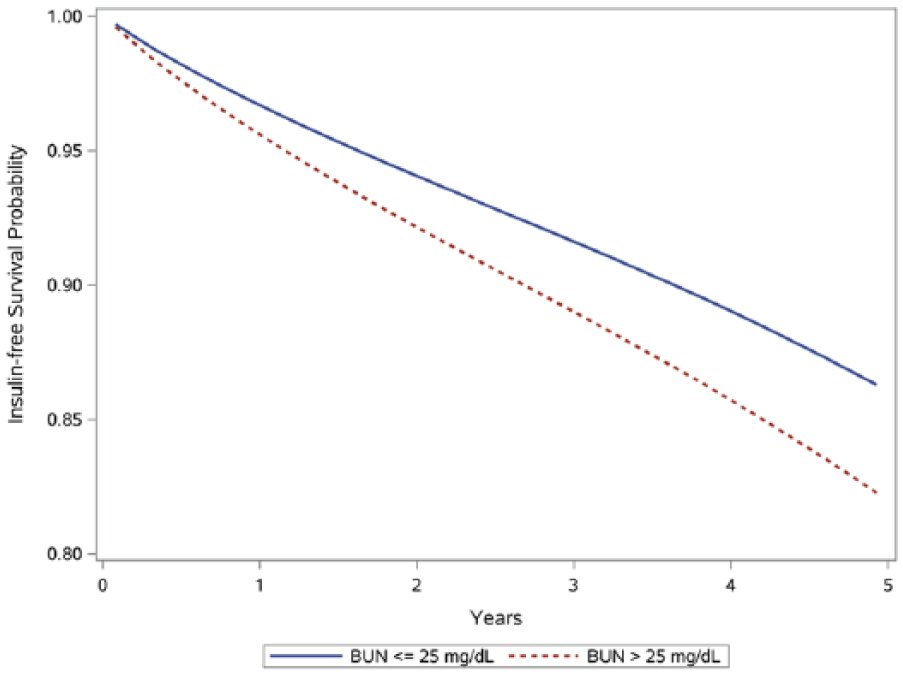
Adjusted survival curves for risk of insulin use by BUN categories.
Association between BUN and risk of insulin use among people with diabetes and eGFR > 60 mL/min per 1.73 m2
Spline analyses fully adjusted for demographics, health characteristics and other relevant covariates where BUN was treated as a continuous function suggested that the relationship between BUN and the risk of insulin use was relatively neutral below a BUN level of 25 mg/dL and increased exponentially with increased BUN levels above 25 mg/dL (Figure 3). In multivariate Cox survival models, compared to those with BUN ⩽ 25 mg/dL, those with BUN > 25 mg/dL had an increased risk of insulin use [hazard ratio (HR) = 1.40; CI = 1.30–1.50]. In models, which additionally controlled for HbA1c at time zero (as a cubic function), BUN > 25 mg/dL was associated with an increased risk of insulin use (HR = 1.39; CI = 1.28–1.50). The risk was also increased in time-dependent analyses where HbA1c was considered as a linear continuous variable (HR = 1.38; CI = 1.28–1.50) and as a cubic function (HR = 1.45; CI = 1.34–1.57).
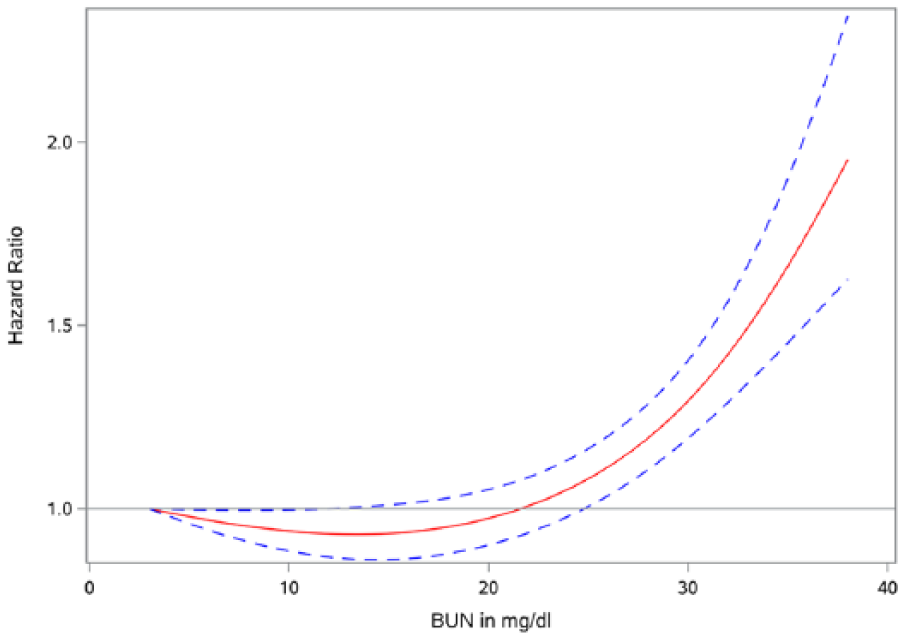
Spline analysis of the relationship between BUN (in mg/dL) and risk of incident insulin use. BUN = 3 mg/dL was the reference.
In two-step residual estimation models which evaluated the impact of BUN on the risk of insulin use independent of eGFR, every 10-mg/dL increase in BUN was associated with an HR of 1.10 (CI = 1.07–1.13). Inclusion of HbA1c (as a cubic function) in these models yielded consistent results in that every 10-mg/dL increase in BUN was associated with an increased risk of insulin use (HR = 1.16; CI = 1.12–1.20). In marginal structural models, which accounted for time-dependent confounders, BUN > 25 mg/dL was associated with an increased risk of insulin use (HR = 1.27; CI = 1.15-1.40). Two-step residual estimation model in pseudo-population based on marginal structural models showed that every 10-mg/dL increase in BUN was associated with an HR of 1.12 (1.08-1.16). There was no statistically significant interaction in formal analyses conducted to specifically examine if medication class (biguanides, sulfonylurea or thiazolidinedione) modified the association of BUN and risk of insulin use.
Sensitivity analyses
To evaluate robustness of the study results, we developed the following sensitivity analyses. To ensure that cohort participants were on non-insulin hypoglycaemic agents for a meaningful duration of time, we excluded those who were started on insulin within 30 days of cohort entry (BUN > 25 mg/dL was associated with an increased risk of insulin use; HR = 1.32; CI = 1.22–1.42) and, in separate analyses, we excluded those who started insulin within 90 days of cohort entry (BUN > 25 mg/dL was associated with an increased risk of insulin use; HR = 1.31, CI = 1.21–1.42). To further examine the association in those with BUN < 25 mg/dL, we considered BUN categorized as ⩽15, 15–25 and >25 mg/dL; compared to BUN ⩽ 15 mg/dL, the risk was neutral in those with BUN between 15 and 25 mg/dL (HR = 1.02; CI = 0.99-1.05) and increased among those with BUN > 25 mg/dL (HR = 1.41; CI = 1.31-1.52). The results were consistent in analyses which included the number of BUN measurements as a time-varying covariate (HR = 1.38; CI = 1.29–1.49) and the number of HbA1c measurements as a time-varying covariate (HR = 1.38; CI = 1.28–1.50). Since the failure of non-insulin hypoglycaemic agents or requiring insulin may be contextually related to BMI, we evaluated the relationship in BMI strata; the results suggest a consistent association in all BMI categories (underweight, normal weight, overweight and obese).
We repeated the analyses in a secondary cohort of participants with an eGFR between 30 and 60 mL/min per 1.73 m2. Compared to BUN ⩽ 25 mg/dL, BUN > 25 mg/dL was associated with an increased risk of insulin use with an HR of 1.36 (CI = 1.28–1.45). In two-step residual estimation analyses (to evaluate the independent impact of BUN on the outcome), every 10-mg/dL increase in BUN was associated with an HR of 1.16 (CI = 1.14–1.19). Spline analyses of the relationship between BUN and risk of insulin use was consistent with primary analyses and showed an increased risk of insulin use with increased BUN concentrations (Supplemental Figure 1).
Discussion
In this work, we show that the BUN levels are associated with an increased risk of insulin use in people with incident diabetes on non-insulin hypoglycaemic agents and an eGFR > 60 mL/min per 1.73 m2. The results were consistent in the analyses which accounted for relevant covariates and HbA1c, in two-step residual estimation models (designed to estimate the independent impact of BUN on the outcome) and in marginal structural models designed to account for time-dependent confounders. The results were robust to challenge in multiple sensitivity analyses including those with an eGFR between 30 and 60 mL/min per 1.73 m2. Taken together, the constellation of findings suggests that BUN is associated with an increased risk of insulin use.
In our spline analyses, we observed that the relationship between BUN and risk of insulin use (risk of failure of non-insulin hypoglycaemic agents) appears to start around a BUN level of 25 mg/dL and appears to progressively become more pronounced as BUN increased above that threshold. Since BUN and eGFR are intimately intertwined, and given the wide variations in prescription of non-insulin hypoglycaemic agents in patients with reduced renal function as well as our concern that some practitioners may switch a patient from non-insulin hypoglycaemic agent to insulin as the eGFR declines, we opted to perform the main analyses in a primary cohort of those with eGFR > 60 mL/min per 1.73 m2. Furthermore, in order to evaluate the independent effect of BUN (independent of eGFR), we applied a two-stage residual inclusion analyses. The results were consistent in that there was always a significant relationship between higher levels of BUN and risk of insulin use. The results were also reproduced in a cohort of participants with an eGFR between 30 and 60 mL/min per 1.73 m2.
The results are consistent with – and provide contextual clinical relevance for – the experimental laboratory evidence in vitro and in vivo that urea suppresses insulin secretion and reduces insulin secretion; however, our studies cannot attribute the observed effect to reduced insulin secretion (and beta cell dysfunction) or increased insulin resistance or a combination of both. This report is also consistent with the emerging epidemiologic evidence that higher levels of BUN are associated with an increased risk of incident diabetes 14 and much earlier observations which did not examine BUN levels but reported that low-protein diet (which has been shown to reduce BUN levels) ameliorates insulin resistance in uremic patients. 31 The findings of this study further expand our prior knowledge by describing a relationship between elevated BUN levels and risk of insulin use among people with incident diabetes on non-insulin hypoglycaemic agents. The corollary observation is that higher BUN levels are associated with a greater risk of failure of non-insulin hypoglycaemic agents. Whether interventions by pharmacologic means, dietary changes, microbiome engineering or other methods might reduce the need for oral or other non-insulin hypoglycaemic agents, improve responsiveness to them when prescribed and reduce the risk of requiring insulin use in diabetes remains to be tested. While our studies reported on the relationship of BUN and risk of insulin use in persons with an eGFR > 60 mL/min per 1.73 m2, we note that in advanced chronic kidney disease and particularly in end-stage renal disease insulin requirements are generally decreased because of impaired exogenous insulin excretion by the kidneys and relative improvement in insulin resistance following the clearance of uremic toxins – including BUN – with dialysis. 32 Woven together, the totality of our findings provides an epidemiologic basis for and will inform the conceptualization and design of future research endeavours (additional experimental studies, clinical trials and epidemiologic investigations) to develop a greater understanding of the role of urea and its downstream effect on glucose homeostasis in humans.
Our study has a number of limitations. The analytic cohort included mostly older white male US Veterans which may limit the generalizability of the study results. Although we accounted for known confounders, we cannot exclude the possibility of residual confounders (either unmeasured or unknown). In addition, given the correlated relationship between eGFR and BUN, we developed analytic strategies to disentangle the effects of eGFR and BUN where we built two-step residual estimation models to evaluate the independent impact of BUN on the risk of insulin use. 24 The study has several strengths including the use of national large-scale data from a network of integrated health systems which was captured during routine medical care thus minimizing selection bias. We developed analytic strategies including time-varying models to account for changes in BUN over time, spline analyses to characterize the shape of the association between BUN and the risk of insulin use, and marginal structural models to test causal inference. Furthermore, the results were validated in a number of sensitivity analyses. In sum, our results show an association between higher levels of BUN and risk of insulin use. Future research should examine whether the modulation of urea levels improves control, reduces risk of insulin requirement and reduces risk of untoward outcomes in diabetes.
Footnotes
Acknowledgements
Support for VA/Centers for Medicare and Medicaid Services (CMS) data is provided by the Department of Veterans Affairs, Veterans Health Administration, Office of Research and Development, Health Services Research and Development, VA Information Resource Center (Project Number/Data Use Agreement ID Al-Aly-01). The contents do not represent the views of the United States Department of Veterans Affairs or the United States Government.
Declaration of conflicting interests
The author(s) declared no potential conflicts of interest with respect to the research, authorship and/or publication of this article.
Funding
The author(s) disclosed receipt of the following financial support for the research, authorship, and/or publication of this article: This work was funded by a grant from the United States Department of Veterans Affairs (for Z.A.-A.). The funders of this study had no role in study design; collection, analysis, and interpretation of data; writing the report; and the decision to submit the report for publication.