
Abstract
Purpose:
To compare the lamina cribrosa thickness and anterior lamina cribrosa depth between patients with and without diabetes mellitus and to investigate the effect of metabolic control and duration of diabetes mellitus on lamina cribrosa thickness and anterior lamina cribrosa depth using enhanced depth imaging spectral-domain optical coherence tomography.
Methods:
A total of 70 patients were enrolled in this cross-sectional study and were divided into the diabetes and control groups. Intraocular pressure, circumpapillary retinal nerve fibre layer thickness, anterior lamina cribrosa depth and lamina cribrosa thickness were compared between the groups.
Results:
In the control group, the mean intraocular pressure was 14.6 ± 3.1 (mean ± standard deviation) mmHg, mean circumpapillary retinal nerve fibre layer thickness was 105.41 ± 5.86 μm, mean anterior lamina cribrosa depth was 420.3 ± 90.2 μm and mean lamina cribrosa thickness was 248.5 ± 5.4 μm. In the diabetes group, the mean intraocular pressure was 13.9 ± 2.2 mmHg, mean circumpapillary retinal nerve fibre layer thickness was 101.37 ± 10.97 μm, mean anterior lamina cribrosa depth was 351.4 ± 58.6 μm and mean lamina cribrosa thickness was 271.6 ± 33.9 μm. Lamina cribrosa thickness was significantly higher (p < 0.001) and anterior lamina cribrosa depth was significantly lower (p = 0.003) in the diabetes group. There was no statistical difference between the groups with regard to age, spherical equivalent, axial length, circumpapillary retinal nerve fibre layer thickness and intraocular pressure (p = 0.69, 0.26, 0.47, 0.06 and 0.46, respectively). Lamina cribrosa thickness and anterior lamina cribrosa depth were not significantly correlated with duration of diabetes mellitus (lamina cribrosa thickness: r = −0.078, p = 0.643; anterior lamina cribrosa depth: r = −0.062, p = 0.710) or HbA1c levels (lamina cribrosa thickness: r = −0.078, p = 0.596; anterior lamina cribrosa depth: r = −0.228, p = 0.169).
Conclusion:
The results of this study showed that the optical coherence tomography measurement of lamina cribrosa revealed thicker and more anteriorly positioned lamina cribrosa for patients with diabetes mellitus compared with those for healthy controls.
Keywords
Introduction
Primary open-angle glaucoma (POAG) is a chronic progressive optic neuropathy. The resultant loss of retinal ganglion cells (RGCs) and their axons leads to a characteristic acquired optic atrophy. 1 The lamina cribrosa is a mesh-like structure that surrounds and protects the RGC axons at the optic nerve head.2–4 Deformation and displacement of the lamina cribrosa can block the axoplasmic flow within RGC axons.5–7 Thus, the lamina cribrosa is a key site for axonal injury in glaucomatous optic neuropathy.
A histologic study has shown deformation of the posterior lamina cribrosa in monkey eyes with induced glaucoma. 8 Deepening of the anterior lamina cribrosa, which occurs secondary to a posterior shift and/or thinning of the lamina cribrosa, causes mechanical stress on the optic nerve head. Recent advances in optical coherence tomography (OCT) have enabled visualization of the lamina cribrosa in clinical settings. 9 OCT images of eyes with POAG have shown lamina cribrosa deformations such as increased anterior lamina cribrosa depth (ALCD) and decreased lamina cribrosa thickness (LCT).10–12
Diabetes mellitus (DM) is a systemic disease characterized by hyperglycaemia secondary to insulin deficiency or insulin resistance. Increased apoptosis of RGCs and early RGC death have been reported in diabetic eyes.13,14 It has also been reported that several proapoptotic molecules are expressed by ganglion cells in diabetic retinas. 14 Experiments with animal models have shown that retrograde axonal transport in large- and medium-sized RGCs is damaged in diabetic eyes before optic nerve involvement.15,16 Development of diabetic optic neuropathy may be attributed to increased accumulation of advanced glycation end products in cribriform plates and in the vicinity of optic nerve vessels. 17 However, to date, no study has assessed the association between DM and morphological changes in the lamina cribrosa. In this study, we compared the thickness and depth of the lamina cribrosa between diabetic and non-diabetic eyes using enhanced depth imaging OCT.
Methods
Study design and subjects
This was a prospective, observational cross-sectional study with participants recruited at the Kayseri Training and Research Hospital. Those in the diabetes group were recruited from the Department of Endocrinology and Metabolic Disorders clinic and those in the control group were recruited from the outpatient clinic.
All participants were Turkish citizens of Caucasian origin. Demographic data were collected, and participants were asked about the presence of systemic diseases. One eye per subject was randomly selected if both eyes were eligible.
In the diabetes group, all participants had been diagnosed with type 2 DM using current guidelines published by the American Diabetes Association. 18 They were all receiving oral antidiabetic medication or insulin therapy. Duration of DM was recorded. HbA1c measurements and ophthalmic assessments were performed on the same day. The control group included age- and sex-matched individuals with good general and ocular health. All participants in the control group had good visual acuity and no retinal disease.
Informed consent was obtained from all participants before the study commenced. The study protocol conformed to the tenets of the Declaration of Helsinki and was approved by the local medical ethics committee.
Ophthalmic examination
The study population of 70 eyes, 38 from participants with type 2 DM and 32 from control participants, was examined between July 2016 and February 2017. Each participant underwent a complete ophthalmic examination that included central corneal thickness (CCT), keratometry measured using a Scheimpflug camera (Pentacam HR; Oculus GmbH, Wetzlar, Germany), axial length (AL) of the eye measured with the IOL Master (Carl Zeiss Meditec, Dublin, CA), slit-lamp biomicroscopy, fundus examination and gonioscopy. Refraction was measured using a Tonoref II autorefractor/tonometer (Nidek Co. Ltd., Japan). The spherical equivalent (SE) was calculated as the sum of the sphere value and half the cylindrical value. Intraocular pressure (IOP) was measured using Goldmann applanation tonometry. Visual fields were assessed with the Humphrey field analyzer using the central 24-2 fields and with the Swedish Interactive Thresholding Algorithm standard strategy. Visual field reliability criteria included < 20% fixation loss and < 20% false-negative and false-positive rates. All participants undertook and passed the Glaucoma Hemifield Test (mean and pattern standard deviations within normal limits) and had no characteristic glaucomatous visual-field defects.
The circumpapillary retinal nerve fibre layer (cpRNFL) thickness measurements were obtained using the Spectralis Spectral-Domain Optical Coherence Tomography (SD-OCT). The OCT scanning circle (diameter, 3.4 mm) was manually positioned at the centre of the optic disc by experienced operators, and the average peripapillary RNFL thickness was recorded in micrometres.
Glaucoma and ocular hypertension were excluded using criteria of IOP < 21 mmHg and normal optic nerve appearance on a nonglaucomatous, standard automated perimetry visual field examination. Exclusion criteria were a history of surgery or laser treatment, any retinal disease, neurologic diseases affecting the optic disc or visual field, tilted discs or nonglaucomatous optic disc atrophy, and any significant media opacity that obscured the fundus.
Lamina cribrosa assessment
SD-OCT scans taken with a Heidelberg Spectralis SD-OCT imaging platform with an enhanced depth imaging programme (Heidelberg Engineering, Heidelberg, Germany) were used to measure LCT and ALCD of participants. Scans were excluded from the analysis if they had a quality score of < 20 or they provided an unclear image of the fundus or the border of the lamina cribrosa.
The method for enhanced depth imaging of the optic nerve head with an SD-OCT device is published elsewhere. 19 Briefly, the SD-OCT device was set to image a 15° × 10° rectangle centred on the optic disc. This rectangle was divided into approximately 65 sections, each comprising an average of 100 OCT frames. From these horizontal B scans, we selected three frames (centre, midsuperior, and midinferior) that passed through the optic nerve head, and parameters were measured in each of these frames. During measurement, the centre of lamina cribrosa plate was used for thickness.
Figure 1 depicts OCT images of lamina cribrosa borders and Bruch’s membrane opening in a participant with DM and a control. The Bruch’s membrane opening is defined as the line that connects both ends of Bruch’s membrane. Distances were measured on the line perpendicular to the reference line. Parameters were measured as close as possible to the vertical centre of the optic nerve head. When a vessel trunk made the measurement impossible, measurements were recorded at the temporal side. Anterior and posterior borders of the highly reflective region at the vertical centre of the optic nerve head in horizontal SD-OCT cross-sections were defined as lamina cribrosa borders, and the distance between them was defined as LCT.
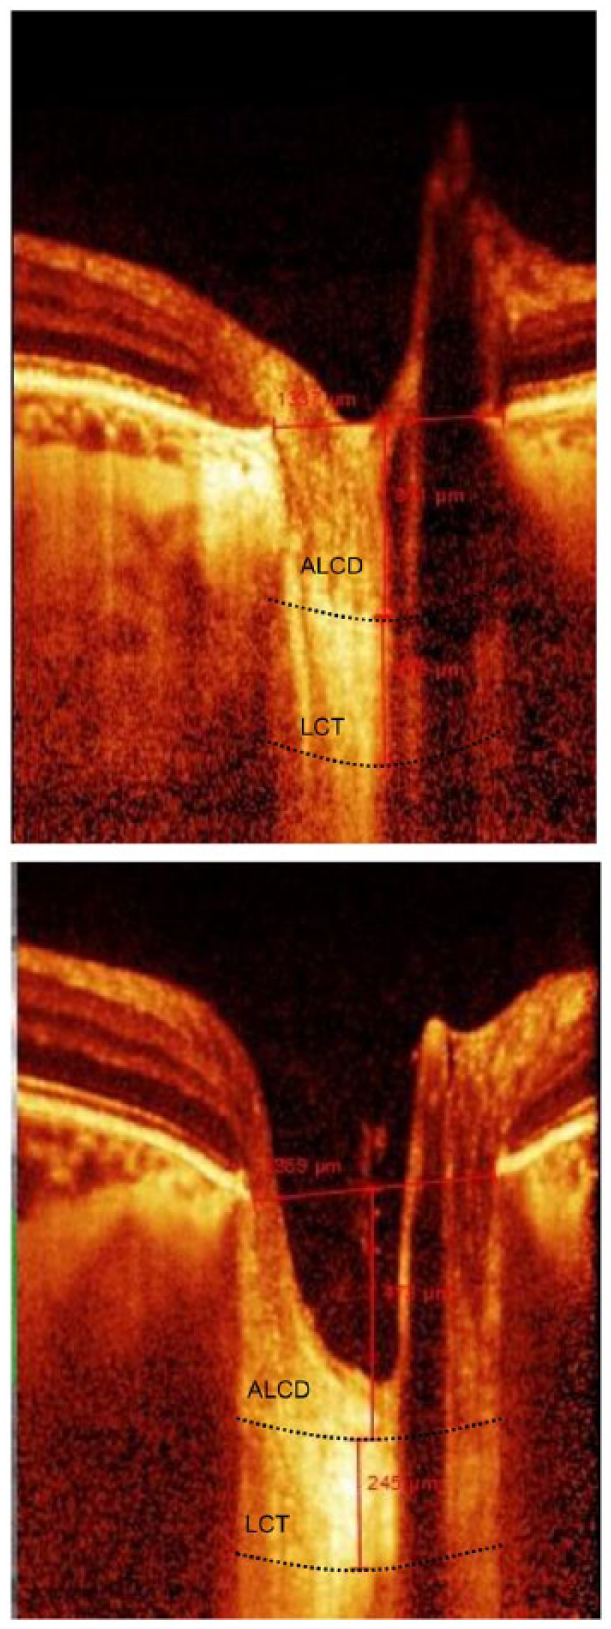
Optical coherence tomographic (OCT) images of a 58-year-old patient in the diabetes group and a 56-year-old in the control group. (Top) The right eye of the patient with diabetes: lamina cribrosa thickness = 278 µm; anterior lamina cribrosa depth = 371 µm. (Bottom) The right eye of the control: lamina cribrosa thickness = 245 µm; anterior lamina cribrosa depth = 473 µm.
Adjustment of contrast settings aided in the identification of images that provided the clearest visualization of the lamina cribrosa. ALCD was defined as the distance between the Bruch’s membrane opening and the anterior border of the lamina cribrosa. Measurements were obtained using HEYEX software 6.0 (Heidelberg Engineering Inc., Heidelberg, Germany). All images were independently analysed by two examiners (S.A. and B.K.), who determined LCT and ALCD twice. Thus, each LCT and ALCD value was calculated four times, and the mean was used in the primary analysis. Prior to the primary analysis, reproducibility of the LCT and ALCD measurements was tested by calculating interexaminer and intraexaminer intraclass correlation coefficients using 15 randomly selected images.
Two ophthalmologists measured all parameters on these images and masked inter- and intraobserver reproducibility of measurements was evaluated, and comparison revealed a Spearman correlation coefficient of >0.90.
Statistical analyses
Baseline characteristics of the members of the diabetes and control groups were compared. The Shapiro–Wilk test was used to test normality before using parametric tests. Parametric data were compared using Student’s t-test, and non-parametric data were compared using the Mann–Whitney U test. The chi-square test was used to compare categorical data. The Pearson correlation coefficient was used when two variables were measured, and the Spearman correlation coefficient was used when variables were non-parametric. The analysis of covariance (ANCOVA) test was used to account for the effects of age, sex and AL values on significant differences between the groups. Age, sex and AL values were set as covariates in the ANCOVA test. Logarithmic transformation was used to convert non-parametric data to parametric data where needed. A p-value of <0.05 was considered significant. Statistical analyses were performed using SPSS version 21.0 (SPSS, Inc., Chicago, IL, USA).
Results
The study included 32 eyes from 32 healthy controls (23 women, 9 men) and 38 eyes from 38 participants with DM (28 women, 10 men). The mean ± standard deviation age of the included subjects was 58.6 ± 7.7 years and 59.1 ± 7.4 years for the control and diabetes groups, respectively (p = 0.696). Gender distribution was similar between the groups (p = 0.473). In the diabetes group, mean HbA1c at the time of the study was 7.24% ± 1.5%, and mean duration of DM was 8.2 ± 5.2 years.
Table 1 shows the results of Goldmann applanation tonometry, Pentacam, enhanced depth imaging OCT, and biometric parameters of the studied eyes.
Ocular characteristics of study participants.
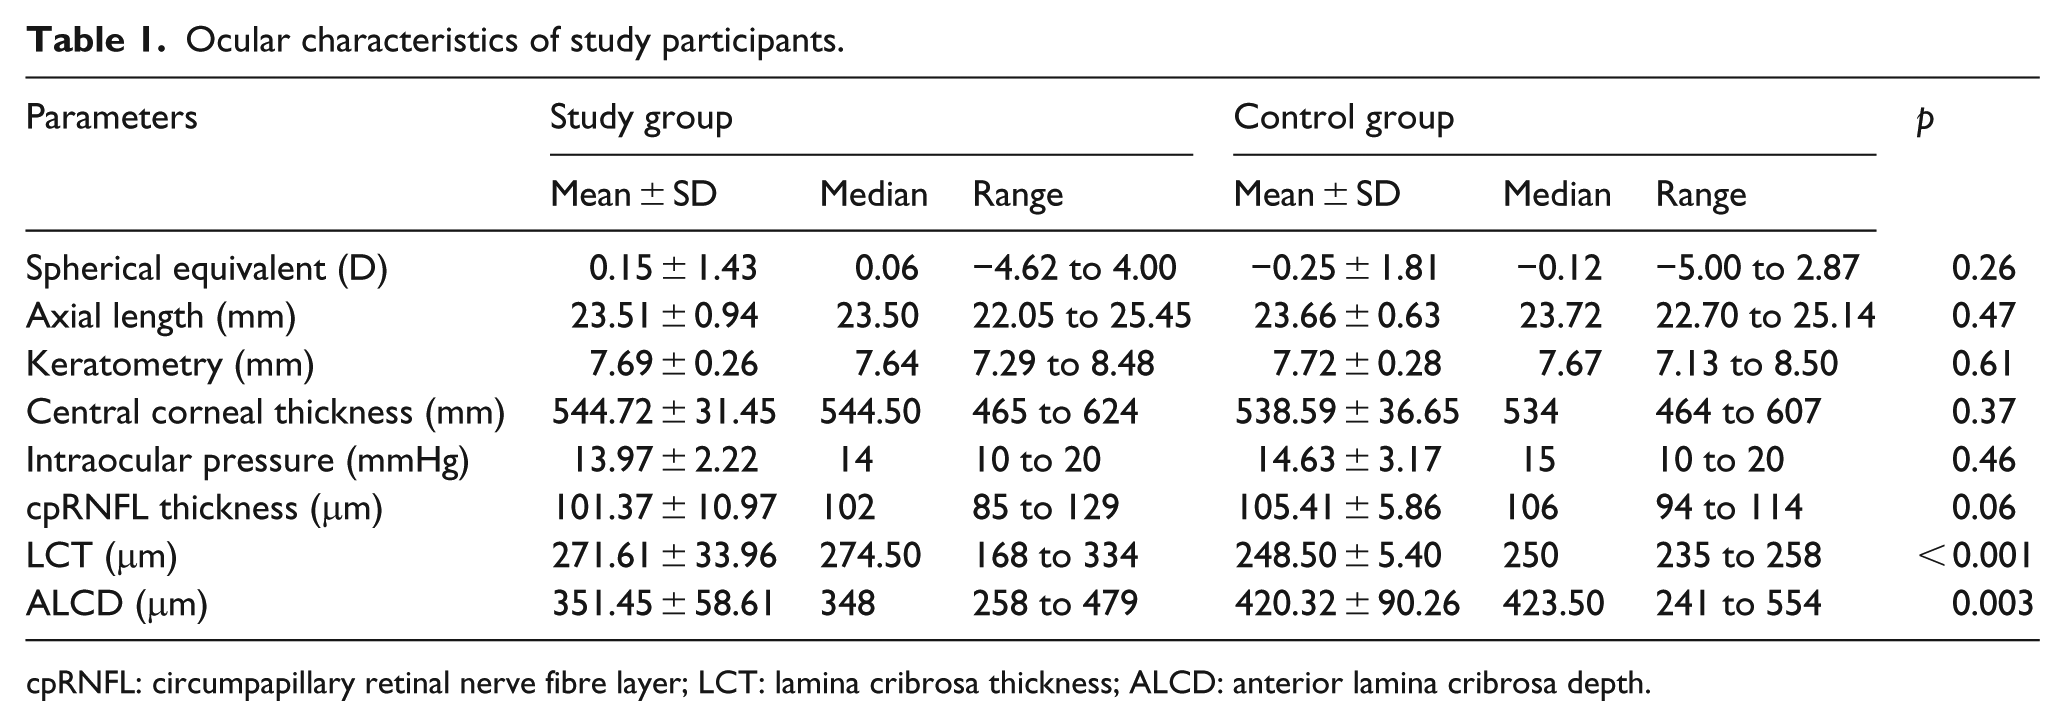
cpRNFL: circumpapillary retinal nerve fibre layer; LCT: lamina cribrosa thickness; ALCD: anterior lamina cribrosa depth.
Intraexaminer intraclass correlation coefficient values [95% confidence intervals (CIs)] for LCT and ALCD were 0.895 (0.751–0.969) and 0.974 (0.916–0.992), respectively. Interexaminer intraclass correlation coefficients (95% CIs) for LCT and ALCD were 0.849 (0.761–0.979) and 0.943 (0.816–0.972), respectively.
LCT was significantly higher (271.6 ± 33.9 μm vs 248.5 ± 5.4 μm, p < 0.001) and ALCD was significantly lower (351.4 ± 58.6 μm vs 420.3 ± 90.2 μm, p = 0.003) in participants with DM than in control subjects (Figure 2).
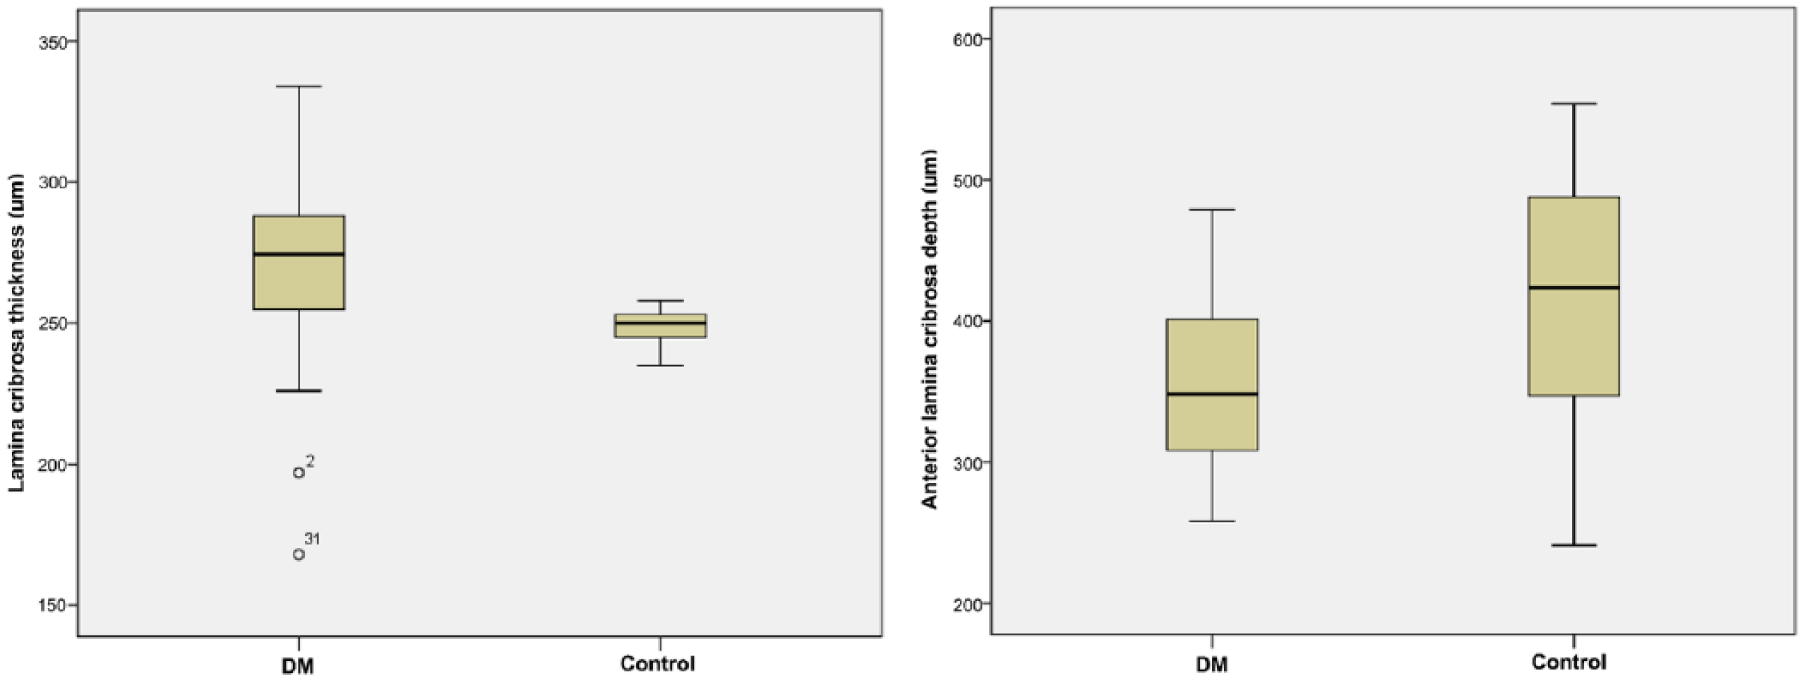
Comparison of lamina cribrosa thickness (LCT) and anterior lamina cribrosa depth (ALCD) in patients with diabetes and healthy controls. LCT was 271.6 ± 33.9 μm in the diabetes group and 248.5 ± 5.4 μm in the control group. ALCD was 351.4 ± 58.6 μm in the diabetes group and 420.3 ± 90.2 μm in the control group. LCT was significantly higher (p < 0.001) and ALCD was significantly lower (p = 0.003) in patients with diabetes mellitus than in healthy controls.
The effects of possible confounding factors (age, sex and AL) on the differences in LCT and ALCD measurements between the two groups were investigated using an ANCOVA test, after logarithmic transformation of non-parametric data to parametric data. None of the potential confounders had a significant effect on the initial statistical comparisons. The statistical significances of age, sex and AL after ANCOVA test were 0.196, 0.799 and 0.342, respectively, for LCT, and 0.144, 0.176 and 0.998, respectively, for ALCD.
Mean SE, AL, CCT, IOP, cpRNFL thickness and keratometry measurements did not show any significant differences between the two groups (p = 0.26 for SE, p = 0.47 for AL, p = 0.37 for CCT, p = 0.46 for IOP, p = 0.06 for cpRNFL thickness and p = 0.61 for keratometry).
Correlation analyses in the diabetic group showed that LCT and ALCD were not significantly correlated to duration of DM (r = −0.078, p = 0.643 for LCT; r = −0.062, p = 0.710 for ALCD) or HbA1c levels (r = −0.078, p = 0.596 for LCT; r = −0.228, p = 0.169 for ALCD; Figure 3).
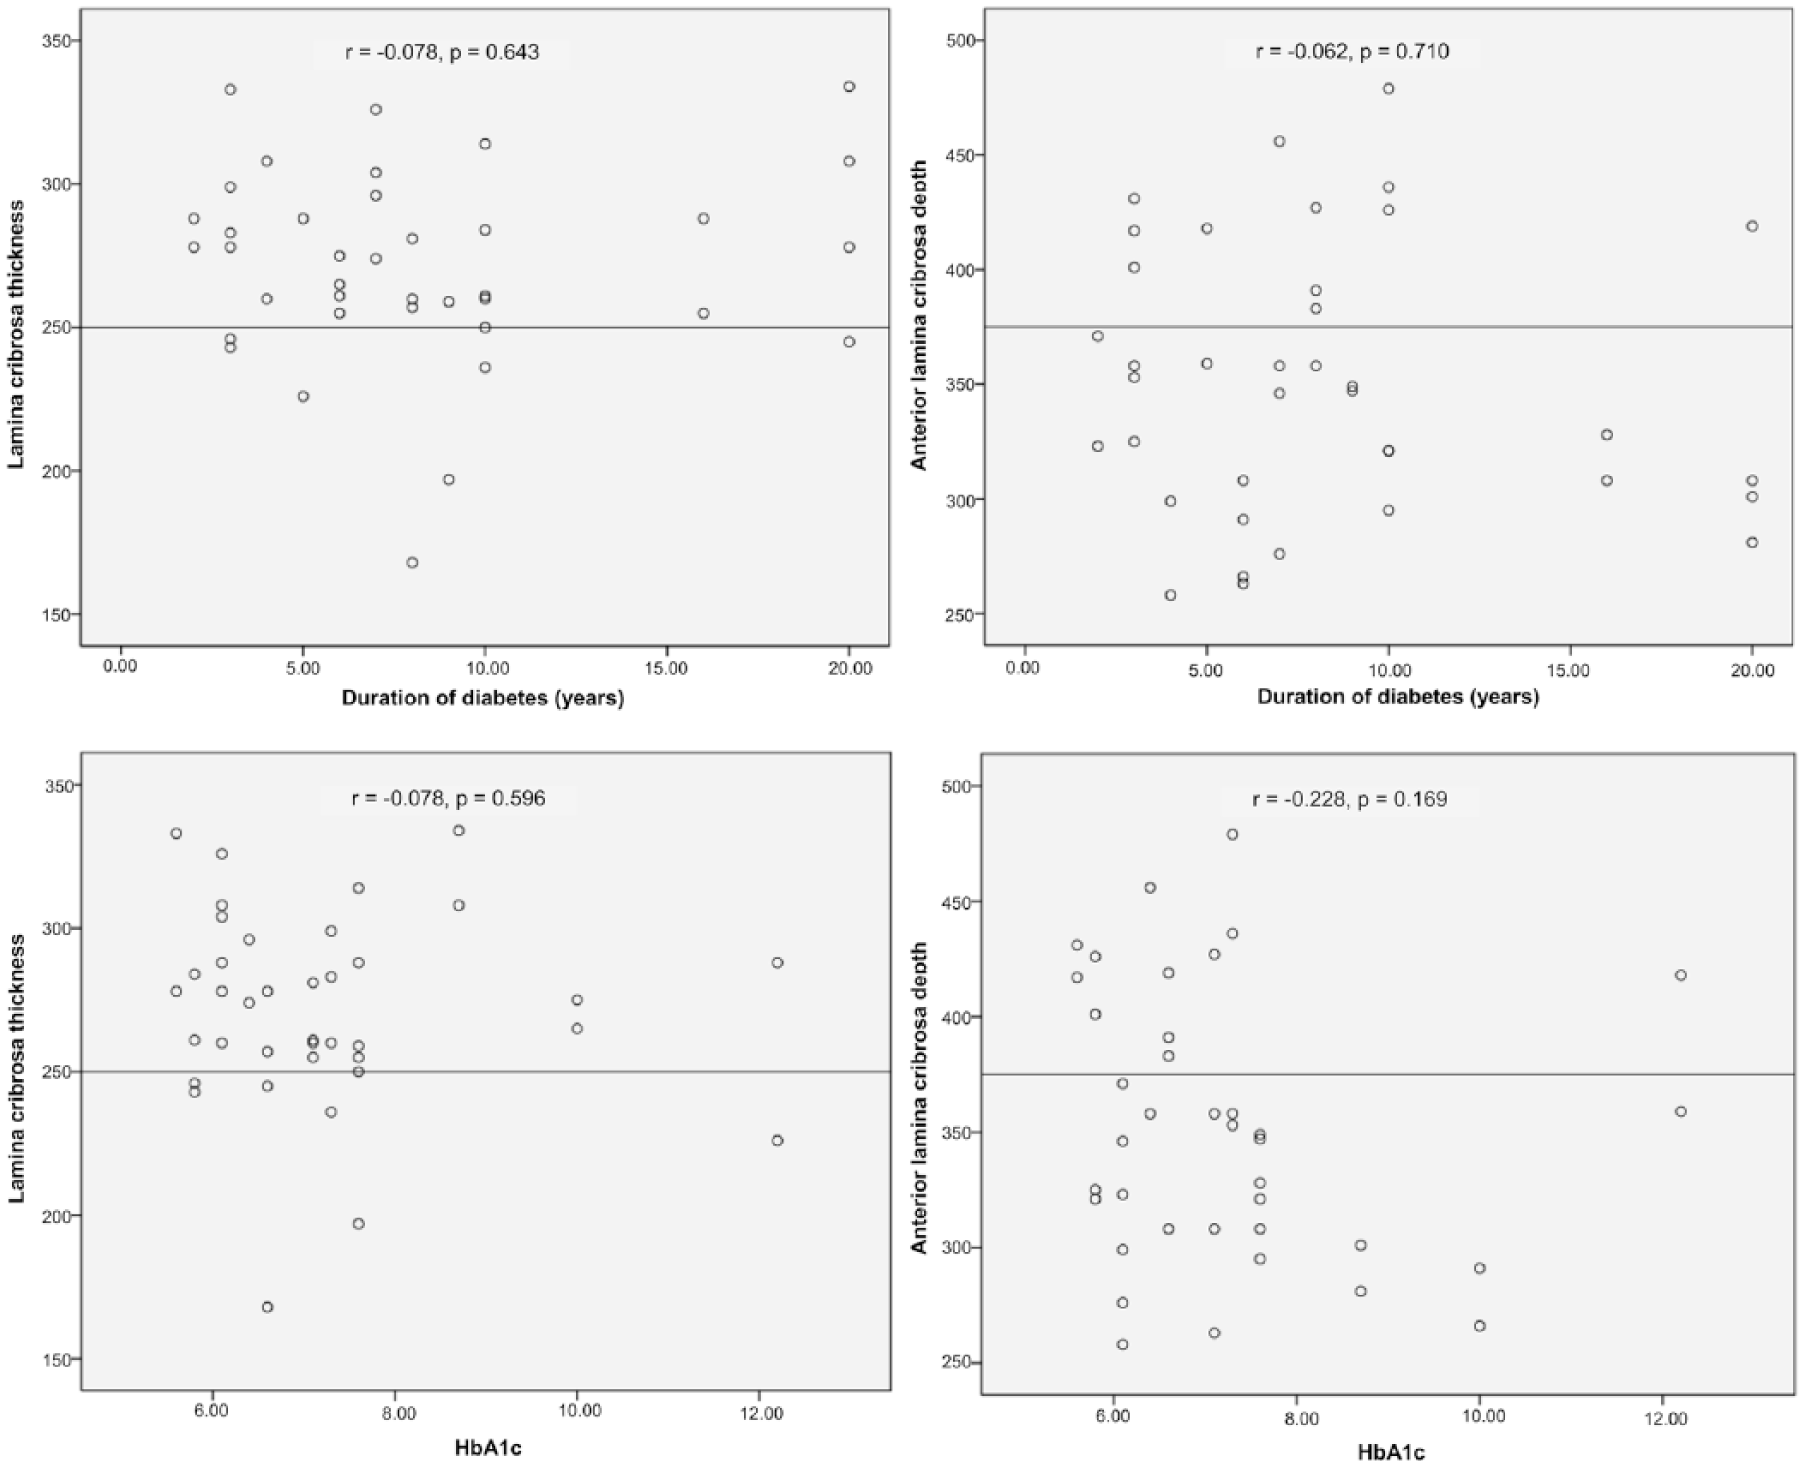
Correlation of HbA1c and duration of diabetes mellitus (DM) with lamina cribrosa thickness (LCT) and anterior lamina cribrosa depth (ALCD). In the diabetes group, LCT and ALCD were not associated with DM duration (r = −0.078, p = 0.643 for LCT; r = −0.062, p = 0.710 for ALCD) or metabolic control (r = −0.078, p = 0.596 for LCT; r = −0.228, p = 0.169 for ALCD).
The diabetes group was subdivided into two groups according to disease duration. There were 20 participants with disease duration of ⩽8 years and 18 with disease duration of >8 years. Differences in LCT and ALCD measurements between these groups were not significant (p = 0.174 and p = 0.447, respectively). Similarly, the diabetes group was subdivided into two groups according to HbA1c levels. Mean ± standard deviation for HbA1c levels for the two groups were 6.17 ± 0.40 (n = 19) and 8.31 ± 1.62 (n = 19). LCT and ALCD measures did not differ significantly between the groups (p = 0.682 and p = 0.599, respectively).
Discussion
Worldwide, DM and glaucoma are two major causes of vision loss. 20 The relationship between DM and glaucoma is not well understood and is currently the subject of much debate. With contradictory study outcomes over the last few decades, possible interaction mechanisms between DM and glaucoma and the associated risks are currently unclear. Some population-based studies have shown that patients with DM are at increased risk of developing glaucoma and experiencing severe glaucoma.21,22 However, other studies have found no such association.23,24 There is a need for more extensive, in-depth studies.
It has been suggested that because DM causes microvascular damage and vascular dysregulation of the retina and the optic disc, it increases the susceptibility of the optic nerve head to damage.25,26 In contrast, some studies have found that DM inhibits the development of glaucoma.27,28 The Ocular Hypertension Treatment Study found that of the 191 participants who reported a history of DM at baseline, 6 (3.1%) developed POAG compared to 119 (8.3%) of the 1427 participants who had no history of DM. 27 The univariate hazard ratio for DM was 0.40, and multivariate hazard ratio was 0.37. 27 After publication of the Ocular Hypertension Treatment Study report, the correlation between DM and glaucoma was questioned, 29 or even denied.30,31
Our recent study using Heidelberg retina tomography III found that the rim area and rim volume were significantly increased in patients with POAG and DM compared to those without DM, suggesting a protective effect of DM against glaucomatous optic nerve damage. 28 Short-term hyperglycaemia protects retinal neurons, including RGCs, against ischaemic injury 32 and RGCs and optic nerve axons against ocular hypertension injury, as reported in rats with diabetes that experienced less nerve fibre loss under high IOP stress. 33 It has also been reported that hyperglycaemia protected axons from tumour necrosis factor-induced optic nerve degeneration. 34
In 2009, Quigley hypothesized that DM was neuroprotective because the diabetic breakdown of the blood–retina barrier led to leakage of neuroprotective vascular endothelial growth factor 35 and induced a preischaemic survival mechanism. 36 Diabetic glycation of connective tissue also reinforces the lamina cribrosa and protects the nerve fibres.37,38
This study investigated whether DM affected OCT measurements of the lamina cribrosa and whether glycaemic control had any further impact. This was the first study to investigate the effects of DM and glycaemic control on the lamina cribrosa. It revealed a thicker and more anteriorly positioned lamina cribrosa in participants with DM than in healthy subjects. These findings support the neuroprotective effect of DM on glaucomatous optic neuropathy and suggest that LCT and lamina cribrosa position mediates this protective effect.
The eyes of patients with DM have more cross-linking of collagen through the process of glycation. 39 This could increase the stiffness of the cornea and sclera, reducing the strain at the optic nerve head and reinforcing the lamina cribrosa against IOP-induced stress. Through this mechanism, the eyes of patients with DM could more effectively resist the damaging effects of IOP.
Our study demonstrated no statistically significant difference between the duration of DM or HbA1c levels and lamina cribrosa OCT measurements.
This result led us to consider whether disease duration and level of glycaemic control had any impact on lamina cribrosa measurements. These findings highlight the need for longitudinal and prospective studies about the impact of disease duration and metabolic control on lamina cribrosa OCT measurements in patients with DM.
This study has several limitations. It was a cross-sectional, single hospital-based study with a small number of participants. As OCT depends on light waves, the contrast of the signals in deeper tissue is lower, even when using enhanced depth imaging. Therefore, identifying the deeper border of the lamina cribrosa was relatively subjective in excluded few individuals. For more sophisticated analysis, a prospective study with a larger number of participants and the ability to conduct deeper tissue imaging will be necessary.
Within the constraints of our study, we have concluded that DM may have a protective effect over glaucomatous optic nerve damage and that this effect is associated with the thickness and position of the lamina cribrosa. However, this finding will need to be verified by more extensive, longitudinal studies.
Footnotes
Declaration of conflicting interests
The author(s) declared no potential conflicts of interest with respect to the research, authorship and/or publication of this article.
Ethical approval
All procedures performed were in accordance with the ethical standards of the Kayseri Training and Research Hospital research committee and with the 1964 Helsinki declaration and its later amendments or comparable ethical standards.
Funding
The author(s) received no financial support for the research, authorship and/or publication of this article.
Informed consent
Informed consent was obtained from all individual participants included in the study.