
Abstract
Objective:
Women with gestational diabetes mellitus and milder gestational impaired glucose intolerance have elevated future risks of type 2 diabetes and cardiovascular disease. However, it is unclear whether they show postpartum evidence of vascular injury/dysfunction, an early event in the natural history of cardiovascular disease.
Methods:
In total, 337 women underwent a glucose challenge test and oral glucose tolerance test in pregnancy, yielding four gestational glucose tolerance groups: gestational diabetes mellitus, gestational impaired glucose intolerance, abnormal glucose challenge test with normal glucose tolerance on the oral glucose tolerance test and normal glucose challenge test with normal glucose tolerance. At 3 years postpartum, they underwent repeat oral glucose tolerance test (on which 69 women had pre-diabetes/diabetes) and measurement of the following serum markers of vascular injury/dysfunction: thrombomodulin, E-selectin, P-selectin, intercellular adhesion molecule-3 and vascular cell adhesion molecule-1.
Results:
At 3 years postpartum, mean adjusted vascular cell adhesion molecule-1 was the only vascular marker that differed across the previous gestational glucose tolerance groups. On multiple linear regression analysis, each strata of gestational dysglycaemia was an independent predictor of lower vascular cell adhesion molecule-1 at 3 years postpartum (gestational diabetes mellitus: p = 0.005; gestational impaired glucose intolerance: p = 0.003; abnormal glucose challenge test normal glucose tolerance: p = 0.0008), as was current pre-diabetes/diabetes (p = 0.01).
Conclusion:
Dysregulation of vascular cell adhesion molecule-1 may be an early event in the natural history of cardiovascular disease in women with recent glucose intolerance in pregnancy.
Introduction
Pregnancy provides a physiologic stress test for glucoregulatory physiology, such that the development of glucose intolerance in pregnancy identifies women who are at risk of developing pre-diabetes and type 2 diabetes mellitus (T2DM) in the future.1,2 This risk is proportional to the degree of antepartum dysglycaemia, such that it is highest in women who develop gestational diabetes mellitus (GDM), followed by those with milder levels of dysglycaemia such as gestational impaired glucose intolerance (GIGT). 3 In recent years, it has emerged that, compared to their peers, women with GDM also have an elevated future risk of cardiovascular disease (CVD)4–6 and that this risk is not dependent upon subsequent progression to T2DM. Moreover, even milder gestational dysglycaemia (such as GIGT) is associated with future risk of CVD. 5 It thus emerges that, as it does for T2DM, the spectrum of glucose tolerance in pregnancy identifies a gradient of future cardiovascular risk. In this context, the postpartum years following glucose intolerance in pregnancy can provide a model of the early natural history of CVD in women. 2
CVD represents the clinical culmination of a chronic progressive pathologic process that develops over the course of decades. An early manifestation of this process is endothelial dysfunction, which is associated with the dysregulation of circulating biomarkers.7–10 These vascular biomarkers include E-selectin, P-selectin, intercellular adhesion molecules and vascular cell adhesion molecules that mediate the recruitment of inflammatory cells from the circulation and their trans-endothelial migration early in the atherosclerotic process.7–10 Similarly, thrombomodulin is an integral membrane protein expressed on the surface of endothelial cells that can provide a serum marker of vascular injury.11,12 It is not known, however, whether the dysregulation of these vascular markers is a feature of the early years after gestational dysglycaemia. Thus, our objective in this study was to characterize the relationship between glucose intolerance in pregnancy and the following serum markers of vascular injury/dysfunction at 3 years postpartum: thrombomodulin, E-selectin, P-selectin, intercellular adhesion molecule-3 (ICAM-3) and vascular cell adhesion molecule-1 (VCAM-1).
Methods
This study was conducted in the setting of a prospective observational cohort study evaluating the relationship between glucose tolerance in pregnancy and metabolic function in the years after delivery. The study protocol has been previously described in detail 3 and has been approved by the Mount Sinai Hospital Research Ethics Board. All women have provided written informed consent for their participation.
Assessment in Pregnancy
At our institution, pregnant women are screened for GDM by 50 g glucose challenge test (GCT) in late second trimester, followed by referral for a diagnostic oral glucose tolerance test (OGTT) if the GCT is abnormal (defined as plasma glucose ⩾7.8 mmol/L at 1 h after ingesting 50 g glucose). For the study, women were recruited either before or after the GCT, and all participants completed a 3-h 100 g OGTT for determination of glucose tolerance status (regardless of the GCT result). As previously described, 3 the recruitment of women after an abnormal GCT is a feature of the design that serves to enrich the study population for those with varying degrees of gestational dysglycaemia. The GCT and OGTT enable stratification of the study population into the following four gestational glucose tolerance groups:
GDM – defined by ⩾2 glucose values on the OGTT meeting the National Diabetes Data Group (NDDG) diagnostic criteria;
GIGT – defined as only 1 glucose value on the OGTT above NDDG thresholds;
Abnormal GCT with normal glucose tolerance (abnormal GCT NGT) – defined as having NGT on the OGTT (no glucose values above NDDG thresholds), coupled with an abnormal preceding GCT;
Normal GCT NGT – defined as having NGT on the OGTT with a normal preceding GCT.
These four groups reflect the full spectrum of glucose tolerance in pregnancy and hence a range of future risk for T2DM and CVD.2,3,5
Assessment of 3 years postpartum
At 3 years postpartum, the study participants returned to the clinical investigation unit and underwent a 2-h 75 g OGTT, enabling determination of current glucose tolerance status, insulin sensitivity/resistance and beta-cell function, as previously described. 3 All OGTTs were performed in the morning after overnight fast, with venous blood samples drawn for the measurement of glucose and specific insulin at fasting and at 30, 60 and 120 min following ingestion of the glucose load. Specific insulin was measured with the Roche Elecsys 1010 immunoassay analyser and electrochemiluminescence immunoassay kit (Roche Diagnostics, Laval, QC).
Glucose tolerance status was defined on the OGTT according to current Canadian Diabetes Association guidelines. 13 Dysglycaemia refers collectively to pre-diabetes [impaired glucose tolerance (IGT), impaired fasting glucose (IFG) or combined IFG and IGT] and diabetes. The area under the glucose curve (AUCglucose) on the OGTT was calculated (by trapezoidal rule) to provide a continuous measure of glycaemia. Insulin sensitivity was measured on the OGTT with the Matsuda index, an established measure of whole-body insulin sensitivity that has been validated against the euglycaemic–hyperinsulinaemic clamp. 14 Insulin resistance (primarily hepatic) was measured by Homeostasis Model of Assessment (HOMA). 15 Beta-cell function was assessed on each OGTT with the Insulin Secretion-Sensitivity Index-2 (ISSI-2), a validated measure of beta-cell function that is analogous to the disposition index obtained from the intravenous glucose tolerance test. 16 The insulinogenic index/Homeostasis Model of Assessment of insulin resistance (HOMA-IR) was determined as an additional measure of beta-cell function. 17
The markers of vascular injury/dysfunction were measured from fasting serum samples drawn at the OGTT. Serum thrombomodulin, E-selectin, P-selectin and soluble ICAM-3 were measured by MSD MULTI-SPOT Vascular Injury Panel 1 assay (Meso Scale Diagnostics, Gaithersburg, MD). For each analyte, the respective lower limit of detection (LLD) and upper limit of detection (ULD) were as follows: thrombomodulin (LLD–ULD) (0.008–1000 ng/mL), E-selectin (0.2–1000 pg/mL), P-selectin (0.1–1000 pg/mL) and ICAM-3 (0.05–1000 pg/mL). Serum VCAM-1 was measured by MSD Multi-array (Meso Scale Diagnostics, Gaithersburg, MD), with LLD of 0.008 ng/mL and ULD of 1000 ng/mL.
Statistical analyses
All analyses were conducted using SAS9.4 (SAS Institute, Cary, NC). Continuous variables were tested for normality of distribution, and natural log transformations of skewed variables were used, where necessary, in subsequent analyses. Univariate differences across the four gestational glucose tolerance groups were assessed by analysis of variance or Kruskal–Wallis test for continuous variables and χ2 test or Fisher’s exact test for categorical variables (Table 1). Mean adjusted levels of thrombomodulin, E-selectin, P-selectin, ICAM-3 and VCAM-1 at 3 years postpartum were compared between the four gestational glucose tolerance groups after adjustment for diabetes risk factors [age, ethnicity, family history of diabetes, body mass index (BMI)], smoking and current glucose tolerance status (Figure 1, plot (i) of each panel). Similarly, mean adjusted levels of these vascular markers were compared between current glucose tolerance groups (normal, pre-diabetes/diabetes), after adjustment for the diabetes risk factors, smoking and preceding gestational glucose tolerance status (Figure 1, plot (ii) of each panel). Spearman’s correlation analysis was performed to assess the univariate associations of clinical and metabolic factors with the vascular biomarkers at 3 years postpartum (Table 2). To determine independent determinants of each of the vascular biomarkers, we conducted a series of multiple linear regression analyses of (dependent variables) thrombomodulin, E-selectin, P-selectin, ICAM-3 and VCAM-1, respectively. Each of the five multiple linear regression models included the following covariates: age, ethnicity, family history of diabetes, BMI, smoking, gestational glucose tolerance status, current glucose tolerance status, Matsuda index and the other four respective vascular markers.
Demographic, clinical and metabolic characteristics of study population at 3 years postpartum, stratified into the following four groups based on gestational glucose tolerance status: normal GCT NGT, abnormal GCT NGT, GIGT and GDM.
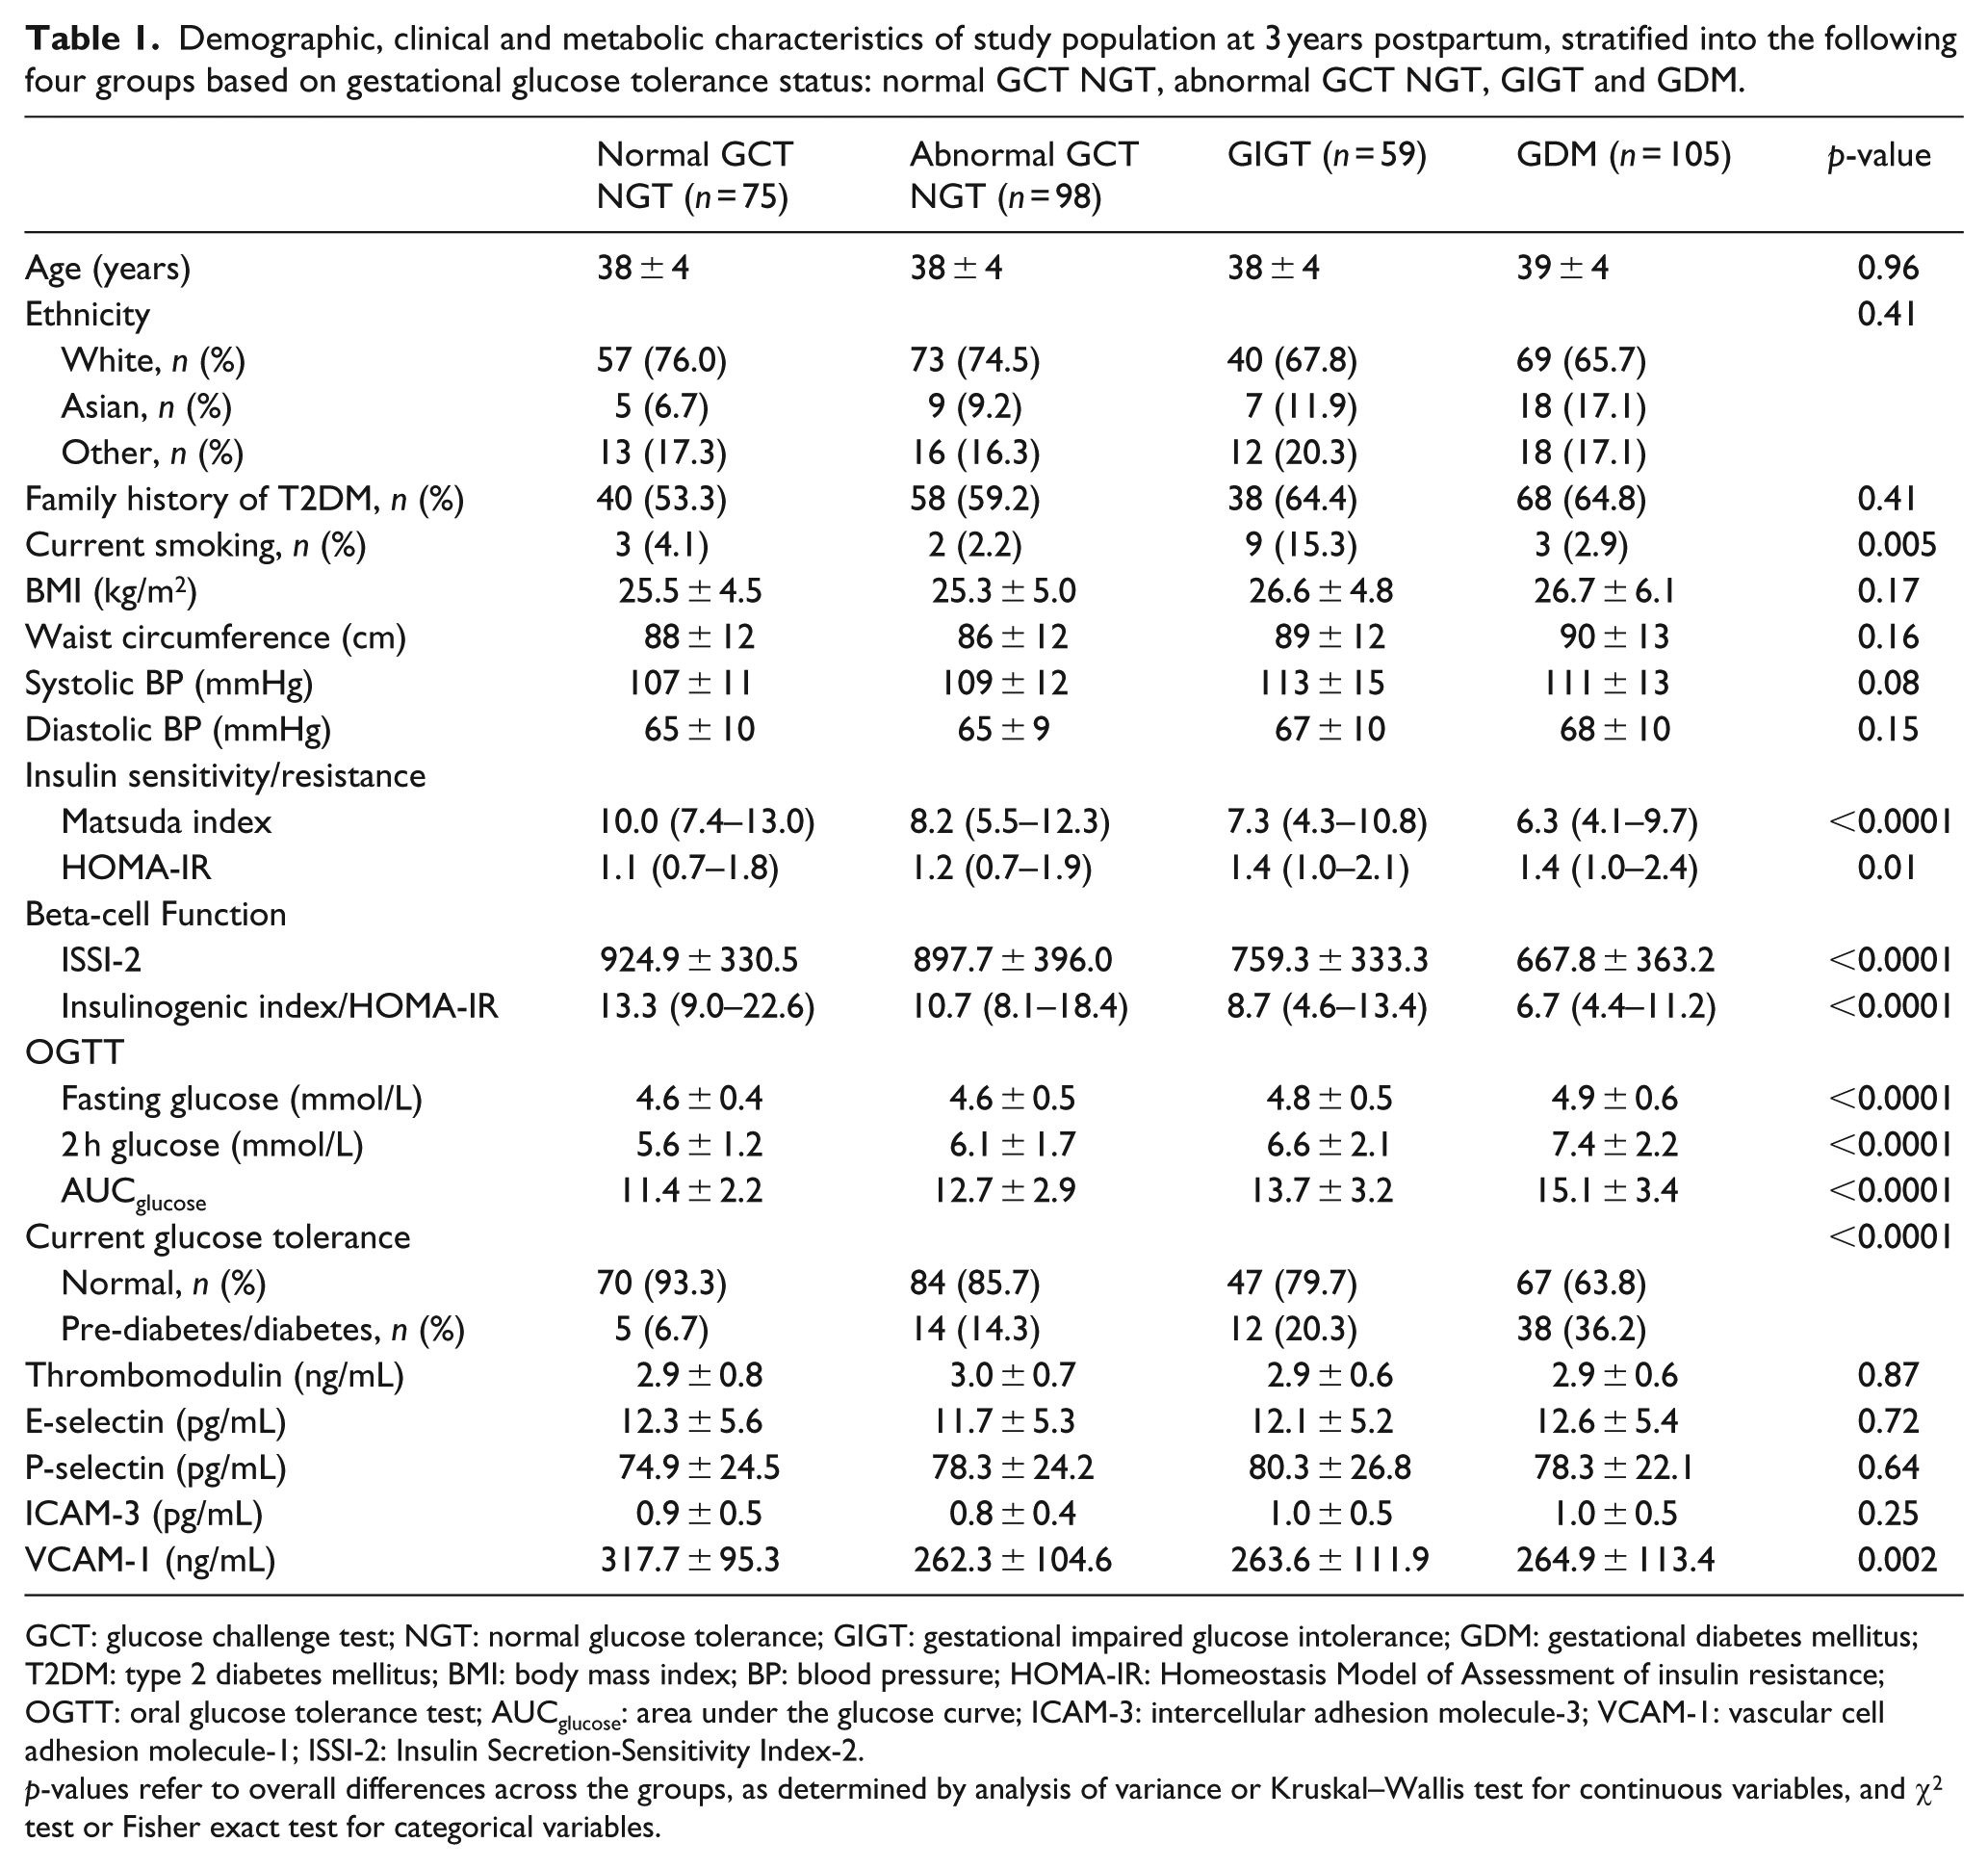
GCT: glucose challenge test; NGT: normal glucose tolerance; GIGT: gestational impaired glucose intolerance; GDM: gestational diabetes mellitus; T2DM: type 2 diabetes mellitus; BMI: body mass index; BP: blood pressure; HOMA-IR: Homeostasis Model of Assessment of insulin resistance; OGTT: oral glucose tolerance test; AUCglucose: area under the glucose curve; ICAM-3: intercellular adhesion molecule-3; VCAM-1: vascular cell adhesion molecule-1; ISSI-2: Insulin Secretion-Sensitivity Index-2.
p-values refer to overall differences across the groups, as determined by analysis of variance or Kruskal–Wallis test for continuous variables, and χ2 test or Fisher exact test for categorical variables.
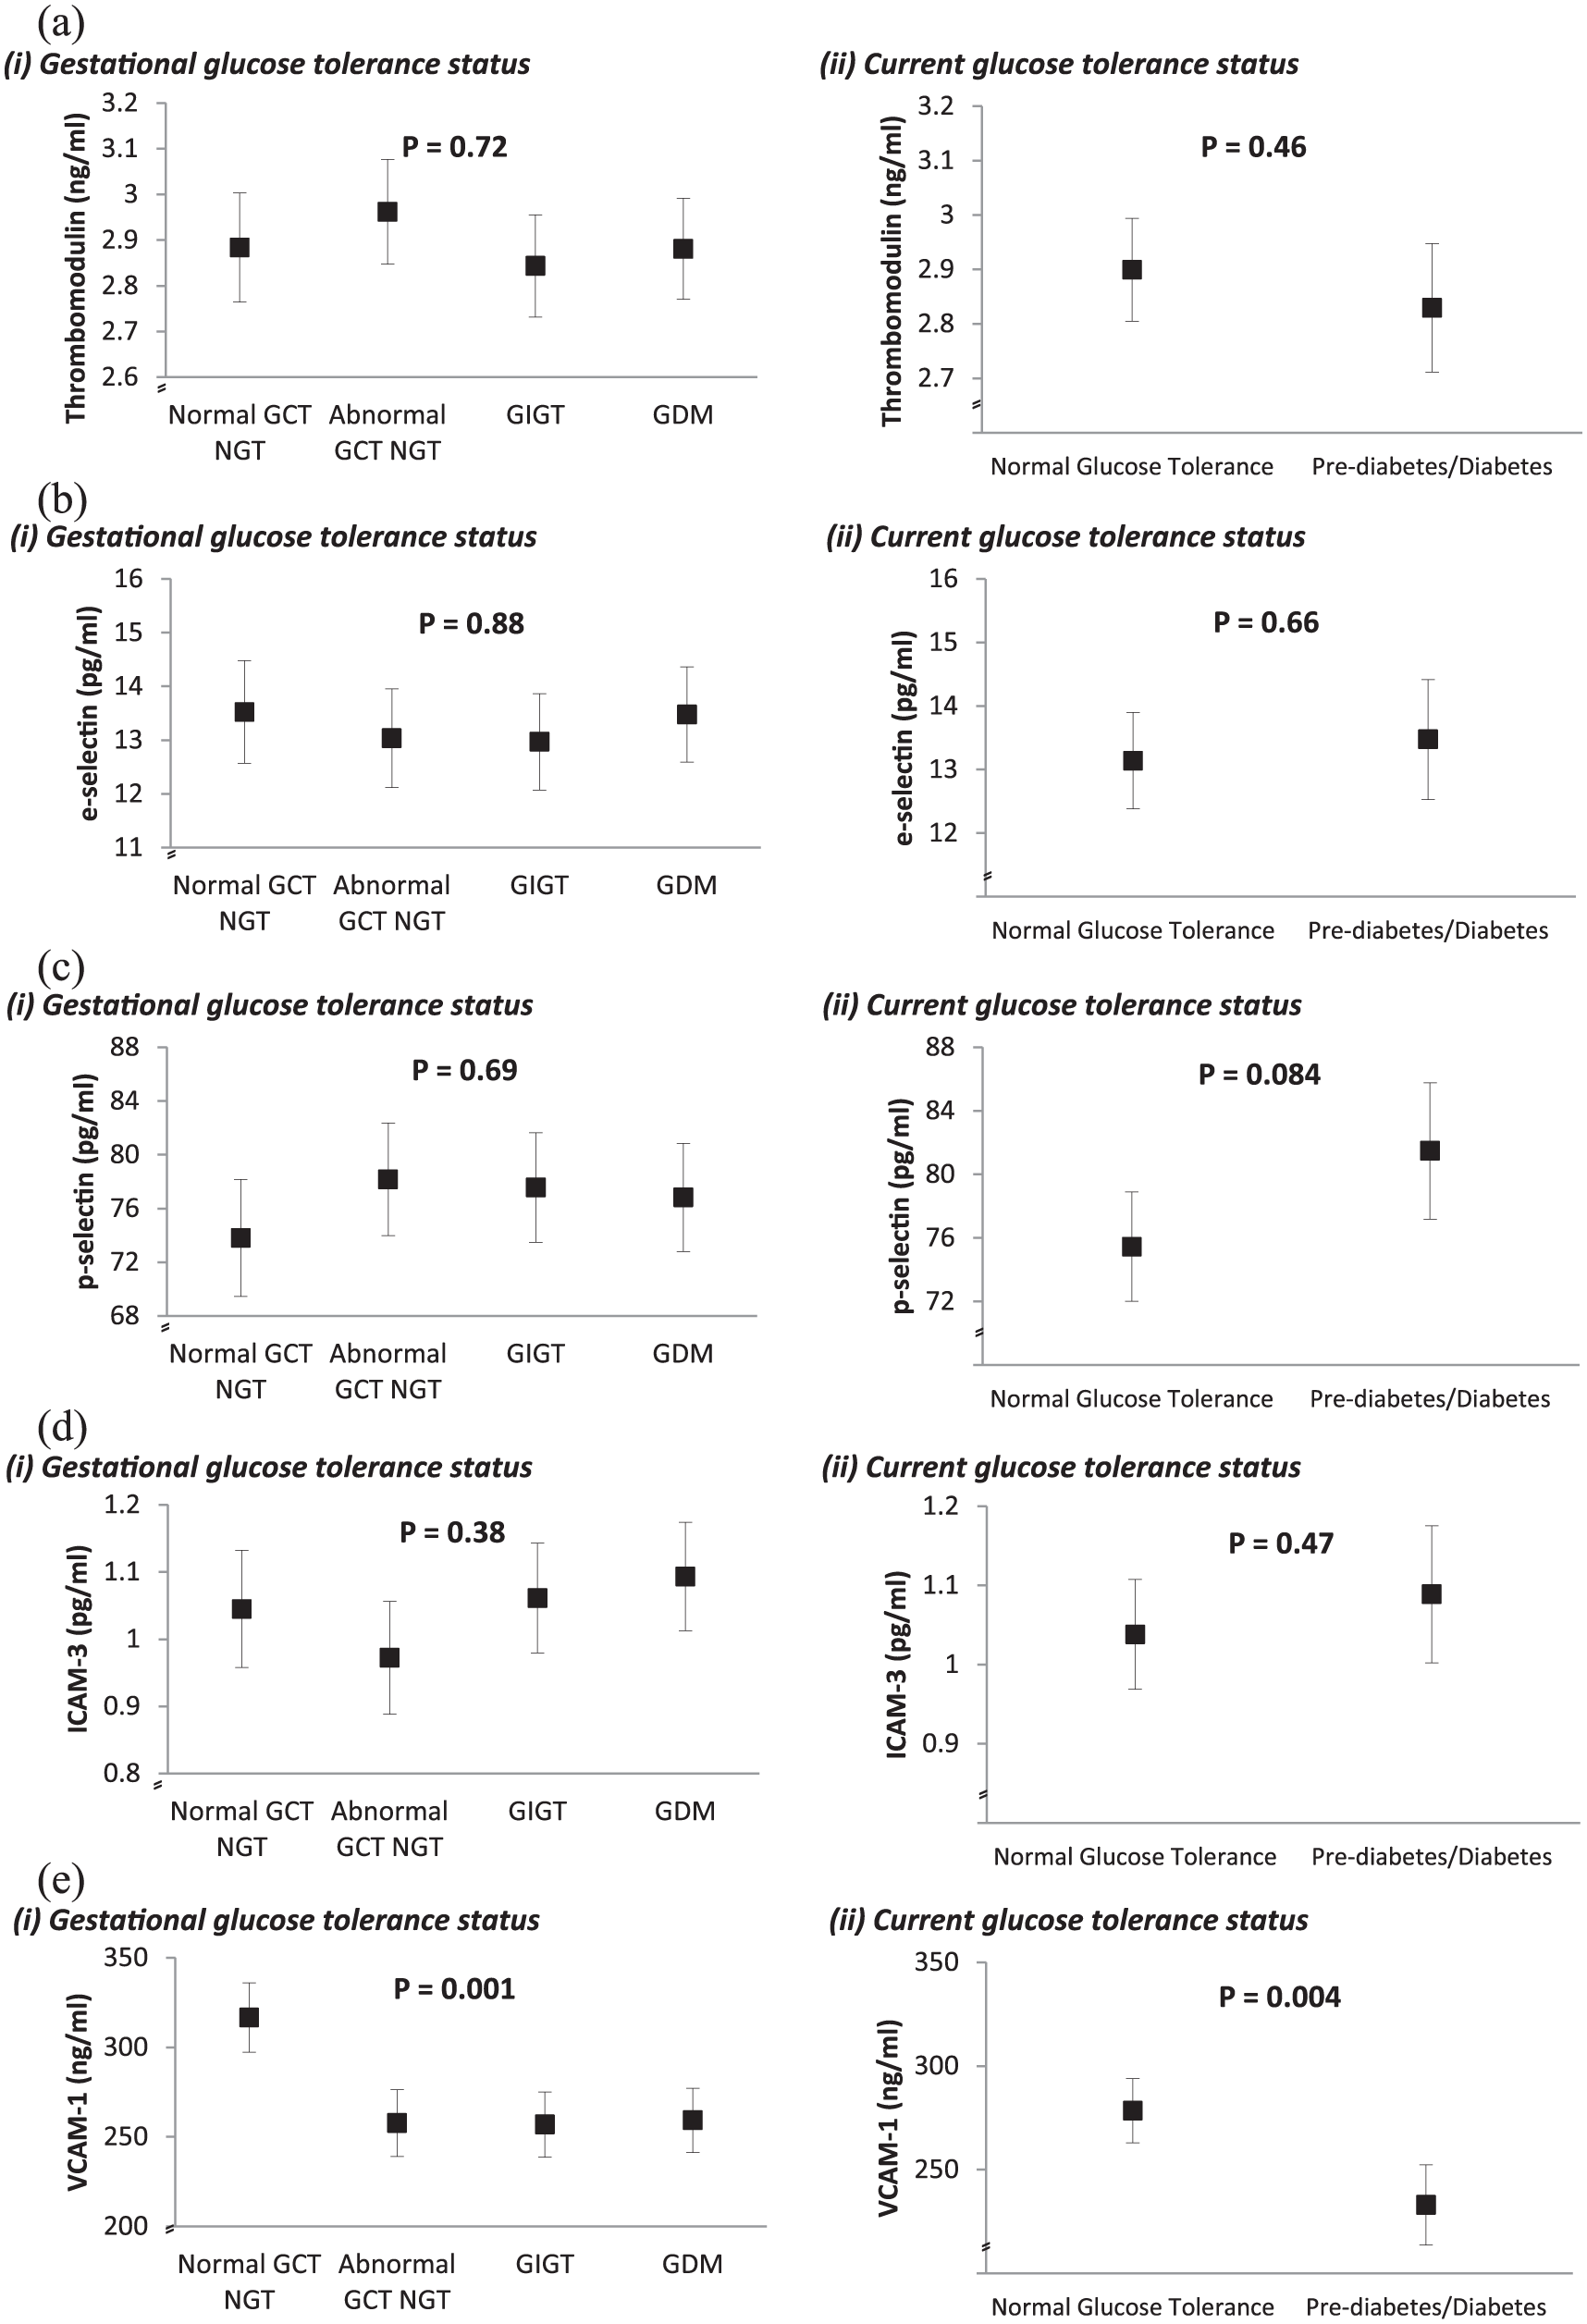
Comparison of mean adjusted levels of (a) thrombomodulin, (b) E-selectin, (c) P-selectin, (d) ICAM-3 and (e) VCAM-1 at 3 years postpartum between gestational glucose tolerance groups (plot (i) in each panel) and current glucose tolerance groups (plot (ii) in each panel). All values are adjusted for age, ethnicity, family history of diabetes, BMI, smoking and either current glucose tolerance status (in plot (i) of each panel) or gestational glucose tolerance status (in plot (ii) if each panel).
Spearman univariate correlations of clinical and metabolic factors with serum thrombomodulin, E-selectin, P-selectin, ICAM-3 and VCAM-1 at 3 years postpartum.
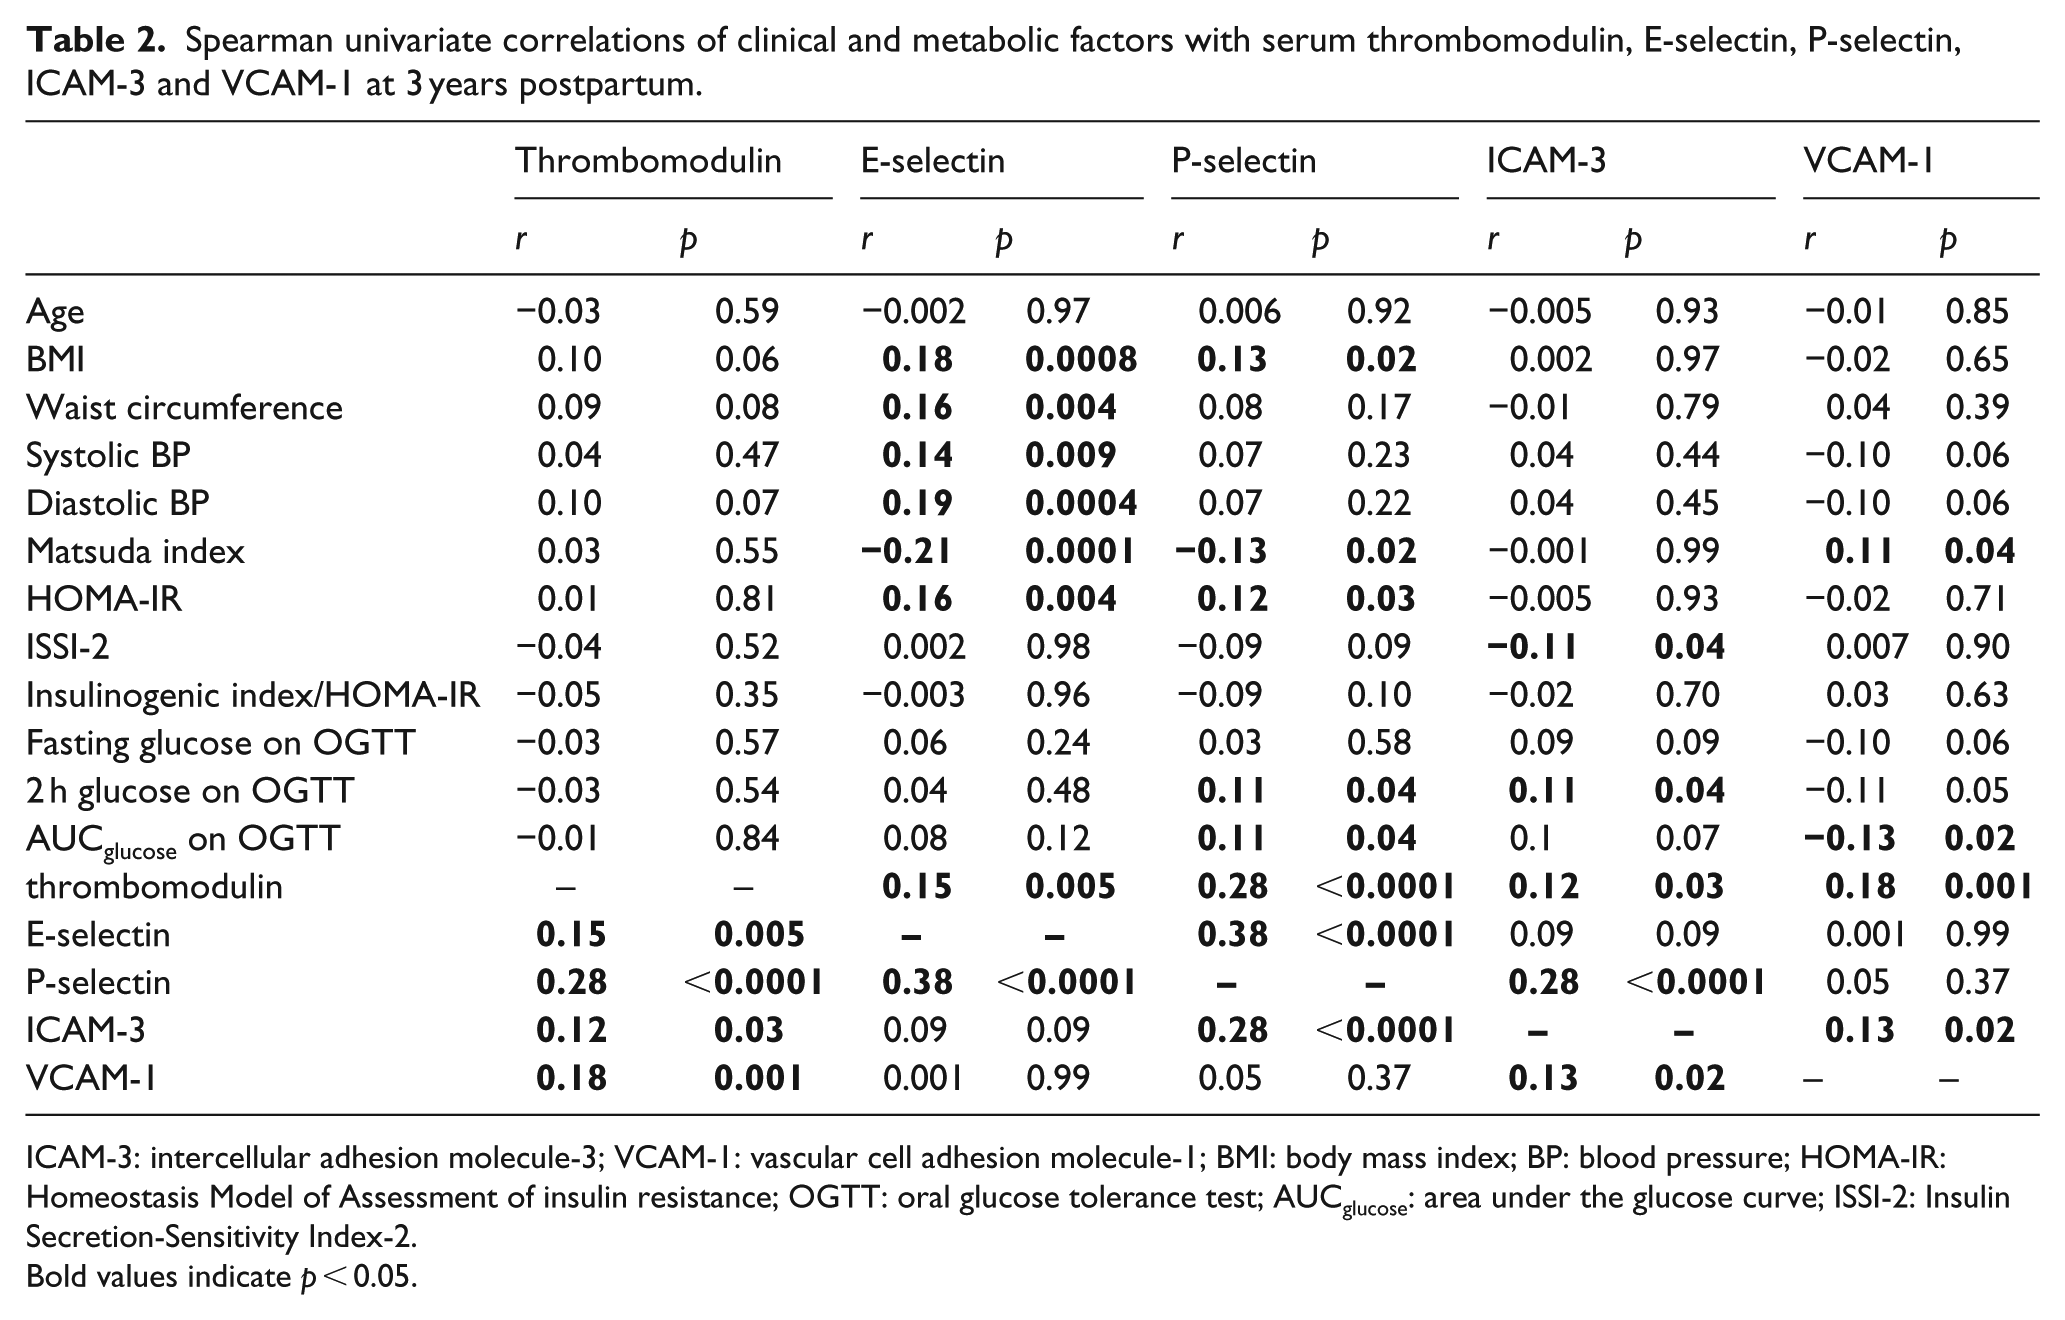
ICAM-3: intercellular adhesion molecule-3; VCAM-1: vascular cell adhesion molecule-1; BMI: body mass index; BP: blood pressure; HOMA-IR: Homeostasis Model of Assessment of insulin resistance; OGTT: oral glucose tolerance test; AUCglucose: area under the glucose curve; ISSI-2: Insulin Secretion-Sensitivity Index-2.
Bold values indicate p < 0.05.
Results
Table 1 shows the demographic, clinical and metabolic characteristics of the study population at 3 years postpartum, stratified into the following four groups based on glucose tolerance status in the recent pregnancy: normal GCT NGT (n = 75), abnormal GCT NGT (n = 98), GIGT (n = 59) and GDM (n = 105). The groups did not differ in age, ethnicity, family history of diabetes, BMI or waist circumference. Although only 17 women were current smokers, their distribution differed across the groups (p = 0.005). As anticipated, the four groups differed significantly with respect to insulin sensitivity/resistance (Matsuda index and HOMA-IR; both p ⩽ 0.01), beta-cell function (ISSI-2 and insulinogenic index/HOMA-IR; both p < 0.0001) and glycaemia (fasting glucose, 2 h glucose and AUCglucose on the OGTT; all p < 0.0001). Accordingly, the prevalence of dysglycaemia (pre-diabetes or diabetes) differed across the groups (p < 0.0001), with rates progressively rising from the normal GCT NGT group (6.7%) to abnormal GCT NGT (14.3%) to GIGT (20.3%) to GDM (36.2%). The vast majority of this dysglycaemia (87.0%) was pre-diabetes.
Comparisons of vascular biomarkers
Having demonstrated clear metabolic differences between the four gestational glucose tolerance groups at 3 years postpartum, we next compared circulating concentrations of the biomarkers of vascular injury/dysfunction. Of these biomarkers (thrombomodulin, E-selectin, P-selectin, ICAM-3, VCAM-1), only VCAM-1 exhibited differences across the groups, with higher levels in women with normal GCT NGT than in the three gestational dysglycaemia groups (p = 0.002; Table 1). Furthermore, this difference persisted after adjustment for diabetes risk factors (age, ethnicity, family history of diabetes, BMI), smoking and current glucose tolerance (p = 0.001) (Figure 1(e) plot (i)). In contrast, mean adjusted thrombomodulin, E-selectin, P-selectin and ICAM-3 did not differ across the groups (Figure 1(a) to (d), plot (i)).
Since the rates of dysglycaemia at 3 years postpartum differ between the gestational glucose tolerance groups, we considered whether the current glucose intolerance (pre-diabetes/diabetes) could be associated with serum levels of the vascular biomarkers. As shown in plot (ii) of (a) to (d) in Figure 1, there were no significant differences in mean adjusted thrombomodulin, E-selectin, P-selectin and ICAM-3 between women with current NGT and those with pre-diabetes/diabetes, after adjustment for diabetes risk factors (age, ethnicity, family history of diabetes, BMI), smoking and previous gestational glucose tolerance. Again, however, mean adjusted VCAM-1 differed according to current glucose tolerance, with higher levels in those with normoglycaemia (p = 0.004; Figure 1(e) plot (ii)).
Relationships of metabolic factors and vascular markers
Having demonstrated that only VCAM-1 related to both recent gestational dysglycaemia and current glucose intolerance, we next sought to elucidate the relationships between metabolic factors and the vascular biomarkers in this population. On Spearman’s correlation analysis (Table 2), E-selectin was inversely associated with insulin sensitivity (Matsuda index) and positively correlated with adiposity (BMI, waist) and blood pressure, but did not relate to measures of glycaemia. P-selectin was also inversely associated with Matsuda index while weakly correlating with glycaemic measures (2-h glucose, AUCglucose). In contrast, VCAM-1 was positively associated with insulin sensitivity (Matsuda index) and inversely related to 2-h glucose and AUCglucose.
Finally, to determine whether any of the metabolic factors were independently associated with the vascular markers, we performed a series of multiple linear regression analyses with each of the biomarkers of vascular injury/dysfunction serving in turn as the respective dependent variable. In each model, covariates consisted of diabetes risk factors (age, ethnicity, family history of diabetes, BMI), smoking, gestational glucose tolerance, current glucose tolerance, Matsuda index and the four other vascular markers. As shown in Table 3, these analyses revealed that neither gestational dysglycaemia nor current glucose tolerance was independently associated with thrombomodulin, E-selectin, P-selectin or ICAM-3. In contrast, however, each degree of gestational dysglycaemia emerged as an independent predictor of lower VCAM-1 at 3 years postpartum (GDM: p = 0.005; GIGT: p = 0.003; abnormal GCT NGT: p = 0.0008), as was current pre-diabetes/diabetes (p = 0.01).
Significant independent predictors of (dependent variables) thrombomodulin, E-selectin, P-selectin, ICAM-3 and VCAM-1, respectively.
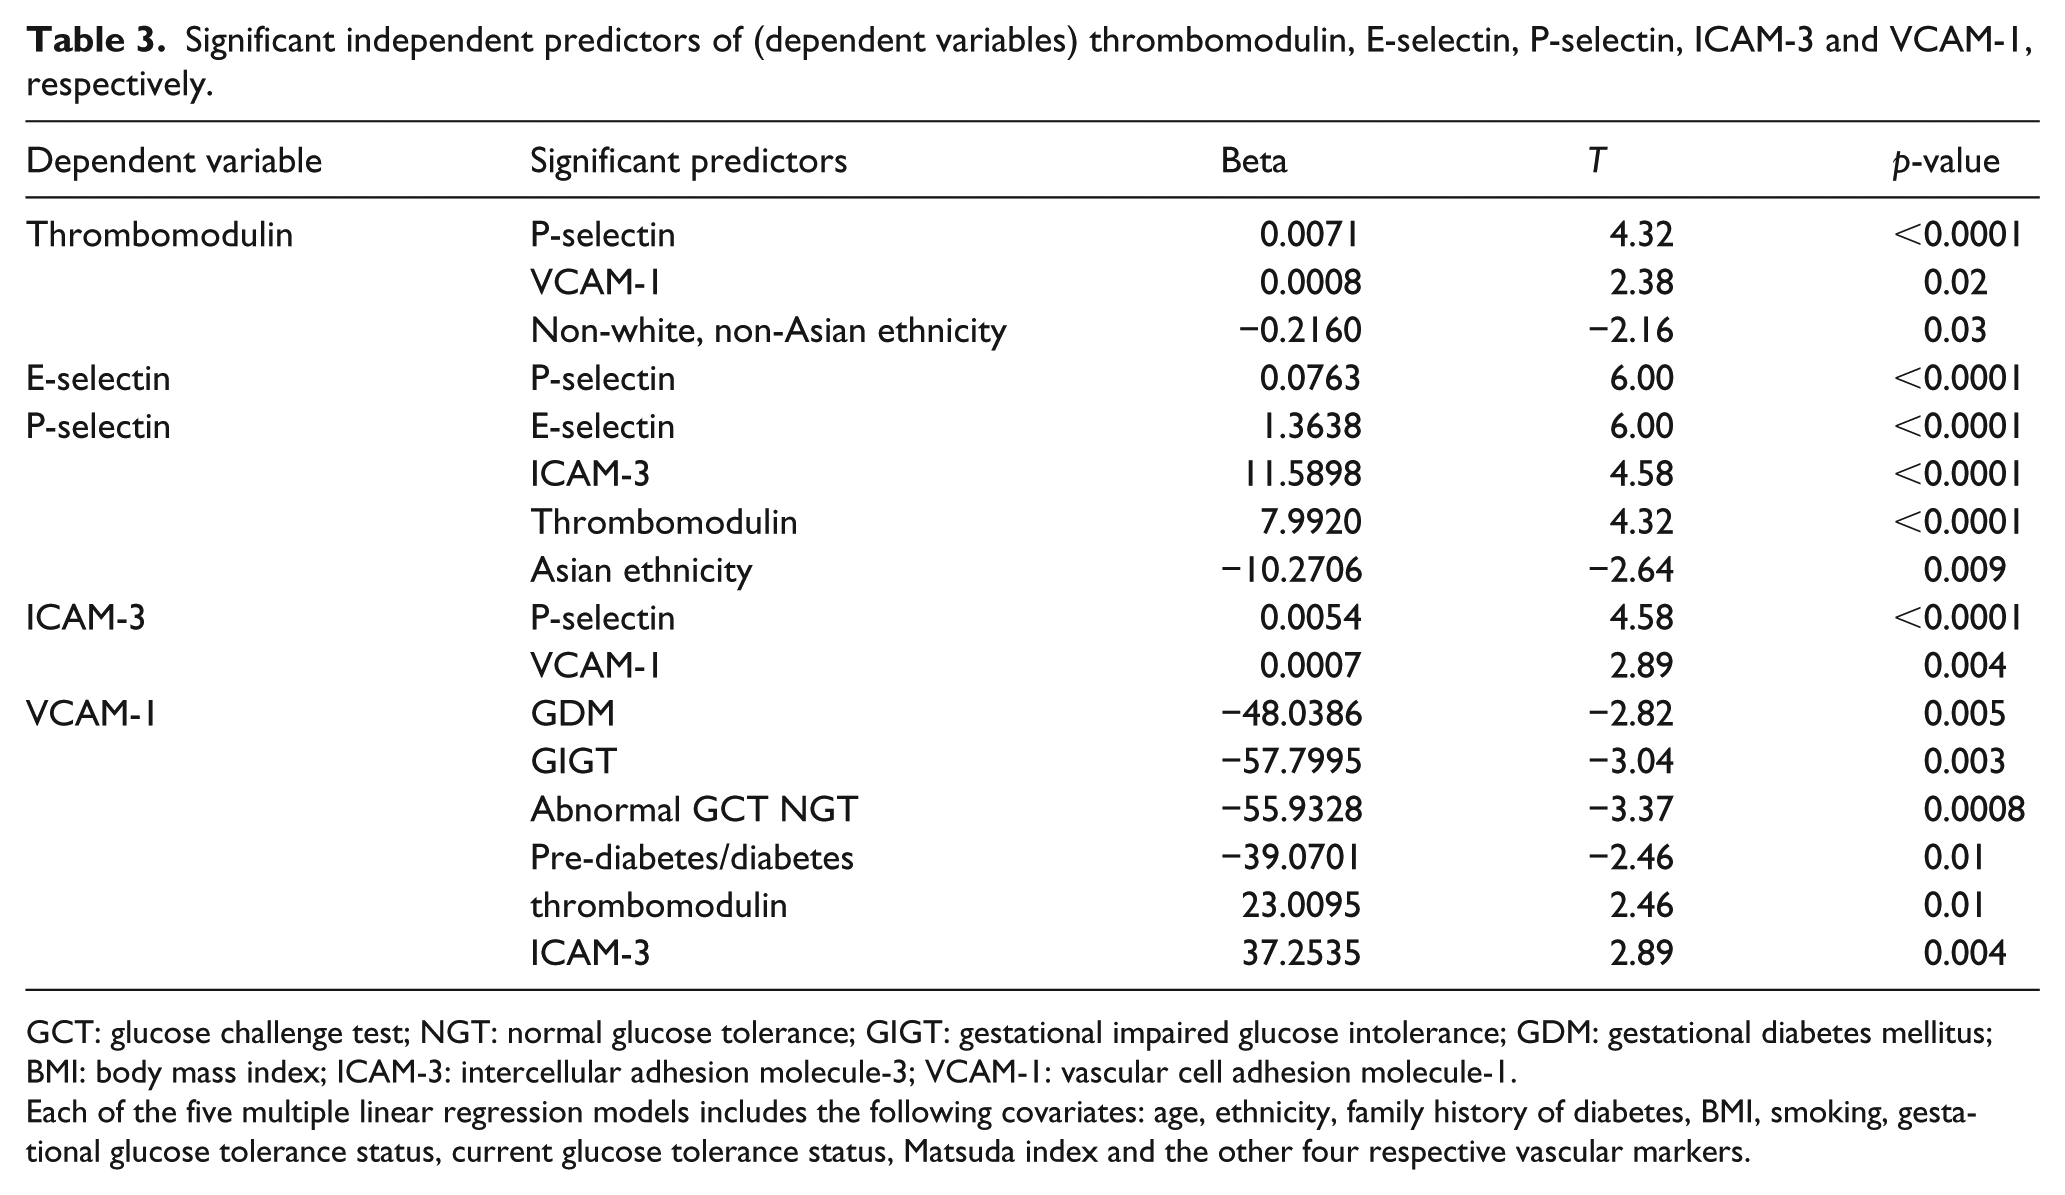
GCT: glucose challenge test; NGT: normal glucose tolerance; GIGT: gestational impaired glucose intolerance; GDM: gestational diabetes mellitus; BMI: body mass index; ICAM-3: intercellular adhesion molecule-3; VCAM-1: vascular cell adhesion molecule-1.
Each of the five multiple linear regression models includes the following covariates: age, ethnicity, family history of diabetes, BMI, smoking, gestational glucose tolerance status, current glucose tolerance status, Matsuda index and the other four respective vascular markers.
Discussion
In this study, we demonstrate that each degree of glucose intolerance in pregnancy (from GDM to milder gestational dysglycaemic states) is independently associated with lower serum VCAM-1 at 3 years postpartum. Moreover, the postpartum glucose intolerance that gestational dysglycaemia predicts is also independently associated with lower VCAM-1. Other vascular markers are unaffected at the time, including thrombomodulin, E-selectin, P-selectin and ICAM-3. It thus emerges that dysregulation of VCAM-1 may be an early event in the natural history of vascular disease in women with recent glucose intolerance in pregnancy.
In women, the spectrum of glucose intolerance in pregnancy identifies a gradient of future risk for CVD that manifests in the subsequent decades.2,5,6 This risk is believed to be partly mediated by chronic exposure to analogous gradients of cardiovascular risk factors. 6 Indeed, by as early as 3 months postpartum, women with recent GDM and GIGT exhibit an enhanced risk factor profile, including higher rates of dysglycaemia, 3 atherogenic dyslipidemia [low-density lipoprotein (LDL) cholesterol, apolipoprotein-B] 18 and metabolic syndrome, 19 as compared to their peers who maintained NGT in pregnancy. Current thinking holds that, over time, exposure to this enhanced cardiovascular risk factor profile leads to vascular injury and dysfunction as an early event in the atherosclerotic process. 6 In women with recent glucose intolerance in pregnancy (whose future risk of CVD may be more than a decade away from clinical manifestation), it is the timeline of this anticipated vascular injury/dysfunction that is of interest, as it may identify a window of opportunity for intervention and possibly risk modification.
In this context, studies to date have generally compared women with and without a history of GDM and have yielded conflicting findings in this comparison for both vascular function and biomarkers thereof.4,20–22 Of note, limitations of these studies have included (1) modest sample sizes, (2) retrospective classification of GDM/non-GDM status, (3) the resultant inability to differentiate between milder gestational dysglycaemia (which predicts future cardiovascular risk)2,7 and true normoglycaemia in pregnancy (which does not) and (4) limited covariate consideration, including current glucose intolerance at the time of assessment. 4 This study was thus designed to address these limitations with the following features: (1) a larger study population than previous reports (n = 337), (2) the prospective ascertainment of glucose tolerance status in pregnancy which enabled the stratification of this population into four groups reflecting different degrees of future cardiovascular risk and (3) systematic assessment of both vascular biomarkers and current glucose tolerance by OGTT at 3 years postpartum.
With this approach, we demonstrate that, among the five biomarkers of vascular injury/dysfunction that were assessed at 3 years after delivery, only VCAM-1 related to preceding gestational glucose tolerance. Moreover, both gestational dysglycaemia and current glucose intolerance predicted lower serum VCAM-1. Of note, elevated VCAM-1 has been linked to CVD in secondary prevention populations,23,24 but not in several studies that evaluated primary prevention subjects.23,25,26 Accordingly, it has been suggested that increased VCAM-1 may be a risk marker only in subjects with established CVD. 27 In this context, little is known about the biology of VCAM-1 very early in the natural history of vascular disease. Notably, our model of young women in whom long-term future cardiovascular risk is identified on the basis of their recent gestational glucose tolerance status may be providing insight into such early events. Indeed, it is noteworthy that both gestational dysglycaemia and current pre-diabetes/diabetes were independently associated with lower VCAM-1 at 3 years postpartum, despite both factors also being known to predict long-term future risk of CVD. Interestingly, in a recent study of 2638 middle-aged adults without a previous history of vascular disease, baseline VCAM-1 was inversely associated with the incidence of CVD over median 9.9 years of follow-up. 28 Similarly, our data raise the possibility that reduced circulating VCAM-1 may be a very early event in the natural history of vascular disease in women, prior to any dysregulation of the other markers of vascular injury/dysfunction that were assessed. It may be that increased VCAM-1 occurs later in the progression to CVD. While this pattern of change remains speculative at present, it should be recognized that precedence for such a shift over time might exist with the adipokine adiponectin. Specifically, whereas hypoadiponectinemia is a robust predictor of incident diabetes (which identifies a patient population at high vascular risk), higher adiponectin has been associated with cardiovascular outcomes, particularly in the setting of established CVD. 29 Further longitudinal study would be needed to determine whether the relationship between previous gestational glucose intolerance and VCAM-1 may similarly change over time.
A limitation of this study is that the measurement of P-selectin from serum may be less reliable than from plasma, owing to its release following the activation of platelets during clotting. 30 A second limitation is that the vascular biomarkers were assessed at only one point in time (3 years postpartum). Indeed, as noted earlier, longitudinal evaluation of the markers of vascular injury/dysfunction over time, in relation to preceding gestational glucose tolerance, would be of interest. Nevertheless, the current findings may also be interpreted as encouraging with respect to the possibility of vascular risk modification in young women. Specifically, although gestational dysglycaemia predicts an enhanced cardiovascular risk factor profile by 3 months postpartum,3,18,19 the current data suggest that vascular injury or dysfunction leading to increased thrombomodulin, E-selectin, P-selectin, ICAM-3 or VCAM-1 may not yet be present at 3 years after delivery. Thus, a window of opportunity for risk factor modification prior to vascular injury/dysfunction may be present in the early postpartum years.
In conclusion, each degree of glucose intolerance in pregnancy (from GDM to milder gestational dysglycaemic states) predicts lower serum VCAM-1 at 3 years postpartum, as does concurrent glucose intolerance at the time. Thrombomodulin, E-selectin, P-selectin and ICAM-3 do not show concurrent changes. It thus emerges that dysregulation of VCAM-1 may be an early event in the natural history of vascular disease in women with recent glucose intolerance in pregnancy. Moreover, these data suggest that the cardiometabolic risk profile of women with recent gestational dysglycaemia may not yet have induced vascular injury/dysfunction by 3 years postpartum, thereby potentially supporting a window of opportunity for risk modification
Footnotes
Authors’ contributions
RR, AJH, PWC, MS and BZ designed and implemented the study. RR and CY contributed to the analysis plan and interpretation of the data. CY performed the statistical analyses. HB wrote the first draft. All authors critically revised the manuscript for important intellectual content. All authors approved the final manuscript. RR had full access to all of the data in the study and takes responsibility for the integrity of the data and the accuracy of the data analysis.
Declaration of conflicting interests
The author(s) declared no potential conflicts of interest with respect to the research, authorship and/or publication of this article.
Funding
This study was supported by operating grants from Canadian Institutes of Health Research (CIHR; MOP-84206) and Canadian Diabetes Association (CDA; CDA-OG-3-15-4924-RR). AJH holds a Tier-II Canada Research Chair in Diabetes Epidemiology. BZ holds the Sam and Judy Pencer Family Chair in Diabetes Research at Mount Sinai Hospital and University of Toronto. RR is supported by a Heart and Stroke Foundation of Ontario Mid-Career Investigator Award and holds the Boehringer Ingelheim Chair in Beta-cell Preservation, Function and Regeneration at Mount Sinai Hospital.