
Abstract
Purpose:
Detection of microaneurysms and/or microhaemorrhages near the fovea when screening for diabetic retinopathy poses a problem because referral to retinal specialists may alarm patients and unnecessarily burden ophthalmologists.
Methods:
Six-month prospective study of patients found to have minimal red lesions within one disc diameter of the fovea when screened for diabetic retinopathy. Two 45° digital photographs, one centred on the macula and the other nasal including the optic disc, were taken for each eye. All patients received a 6-month re-screening appointment.
Results:
Out of 70 patients, 41 returned for re-screening. Diabetic retinopathy had worsened in 3 who required referral but no treatment, was unchanged in 19 and was undetectable in the other 19. Haemoglobin A1c decreased from 7.76% ± 1.50% (61.3 ± 16.2 mmol/mol) to 6.93% ± 1.7% (52.3 ± 18.9 mmol/mol) in the patients in whom diabetic retinopathy worsened but did not change in the other groups. Baseline haemoglobin A1c (p = 0.048) and systolic blood pressure (p = 0.007) were lower in the patients in whom diabetic retinopathy improved, but a multivariate model including haemoglobin A1c, blood pressure and known disease duration could not identify any independent risk factor.
Conclusion:
Minimal red lesions near the fovea, though commanding early re-screening, do not require immediate referral to retinal specialists.
Introduction
Screening for sight-threatening retinopathy ranks among the most cost-effective procedures in health care.1,2 Protocols and guidelines are well in place,3–5 but evidence for some aspects of the screening process remains to be strengthened. In particular, little is published on how to proceed when isolated red lesions, that is, microaneurysms and/or microhaemorrhages, are identified by retinal photography near the fovea.6,7 On one hand, since the macula is the centre of vision, minimal lesions should not be overlooked by graders, especially if they are not retinal specialists, when screening is carried out on bi-dimensional colour photographs which do not permit detection of retinal thickening and macular oedema. On the other hand, referral of minimal lesions may place unnecessary burden on retinal specialists and alarm on patients.
Based on these premises, a prospective observational study was carried out in patients who, when screened in our Diabetic Retinopathy Centre, were found to have red lesions within one optic disc diameter of the centre of the fovea, in the absence of other signs of more severe diabetic retinopathy (DR).
Methods
Screening for DR in our Centre includes collection of clinical data, measurement of visual acuity by decimal charts and intraocular pressure by insufflation tonometry, and induction of mydriasis by 1% tropicamide eye drops. Two 45° digital photographs of the retina are taken by a Kowa Pro-II Fundus Camera, one centred on the macula and the other nasal to, though including, the optic disc. All images were visualised by the EyeCap software (Haag-Streit, Koeniz, Switzerland), evaluated by a medically qualified grader (A.B.) and included in this study if they showed any red dots and blots within one disc diameter of the centre of the fovea. Exclusion criteria were as follows: previous evidence of DR involving the macular area; presence of hard exudates or any other lesions requiring referral according to Italian guidelines; 5 previous retinal treatment by photocoagulation and/or intraocular agents; presence of other systemic conditions, for example, renal failure or cancer, potentially impacting on retinal status; and/or shortening life expectancy.
According to current Italian guidelines, 5 patients with mild non proliferative DR at the posterior pole were given a 6-month appointment for re-screening, which included the procedure described above and grading by the same observer. The lesions were classified as improved if no longer visible, stable if still detectable on the images and worse if larger/more numerous than at baseline. Worsening of DR involved referral to an ophthalmologist whereas persistence/improvement of the lesions observed at baseline indicated another 6-month screening appointment. Enrolment was from January 2015 through to March 2017. All photographs were reviewed by a second independent grader (M.P.) and, in the case of discordance, discussed and adjudicated by the two graders together.
Diabetes was classified as type 1 if onset had been before age 30 and insulin started within 1 year of diagnosis, and type 2 if onset had been after age 40 and insulin treatment was either not in place or started more than 1 year after diagnosis.
Ethical clearance for the study and informed consent were obtained from the patients, according to the tenets of the Helsinki Declaration.
Statistical analysis
Descriptive data are shown as absolute and relative frequencies of the different modalities for categorical data and as mean ± standard deviation (SD) for continuous variables. At univariate analysis, t test for continuous variables and chi-square test for qualitative variables were carried out to detect the possible predictors of DR progression by comparing clinical characteristics at baseline between the improved and stable/worsened group. Multivariable analysis models were then fitted to evaluate the independent effect of the variables that turned out to be significantly associated to DR status at univariate analysis: DR group at 6 months (stable/worsened vs improved group) was set as the dependent variable of a logistic regression model where known diabetes duration, systolic blood pressure and haemoglobin A1c (HbA1c) at baseline were taken as independent variables. For all tests, a p value of less than 0.05 was considered significant. All analyses were performed with Stata 14 (StataCorp. 2015. Stata Statistical Software: Release 14. College Station, TX: StataCorp LP).
Results
In total, 70 patients were enrolled, 42 men and 28 women, 17 with type 1 diabetes, 52 with type 2 diabetes and 1 with secondary post-pancreatectomy diabetes. Mean age was 56.7 ± 15.7 years, and known disease duration was 15.0 ± 10.6 years. Of these, 41 returned for the 6-month re-screening visit. DR had worsened in 3 of them and required referral, was unchanged in 19 and was undetectable in the remaining 19.
All three patients in whom DR worsened had type 2 diabetes. Two were females, age was 60.3 ± 2.5, known diabetes duration 8.7 ± 5.5 years and systolic blood pressure 142.3 ± 15.3. Their serum creatinine was 0.81 ± 0.38 mg/dL (estimated Glomerular Filtration Rate (egFR) 107.3 ± 30.2 mL/min), serum cholesterol 161.3 ± 28.2 mg/dL, High Density Lipoprotein (HDL) cholesterol 51.7 ± 12.1 mg/dL and triglyceride 135.0 ± 27.0 mg/dL. Interestingly, the mean HbA1c of these three patients had decreased from 7.76% ± 1.50% (61.3 ± 16.2 mmol/mol) at baseline to 6.93% ± 1.7% after 6 months (52.3 ± 18.9 mmol/mol) while it did not change in the other two groups. Of these three patients, two were on oral agents and one on insulin, two on inhibitors of the renin–angiotensin system and none on statins.
Because of the low numbers, for statistical purposes, the 3 patients in whom DR had worsened were grouped with the 19 in whom DR had remained stable and compared for risk determinants with those in whom the lesions had cleared. The clinical characteristics of these two groups are shown in Table 1.
Comparison of the patients in whom DR improved and in whom DR remained stable or worsened.
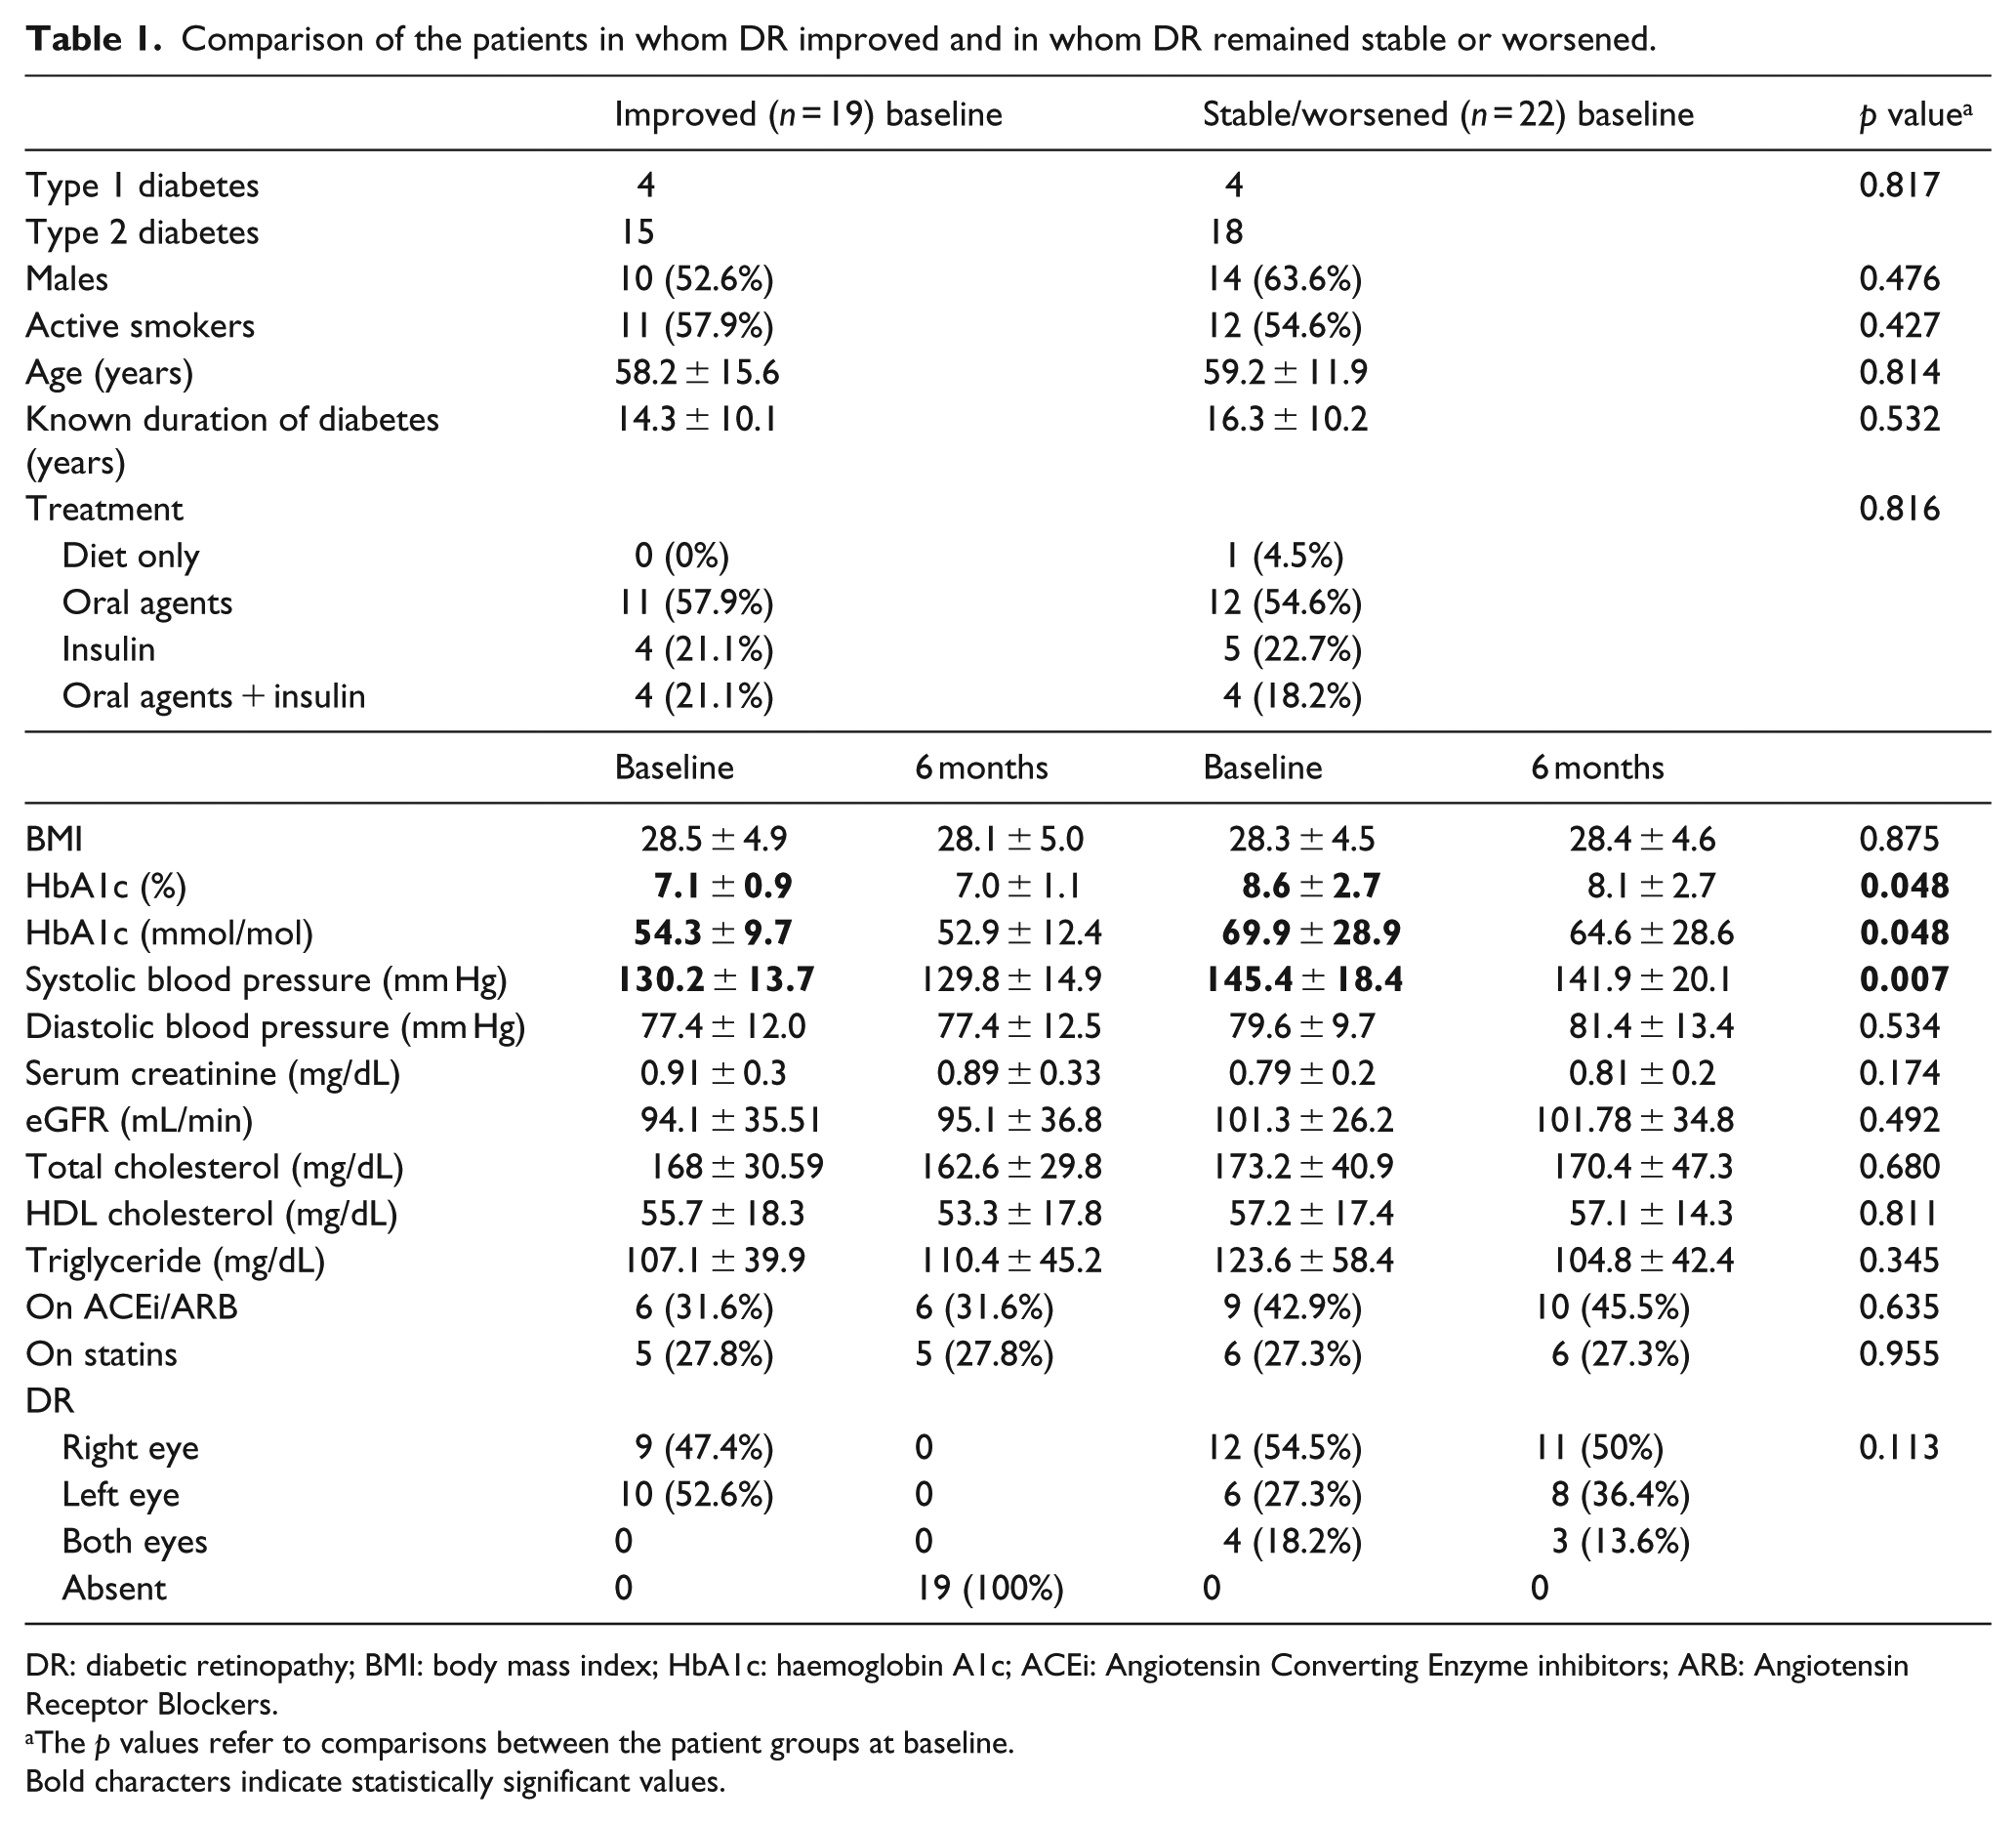
DR: diabetic retinopathy; BMI: body mass index; HbA1c: haemoglobin A1c; ACEi: Angiotensin Converting Enzyme inhibitors; ARB: Angiotensin Receptor Blockers.
The p values refer to comparisons between the patient groups at baseline.
Bold characters indicate statistically significant values.
Univariate analysis showed that baseline HbA1c (p = 0.048) and systolic blood pressure (p = 0.007) were lower in the patients in whom DR had improved over the following 6 months. However, a multivariate analysis model including these two variables and known disease duration could not identify any independent risk factor (Table 2).
Multivariate analysis for DR progression predictors.
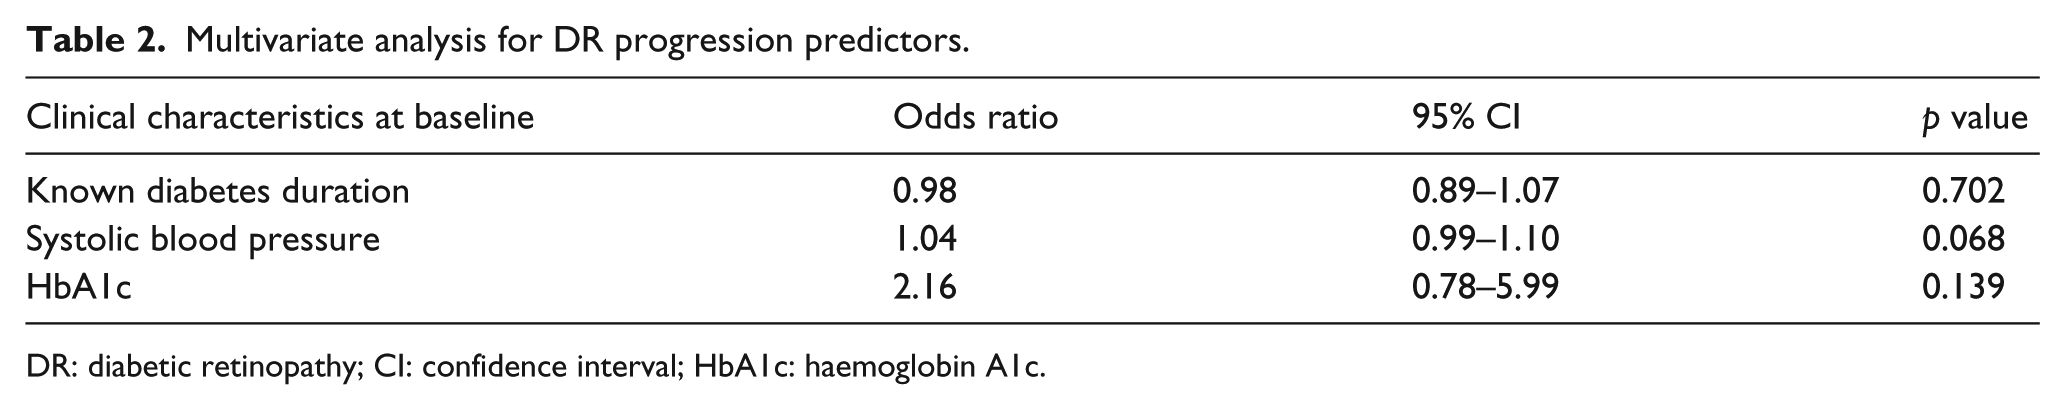
DR: diabetic retinopathy; CI: confidence interval; HbA1c: haemoglobin A1c.
In all, 18 patients returned for screening after 12 months of baseline, of whom 1 had not attended at 6 months, but in none of them had DR worsened.
Discussion
This study shows that minimal lesions (red dots and blots) detected by digital retinal photography in the macular area at the time of screening for DR do not warrant immediate referral to an ophthalmologist. Of the patients with these characteristics, only three deteriorated marginally to require specialist attention but did not proceed to photocoagulation or other forms of treatment for DR, whereas the lesions either stabilised or even disappeared over 6 months in the other patients. These findings are in line with the results of two other studies that investigated similar groups of patients although considering only ophthalmological outcomes. One of them was also prospective and reported no development of clinically significant macular oedema over 9 months of follow-up. 6 The other was a cross-sectional study in which patients with minimal peri-foveal lesions were evaluated by optical coherence tomography (OCT), reporting that suspicion of macular involvement on the basis of retinal photography alone carries a false-positive rate of 86.6%. 7 In this article, we also collected a series of clinical data to search for possible systemic risk factors associated with the outcome of such retinal lesions.
This study has limitations. The number of patients enrolled is low but, as this clinic has a turnover of about 3000 screening episodes per year, the fact that it took more than 2 years to collect the sample is testimony to the relative rarity of the condition investigated. This limited the possibilities of identifying clinical risk factors that would help to single out patients at risk of progression of DR. As expected, those who regressed had lower systolic blood pressure and HbA1c, in line with the literature, 8 but neither remained as an independent risk factor when multivariate analysis was carried out. Nevertheless, special care should be applied to bring these variables to target, if elevated. On the other hand, the three patients whose DR worsened did not have poor control of blood pressure or high HbA1c to start with. Indeed, their HbA1c decreased to a larger extent than in the other patients. The relatively modest rate of HbA1c decrease suggests but does not fully support a phenomenon of ‘early worsening’ of DR, which was described for larger rapid improvements of metabolic control in type 1 9 and type 2 diabetes. 10 Measurements of retinal thickness by OCT should have complemented the study of these patients, 7 but the instrument was not available to us for screening purposes. Assessment of DR was on bi-dimensional digital photographs by two expert medically qualified graders and there was no significant drop in visual acuity. Finally, the dropout rate of 29 patients who, out of 70, failed to return for their 6-month appointment, despite being warned that a potentially serious condition was detected in their eyes, is worrying and points to the need for efficient recall mechanisms to be put in place.
In conclusion, this study confirms that presence of minimal red lesions near the fovea, though commanding early re-screening, does not require immediate referral to retinal specialists. Potentially, the addition of OCT to the screening procedure may help identify patients in need of stricter follow-up.
Footnotes
Acknowledgements
M.P. conceived the study, researched the data and wrote the manuscript. A.B., E.S., M.T. and A.M. acquired the data and revised the manuscript. F.C. and L.C. interpreted the data and revised the manuscript. All authors approved this version of the manuscript.
Declaration of conflicting interests
The author(s) declared no potential conflicts of interest with respect to the research, authorship, and/or publication of this article.
Funding
This work was supported by grants from the Compagnia di San Paolo, Turin, and the Fondazione Diabete Torino, Turin. The funders had no role in designing the study; in the collection, analysis and interpretation of data; in the writing of the report or in the decision to submit the article for publication.