
Abstract
Purpose:
To investigate the impact of metabolic control on macular thickness measured using optical coherence tomography in patients with diabetic retinopathy with or without macular oedema.
Methods:
A total of 124 patients with diabetic retinopathy (n = 70 without macular oedema and n = 54 with macular oedema) were enrolled. Optical coherence tomography parameters measured included central macular thickness and total macular volume. Metabolic factors with correlation to optical coherence tomography parameters were fasting plasma glucose, glycosylated haemoglobin, triglyceride, low-density lipoprotein and estimated glomerular filtration rate. Multiple linear regression models were used to evaluate associations between optical coherence tomography parameters and metabolic factors.
Results:
Higher glycosylated haemoglobin values were correlated with increased central macular thickness in patients without macular oedema (R = 0.289, p = 0.015), whereas glycosylated haemoglobin values were inversely associated with central macular thickness in patients with macular oedema (R = –0.374, p = 0.005). Both were found to be statistically significant after adjusting for age, sex and diabetic retinopathy severity in addition to other metabolic factors (p = 0.009 and p = 0.002, respectively).
Conclusion:
Strict metabolic control may not be associated with better macular thickness in diabetic patients with co-existing macular oedema.
Keywords
Introduction
Diabetic macular oedema (DME) has been one of the leading causes of visual impairment worldwide. 1 Production of vascular endothelial growth factor (VEGF) as a result of damaged retinal microvasculature caused by advanced glycation end-products is key to breakdown of the blood-retinal barrier. Dyslipidaemia may additionally contribute to endothelial dysfunction due to reduced bioavailability of nitric oxide.2,3 In particular, modified low-density lipoprotein (LDL) promotes apoptosis of pericytes in diabetic retinopathy (DR). 4 Breakdown of the blood-retinal barrier leads to accumulation of various macromolecules such as proteins and lipids in the interstitial space, which results in relatively high oncotic pressure that draws fluid out of retinal vessels.
Intensive glycaemic control has been shown to lower risks of DME and progression of retinopathy. The Action to Control Cardiovascular Risk in Diabetes (ACCORD) Eye Study also demonstrated slower progression of DR under the combination of glycaemic control and dyslipidaemia treatment. 5 Higher glycosylated haemoglobin (HbA1c) level was correlated with greater macular thickness in diabetes without macular oedema. 6 However, in pre-existing oedema, the relationship between glycosylated haemoglobin (HbA1c) and central macular thickness (CMT) was less clear. The goal of this study was to explore the impact of different levels of metabolic factor control on macular thickness, particularly in the presence of macular oedema.
Materials and methods
Study population
We conducted a retrospective chart review from January 2013 to December 2014 in Taipei Tzu Chi Hospital, Buddhist Tzu Chi Medical Foundation, New Taipei, Taiwan. Patients who were under follow-up at the departments of ophthalmology as well as endocrinology and metabolism were enrolled. Inclusion criteria were (1) patients with evidence of any DR (International Classification of Diseases-9 (ICD-9) code 362.01 or 362.02), (2) patients with or without DME (defined as the same condition in both eyes of an individual) and (3) availability of metabolic parameter values including fasting plasma glucose (glucose AC), HbA1c, triglyceride (TG), LDL and serum creatinine measured within recent 1 month. Estimated glomerular filtration rates (eGFRs, mL/min/1.73 m2) were calculated from serum creatinine using Modification of Diet in Renal Disease (MDRD) Study equation. 7 Macular oedema was defined using optical coherence tomography (OCT; Cirrus HD-OCT 400, Carl Zeiss Meditec, Inc., Dublin, CA, USA) as CMT of 300 µm or more, along with the presence of intraretinal cyst(s) or subretinal fluid. Other OCT parameters including foveal volume (FV) and total macular volume (TMV) were also recorded. Values were derived from maps generated by OCT as per nine subfields defined by the previous Early Treatment Diabetic Retinopathy Study (ETDRS). 8 Both CMT and FV were calculated in the central 1 mm ETDRS grid, and TMV was calculated as the sum of volumes of all nine grids. Fasting glucose (⩾8 h), HbA1c and lipid profiles were estimated using the automated analyzer Dimension RxL Max Integrated Chemistry System (Siemens Healthcare Diagnostics Inc., Deerfield, IL, USA). Exclusion criteria were (1) other ocular co-morbidities such as age-related macular degeneration, uveitis, retinal vein occlusion or existence of significant epiretinal membrane and (2) any intraocular surgery within 3 months prior to the study. Both eyes in eligible patients were examined, but only one eye from each patient was randomly enrolled for statistical analysis. This study adhered to the tenets of the Declaration of Helsinki, and Institutional Review Board (IRB) approval was obtained from the IRB of Taipei Tzu Chi Hospital, Buddhist Tzu Chi Medical Foundation, New Taipei, Taiwan.
Statistical analysis
Differences between groups were analysed using independent t-test for continuous variables and chi-square test for discrete variables. Relationship between metabolic factors and OCT parameters was analysed using Pearson’s correlation and multiple linear regression models. SPSS for Windows (Version 18; SPSS Inc., Chicago, IL, USA) was used for statistical analysis. A p value less than 0.05 was considered significant.
Results
Baseline demographics
A total of 124 patients were enrolled in this study, of which 54 patients had macular oedema and 70 did not. Age, sex, DR severity and metabolic factors including glucose AC, HbA1c, TG, LDL, serum creatinine and eGFR were not significantly different between groups. CMT was 426 ± 111 µm, FV was 0.33 ± 0.09 mm3 and TMV was 10.1 ± 2.3 mm3 in eyes with macular oedema, compared with CMT 221 ± 29 µm, FV 0.17 ± 0.02 mm3 and TMV 7.0 ± 0.8 mm3 (all p < 0.001) in eyes without oedema.
Metabolic factors and OCT parameters
In patients with macular oedema, higher levels of HbA1c were correlated with lower CMT (R = –0.374, p = 0.005); in those without macular oedema, however, HbA1c levels were positively correlated with CMT (R = 0.289, p = 0.015) (Table 1). After additional adjustment for age, sex and DR severity in multiple linear regression models, HbA1c remained a significant factor for CMT (p = 0.002 and p = 0.009, respectively). Glucose AC, LDL, TG and eGFR were not significantly associated with CMT in either group (all p > 0.05).
Correlations of metabolic factors with central macular thickness.
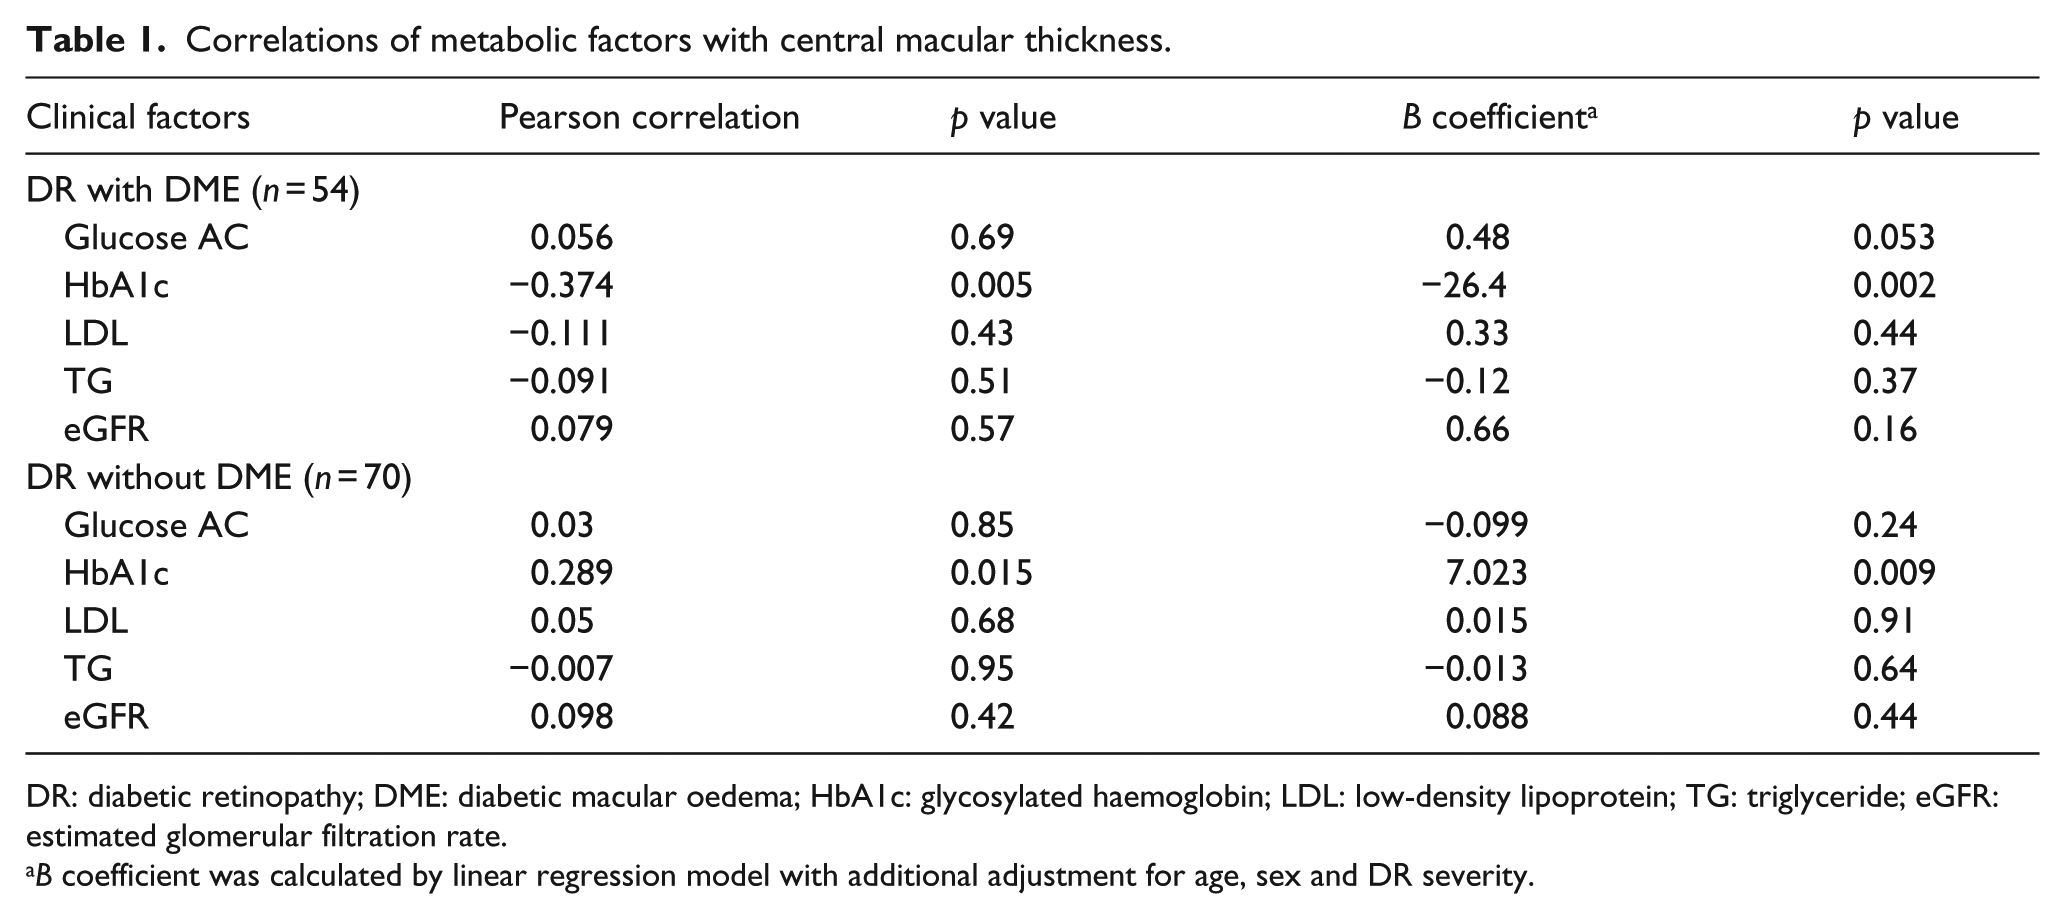
DR: diabetic retinopathy; DME: diabetic macular oedema; HbA1c: glycosylated haemoglobin; LDL: low-density lipoprotein; TG: triglyceride; eGFR: estimated glomerular filtration rate.
B coefficient was calculated by linear regression model with additional adjustment for age, sex and DR severity.
Discussion
Our study demonstrated that similar control of metabolic factors could result in different impacts on macular thickness in DR. We found that higher levels of HbA1c were associated with greater CMT and volume in eyes without macular oedema, which was consistent with a previous prospective study showing positive correlation between chronic HbA1c and macular thickness. 6 On the contrary, higher HbA1c levels tended to be associated with lower macular thickness and volume in eyes with oedema. To the best of our knowledge, our study is the first to demonstrate that tight glycaemic control may not have the same impact in eyes without oedema as in eyes with oedema. While it is well known that poor glycaemic control causes breakdown of the blood-retinal barrier with further vascular leakage, fluid movement due to osmotic pressure difference between vessels and interstitial spaces should be emphasized. This phenomenon is intriguing yet biologically plausible based on the consideration of Starling’s rule, 9 an important concept in the pathogenesis of frank macular oedema rather than mere breakdown of the barrier. Accumulation of macromolecules in the interstitial space induces relatively high osmotic pressure that draws fluid out of the intravascular space and eventually leads to macular oedema. We inferred that tight control to lower HbA1c in patients with pre-existing macular oedema may reduce intravascular osmotic pressure contributed by glucose molecules, preventing interstitial fluid return to the intravascular space or even predisposing intravascular fluid to drain out to retinal parenchyma if large and rapid reduction of serum glucose occurs. This shed light on an observation in a recent study that resorption of subretinal fluid in DME was slower in patients with lower HbA1c levels after ranibizumab than in others. 10 Other supportive evidence includes a prospective study showing that retinal thickness may decrease after meal consumption, indicating that macular thickness during fasting may be improved in patients with clinically significant macular oedema. 11 Data from a post hoc analysis of the RISE/RIDE study was also consistent with our observation. 12 In the above study, patients with baseline HbA1c of 7% or less had significantly higher CMT compared with those with baseline HbA1c more than 7% (p = 0.02). Our findings are also in agreement with a systemic observation that very low HbA1c is harmful and associated with greater mortality risk, particularly in those with severe diabetes. 13
We did not find significant relationships between serum lipids and macular thickness or severity of oedema, as in previous studies.14,15 A recent meta-analysis did not yield conclusive evidence with regard to relationship between lipid levels and macular oedema, nor did it reveal significant improvement in resolution of hard exudates or severity of oedema in patients taking lipid-lowering agents. 16
The limitations of this study included its retrospective design and inherent selection bias. A few cases categorized as no oedema (3 patients, 4.3%) in fact had previous oedema and received anti-VEGF more than 3 months prior. In addition, cross-sectional analysis failed to show a temporal sequence and outcomes after intervention. While this study may have revealed some clinical significance, it should be regarded as a preliminary one warranting larger and prospective confirmatory trials including different ethnic groups.
In conclusion, optimal metabolic control may be different in patients with DME compared with that in patients without macular oedema. Tight glycaemic control at a very low range in the presence of oedema might not benefit macular thickness and has the potential to lead to more aggressive ophthalmic treatment.
Footnotes
Declaration of conflicting interests
The author(s) declared no potential conflicts of interest with respect to the research, authorship and/or publication of this article.
Funding
The author(s) received no financial support for the research, authorship and/or publication of this article.