
Abstract
Objective:
To assess associations between cognitive impairment and longitudinal changes in retinal microvasculature, over 18 years, in adults with type 1 diabetes.
Research design and methods:
Participants of the Pittsburgh Epidemiology of Diabetes Complications Study received ≥3 fundus photographs between baseline (1986–1988) and time of cognitive assessment (2010–2015: N = 119; 52% male; mean age and type 1 diabetes duration 43 and 34 years, respectively). Central retinal arteriolar equivalent and central retinal venular equivalent were estimated via computer-based methods; overall magnitude and speed of narrowing were quantified as cumulative average and slope, respectively. Median regression models estimated associations of central retinal arteriolar equivalent and central retinal venular equivalent measures with cognitive impairment status, adjusted for type 1 diabetes duration. Interactions with HbA1c, proliferative retinopathy and white matter hyperintensities were assessed.
Results:
Compared with participants without cognitive impairment, those with clinically relevant cognitive impairment experienced 1.8% greater and 31.1% faster central retinal arteriolar equivalent narrowing during prior years (t = −2.93, p = 0.004 and t = −3.97, p < 0.0001, respectively). Interactions with HbA1c, proliferative retinopathy and white matter hyperintensities were not significant. No associations were found between central retinal arteriolar equivalent at baseline, at time of cognitive testing, or any central retinal venular equivalent measures, and cognitive impairment.
Conclusion:
Long-term arterial retinal changes could indicate type 1 diabetes–related cognitive impairment. Studies examining longitudinal central retinal arteriolar equivalent changes as early biomarkers of cognitive impairment risk are warranted.
Introduction
By middle age, individuals with type 1 diabetes (T1D) are more likely to exhibit cognitive impairment (CI) than their similarly aged peers without diabetes.1,2 The onset of CI in T1D is potentially disabling, as it may impede adherence to the rigorous daily self-care regimen required to maintain glycaemic control in T1D, thus increasing the risk and/or severity of T1D-related complications. If clinicians could identify T1D patients at greatest risk of CI, before it becomes clinically overt, strategies could be developed to reduce the impact of CI on T1D self-management and quality of life.
T1D-related CI appears to have a vascular origin as it is strongly related to cerebral microvascular disease, measured as white matter hyperintensities (WMHs)3,4 on brain magnetic resonance imaging (MRI). However, obtaining a brain MRI is expensive and not always feasible, as many people with T1D are MRI ineligible. Retinal microvascular measures, including retinal venular and arteriolar diameters, are emerging as useful markers of CI risk in populations who also have a high burden of brain microvascular diseases: older adults and people with type 2 diabetes. 5 The Wisconsin Epidemiologic Study of Diabetic Retinopathy recently reported a cross-sectional association between retinal vascular measures and CI in adults with T1D. 6 Whether longitudinal changes in these retinal vascular measures (e.g. narrowing or widening over time) could be detectable prior to the onset of CI in adults with T1D remains unknown. It would be very important if longitudinal changes in retinal vascular measures could help discriminate those T1D patients who are at greater risk of developing CI; these patients would likely need tailored management strategies that would account for diminished cognition.
This study examined longitudinal changes in retinal vascular measures over an average period of 18 years in patients with childhood-onset T1D, to quantify their relationship with prevalence of CI at the end of follow-up. It is hypothesized that greater cumulative and faster narrowing of retinal vascular measures over time would be associated with a higher prevalence of CI. We also examined whether these associations differed based on the presence of known risk factors of T1D-related CI, such as hyperglycaemia, proliferative retinopathy and WMHs in the brain, an indication of cerebral small vessel disease.
Methods
Study participants were drawn from the ongoing, prospective Pittsburgh Epidemiology of Diabetes Complications (EDC) Study; all were diagnosed with childhood-onset (<18 years) T1D between 1950 and 1980 and were seen within 1 year of diagnosis at Children’s Hospital of Pittsburgh. EDC baseline assessment occurred in 1986–1988 (N = 658, mean age and T1D duration 28 and 19 years, respectively). Participants completed biennial physical examinations through 1996–1998. 7 Additional physical examinations occurred in 2004–2006 and 2014–2016, and the 30th-year follow-up examination is currently underway (2016–2018). Participants have also mailed in self-completed questionnaires biennially since EDC baseline. In January 2010, all locally dwelling EDC participants (n = 263) were invited to participate in an ancillary neuroimaging and neurocognitive study. Of those invited, n = 81 refused; n = 26 never responded; n = 2 were lost to follow-up; n = 37 were ineligible for MRI due to metallic implants, claustrophobia or other contraindications; and n = 5 had scheduling conflicts. Of the remaining 112 who were interested, eligible and scheduled for neuroimaging and cognitive testing, n = 3 failed to show for their scheduled visit, n = 3 refused the MRI on the date of their MRI and n = 9 refused the cognitive test battery on the date of their cognitive test. In 2014–2016, another 66 participants completed the neurocognitive testing, yielding a total of 163 participants with neurocognitive data. Of these, n = 122 had CRAE and CRVE measurements at EDC baseline and at least two other time points (n = 41 had retinal vasculature images at fewer than three time points), which could have occurred at any of the follow-up EDC physical examinations, up to and including 2014–2016; n = 3 participants had the required number of retinal images but had CRAE or CRVE images greater than 2 standard deviations (SDs) from the mean, and these outliers were removed, leaving a remaining analytic sample of n = 119. N = 164 participants were excluded because of pre-study panretinal photocoagulation; for n = 6 participants, other criteria for inclusion in the analytic sample were met, and they had ⩾3 images acquired prior to panretinal photocoagulation, so only those images acquired after the procedure were excluded. A smaller analytic subsample of n = 64 with data on WMH was used to assess the relationship between retinal imaging markers and cerebral microvascular disease. All participants provided informed consent before any research procedures, and all study procedures were approved by the University of Pittsburgh’s Institutional Review Board.
Retinal vasculature variables
Fundus photographs were taken at EDC baseline and each follow-up examination, up to a maximum of seven visits over the following 28 years. Only participants with at least three retinal image visits were included in these analyses. The number of retinal visits ranged from a minimum of 3 to a maximum of 6. Specifically, n = 48 had three, n = 28 had four, n = 11 had five and n = 32 had six retinal visits. The average interval of time between the first (1986–88) and the last available retinal image visit was 17.56 ± 8.02 years. Depending on the time of the last retinal image visit, mean and SD follow-up were as follows: 25.64 ± 0.70 years for those with a last retinal image visit in 2014–2016 (n = 51), 19.13 ± 0.71 for those with last image visit in 2004–2007 (n = 19), 10.27 ± 0.69 for those with last retinal image visit in 1997–1998 (n = 27), 8.40 ± 0.73 for those with last retinal image visit in 1995–1996 (n = 10), 7.06 ± 2.17 for those with last retinal image visit in 1993–1994 (n = 2) and 4.49 ± 0.25 for those with last retinal image visit in 1991–1992 (n = 10).
To measure retinal vessel widths, a digital image of the optic nerve was graded using IVAN software, which calculates CRAE/CRVE using the Parr–Hubbard–Knudtson formula.8,9 IVAN software is semi-automated, and for each image, a standardized grid with three circles is automatically placed around the margin of the optic nerve, identifying the zone to be used for grading. The first ring defines the edge of the optic disc; the second ring, the outside edge of zone A, is located a half-disc diameter out from the disc margin; the third ring is 1-disc diameter from the disc margin and defines zone B which is between half and 1-disc diameter from the optic nerve margin. All major arterioles and venules coursing through zone B were identified and traced by the grader directed software. A total of three stereo fields were photographed: field 1, centred on the optic nerve; field 2, centred on the macula; and field 4, superior and temporal to the optic nerve. 10 For retinal vessel measurement, we used field 1, centred on the optic nerve. For this study, we used measures acquired from the right eye, rather than left or both. Although asymmetry is possible, there is a strong correlation between severity of diabetic retinopathy between right and left eyes in T1D, 11 and CRAE and CRVE have been highly correlated (0.80) in another cohort (unpublished data shared in personal communication with Dr R. Klein). Vessel calibre equivalents of the central retinal arteriolar equivalent (CRAE) and central retinal venular equivalent (CRVE) were estimated (in µM) for each image. 12 Fundus photographs were no longer acquired once a participant was determined to have proliferative retinopathy.
Least absolute value median regression models were used to calculate CRAE and CRVE slopes over the entire study time period; this method minimizes the sum of the squares of the residuals and is, therefore, less sensitive to large outliers than adjusted linear regression analyses, which regress to the mean. Given the skewed distributions of CRAE and CRVE over time, this method was optimal. The slopes inherently account for baseline diameter, as baseline diameter values are used in the slope calculation. Precise time points, measured as time from the baseline photograph to time of each subsequent image [(subsequent date − baseline date)/365.25], were used to account for length of time between retinal image acquisition. Cumulative averages for CRAE and CRVE were calculated for each participant by averaging the diameter of either measure across the total number of visits used to provide vessel diameters.
CI
Per methods previously described, 1 the study definition of CI was based on seven cognitive tests in which these T1D participants performed significantly worse than a group of similarly aged adults without T1D: the Digit Symbol Substitution Test (DSST; number correct in 90 s, higher scores indicate higher functioning), the Purdue Pegboard Test (time to insert pegs, dominant hand, higher scores indicate worse performance), the Stroop colour word task, F-A-S verbal fluency test, Trail Making Test B (time to complete), animals verbal fluency task and the Rey–Osterrieth Complex Figure copy task. Scores on these seven tasks were compared to published age- and education-defined norms.13–15 Participants with all seven test scores within 1.5 SD of published age- and education-defined norms were classified as ‘absent’ for CI. Participants with a single test score 1.5 SD or worse than published norms were classified as having mild CI. Participants with two or more test scores 1.5 SD or worse than published norms were classified as having clinically relevant CI. This classification method has been validated and used in large epidemiological studies. 16 It is important to note that age is considered in the normative scores of all seven tests, and education is considered in the normative scores on five of these tests (DSST, Pegboard, Trails Making Test B, F-A-S and animals verbal fluency).
Neuroimaging
Participants underwent brain imaging using 3-T Siemens Trio TIM scanners (Siemens AG, Erlangen, Germany) at the Magnetic Resonance Research Center, University of Pittsburgh, between 2010 and 2012. Details on MRI acquisition have been previously described.3,17,18 A total of 61 had fluid attenuation inversion recovery (FLAIR) images for WMH data, cognitive test data and the requisite number of retinal imaging visits. A certified neuroradiologist differentiated WMH from chronic lacunar-type infarcts, cerebral strokes and perivascular spaces by careful review. As previously described, WMH had no parenchymal loss, nor showed central suppression on the T2/FLAIR. 3 In addition, severity of WMH was visually rated using the Fazekas scale, with possible scores of 0 (no WMH/normal), 1 (mild), 2 (moderate) and 3 (severe). 19 As we have previously shown, none of these T1D participants were free of WMH; hence, Fazekas scores in this population ranged from 1 to 3. 3
Covariates
In addition to CI status and cerebral WMH, the following were assessed at time of cognitive testing, using standardized techniques: demographic factors: age (years), sex and education (years). T1D-related factors: T1D duration (years); age at T1D diagnosis (years); ‘HbA1c months’, a calculated measure, in arbitrary units, integrating severity and duration of hyperglycaemia from EDC baseline to time of cognitive testing 20 and participants were grouped as being equal/above or below the median split; average HbA1c from EDC baseline through time of cognitive testing; estimated glucose disposal rate, a measure of insulin sensitivity calculated using a regression equation derived from hyperinsulinemic – euglycaemic clamp studies; 21 use of an insulin pump; and intensive insulin therapy (defined as ⩾3 injections per day). Markers of vascular disease: prevalence of coronary artery disease, cardiac autonomic neuropathy, distal symmetric polyneuropathy, microalbuminuria and proliferative retinopathy were available for all participants. 7 Cardio-metabolic factors: systolic and diastolic blood pressures (mmHg), history of high blood pressure (any blood pressure reading ⩾140/90 since EDC baseline or any self-reported use of anti-hypertensive medication) and body mass index (BMI, kg/m2). Lifestyle factors: self-reported smoking status (ever vs never smoking 100+ cigarettes), self-reported consumption of any alcoholic beverage over the past year (yes/no) and self-reported weekly energy expenditure (estimated kCal, per modified Paffenbarger questionnaire). 22
Statistical analyses
Descriptive statistics examined sample mean (SD) or N (percentage) of participants’ characteristics, neuropsychological test scores and Fazekas score, as appropriate. Median and interquartile ranges were calculated for CRAE and CRVE values at each study visit; medians, rather than means, were examined because of skewed distributions and to be consistent with median regression analyses used to calculate CRAE and CRVE slopes. Wilcoxon Mann–Whitney tests were used to examine the median trends of CRAE and CRVE across all time points.
Spearman’s correlations tested associations of cumulative averages and slopes of CRAE and CRVE with CI status and population characteristics. Separate median regression models were used to examine the unadjusted associations between CI and CRAE (or CRVE): (1) at the initial visit, (2) at the final visit, (3) change over time (i.e. slope) and (4) cumulative average. To test the hypothesis that the associations between retinal measures and CI would differ by severity of hyperglycaemia, proliferative retinopathy and WMH, interactions for each of these risk factors with CI were examined. Models were also adjusted for T1D duration, any alcohol beverage consumption, ever smoker status and corresponding CRVE (or CRAE) values (i.e. initial value, slope or cumulative average). Sensitivity analyses were conducted to determine whether the significant associations remained among those with ⩽10 years of follow-up.
Results
Sample characteristics
Consistent with our prior report on a subsample of the EDC cohort, more than 50% of the participants had mild to clinically relevant CI. 1 On average, participants were diagnosed with T1D at 9 years of age. At time of neurocognitive testing, participants ranged in age from 32.2 to 61.7 years, with T1D duration ranging from 31.5 to 48.5 years. Similar to the parent cohort, participants were predominantly white and had a similar sex distribution (Table 1). Compared with those excluded from analyses due to having fewer than three retinal vasculature images, no cognitive assessment or CRAE/CRVE values that were extreme outliers, the 119 participants included in the analytic sample were significantly younger (mean 49.6 ± 7.0 vs 53.0 ± 7.44 years, p = 0.002), with shorter T1D duration (mean 41.2 ± 6.0 vs 44.7 ± 7.5 years, p = 0.001). No significant differences in race (p = 0.94), sex (p = 0.11) or education (p = 0.12) were found.
Participant characteristics of adults with childhood-onset type 1 diabetes from the Pittsburgh Epidemiology of Diabetes Complications Study. Measurements are from time of cognitive assessment in N = 119 unless otherwise noted.
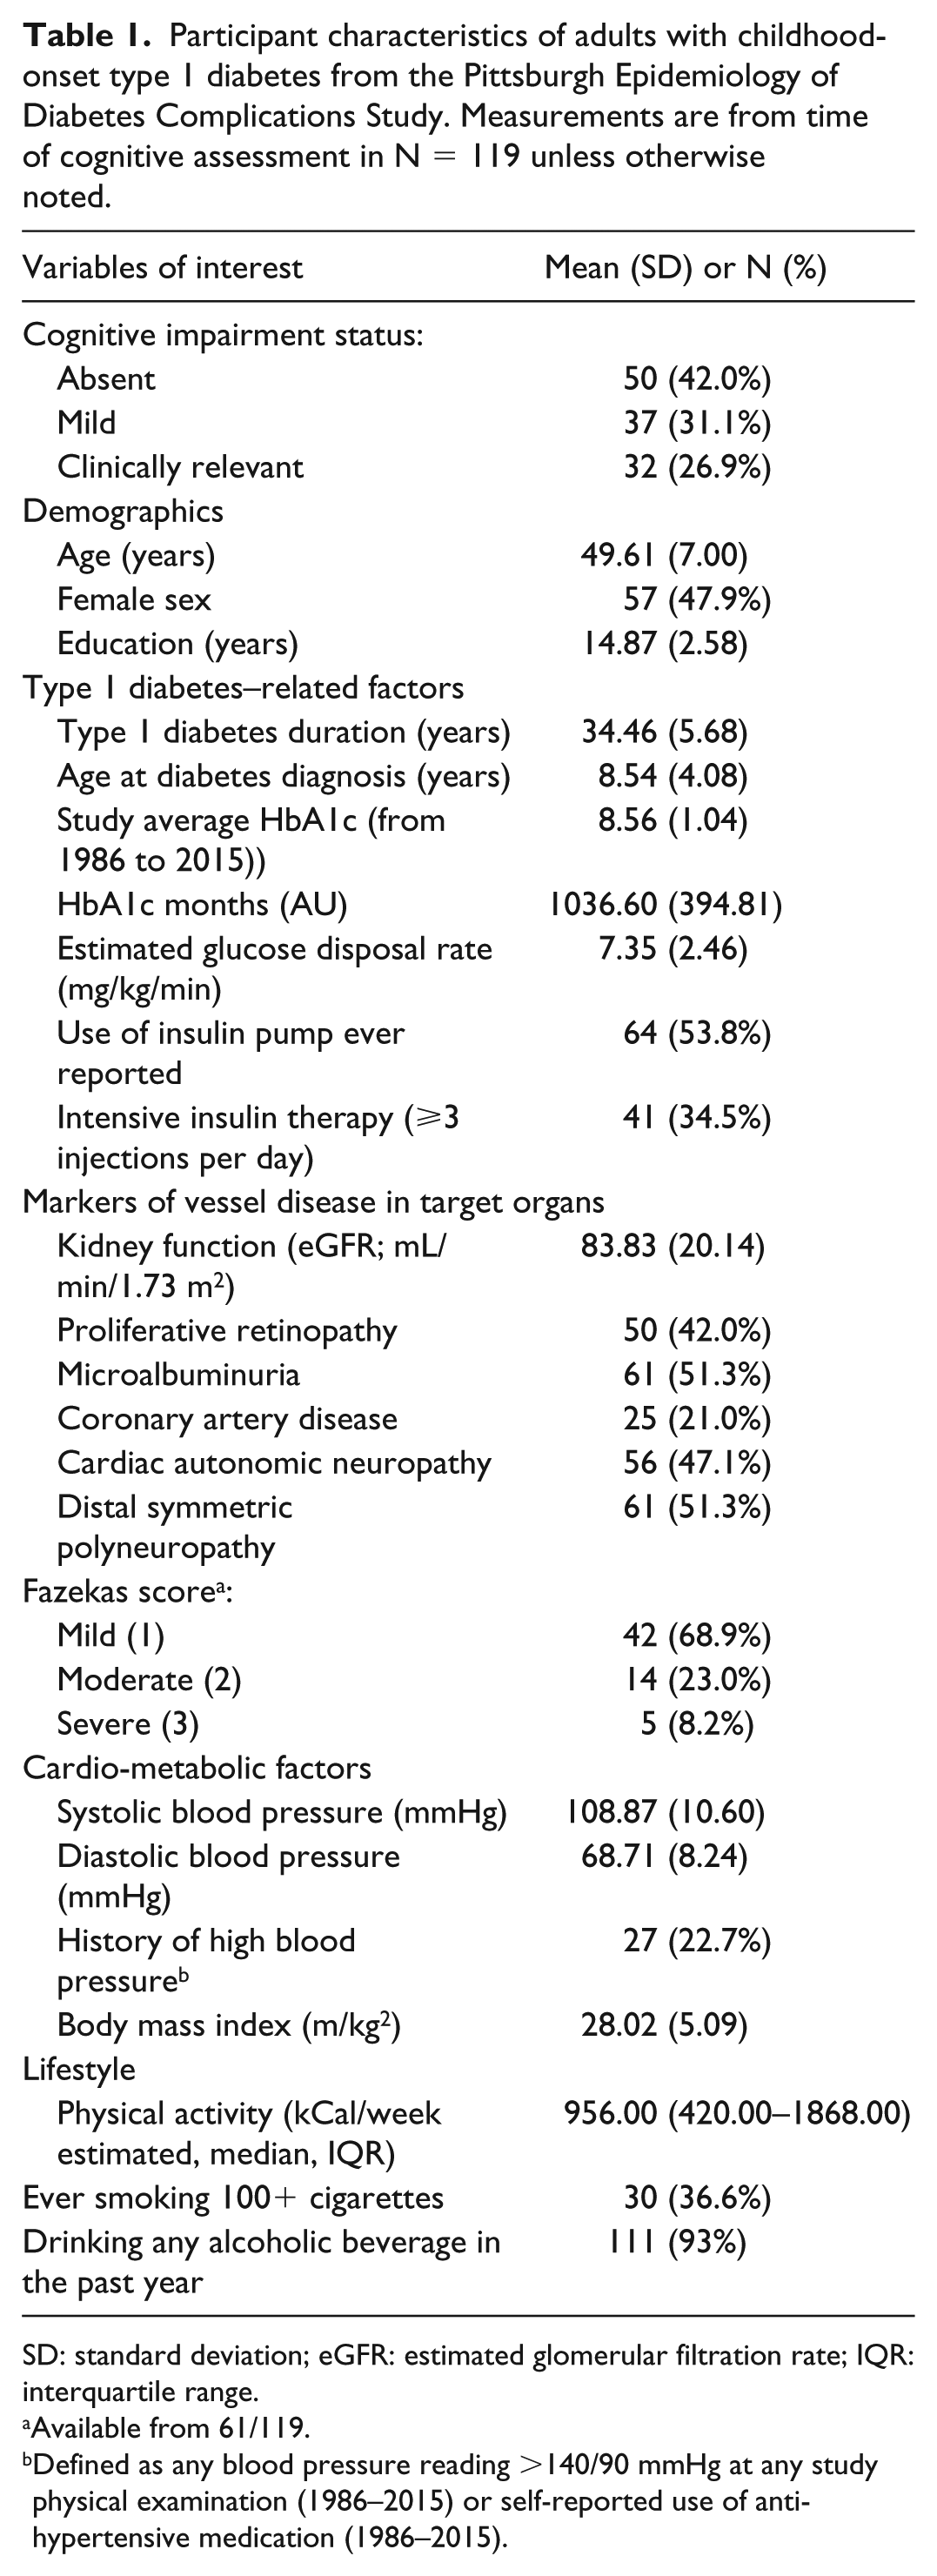
SD: standard deviation; eGFR: estimated glomerular filtration rate; IQR: interquartile range.
Available from 61/119.
Defined as any blood pressure reading >140/90 mmHg at any study physical examination (1986–2015) or self-reported use of anti-hypertensive medication (1986–2015).
Overall characteristics of longitudinal changes in CRAE and CRVE
There was a statistically significant decrease in both CRAE and CRVE over time (Figure 1). Wilcoxon Mann–Whitney tests showed a significant trend in median CRAE and CRVE values across all time points (χ2 = 154.54, p < 0.0001 and χ2 = 144.80, p < 0.0001, respectively). Specifically, CRAE decreased by an estimated 0.03 ± 1.13 µM/year, for a total reduction of 13% over the entire follow-up time; CRVE decreased by an estimated 1.49 ± 2.09 µM/year, for a total reduction of 15% over the entire follow-up time (Figure 2).
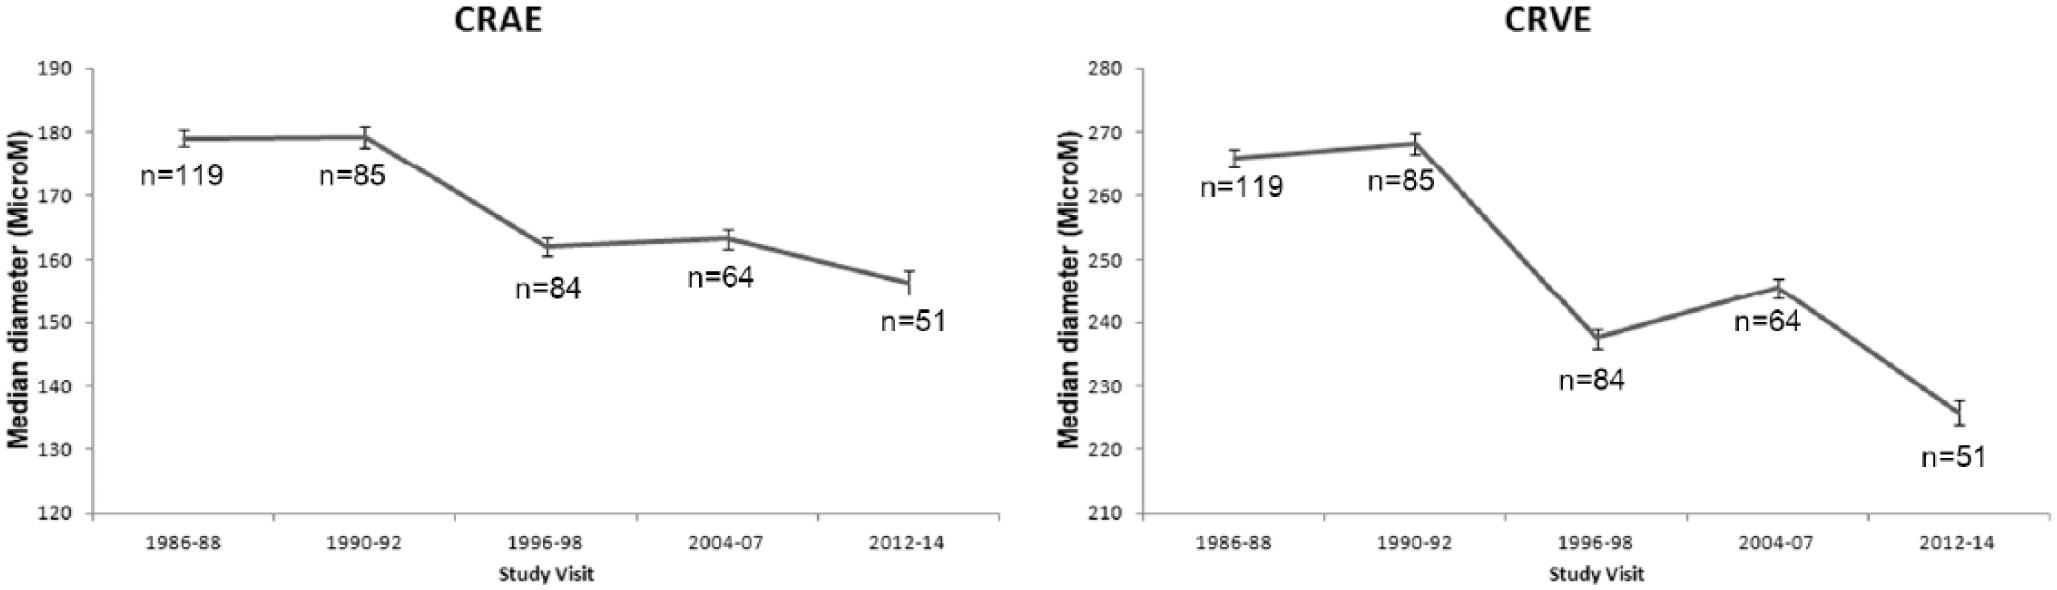
Median CRAE and CRVE values (±standard errors) over time for N = 119 adults with childhood-onset type 1 diabetes from the Pittsburgh Epidemiology of Diabetes Complications Study.
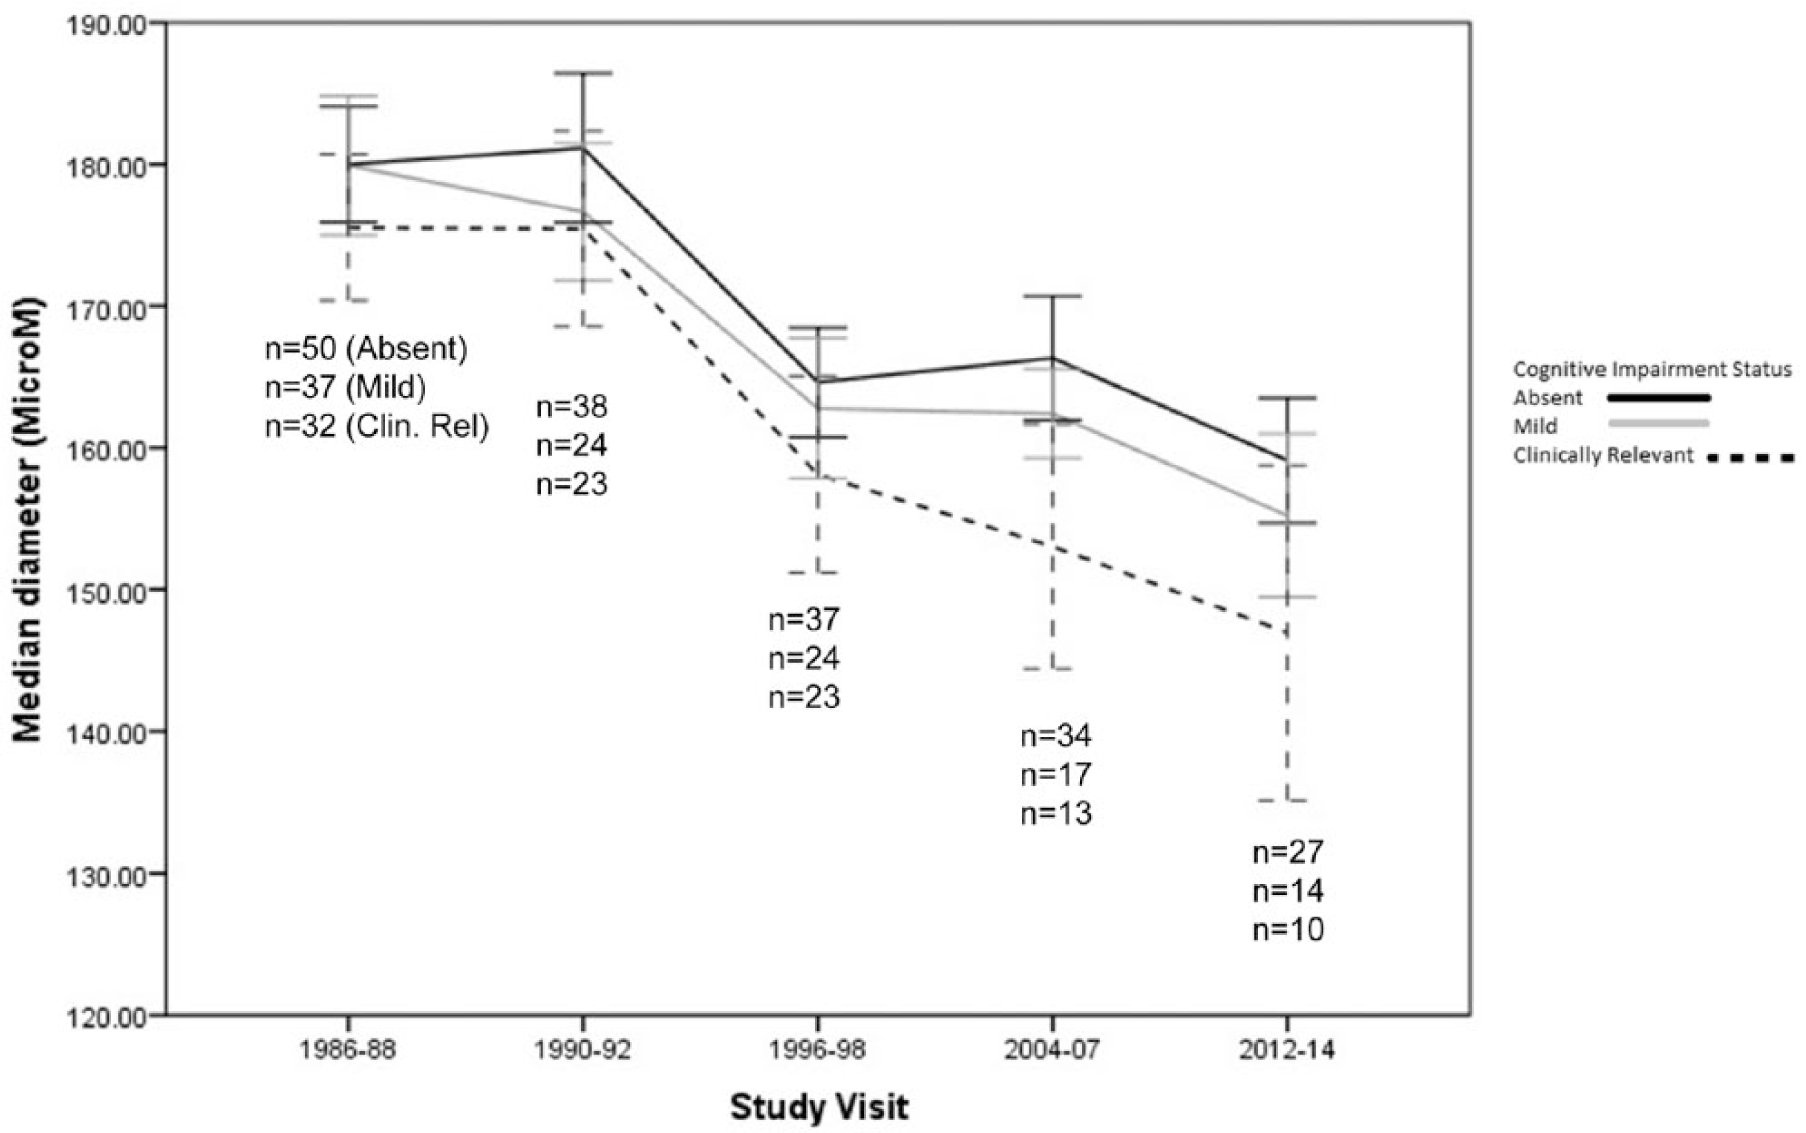
Change in median CRAE (±standard errors) over time, by cognitive impairment status, among N = 119 middle-aged adults with childhood-onset type 1 diabetes from the Pittsburgh Epidemiology of Diabetes Complications Study.
Relationships of prevalent CI with longitudinal changes in CRAE and CRVE
Compared to participants without CI, those with clinically relevant CI showed 1.8% greater CRAE narrowing (cumulative average) and 31.1% faster CRAE narrowing (slope) during prior years (Table 2). CRAE narrowing was slightly greater (0.3% difference in cumulative average) and faster (2.0% difference in slope) for those without CI than those with mild CI (Table 2).
Median and interquartile ranges of CRAE and CRVE measures by cognitive impairment status among N = 119 adults with childhood-onset type 1 diabetes from the Pittsburgh Epidemiology of Complications Study.
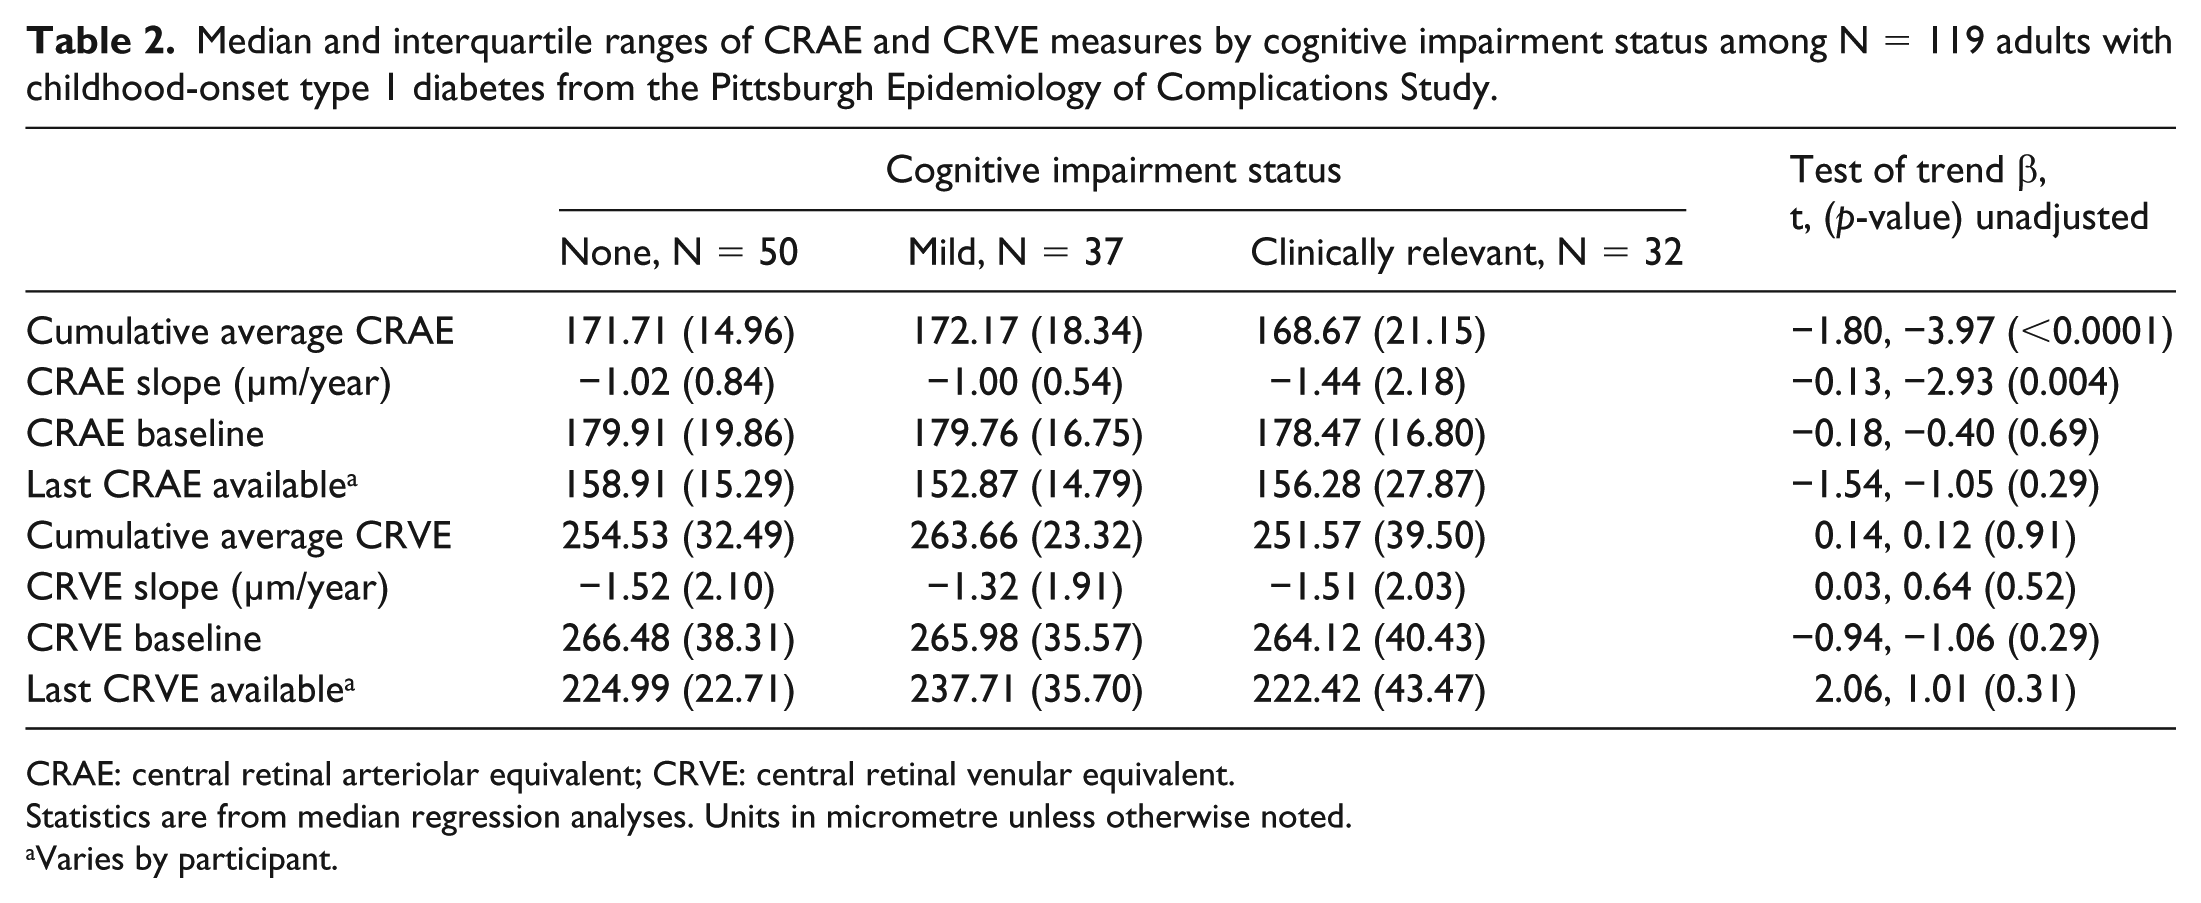
CRAE: central retinal arteriolar equivalent; CRVE: central retinal venular equivalent.
Statistics are from median regression analyses. Units in micrometre unless otherwise noted.
Varies by participant.
In unadjusted median regression models, associations between longitudinal measures of CRAE and CI were statistically significant (Table 2). Adjusting for T1D duration slightly attenuated these associations (slope: β = −0.13, t = −2.50, p = 0.01; cumulative average β = −0.91, t = −1.85, p = 0.06), as did adjustment every consuming alcohol (slope: −0.09, t = −2.07, p = 0.04; cumulative average: β = −1.20, t = −1.80, p = 0.07). Adjustment by history of ever smoking and greater or faster CRVE narrowing did not attenuate either association at all (data not shown). Sensitivity analyses limited to those with ⩽10 years of follow-up (n = 39) found similar associations (slope: β = −0.54, t = −2.42, p = 0.02; cumulative average β = −1.75, t = −2.81, p = 0.06).
Interactions of CRAE slope with HbA1c months median cut-off (β = 0.36, t = 1.54, p = 0.13), proliferative retinopathy (β = −0.46, t = −1.28, p = 0.20) or Fazekas score (β = −0.11, t = −1.00, p = 0.32) were not statistically significant, nor were interactions of these variables with CRAE cumulative average (data not shown). CI was not significantly associated with CRAE at baseline or at last assessment, nor was it associated with any of the CRVE measures.
Participants’ characteristics and longitudinal changes in CRAE and CRVE
CRAE slope, but not cumulative average, was inversely correlated with HbA1c, HbA1c months and proliferative retinopathy. Associations between CRAE slope and cumulative average with other markers of microvascular disease, demographic factors or blood pressure measures were not statistically significant at p < 0.05. CRVE slope was inversely associated with age (r = −0.23, p = 0.01), T1D duration (r = −0.18, p = 0.05) and cardiac autonomic neuropathy (r = −0.20, p = 0.03) but not with other factors (Supplementary Table 1). Importantly, in the small sample of participants with graded WMH, we found non-statistically significant associations although they trended in the expected direction (Fazekas score with CRAE slope: Spearman’s ρ = −0.19, p = 0.14; Table 3). All other associations were not significant (p > 0.05; Supplementary Table 1).
Associations between CRAE cumulative average and slope with characteristics of N = 119 adults with childhood-onset type 1 diabetes from the Pittsburgh Epidemiology of Diabetes Complications Study.
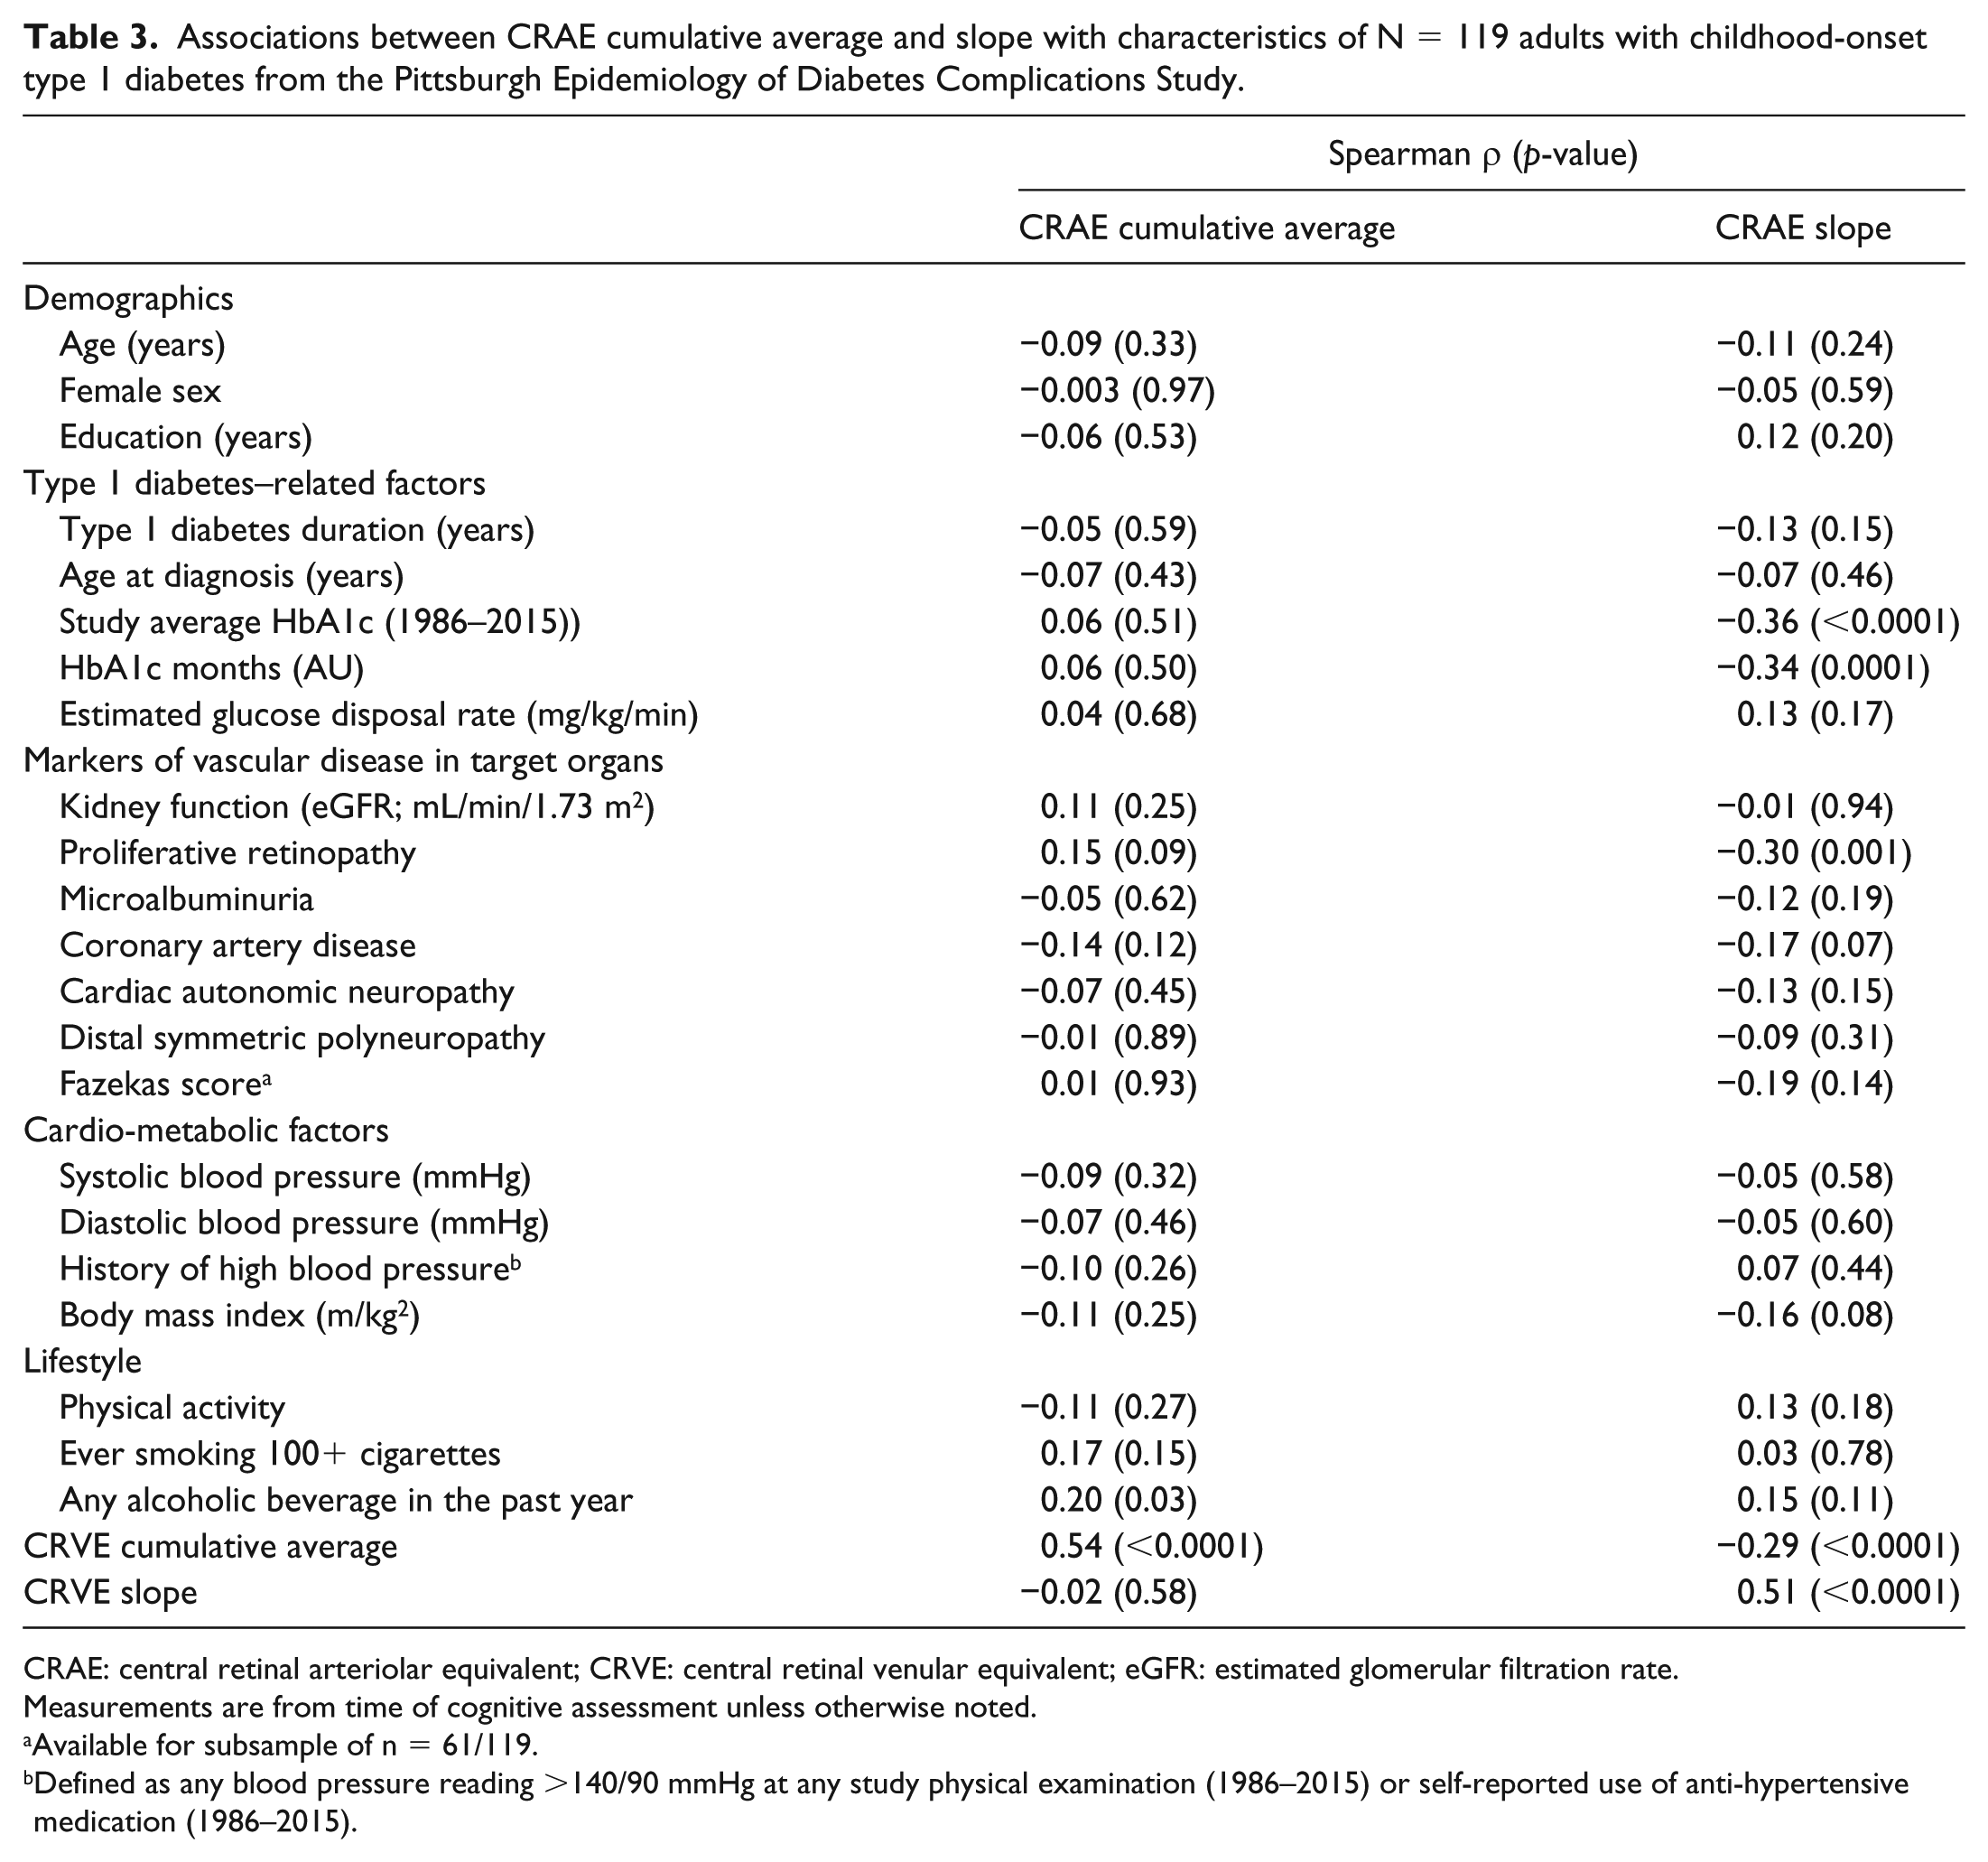
CRAE: central retinal arteriolar equivalent; CRVE: central retinal venular equivalent; eGFR: estimated glomerular filtration rate.
Measurements are from time of cognitive assessment unless otherwise noted.
Available for subsample of n = 61/119.
Defined as any blood pressure reading >140/90 mmHg at any study physical examination (1986–2015) or self-reported use of anti-hypertensive medication (1986–2015).
Discussion
In this population of middle-aged adults living with T1D since childhood, greater and faster narrowing of CRAE, but not CRVE, was associated with having CI. Associations were independent of hyperglycaemia and of other markers of microvascular diseases, specifically proliferative retinopathy and WMHs in the brain.
Our findings bridge several gaps in knowledge and support that narrowing of CRAE over time may serve as a non-invasive biomarker of CI in T1D. Patton et al. 23 provided a detailed review of the homology between the vascular networks supplying the retina and the brain and that markers of retinal vascular imaging reflects changes in cerebral vasculature. Studies of non-T1D populations24–26 have shown associations between longitudinal changes in retinal arteriolar measures and WMH, but associations have not yet been tested in T1D. In our report, there was no association between WMH and CRAE longitudinal measures, although they trended in the expected direction. While the small sample size could have masked significant associations, it is also possible that CRAEs are markers of earlier changes in cerebral microvasculature as compared to WMH. Future studies in larger sample sizes with markers of earlier stages of cerebral microvascular disease, such as cerebral blood flow or reactivity, are warranted.
We found distinct patterns of risk factors associated with longitudinal measures of CRAE, which further support the link between retinal vasculature changes and CI. There was a strong association between hyperglycaemia and CRAE. Hyperglycaemia is a risk factor for the development of microvascular disease in the brain27,28 and in the eye, 29 as well as CI in adults with T1D.1–3,30,31 It has been suggested that hyperglycaemia induces systemic micro- and macrovascular damage 32 through a variety of mechanisms including oxidative stress, 33 accumulation of advanced glycation end products 34 and inhibition of endothelial nitric oxide synthase activity. 35 However, in this report, associations between CRAE longitudinal measures and CI did not differ by severity of hyperglycaemia. Thus, the results of this study suggest that other neurodegenerative pathways, in addition to hyperglycaemia, may be at play and link arteriolar narrowing and CI.
Hypertension is considered a primary risk factor for narrowing of retinal vessels in non-T1D studies.36,37 However, we found no significant association in this T1D cohort, similar to findings from another T1D study. 38 It is possible, for middle-aged or older people living with T1D since childhood, prolonged exposure to hyperglycaemia contributes more to the narrowing of retinal vessels than does high blood pressure. These individuals have been exposed to the deleterious effects of hyperglycaemia on the vasculature since childhood, as compared with a shorter window of exposure to high blood pressure (since middle age). Additionally, blood pressure is well controlled in this T1D population, and this could explain the non-significant association between hypertension and narrowing of the retinal vessels.
Unlike CRAE measures, CRVE measures were not significantly associated with CI status or proliferative retinopathy. These results are consistent with CRAE measures, but not CRVE measures, being associated with microvascular complications in an earlier study of middle-aged Danish T1D patients 39 and with cognitive performance in T1D participants of the Wisconsin Epidemiologic Study of Diabetes Retinopathy. 6 We also replicated results of the Beaver Dam Eye Study showing CRVE was related to older age in our T1D participants. 40 The reasons for these disparate relationships between CRAE and CRVE are not known and deserve further study.
There are several strengths that should be considered when interpreting the results. This study utilized a well-characterized T1D cohort with repeated fundus photographs over time, allowing us to examine long-term change, an average of 18 years, in retinal vascular measures. An extensive neurocognitive test battery was used, with test scores compared to age-appropriate norms, as well as MRI imaging with graded WMH data, so brain ageing was evaluated from different perspectives. There were also a large amount of data collected on study participants, allowing us to adjust the associations of interest by multiple demographic, comorbid and T1D-related characteristics. Weaknesses should also be considered. A relatively small sample size was followed for the full study duration, and at each time point, smaller samples had complete retinal imaging data, thus reducing power of longitudinal analyses. All study participants were diagnosed with T1D in childhood, so results may not be generalizable to individuals diagnosed with T1D in adulthood. A survivor bias may be present as these participants likely differ from the EDC participants who died before the ancillary neurocognitive study in 2010–2015. A selection bias is also possible in that those who participated in the ancillary neurocognitive study tended to be healthier than those who chose not to participate in the ancillary study.1,3 Additionally, requiring ⩾3 retinal images could have introduced a healthier participant selection bias. Shorter follow-up times could be due to dropout due to illnesses or because those developing proliferative retinopathy did not receive further fundus examinations. However, sensitivity analyses limited to those with follow-up time ⩽10 years found similar associations, and the health factors that would prevent participation in this study are also correlated with CI and with greater CRAE narrowing over time, so results likely underestimate the true relationship between these factors. Finally, precise information on time of onset of CI is not available. Thus, future studies are needed to validate the role of retinal changes as biomarkers of early cognitive change. However, severity of CI is moderate in this voluntary-based sample, and it is likely that we have captured the process of cognitive decline at a relatively early stage.
In summary, narrowing of the retinal arterioles over time may allow clinicians to identify their T1D patients at an increased risk of CI. Future studies should investigate whether improving glycaemic control ameliorates existing damage to the retinal arterioles and to determine the specific rate of change or degree of narrowing of CRAE over time that is predictive of developing CI in adults with T1D.
Footnotes
Acknowledgements
K.N. was responsible for writing this article, managing, interpreting data and reviewing the literature. A.L.M. was responsible for data management, cleaning, analyses, creating tables and figures and writing this article. R.K. and B.E.K. were responsible for analysing retinal image data, interpreting retinal imaging data and reviewing this article. J.A.S. assisted in selecting the neurocognitive test battery, interpreting test scores, determining cognitive status and reviewing this article. T.J.O. assisted in study funding, cohort development, study design, interpreting data analyses and reviewing this article. T.C. aided in study design, cohort development, interpreting data and reviewing this article. H.J.A. was responsible for processing and interpreting brain imaging data and reviewing this article. C.R. provided study funding, study design, data analyses and interpretation and helped write this article. C.R. is the guarantor of this work and, as such, had full access to all the data in the study and takes responsibility for the integrity of the data and the accuracy of the data analysis.
Declaration of conflicting interests
The author(s) declared no potential conflicts of interest with respect to the research, authorship and/or publication of this article.
Funding
C.R. is the principal investigator of the neurocognitive and retinal imaging study of participants with T1D, National Institute of Diabetes and Digestive and Kidney Diseases grant R01 DK089028. T.J.O. is the principal investigator of the T1D cohort/EDC Study, National Institute of Diabetes and Digestive and Kidney Diseases grant R37 DK034818-33, which provided data on population characteristics for the participants with T1D.
Prior presentation
Part of this study was presented in poster format at the 77th ADA Scientific Sessions, San Diego, CA, 9–13 June 2017.
References
Supplementary Material
Please find the following supplemental material available below.
For Open Access articles published under a Creative Commons License, all supplemental material carries the same license as the article it is associated with.
For non-Open Access articles published, all supplemental material carries a non-exclusive license, and permission requests for re-use of supplemental material or any part of supplemental material shall be sent directly to the copyright owner as specified in the copyright notice associated with the article.