
Abstract
Objective:
The haptoglobin 2-2 genotype is associated with lower haptoglobin concentrations and atherosclerosis in diabetes. Endothelial cell apoptosis contributes significantly to atherosclerosis. We studied endothelial cell apoptosis in diabetes patients with haptoglobin 2-2 and non-haptoglobin 2-2 genotype.
Approach and results:
We pooled plasma from 10 patients with haptoglobin 2-2 and non-haptoglobin 2-2 genotype and quantified endothelial cell apoptosis using a hemodynamic lab-on-chip system. Then, we conducted similar experiments on individual diabetes plasma samples with the haptoglobin 2-2 (n = 20) and non-haptoglobin 2-2 genotype (n = 20). Haptoglobin beta concentrations were measured by Western blot analysis. We looked for association with demographic, metabolic variables, inflammation and oxidative stress. In pooled plasma, endothelial cell apoptosis was higher in haptoglobin 2-2 group (haptoglobin 2-2: 23.18% vs non-haptoglobin 2-2:15.32%). In individual samples, univariate analysis showed that endothelial cell apoptosis correlated with haptoglobin beta concentration [β = −10.29 (95% confidence interval: −13.44, −7.14), p < 0.001] and total haptoglobin concentration [β = −0.03 (95% confidence interval: −0.05, −0.002), p = 0.03]. After multivariable analysis, only haptoglobin beta concentrations remained significant [β = −9.24 (95% confidence interval: −13.10, −5.37), p < 0.001]. The interaction term between haptoglobin genotypes and haptoglobin beta was not significant (p > 0.05).
Conclusion:
These results show that regardless of the haptoglobin genotype, haptoglobin is associated with prevention of endothelial cell apoptosis in diabetes.
Introduction
The haptoglobin 2-2 (Hp2-2) genotype is associated with atherosclerosis in patients with type 2 diabetes mellitus (T2DM). This has been attributed to decreased affinity of haptoglobin (Hp) to haemoglobin, diminished clearance of Hp2-2-haemoglobin complexes and impaired anti-inflammatory pathways. 1 We have seen that the Hp2-2 genotype is associated with lower Hp concentrations, higher inflammation and atherosclerosis in T2DM. 2
Endothelial dysfunction is considered to be the initiating event in atherosclerosis and precedes the development of diabetes.3,4 Endothelial cell apoptosis (EC apoptosis) in response to inflammation and oxidative stress may increase smooth muscle cell proliferation and migration, enhance blood coagulation and increase leukocyte infiltration into the endothelium thus leading to endothelial dysfunction. 5
We developed an in vitro hemodynamic lab-on-chip model mimicking the physiological pulsatile nature of the blood flow in the vascular system.6–8 Using this system, we previously observed in a few T2DM cases that Hp concentration was significantly lower in plasma of diabetes patients with a higher rate of EC apoptosis. 8
Hp concentrations are known to be lower in individuals with Hp2-2 genotype and in individuals with single-nucleotide polymorphism (SNP) rs2000999. 9 However, the effect of the Hp2-2 genotype in diabetes patients on EC apoptosis has not been studied previously. In this study, we aim to investigate the correlation between the Hp concentrations and the ability to induce EC apoptosis in T2DM patients with Hp2-2 compared with non-Hp2-2 genotypes.
Methods and materials
From the initial study, 2 as described earlier wherein we had recruited 160 known T2DM individuals and performed Hp genotyping, we first performed a pilot study using 10 randomly selected Hp2-2 genotype and 10 non Hp2-2 genotype samples. We subsequently chose 20 consecutive subjects with the Hp2-2 genotype and 20 subjects with non Hp2-2 genotype who had donated larger volumes of blood samples for future research. The exclusion criteria included intercurrent illness, serum creatinine >200 µmol/L, history of previous cardiovascular events, ischaemic cerebrovascular disease or peripheral arterial disease. Informed consent was obtained from all patients, and this study was approved by the Institutional Review Board [(NHG DSRB) Ref Nos.: 2013/01235 and 2014/00236]. Base-line characteristics of these 40 patients are presented in Supplementary Table 1. The subjects’ demographics, anthropometrics and blood pressure were recorded. Hp concentrations and high-sensitivity C-reactive protein (hsCRP) levels were measured by turbidimetry. The total haptoglobin beta (Hpβ) concentrations of plasma samples were determined by Western Blot Analysis. Glycated haemoglobin (HbA1c) was determined by immunoturbidimetric measurement (Beckman Coulter, Inc., Brea, CA, USA). Carotid ultrasonography was performed by two operators trained before study initiation following the recommendations of the Mannheim carotid intima media thickness (CIMT) consensus. 10
Genomic DNA was extracted from peripheral blood using QIAamp DNA kit (Qiagen). Hp genotyping and genotyping for SNP rs2000999 were performed using TaqMan-based real-time polymerase chain reaction according to the study of Soejima and Koda. 11 Oxidative stress index was calculated using the commercial assay (Diacron, Grosseto, Italy) as developed by Vassalle et al. 12
The continuous variables are described as mean (standard deviation (SD)) or median (interquartile range (IQR)) after assessing normality. Categorical variables are summarized using frequency (percentage). We compared the continuous baseline variables in the Hp2-2 and non Hp2-2 genotypes using independent sample t-test or Mann–Whitney U test depending on the normality of the variables. Difference in percentages between Hp2-2 and non Hp2-2 genotypes was tested using χ2 test for categorical baseline variables. Univariate analysis was performed to examine EC apoptosis in the Hp genotypes against demographics, metabolic variables, Hp concentrations, hsCRP, iron indices and oxidative stress index. The associations between EC apoptosis and the above variables were subsequently analysed using multivariable regression model. For the multivariable analysis, all the variables chosen in the univariate analysis were included. To adjust for collinearity, we used non-high-density lipoprotein (HDL) cholesterol instead of all lipid variables and ferritin only among the iron indices. To assess whether associations differ by Hp, a single interaction model was used including Hp, Hpb and their interaction. All analysis was done using STATA version 13.1 (Stata Corp, College Station, TX, USA), and a p value less than 0.05 was considered to indicate statistical significance.
Microfluidic-based apoptotic assay
We used the in vitro hemodynamic lab-on-chip model (microfluidic system) mimicking the physiological pulsatile nature of the vascular system.6–8 In brief, human umbilical vein endothelial cells (HUVEC)-C3 cells expressing a fluorescence resonance energy transfer (FRET)-based biosensor that changes colour from green to blue in response to caspase-3 activation during apoptosis were cultured in Dulbecco’s Modified Eagle’s Medium (DMEM) containing 500 μg/mL G-418 sulphate (Gibco, Gaithersburg, MD, USA) to maintain the FRET sensor in the stable cell line. A suspension of cells at a density of approximately 1 × 10⁷ cells/mL was injected into the microfluidic channels at the dimensions of width = 600 µm, height = 150 µm, and length = 1.5 cm for 2 days to form an intact monolayer. Culture medium (15 mL) containing 10% of patient’s plasma (1.5 mL) and 10 mmol/L glucose was applied to HUVEC-C3 sensor cells in a pulsatile flow rate of 2.21 µL/s producing an average shear stress of 23.6 dyne/cm2 for 8 h, which is equivalent to the shear stress generated in blood flow under a pulse rate of 110 beats/min. Afterwards, cells were cultured under a static condition in the CO2 incubator for another 40 h to allow major apoptotic events such as caspase-3 or -7 activation to occur.
We first performed a pilot study, wherein we took blood samples from diabetes patients with the Hp2-2 (n = 10) and with non-Hp2-2 genotype (n = 10) and performed western blot assay for Hpβ concentrations and then pooled the samples for the apoptotic assay. For each genotype, 250 µL plasma was taken from each sample, and a total of 2.5 mL plasma was obtained for each group. The glucose concentration was adjusted to 10 mmol/L to avoid the effect of glucose variants. Subsequently individual plasma samples from 40 diabetes patients with the Hp2-2 (n = 20) and non-Hp2-2 genotype (n = 20) were used to run the microfluidic-based apoptotic assay and western blot assay for Hpβ concentrations.
Results
In the pilot study, there was no difference in the mean Hpβ concentration between these two genotypes (Hp2-2 = 0.9 vs non-Hp2-2 = 0.91, p > 0.05) (Figure 1(a)). Because the volume of individual plasma sample was too low to conduct our microfluidic-based apoptotic assay, the plasma samples from each Hp genotype were pooled and used in this experiment. HUVEC-C3 cells were grown in the microfluidic channels for 2 days to form an intact monolayer, and culture medium containing 10% of patient’s plasma plus 10 mmol/L glucose was applied to the cells in a pulsatile manner under a shear stress of 23.6 dyne/cm2 for 8 h. Afterwards, cells were cultured under a static condition in a CO2 incubator for another 40 h. FRET images were obtained by fluorescence microscopy (Figure 1(b)), and the quantified results revealed that plasma from Hp2-2 group caused significantly higher rate of EC apoptosis (23.18%) than that from non-Hp2-2 group (15.32%) (Figure 1(c)).
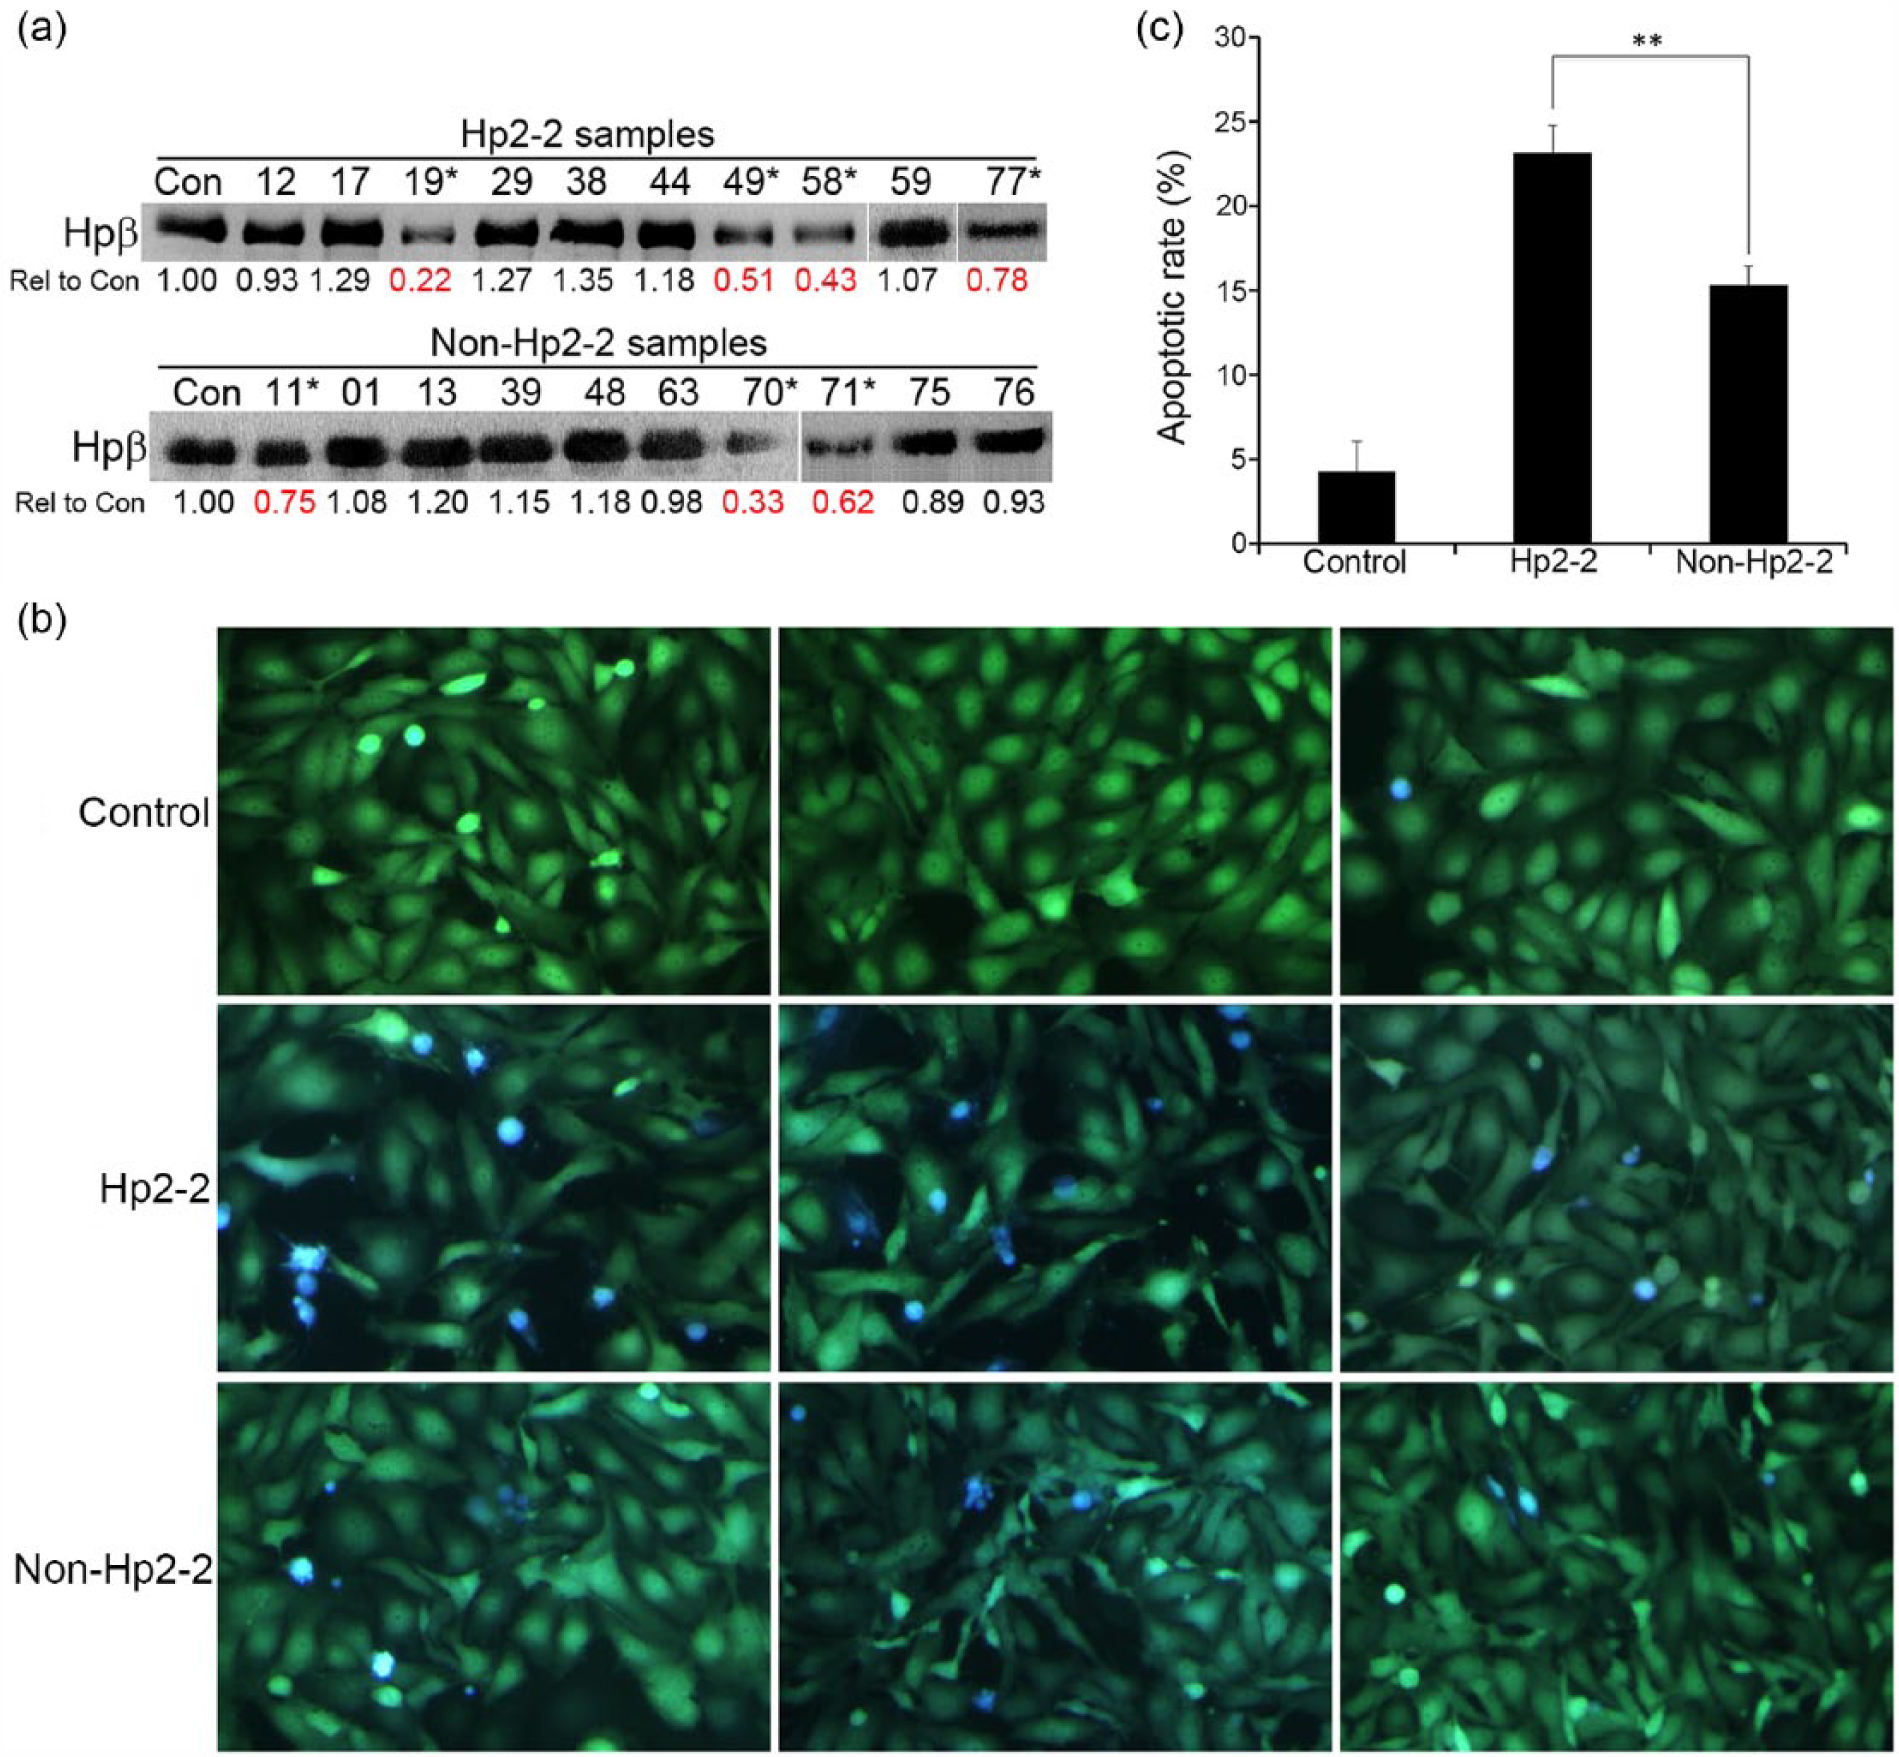
Pooled plasma samples of Hp2-2 group result higher EC apoptosis: (a) Western blot analysis of Hpβ from a control plasma, 10 Hp2-2 and 10 non-Hp2-2 plasma. The values of ‘Rel to Con’ represent the ratio of the band intensity of Hpβ from each sample over the band intensity of the control. * indicates the samples with lower concentrations of Hpβ, (b) representative FRET images of HUVEC-C3 cells treated with plasma from a healthy control, pooled Hp2-2 (n = 10) and non-Hp2-2 (n = 10) samples, respectively. Glucose concentrations were adjusted to 10 mmol/L. Live cells appear in green and apoptotic cells appear in blue and (c) apoptotic rates were calculated using the formula of apoptotic rate (%) = number of blue cells/(number of blue and green cells) × 100. A total of 200–300 cells from at least three observation fields were counted, p < 0.05.
To confirm the correlation between the Hpβ concentrations and apoptotic rates, we subsequently performed individual experiments using the plasma samples from 20 Hp2-2 and 20 non-Hp2-2 patients (who had donated larger plasma samples for future research). For individual plasma analysis, the baseline characteristics in terms of age, gender, duration of diabetes, body mass index (BMI), HbA1c, lipid profile, C-reactive levels and carotid artery intima media thickness of the 20 patients in each group, were well matched (Supplementary Table 1). The only variable that was different in Hp2-2 individuals was the lower Hp concentrations (p < 0.05). The Hpβ concentrations as measured by Western blotting varied significantly among individual samples (Figure 2(a)). An average Hp-beta concentration was tested using a group of plasma samples from healthy volunteers, and all the results using T2DM patients plasma samples were compared to it as a ratio. The mean ratio of Hp-beta concentration was 0.83 ± 0.27 from 20 Hp2-2 samples and 0.80 ± 0.30 from 20 non-Hp2-2 samples (p = 0.67) (Figure 2(a)). We then used our microfluidic system to quantify apoptotic rate of HUVEC-C3 cells in each plasma samples. Figure 2(b) and (c) shows representative FRET images from four samples of Hp2-2 and non-Hp2-2, and Figure 2(d) displays quantified apoptotic rates from all 40 patients’ plasma. The mean EC apoptosis rates were 17.04% in Hp2-2 and 16.69% in non-Hp2-2 patients (p = 0.78). A multivariable analysis examining EC apoptosis with the variables: age, Hpβ concentrations, blood pressure, glucose, HbA1c, non HDL-cholesterol, CRP, total Hp, ferritin and oxidative stress index showed that only Hpβ remained significant [β = −9.24 (95% confidence interval (CI): −13.10, −5.37), p < 0.001] (Supplementary Table 2). Further analysis revealed a correlation between lower concentrations of Hpβ and higher rates of EC apoptosis both in Hp2-2 group (R2 = 0.6764, p < 0.001, Figure 2(e)) and in non-Hp2-2 group (R2 = 0.4652, p = 0.001, Figure 2(f)). To assess whether associations differ by Hp, a single interaction model was used to test the interaction between Hp genotypes and Hpβ in causing EC apoptosis. The interaction term was not statistically significant (p = 0.90) showing no significant differences in the interaction between Hpβ and Hp genotypes in causing EC apoptosis. Only one sample with Hp2-2 genotype also had the SNP rs2000999. The Hpβ concentration in this individual was higher than the average Hpβ concentration in the Hp2-2 group.
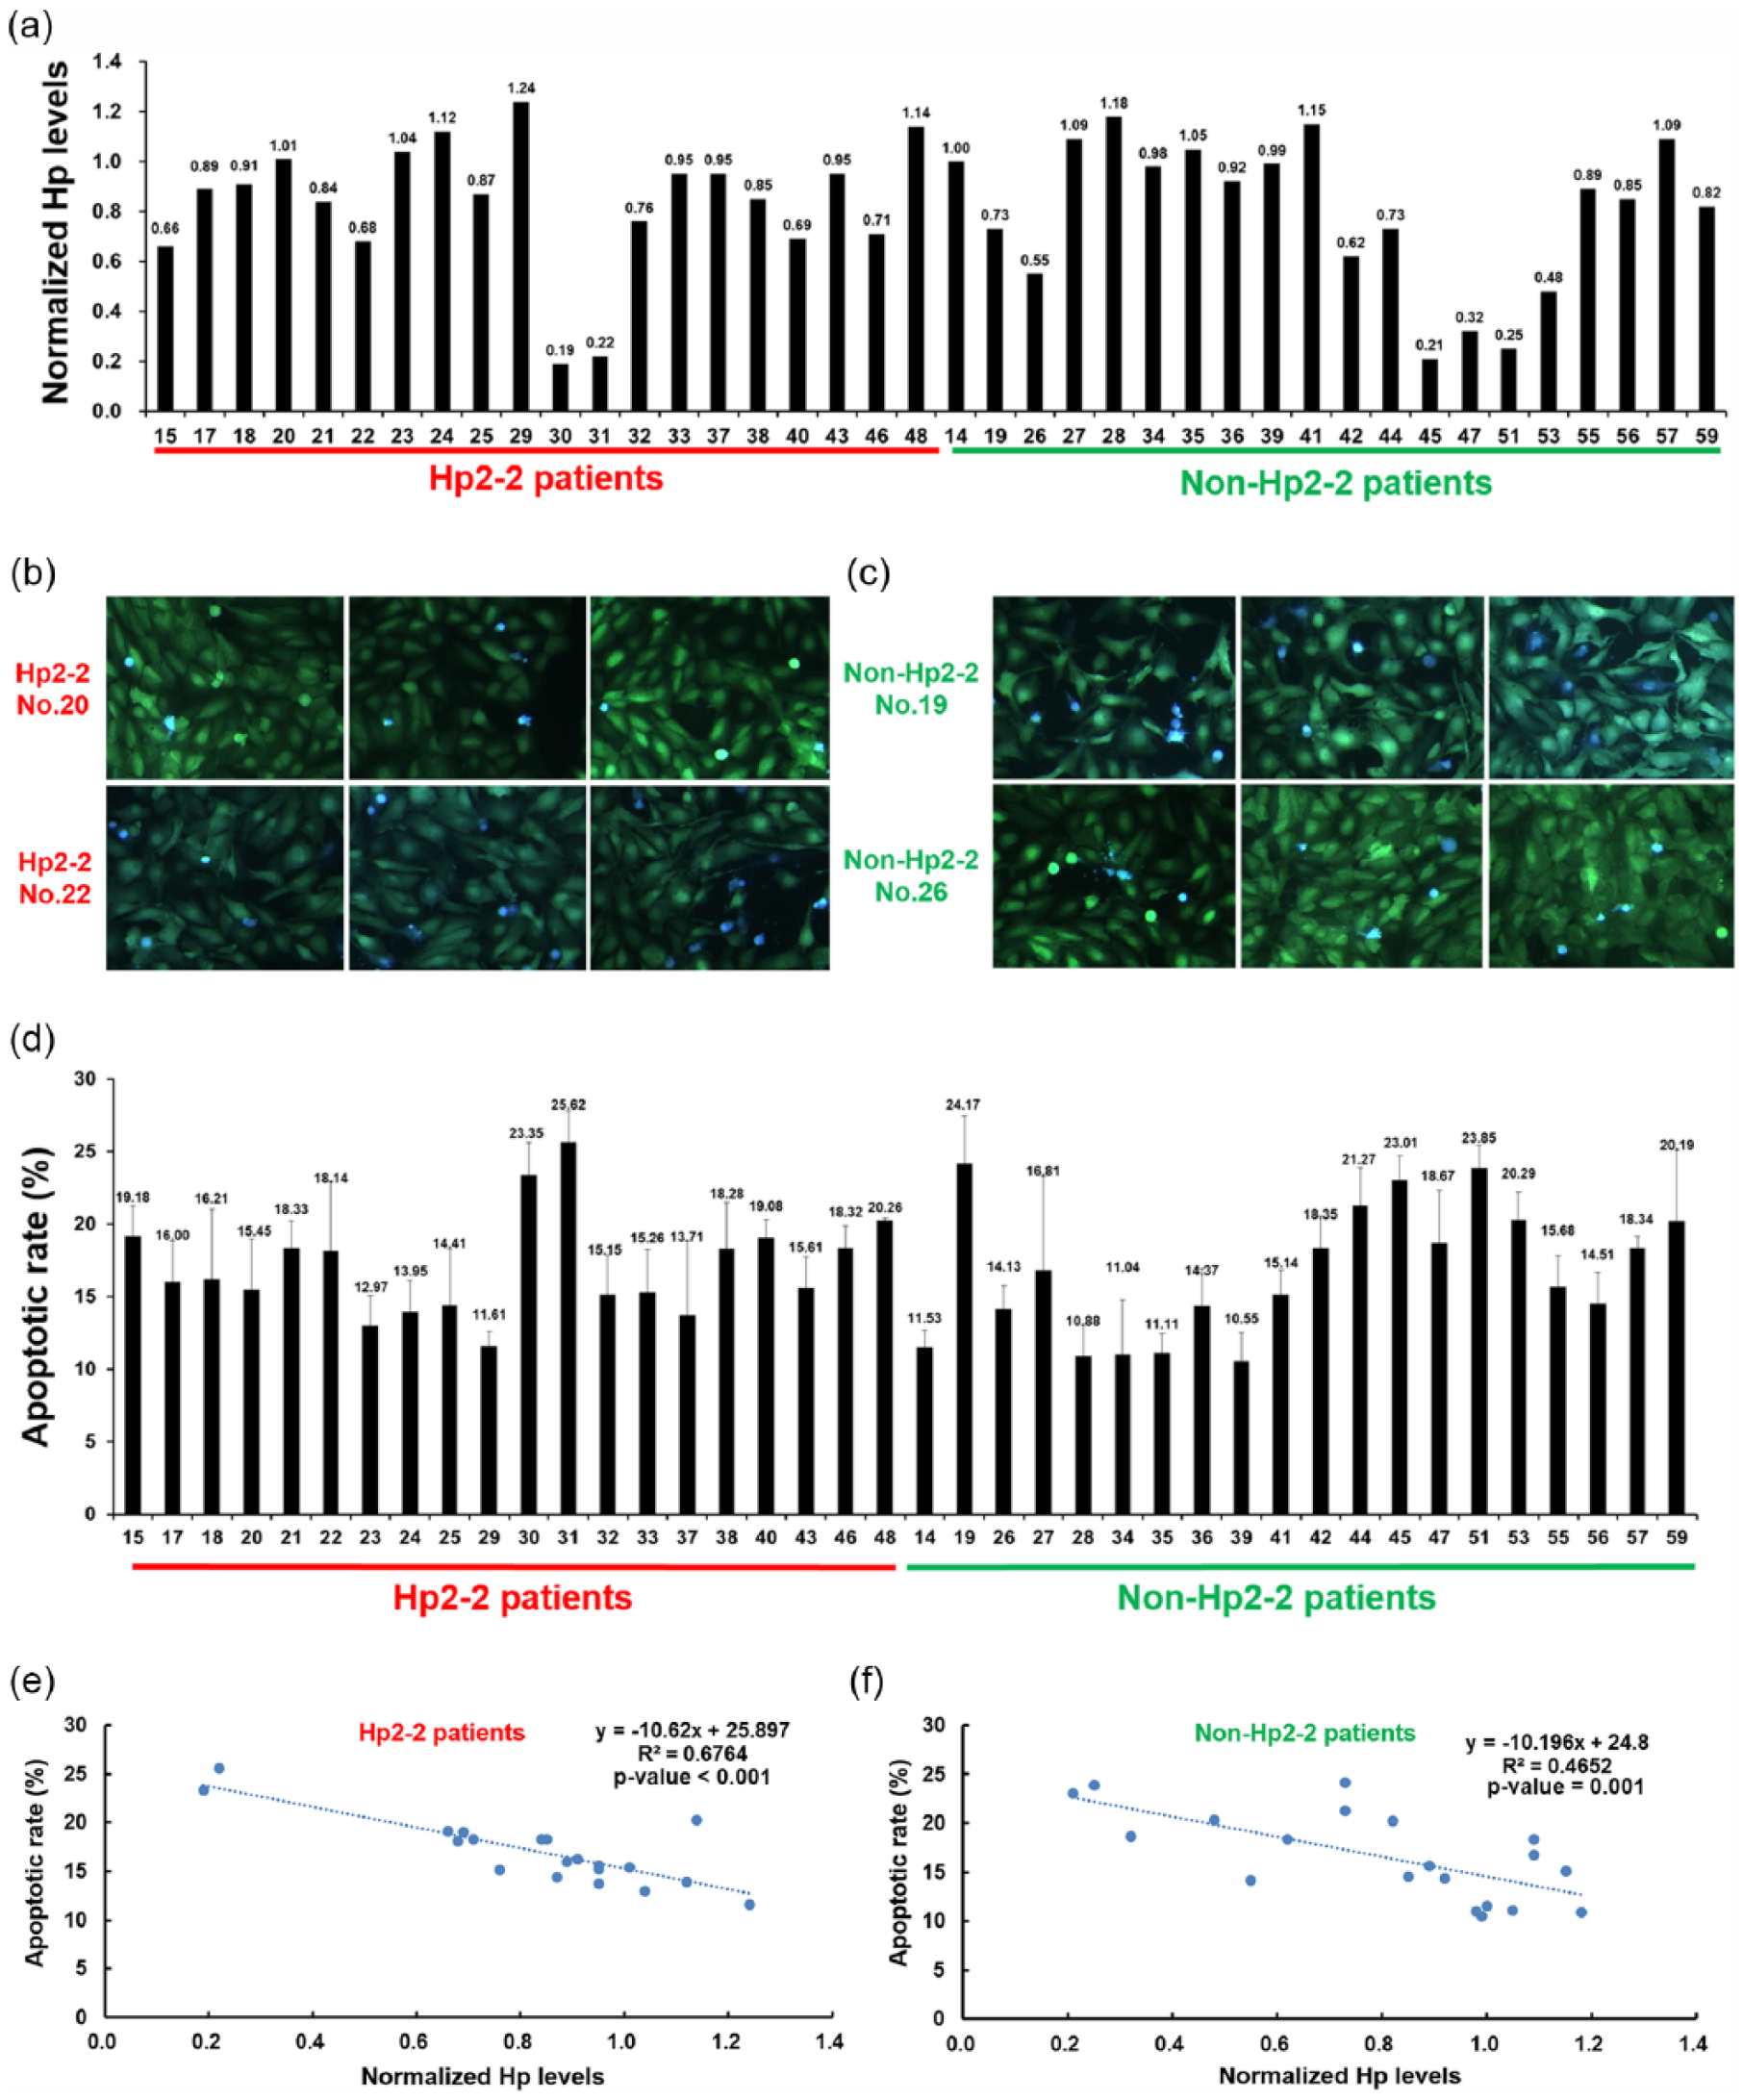
(a) Lower concentrations of Hpβ correlate with higher EC apoptotic rates in diabetes plasma samples, (b and c) normalized concentrations of Hpβ determined by Western blotting from 40 plasma samples. Representative FRET images of HUVEC-C3 using plasma samples from (b) two patients with the Hp2-2 genotype and (c) two patients with the non-Hp2-2 genotype, (d) all glucose concentrations were standardized to 10 mmol/L. (e and f) Apoptotic rates determined using individual plasma from Hp2-2 patients (n = 20) and non-Hp2-2 patients (n = 20). Correlation of normalized Hp concentrations to apoptotic rates of HUVEC-C3 in the (e) Hp2-2 group and (f) non-Hp2-2 group.
Discussion and conclusion
It is known that in Hp2-2 genotype individuals have lower Hp concentrations and qualitatively inferior Hp, in terms of lower binding affinity to haemoglobin which in turn leads to lower ability to be scavenged by the cluster of differentiation 163 (CD-163) macrophages and cleared from the plasma.1,2 However experimental in vitro and in vivo studies show no functional difference in the haemoglobin detoxification mediated by Hp2-2 versus non Hp2-2.13,14 Using pooled plasma from 20 diabetes patients, we found higher EC apoptosis rates in Hp2-2 compared to non-Hp2-2 genotype. Using individual plasma samples from 40 patients, lower Hpβ concentrations correlated with higher EC apoptosis rates regardless of the Hp genotype. Since it is well established that the Hp concentrations are lower in the population with the Hp2-2 genotype than the non Hp2-2 genotype, quantitative lower Hp concentrations may be the main factor leading to higher overall risk against Hb-induced oxidative toxicity.15,16 Indeed, our study shows that regardless of the Hp genotype, Hpβ concentrations is a significant contributor towards the protection from EC apoptosis.
The immune turbidimetry method used to measure total Hp concentrations likely also include Hp-related protein (HRP), whereas the Western blot method used to measure Hpβ likely only measures Hp as the beta chains in HRP having an additional cysteine residue in the beta chain. 13 Hence, we saw better correlations with the Hpβ measured by Western blot analysis. Nevertheless, both methods suggest that Hp (a powerful antioxidant) may play a major role in protection from EC apoptosis in diabetes.
This suggests possible distinct pathophysiological mechanisms for EC apoptosis in the diabetes patients, and the role of Hp needs to be studied further using different methods so as targeted interventions can be planned.
Footnotes
Acknowledgements
The authors acknowledge Drs Chew CK, Hoi WH, Jong M, Khor HT, Kon YC, Lam S and Seow CJ for help in recruitment; Ms Siti Zaidah Binte Abu Bakar, Ms Yang Lulu for study coordination; Ms Safiyya Binte Mohamed Ali for statistical analysis; and Ms Amanda Tay for formatting the manuscript. They thank all the patients for participation in the study. The first two authors, R.D. and X.L., contributed equally towards this work.
Declaration of conflicting interests
The author(s) declared no potential conflicts of interest with respect to the research, authorship and/or publication of this article.
Funding
NMRC Transition Award (NMRC/TA/0028/2014) and Centre Grant (NMRC/CG/017/2013) was awarded to R.D.; Start-up Fund from the Faculty of Health Sciences and Start-Up Research Grant (SRG2016-00068-FHS) from the University of Macau was awarded to K.Q.L.
References
Supplementary Material
Please find the following supplemental material available below.
For Open Access articles published under a Creative Commons License, all supplemental material carries the same license as the article it is associated with.
For non-Open Access articles published, all supplemental material carries a non-exclusive license, and permission requests for re-use of supplemental material or any part of supplemental material shall be sent directly to the copyright owner as specified in the copyright notice associated with the article.