
Abstract
Objective:
To study the effect of blood glucose variability on cardiac fibrosis and its mechanism in a model of diabetic cardiomyopathy.
Methods:
A total of 45 Sprague Dawley rats were randomly divided into three groups: control, control diabetes mellitus and fluctuated blood glucose groups. Fluctuated blood glucose was induced by daily subcutaneous insulin and intraperitoneal glucose injections at different time points. Blood lipids and glycosylated haemoglobin A1c were assessed. Super oxide dismutase activity and malondialdehyde level in rat heart homogenates were determined by assay kit. Structural cardiac tissue changes were observed by haematoxylin and eosin staining and Masson’s trichrome staining. Collagen type 3, fibronectin, phosphorylated Ser/Thr protein kinase, phosphorylated glycogen synthase kinase-3 beta, glycogen synthase kinase-3 beta, nuclear factor kappa-light-chain-enhancer of activated B cells, cleaved-cysteinyl aspartate-specific proteinase-3 (caspase-3) and tumour necrosis factor-α levels were determined by western blot.
Results:
Compared with the control group, cardiac fibrosis and oxidative stress in heart tissue were aggravated in diabetic rats, which were more pronounced in glucose variability rats. However, the expression levels of AKT and glycogen synthase kinase-3 beta were not significantly different in three groups, but the expression levels of phosphorylated Ser/Thr protein kinase and phosphorylated glycogen synthase kinase-3 beta were significantly decreased in the control diabetes mellitus and fluctuated blood glucose groups compared to control group, and levels in the fluctuated blood glucose group were significantly less than in the control diabetes mellitus group. In addition, the expression levels of nuclear factor kappa B and caspase-3 in both the control diabetes mellitus and fluctuated blood glucose groups were higher than in the control group, with the highest levels measured in the fluctuated blood glucose group.
Conclusion:
Blood glucose variability can aggravate heart tissue fibrosis, possibly involving oxidative stress by inhibiting AKT signalling path.
Introduction
Diabetic cardiomyopathy (DCM) was first described in 1972 by Rubler et al. 1 and is defined as cardiomyopathy induced by metabolic derangements in diabetic patients. It is characterized by myocardial dysfunction and pathological cellular injury and is the result of multiple molecular mechanisms such as cardiomyocyte hypertrophy, myocardial fibrosis, cardiomyocyte apoptosis and cell death. 2 Cardiomyocyte apoptosis and cell death play important roles in DCM, and several factors are involved in its initiation. 3 For example, a previous study demonstrated that cardiomyocytes showed markedly increased cell injury and apoptosis following exposure to high-glucose levels. 4 In addition, hyperglycaemia leads to increased production of reactive oxygen species (ROS)5,6 and inflammatory cytokines 7 that activate multiple deleterious pathways within cardiomyocytes.8,9 The most prominent feature of the diabetic myocardium is attenuated protein kinase B (AKT) signalling; this event plays a pivotal role in cardiomyocyte apoptosis and cell death as AKT is a key signal transduction intermediate that reduces survival signalling kinases; reduced levels of phosphorylated AKT (P-AKT) leads to activation of glycogen synthase kinase-3β (GSK-3β), which is an initiator of cell death.10–12
It has been hypothesized that glucose variability, which is a daily challenge for patients with diabetes, is related to cardiovascular risk. 13 It has been shown that oscillating glucose increases apoptosis in endothelial cells.14–18 Furthermore, glucose variabilities have a detrimental effect on cardiomyocytes in that they increase apoptosis and promote cardiac cell death. 19 Despite this knowledge, the mechanisms of how fluctuating blood glucose induces DCM remain incompletely understood.
In this study, we employed enzyme-linked immunosorbent assays (ELISAs), immunohistochemistry and western blotting to explore how glucose variability affects the heart of rats with type 2 diabetes. We also sought to further clarify the molecular role by which AKT signalling path aggravates DCM.
Materials and methods
Ethics
In this study, all experimental procedures were conducted with the Provision and General Recommendation of the Chinese Laboratory Association and approved by the Institutional Animal Care and Use Committee of the Xuzhou Medical University.
Animals
Adult male Sprague Dawley rats weighing 180–200 g were obtained from Xuzhou Medical University Experimental Animal Center (Xuzhou, China). All animals were housed in pathogen-free conditions with freely available water and standard mouse chow. They were kept under standard housing conditions (room temperature 23°C ± 1°C and humidity 55%–65%) and regular 12-h photoperiods.
Materials
Streptozotocin (STZ, s0130-500 MG) was purchased from Sigma (St. Louis, MO, USA). A glucometer and glucose test strips were acquired from Johnson & Johnson Ltd. (New Brunswick, NJ, USA). ELISA and glycohaemoglobin (HbAlc) assay kits were purchased from Nanjing Jiancheng Bioengineering Institute (Nanjing, China). Immunohistochemical kits were obtained from Beijing Shan Jinqiao Biological Limited (Beijing, China). AKT, P-AKT (Ser473), GSK-3β, phosphorylated glycogen synthase kinase-3 beta (P-GSK-3β) (Ser9), histone H3 and β-actin antibodies were obtained from Bioworld Technology, Inc (Minnesota, USA). Fibronectin, collagen type 3, nuclear factor kappa B (NF-κB), caspase-3 and tumour necrosis factor-α (TNF-α) antibodies were obtained from Proteintech Group, Inc (Chicago, USA). The secondary antibodies were purchased from Sigma.
Experimental design
After 1 week of acclimatization, the rats were randomly divided into three groups (n = 15/group): control (CON), stable high blood glucose [control diabetes mellitus (CDM)] and fluctuating high blood glucose [fluctuated blood glucose (FDM)]. The CON group was fed a standard diet (contained 35% wheat, 25% corn, 20% bean cake, 10% fish meal, 10% minerals and yeast) and the CDM and FDM groups were fed with a high sugar and fat diet (contained 65% general fodder, 20% sugar, 10% fat, 5% egg yolk powder) from weeks 2 to 16. In the fifth week, the CDM and FDM groups received single intraperitoneal (i.p.) injections of STZ dissolved in citrate buffer (pH 4.4, 0.1 M) at 35 mg/kg, while CON rats received an equal volume of citrate buffer solution. Three days later, blood samples from the tail vein were collected and measured with a glucometer. The diabetic rats exhibited elevated blood glucose levels (>16.7 mmol/L), confirming diabetes. 20 The FDM group animals were induced with daily subcutaneous injections of 20 U/kg regular insulin (6 am and 12 and 6 pm) and daily intraperitoneal injections of 3 g/kg of glucose (9 am and 3 and 9 pm) for 12 weeks. The rats in the other two groups received saline injections. Blood glucose levels were measured 30 min after daily treatments (Figure 1). Body weight (BW) was measured in week 16 (Table 1).
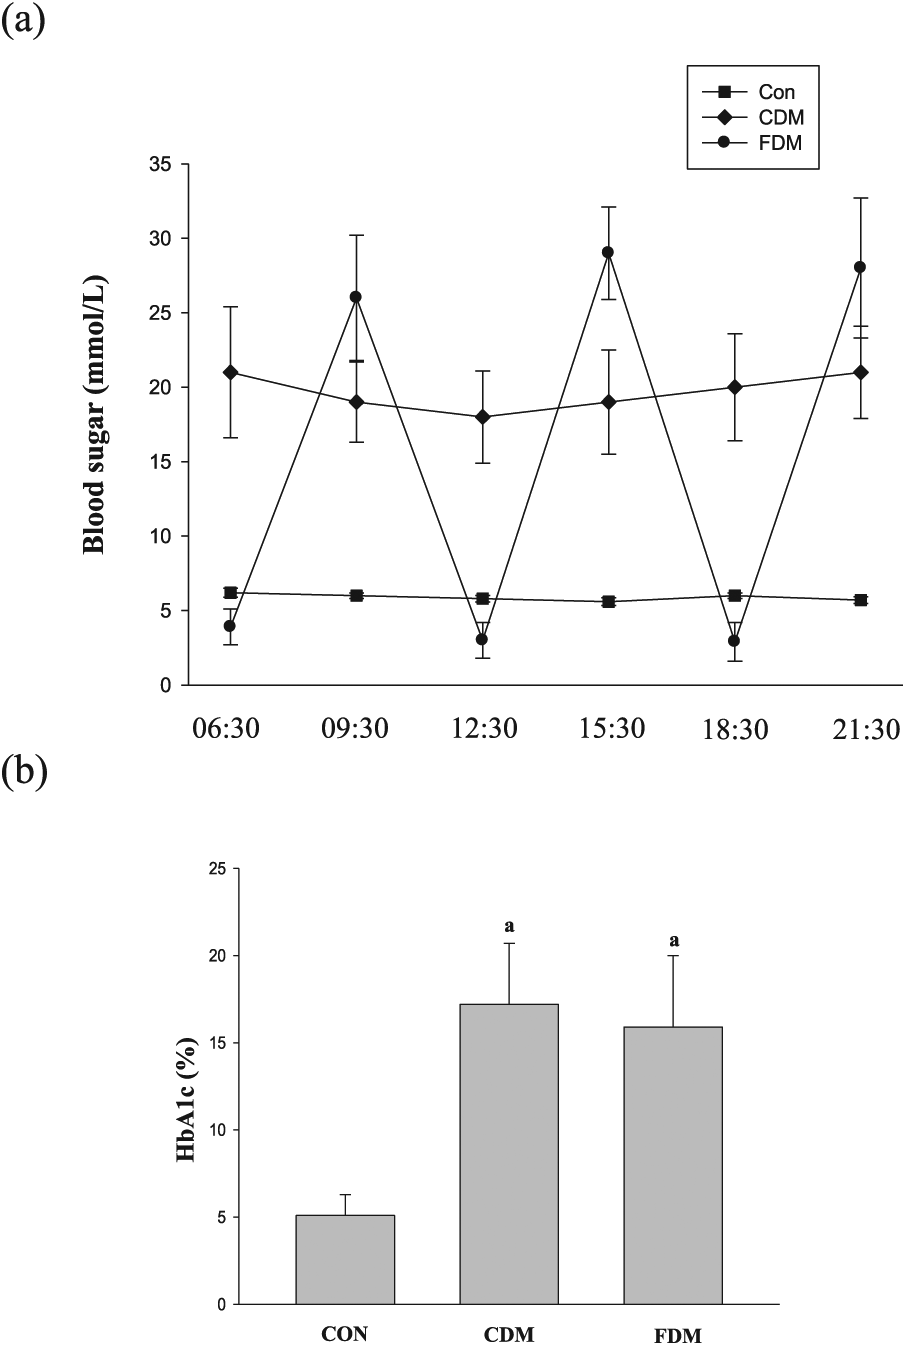
(a) Blood glucose fluctuations in the three groups and (b) the HbA1c level in the three groups. Data are shown as mean ± SD.
The effect of glucose fluctuation on animal characterization in diabetes rats.
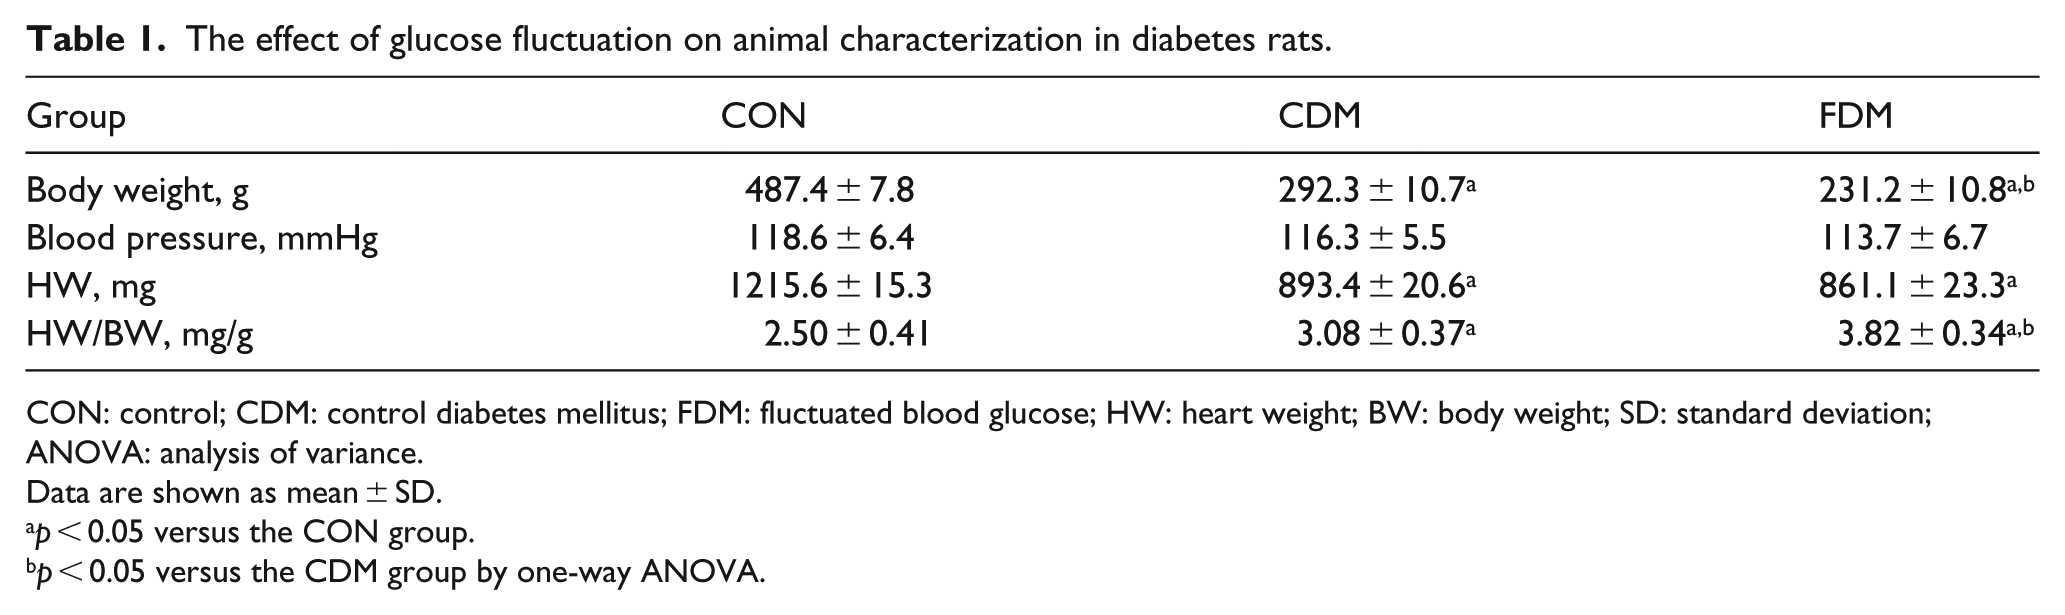
CON: control; CDM: control diabetes mellitus; FDM: fluctuated blood glucose; HW: heart weight; BW: body weight; SD: standard deviation; ANOVA: analysis of variance.
Data are shown as mean ± SD.
p < 0.05 versus the CON group.
p < 0.05 versus the CDM group by one-way ANOVA.
Measurement of blood pressure
Blood pressure (BP) was measured by tail-cuff method using a non-invasive BP measuring instrument (BP98A, Sinsi Technology Limited, Japan) in week 16. Rats were kept warm to ensure sufficient blood flow to the tail. The BP was measured for 10 measurement cycles and the average of parameters was calculated (Table 1).
Blood lipid and HbAlc measurement
At the end of the 16th week, 2 mL of blood was drawn from the hearts of six rats under 4% chloral hydrate anaesthesia. The levels of total cholesterol (TC), triglyceride (TG), high-density lipoprotein cholesterol (HDL-C) and low-density lipoprotein cholesterol (LDL-C) were determined by ELISA (Nanjing Jiancheng Bioengineering Institute, Nanjing, China). The HbAlc was estimated by a glycohaemoglobin assay kit according to manufacturer’s method.
Assessment of heart tissue oxidative stress
The heart ventricles were minced and homogenized with 10% (w/v) phosphate-buffered saline (PBS; 0.1 mol/L, pH 7.4). The heart homogenate was centrifuged at 4000 r/min for 12 min at 4°C, and the supernatant was collected for super oxide dismutase (SOD) and malondialdehyde (MDA) evaluation. SOD activity and MDA level were measured using the commercially available kit (Nanjing Jiancheng Bioengineering Institute).
Histopathology and immunocytochemistry
Rats were anaesthetized and perfusion fixed with 4% paraformaldehyde before the cardiac tissue was quickly removed and post-fixed overnight in paraformaldehyde. Paraffin-embedded sections (5-µm thick) were cut on a microtome, deparaffinized in xylene and rehydrated in a gradient of ethanol and distilled water. Sections were stained with haematoxylin and eosin (HE) and Masson’s trichrome staining and then microscopically viewed at ×400 magnification. Myocardial cell size was evaluated by measuring for 10 myocytes selected per section at 400-fold magnification using light microscopy and was previously described. 11 The area of myocardial fibrosis was measured by a colour image analyser (blue fibrotic area opposed to red myocardium). 21
For immunohistochemistry, the heart sections were dewaxed with xylene and rehydrated in ethanol [graded concentrations, 100%–70% (v/v)] and then washed twice in double-distilled water. High-temperature antigen retrieval was performed in 1 mM citrate buffer. Sections were incubated for 30 min in a solution of 0.1% H2O2 in PBS to block endogenous peroxidase activity. After washing with PBS, the sections were blocked with 10% goat serum for 30 min at 37°C and incubated with the rabbit P-AKT (1:100) and rabbit P-GSK-3β (1:100) primary antibodies at 4°C for 24 h. The biotinylated goat anti-rabbit secondary antibody (1:500, Sigma) was added to the sections and incubated for 30 min at 37°C and then washed three times in PBS. The sections were stained with 3,3′-diaminobenzidine (DAB) and examined under a light microscope (×400).
Sample preparation and western blot
Heart tissues were separated and frozen in liquid nitrogen. Equal volumes of tissue to total protein lysis buffer were transfused in the homogenate samples, which were then centrifuged at 800g for 10 min at 4°C. Supernatants were collected, and protein concentrations were determined by Lowry assay. Samples were balanced with 5× loading buffer and stored at −80°C until use.
Proteins were separated using 10% sodium dodecyl sulphate polyacrylamide gel electrophoresis (SDS-PAGE) and transferred to nitrocellulose membranes after blocking for 2 h in Tris buffer with 0.1% Tween-20 (TBST) and 3% bovine serum albumin (BSA). The membranes were incubated overnight at 4°C with antibodies against P-AKT (Ser473), P-GSK-3β, fibronectin, collagen type III, NF-κB, caspase-3 or TNF-α followed by incubation with goat anti-rabbit IgG antibody (Santa Cruz Biotechnology, Santa Cruz, CA, USA). Band optical density (OD) was quantified and scanned using an image analysis software (Quantity One, Bio-Rad), and levels of phosphorylated proteins were normalized to the respective total proteins.
Statistics
Parametric data are expressed as the mean ± standard deviation (SD) and were analysed using Statistical Product and Service Solutions (SPSS) version 13.0 (SPSS Inc, Chicago, IL, USA). One-way analysis of variance (ANOVA) and Dunnett’s tests were used for statistical analysis. Significance was assumed at p < 0.05.
Results
The effect of fluctuating blood glucose on characterization of animal groups
As shown in Table 1, BW was significantly reduced in CDM group when compared with CON group, which was also less in FDM group than in CDM group. There was no significant difference in BP among three groups. The ratio of heart weight (HW) to BW in both CDM and FDM was higher than CON group. The increased ratio in FDM group was significantly higher compared to that in CDM group. Blood glucose variability did not affect HW in either CDM or FDM groups. The increased ratio in blood glucose variability was mainly due to BW decrease in these animals.
Blood parameters of diabetic rats after high glucose and blood glucose variability
In this study, we observed effects of high glucose and blood glucose variability on blood parameters in rats. Glucose variability was confirmed in the FDM group (Figure 1). TC, TG and LDL levels were increased in the CDM and FDM groups, and HDL levels were decreased in diabetic rats compared with the normal rats. There was no significant difference between the CDM and FDM groups (Table 2). The results were fair to keep scientific experiment, to avoid blood lipid affecting this study.
The effect of glucose fluctuation on the biochemical index in diabetes rats.
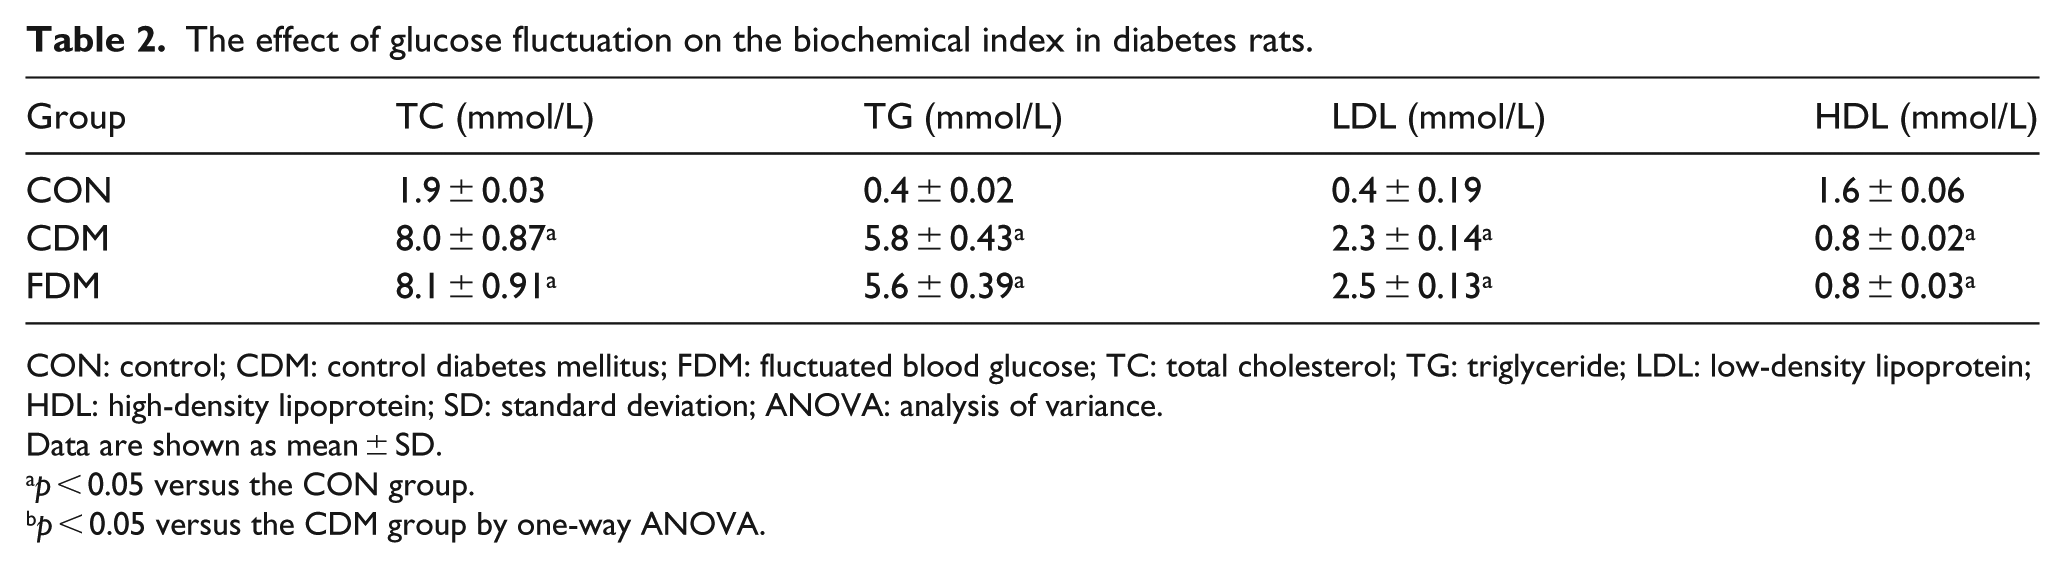
CON: control; CDM: control diabetes mellitus; FDM: fluctuated blood glucose; TC: total cholesterol; TG: triglyceride; LDL: low-density lipoprotein; HDL: high-density lipoprotein; SD: standard deviation; ANOVA: analysis of variance.
Data are shown as mean ± SD.
p < 0.05 versus the CON group.
p < 0.05 versus the CDM group by one-way ANOVA.
The HbA1c level was significantly increased in the CDM and FDM groups compared to CON group, and the HbA1c level shows no significant difference between the CDM and FDM groups (Figure 1).
Effects of blood glucose variability on the oxidative stress
To investigate the effects of blood glucose variability on the oxidative stress, we assayed SOD activity and MDA levels in rat heart. The SOD activity in the CDM and FDM groups were lower than those of the CON group (226.38 ± 45.91 U/mL and 173.52 ± 32.28 U/mL vs 280.64 ± 60.27 U/mL, p < 0.05). When comparing with the CDM group, the index was markedly decreased in the FDM group. The MDA levels were higher in the CDM and FDM groups than those in the CON group (3.04 ± 0.89 nmol/mL and 3.87 ± 0.76 nmol/mL vs 2.11 ± 0.63 nmol/mL, p < 0.05) and significantly increased in the FDM group compared to the CDM group. These results suggested that glucose variability aggravated the oxidative stress state in diabetic rats.
The effect of blood glucose variability on cardiac structure
DCM in rats is characterized by disordered cell arrays, confused cellular nuclei and broken myocardial fibers. 22 We observed similar morphological changes in our study (Figure 2). HE staining and Masson’s trichrome staining showed that diabetic hearts displayed structural abnormalities compared to the normal rats. Notably, structural abnormalities were aggravated by glucose variability in diabetic rats (Figure 2(a)). Myocardial cell size was calculated to evaluate the cardiomyocyte hypertrophy. The cardiomyocyte diameter in the CDM group was higher than that in the CON group, but there were no difference between the CDM and FDM groups (Figure 2(b)). The percentage area of fibrosis in the CDM group was higher than that in the CON group, but the ratio in FDM group was significantly higher than that in the CDM group (Figure 2(c) and (d)). These results suggest that glucose variabilities exacerbate structural heart damage in diabetic rats.
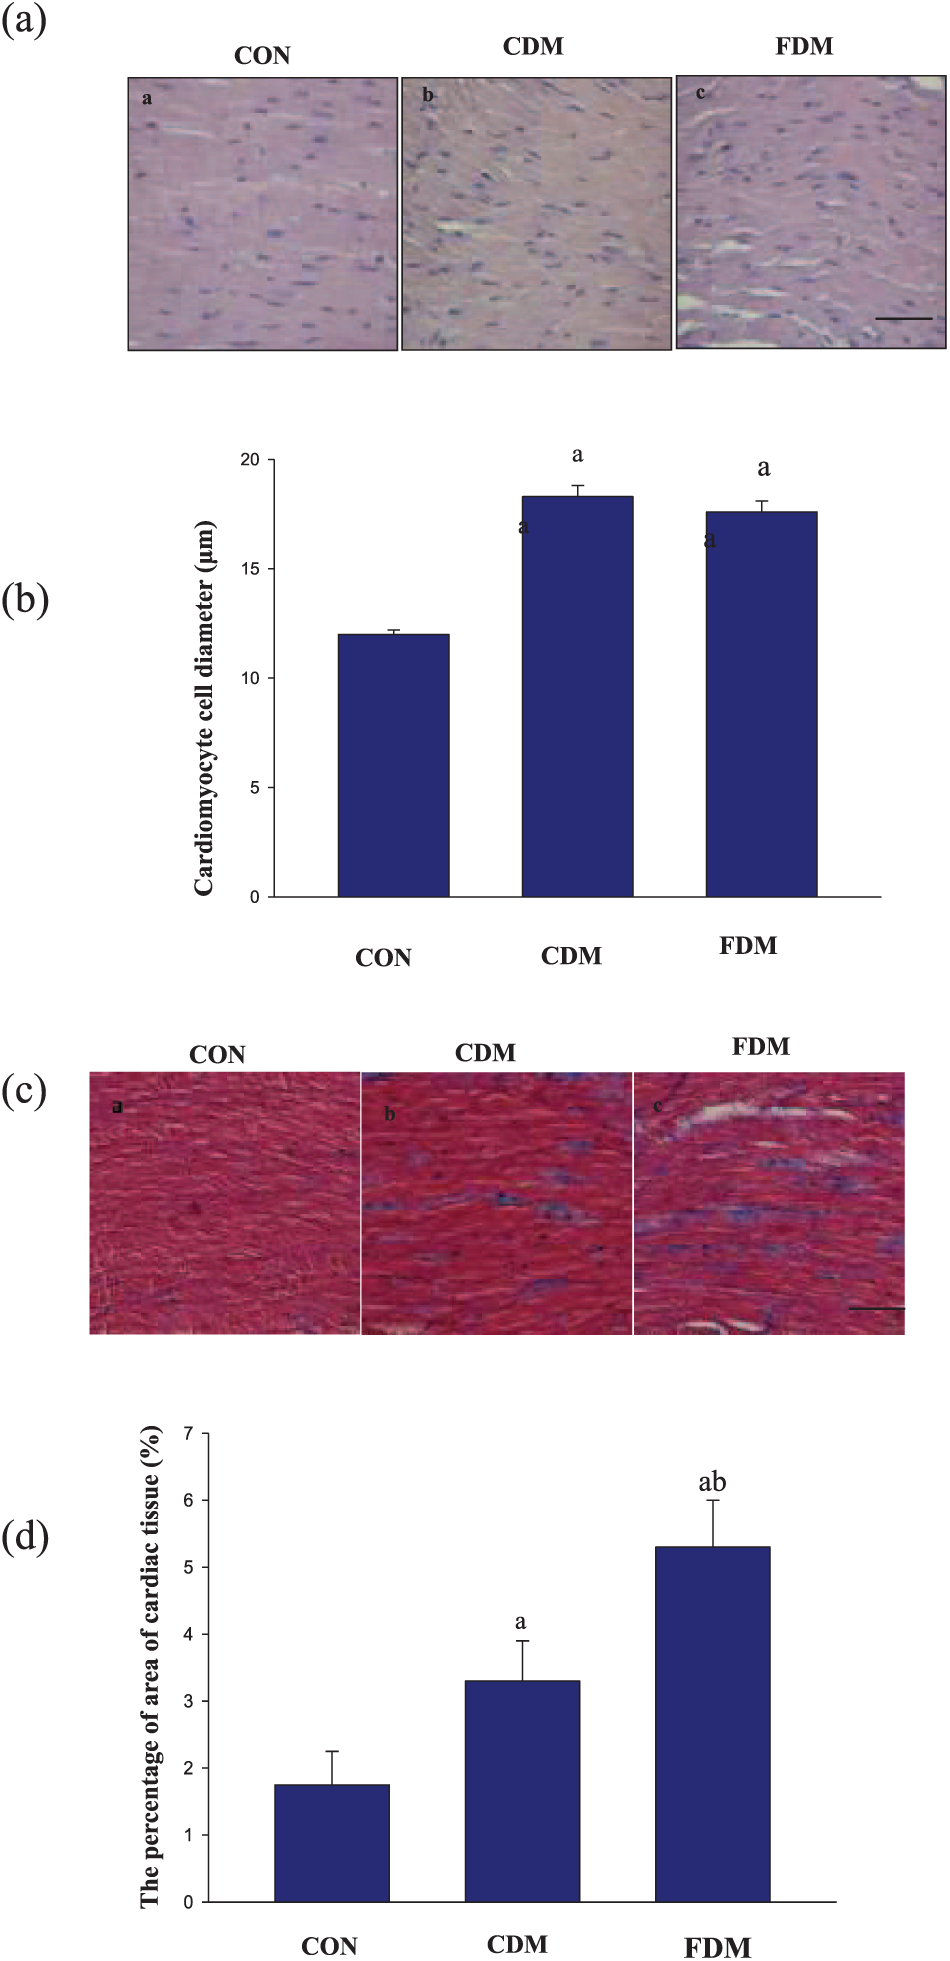
Effects of blood glucose fluctuation on heart structure. (a) Representative photomicrographs of HE staining in cardiac tissue slices. The scale bar in (c) is 50 µm (magnification, ×400). (b) The cardiomyocyte cell diameter was used to quantify HE staining, and the data are shown as mean ± SD and are expressed as folds versus the CON group. (a) p < 0.05 versus the CON group, (b) p < 0.05 versus the CDM group by one-way ANOVA and (c) representative photomicrographs of Masson’s trichrome in cardiac tissue slices. The scale bar in (c) is 50 µm (magnification, ×40) and (d) the percentage of area of cardiac tissue was used to quantify Masson’s trichrome staining, and the data are shown as mean ± SD and are expressed as folds versus the CON group.
In order to further measure myocardial fibrosis, we detected the fibronectin and the cardiac collagen type III. In this study, fibronectin and collagen type III expressions were significantly increased in the CDM group compared with those in the CON group, with marked increase in the FDM group (Figure 3). These results indicated that glucose variabilities increase cardiac fibrosis in diabetic rats.
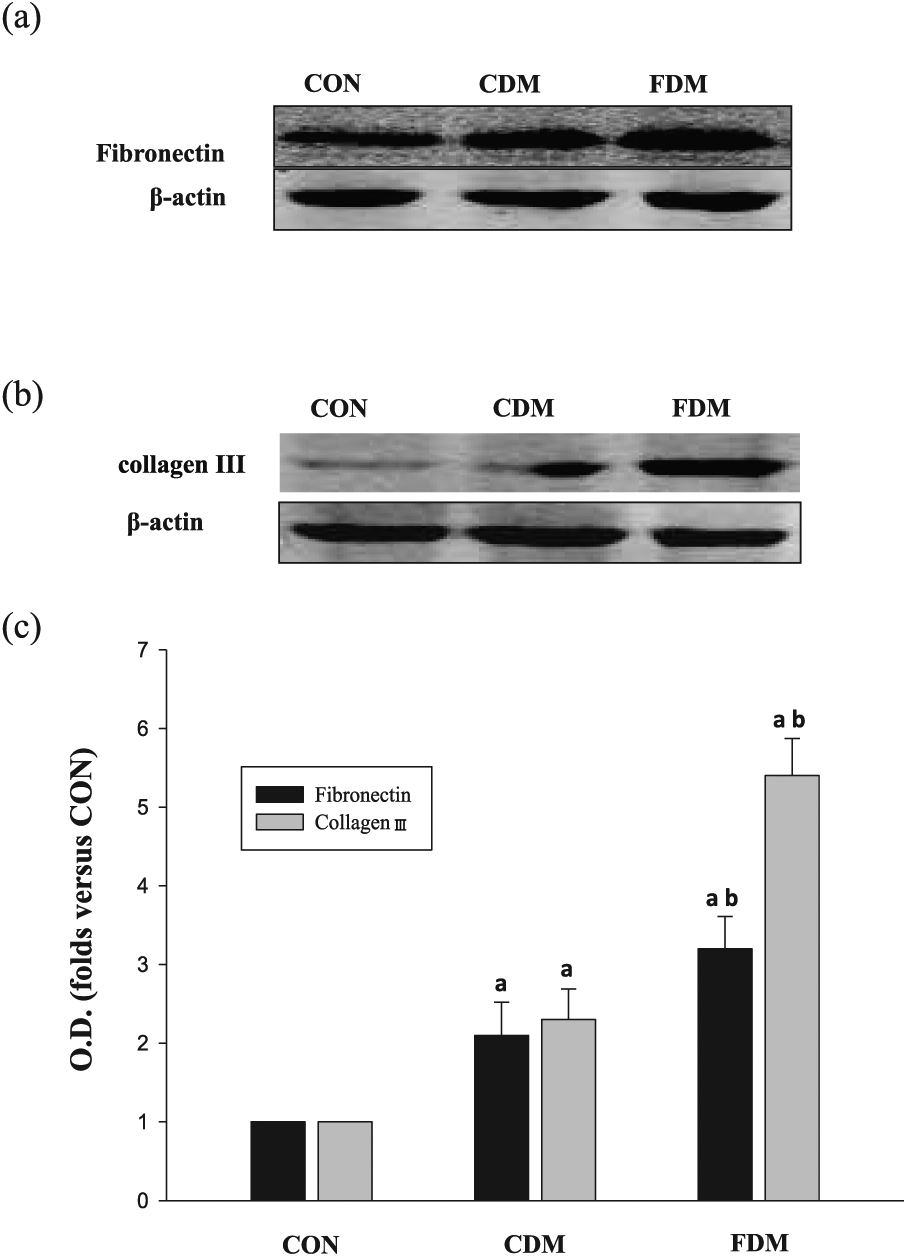
Effects of glucose fluctuation on fibronectin and collagen III in cardiac tissues. (a) Representative bands of fibronectin, (b) representative bands of collagen III and (c) analysis for fibronectin and collagen III protein expression; the data are shown as mean ± SD and are expressed as fold difference versus the CON group.
AKT, GSK-3β, NF-κB, caspase-3 and TNF-αexpression in rat myocardial cells
To determine whether blood glucose variability affects AKT signalling path, cardiac tissues were prepared for immunohistochemical and western blotting analyses.
As shown in Figures 4 and 5, the total protein levels of AKT and GSK-3β were similar in the three groups, suggesting that blood glucose variability did not significantly affect AKT or GSK-3β expression. However, compared to the CON group, P-AKT (Ser473) and P-GSK-3β levels were decreased in the sustained high-glucose (CDM) group and significantly decreased in the intermittent high-glucose (FDM) condition. Quantitative analyses of the immunohistochemical and western blot results also suggested that high glucose can decrease P-AKT (Ser473) and P-GSK-3β accumulation. Meanwhile, the degree of decreased P-AKT (Ser473) and P-GSK-3β in FDM was more prominent than in the CDM group. In addition, in both the CDM and FDM groups, NF-κB and caspase-3 levels were higher than those in the CON group, with the highest levels measured in the FDM group (Figure 6). Together, these results indicate that blood glucose variability aggravates DCM, potentially through inhibiting AKT signalling path.
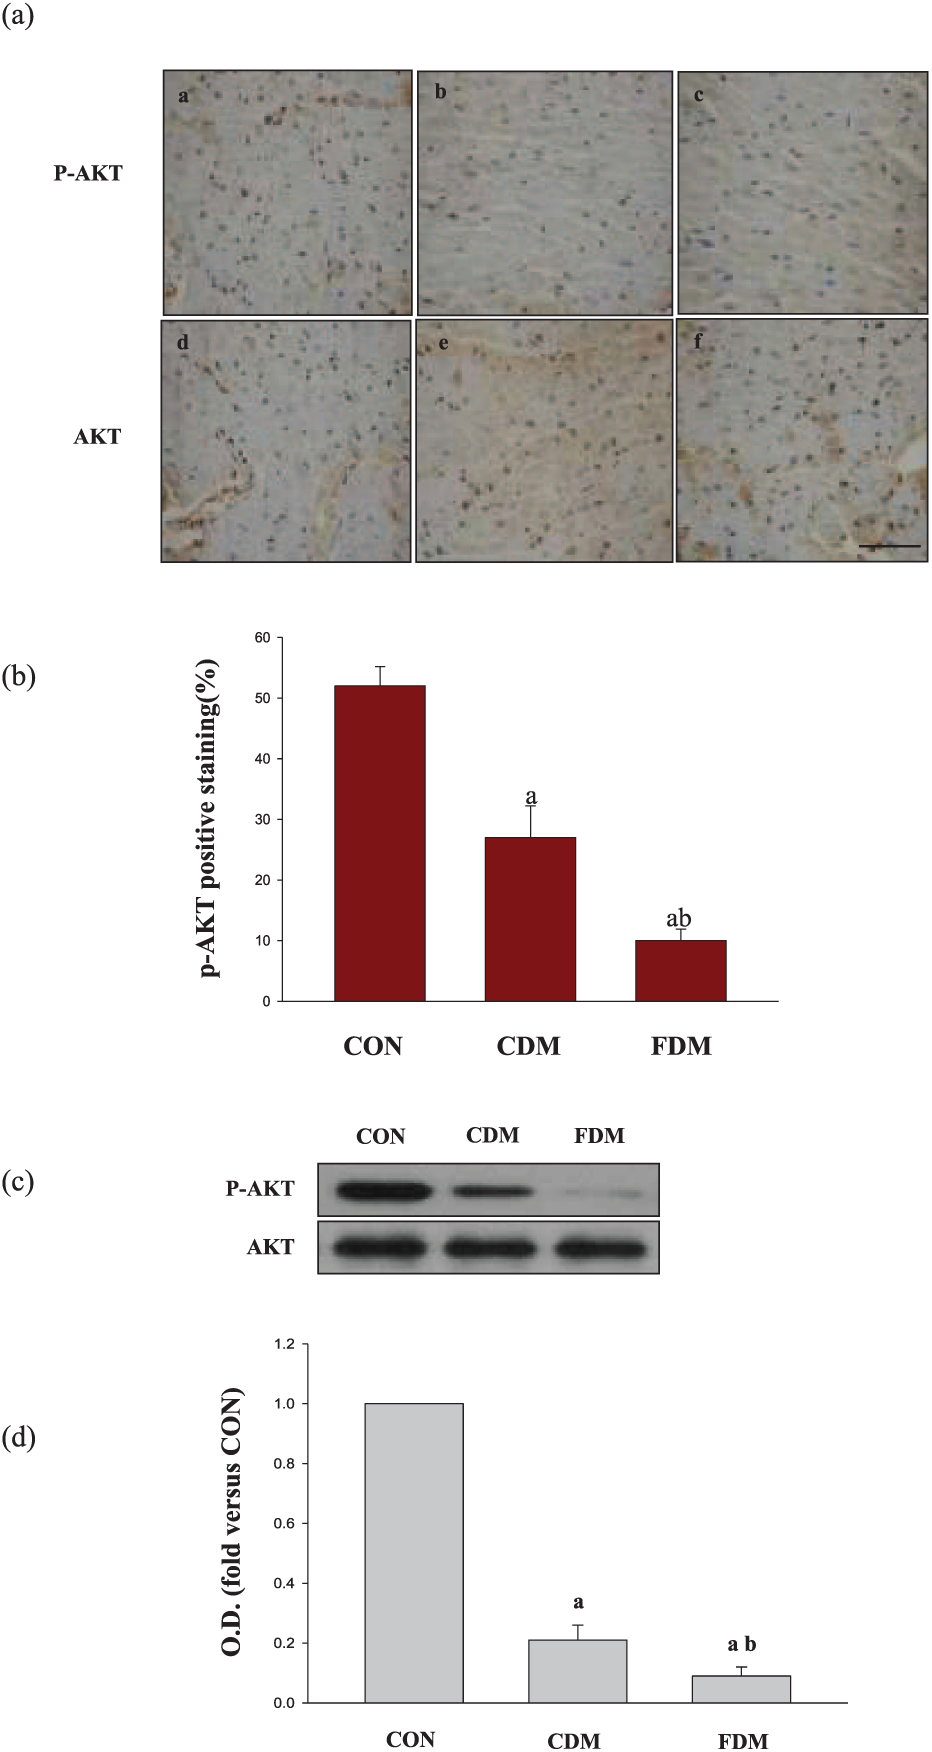
Effects of glucose fluctuation on P-AKT and AKT levels in cardiac tissues. (a) Typical microphotographs showing P-AKT and AKT expression in cardiac tissues. The scale bar in (c) is 50 µm (magnification, ×400). (b) The percentage of positive staining was used to quantify P-AKT, and the data are shown as mean ± SD and are expressed as folds versus the CON group. (a) p < 0.05 versus the CON group, (b) p < 0.05 versus the CDM group by one-way ANOVA, (c) representative bands and the OD and (d) analysis for P-AKT and AKT protein expression; the data are shown as mean ± SD and are expressed as fold difference versus the CON group.
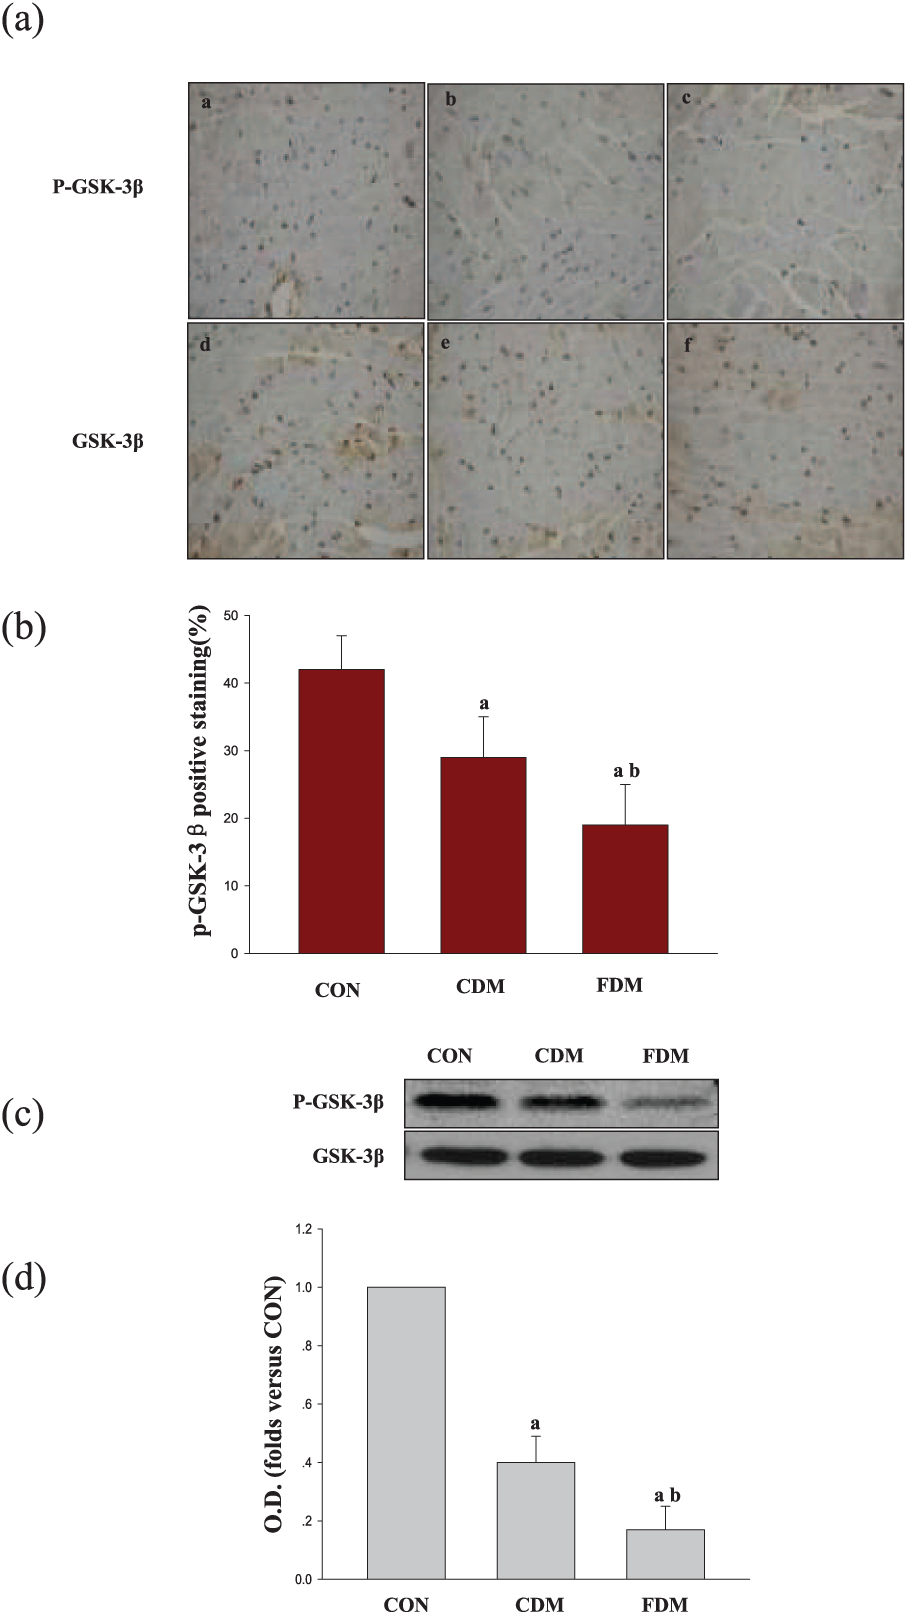
Effects of glucose fluctuation on P-GSK-3β and GSK-3β expression in cardiac tissues. (a) Typical microphotographs showing P-GSK-3β and GSK-3β expression in the heart. The scale bar in (c) is 50 µm (magnification, ×400). (b) The percentage of positive staining was used to quantify P-GSK-3β, and the data are shown as mean ± SD and are expressed as folds versus the CON group. (a) p < 0.05 versus the CON group, (b) p < 0.05 versus the CDM group by one-way ANOVA, (c) representative bands and the OD and (d) analysis for P-GSK-3β and GSK-3β protein expression; data are shown as mean ± SD and are expressed as fold difference versus the CON group.
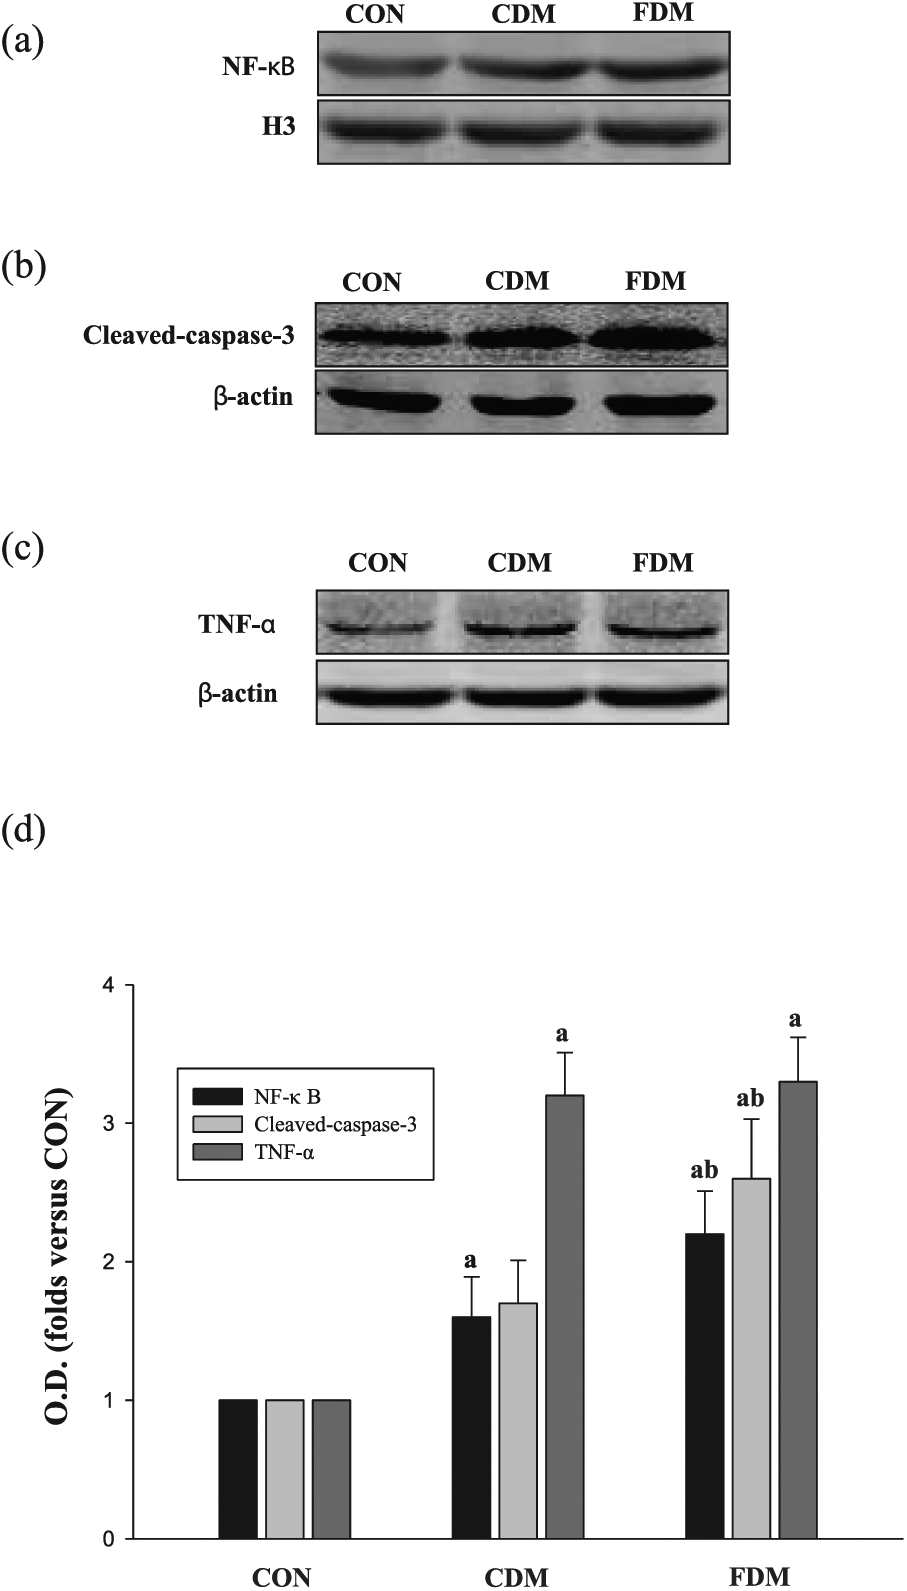
Effects of glucose fluctuation on NF-κB, Caspase-3 and TNF-α in cardiac tissues. (a) Representative bands of NF-κB, (b) representative bands of Caspase-3, (c) representative bands of TNF-α and (d) analysis for NF-κB, Caspase-3 and TNF-α protein expression; the data are shown as mean ± SD and are expressed as fold difference versus the CON group.
As shown in Figure 6, the level of TNF-α in the CDM group was higher than that in the CON group, but there were no differences between the CDM and FDM groups. These results indicate that blood glucose variability aggravates DCM regardless of TNF-α levels.
Discussion
This study describes a model of fluctuated blood glucose in diabetic rats, exhibiting the glucose level in Figure 1. The method establishing the model is similar to previous studies. 23 There is evidence to support the view that glycated haemoglobin A1c (HbA1c) values are closely associated with diabetic cardiopathy. 24 In this study, the HbA1c level was significantly increased in the CDM and FDM groups compared to CON group, and levels show no significant difference between the CDM and FDM groups. The data demonstrate that the HbA1c level did not reflect the level of blood glucose fluctuated on a short time. This result was similar to that of the previous study. 23
The previous study demonstrated that blood glucose fluctuation aggravated cardiac function and cardiac fibrosis in diabetic rats. 19 In this study, we also found that glucose fluctuation exacerbate structural heart damage and increase cardiac fibrosis in diabetic rats. Thus, we mainly attempted to clarify the possible underlying mechanisms by which blood glucose fluctuation aggravates DCM.
Chronic persistent hyperglycaemia is the key initiating event in diabetic complications. 25 DCM specifically is characterized by increased cardiomyocyte apoptosis and cell death, which is particularly detrimental since cardiac cells lack an intrinsic regenerative capacity.26–38 There is overwhelming evidence to indicate that cardiomyocyte apoptosis plays an important causal role in DCM development.9,29 Several studies have shown that oxidative stress is increased in the diabetic heart.8,30,31 Furthermore, a study demonstrated that intermittent high glucose increased ROS overproduction and exacerbated cellular apoptosis. 15 Moreover, our previous research has found that glucose fluctuation aggravated the oxidative stress state in diabetic rats. 19 This study shows that glucose fluctuation increased the oxidative stress in heart tissue. We concluded that blood glucose fluctuation accelerated cardiac injury, which was partly due to the oxidaive stress promoting action.
Oxidative stress can induce cardiomyocyte apoptosis via intracellular signal transduction pathways including AKT.9,10,32–34 In addition, diabetes-induced cardiomyocyte apoptosis is likely to be induced by hyperglycaemia-triggered AKT. 35 We therefore hypothesized that increased glucose fluctuation may lead to cardiomyocyte injury via the AKT signalling pathway. AKT is a key signal transduction intermediate that plays a pivotal role in coordinating insulin-dependent glucose uptake and utilization.36,37 The AKT network plays a crucial role in regulating the pathogenesis of DCM.12,38 In addition, GSK-3β, which is downstream of AKT, is activated when AKT phosphorylation is decreased in DCM. 39 Phosphorylated GSK-3β, as a mediator of cellular damage, 40 exacerbates cardiac injury by multiple mechanisms.41,42 For example, phosphorylated GSK-3β activates NF-κB and caspase-3, resulting in cardiomyocyte apoptosis. 12 In this study, we investigated the levels of P-AKT and the downstream proteins P-GSK-3β, NF-κB and caspase-3 in heart tissue. The results show that P-AKT (Ser473) and P-GSK-3β levels were decreased in the CDM group and significantly decreased in the FDM group when compared with the CON group. In addition, in both the CDM and FDM groups, NF-κB and caspase-3 levels were higher than in the CON group, with the highest levels measured in the FDM group. Our data demonstrate that fluctuant blood glucose promoted cardiac cellular injury in DCM rats, and decreased P-AKT and P-GSK-3β levels were likely involved in this exacerbation process while NF-κB and caspase-3 levels were increased. Further investigation is needed to clarify the detailed intracellular signalling mechanisms of glucose variability in DCM rats.
Inflammation and TNF-α play an important role in the pathogenesis of DCM. 43 We also found that cardiac TNF-α levels in diabetic rats were obviously increased compared with that of blood glucose variability rats. However, blood glucose variability itself aggravates DCM regardless of TNF-α levels. More studies are needed to confirm whether blood glucose variability affects other inflammation parameters in diabetic rats.
In conclusion, our results suggest that blood glucose variability can aggravate cardiac tissue fibrosis. Oxidative stress and AKT mediated signal path may play a vital role in these damaging effects.
Footnotes
Acknowledgements
The authors thank Ting Liu for adequate work in this study. C.Y., T.L., H.L. and M.C. contributed equally to this work.
Declaration of conflicting interests
The author(s) declared no potential conflicts of interest with respect to the research, authorship and/or publication of this article.
Funding
This work was supported by a grant from the Department of Science & Technology, Xuzhou, Jiangsu, China (No. KC14SH094).