
Abstract
Background:
Recent data suggest that the higher risk of end-stage renal disease in women compared with men is associated with waist circumference. We investigated whether vascular stiffness which is linked to visceral fat accumulation is gender specific and associated with a loss in renal function.
Methods:
We studied 166 patients with type 2 diabetes at high risk of progressive renal disease. A vascular stiffness index was derived from measurement of the peripheral arterial pulse waveform using infrared finger photoplethysmography. Multiple regression analysis was used to examine the relationship between vascular stiffness and traditional clinical and biochemical renal disease risk factors.
Results:
Women were of similar mean (standard deviation) age [61.6 (6.8) vs 60.0 (8.3) years; p = 0.444] and duration of diabetes [9.8 (7.2) vs 10.9 (8.1) years; p = 0.885] compared to men. Waist circumference was significantly associated with vascular stiffness [regression coefficient B = 0.15 (95% confidence interval: 0.06–2.24); p = 0.001]. There was a negative slope parameter for the relationship between glomerular filtration rate and vascular stiffness [B = −0.15 (95% confidence interval: −0.22 to −0.09); p < 0.001] in women only.
Conclusion:
In this cohort, early renal functional decline in women is linked to increased vascular stiffness which may be associated with visceral fat accumulation as determined by waist circumference.
Keywords
Introduction
The increasing incidence of obesity is associated with the pandemic of type 2 diabetes. 1 It has been estimated that by 2030, some 439 million (7.7%) adults throughout the world will be affected. 2 The global health expenditure on diabetes is expected to be US$376 billion in 2030. In the United States, one-third of the total spend on diabetes is attributable to the complications of retinopathy, neuropathy and renal disease which remains the leading cause for renal replacement therapy.2–4
Obesity is increasingly recognized as an important risk factor for end-stage renal disease (ESRD), although the mechanisms underlying this association are complex and poorly understood. 5 Epidemiological studies in the general population suggest that the relationship between increasing obesity and kidney disease is stronger for women than men. 6 In the Women’s Health Initiative (WHI) study, increased waist circumference was associated with a near threefold increased risk of ESRD and death. 7
Abdominal obesity clusters within the metabolic syndrome. It is considered that elaboration of inflammatory cytokines from visceral fat impairs microvascular function and reduces insulin sensitivity. 8 Obesity could, therefore, cause elevations in vascular stiffness and enable the direct transmission of raised systemic pressures to the renal microvascular bed. A recent, retrospective study showed that patients developing renal dysfunction also had greater levels of arterial stiffness. 9 It is not clear from these studies whether the relationship of obesity and vascular stiffness in type 2 diabetes is gender specific and whether increases in the latter is a cause of renal disease.
In this cohort study, we investigated whether women with type 2 diabetes at high risk of developing progressive renal disease demonstrate a stronger association between abdominal obesity and vascular stiffness than men. We also assessed what, if any relationship vascular stiffness had with prevailing renal function in this cohort of patients and whether this association was gender specific.
Materials and methods
Patients with type 2 diabetes, not in receipt of renal replacement therapy, were recruited from general practices in South West London, United Kingdom. Those with at least two of the following characteristics, a history of hypertension (three consecutive sitting blood pressure readings >140 systolic and/or diastolic 90 mmHg without treatment or receiving treatment for known hypertension), urinary albumin:creatinine ratio >3 mg/mmol or a family history of hypertension, cardiovascular or ESRD occurring in a first-degree relative <65 years, were considered at increased risk of progressive renal disease.10–13 Patients assigned themselves to an ethnic group by choosing from the classification list used by the Office of Population Surveys, United Kingdom. We assigned patients selecting either, White British, White Irish or other White group as being of Caucasian heritage and those selecting Black Caribbean, Black African, Black other, Indian, Pakistan, Bangladeshi, Chinese or other Asian as being of non-Caucasian heritage.
Patients were excluded if they had a history of malignancy or any other life-threatening illness, current pregnancy, systolic blood pressure > 200 mmHg, diastolic blood pressure > 160 mmHg, ESRD, nephrotic range proteinuria excretion (total protein excretion rate > 3 g/day or albumin:creatinine ratio > 300 mg/mmol) or a history of cardiovascular disease (CVD). CVD was defined as having a clinical record of ischaemic heart disease (angina, myocardial infarction, coronary artery revascularization and/or heart failure), peripheral vascular disease (intermittent claudication or peripheral artery revascularization) or cerebrovascular disease (transient ischaemic episodes or stroke), a positive response to the modified Rose questionnaire instrument 14 or an abnormal 12-lead electrocardiogram performed at rest (Seca CardioConcept 5.6; Seca, Birmingham, United Kingdom). These data including the treatment histories and the clinical and biochemical measurements were collected at the in-person visit and recorded on an electronic proforma.
Trained research nurses carried out the clinical measurements under standardized conditions in our research facility. Anthropometric measures included height in metres, weight in kilograms and waist circumference in centimetres. Body mass index was calculated as weight in kilograms divided by height in square metres. Sitting blood pressure was measured by digital oscillometry (Omron 705IT; Omron Healthcare Europe, Hoofddorp, the Netherlands) according to the National Institutes of Health and Care Excellence guidance (http://www.nice.org.uk/guidance/cg127).
Arterial stiffness
Pulse wave amplitude was analysed using infrared finger plethysmography (PulseTrace PCA2; CareFusion UK 232 Ltd, Basingstoke, United Kingdom). Pulse contour characteristics using this methodology have been validated as a technique to estimate arterial stiffness. 15 The contour of the finger pulse was automatically analysed to determine a stiffness index (SI). The readings were made over 10 min and the SI computed from the mean of three measurements which were adjusted for age, sex, height and body weight.
Biochemical assessments
Venous blood was sampled after a 12-h fast. Plasma creatinine was measured using an isotope dilution mass spectrometry reference measurement procedure. Renal function was calculated as the estimated glomerular filtration rate (eGFR; mL/min/1.73 m2) from the plasma creatinine using the Chronic Kidney Disease Epidemiology Collaboration (CKD-EPI) equation. 16 Glycosylated haemoglobin (HbA1c) was measured by immunoturbidimetry (ADVIA® 2400; Siemens Diagnostics, Erlangen, Germany). Total triglycerides, total- and high-density lipoprotein (HDL)-cholesterols were estimated using an enzymatic assay (Roche system 702 on Cobas 8000/702; Roche Diagnostics, Mannheim, Germany). Low-density lipoprotein (LDL)-cholesterol concentration was calculated using the Friedewald formula: LDL-cholesterol = total-cholesterol − [triglyceride (mmol/L)/2.19] − HDL-cholesterol (mmol/L).
Statistics
Data were analysed using parametric and non-parametric tests according to their distribution (Stata 14; StataCorp, College Station, TX) and expressed as mean and standard deviation unless stated otherwise.
Multiple linear regression was conducted with SI as the dependent variable. Two models were fitted. Model A enters those variables found to differ between gender and those known to be associated with SI. To minimize multi-collinearity in the model where independent variables were highly correlated, we selected those to be entered into the model on the basis of clinical judgement.
There is a strong evidence base that central or visceral fat is likely to have a pathophysiological role in obesity-related reno-vascular disease.17,18 Therefore, waist circumference was entered as a proxy measure of visceral fat in model A. The use of insulin provided a clinical measure of severity of diabetes with respect to the loss of endogenous β-cell dysfunction. 19 We chose to input LDL-cholesterol as the lipid fraction where there is evidence for a role in the development of vascular stiffness.20,21 We were particularly interested in whether the relationship between waist circumference and vascular stiffness differed between genders, so the interaction between gender and waist circumference was also fitted. Model B adds eGFR into model A as well as the interaction between eGFR and gender to explore not only how it is related to SI but also how its inclusion affects the relationship between the other independent variables and SI. Unstandardized regression coefficients with 95% confidence intervals (CIs) are reported along with the p value (significance) of the regression coefficient. A p value of <0.05 was considered statistically significant.
This study was approved by the National Health Service Ethics Research Committee. All patients provided a written informed consent.
Results
Our study cohort (n = 166) was made up of 64 patients of Caucasian heritage (female: 41%) and 102 patients of non-Caucasian heritage (female: 55%). The male and female groups were of similar chronological age and duration of diabetes. There were no significant differences in body mass index, waist circumference, blood pressure or eGFR. Fasting total-, HDL- and LDL-cholesterols were significantly higher in women compared with men (Table 1). The proportion of women and men receiving non-insulin, blood glucose lowering treatment – metformin, the incretins (glucagon-like polypepetide-1 and dipeptidyl peptidase-4 inhibitors) and sulphonylureas – was similar. Insulin was prescribed for 28% of women and 22% of men (p = 0.322). There were no differences in the prescription of renin–angiotensin system modulators (angiotensin-converting enzyme inhibitors or angiotensin II receptor blockers), calcium channel blockers and/or loop or thiazide diuretics for the management of hypertension. The proportion of men prescribed hydroxymethylglutaryl CoA reductase inhibitors (statins) was significantly greater than in women (81% vs 65%; p = 0.021). Men were more than twice as likely to have a positive, current and/or past history of smoking tobacco than women (59% vs 29%; p < 0.001).
Demographic, anthropometric, clinical and biochemical characteristics of women and men with type 2 diabetes at increased risk of progressive renal disease.
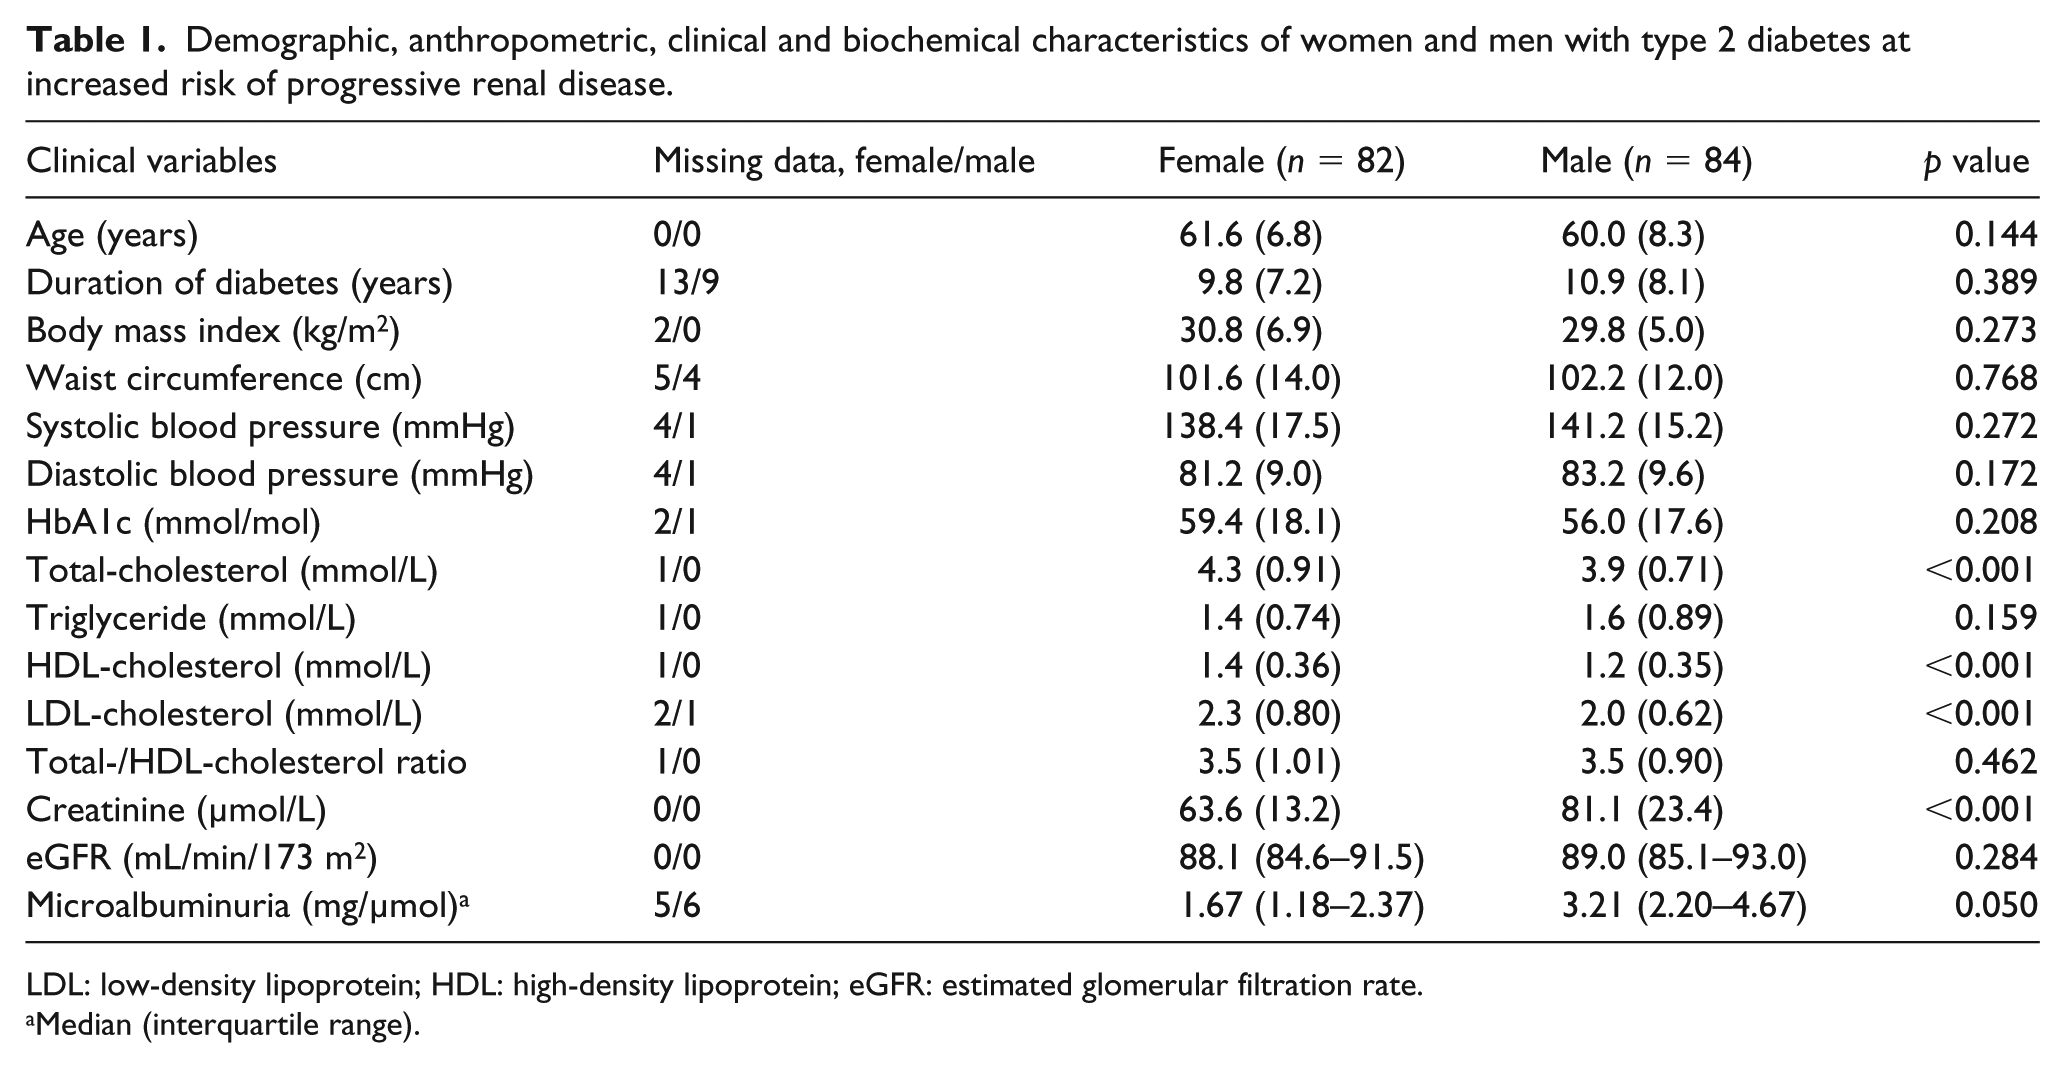
LDL: low-density lipoprotein; HDL: high-density lipoprotein; eGFR: estimated glomerular filtration rate.
Median (interquartile range).
Regression models were fitted for 141 patients (93%) of the whole study group with SI recordings. In model A, systolic blood pressure, LDL-cholesterol and statin usage all had non-significant associations with SI, so the model was refitted removing these variables to maximize available data. For patients prescribed insulin, SI was on average 3.0 m/s less than those not on insulin (95% CI: 0.95–5.07, p = 0.004). Gender, as a main effect, was not significantly associated with SI, p = 0.143. Waist circumference was significantly associated with SI – regression coefficient B = 0.15 (95% CI: 0.06–2.24, p = 0.001) – but the interaction term, gender, was not statistically significant, p = 0.161.
In model B, the following parameters were added to the model, eGFR as a main effect and in an interaction term with gender. The effect of being on insulin was unchanged, B = 3.1 units (95% CI: 1.09–5.05, p = 0.002). Gender as a main effect was non-significant, p = 0.804. Parameter estimates for waist circumference and its interaction with gender indicate that the regression coefficient, B, for the relationship between waist circumference and SI for women is 0.17 (95% CI: 0.08–2.53) and for men is lower, implying a flatter line of best fit between waist circumference and SI, B = 0.06. While the B coefficient for women is significantly greater than 0, p < 0.001, the difference in slope parameters, 0.17 and 0.06, between women and men is not statistically significant, p = 0.087 (Figure 1).
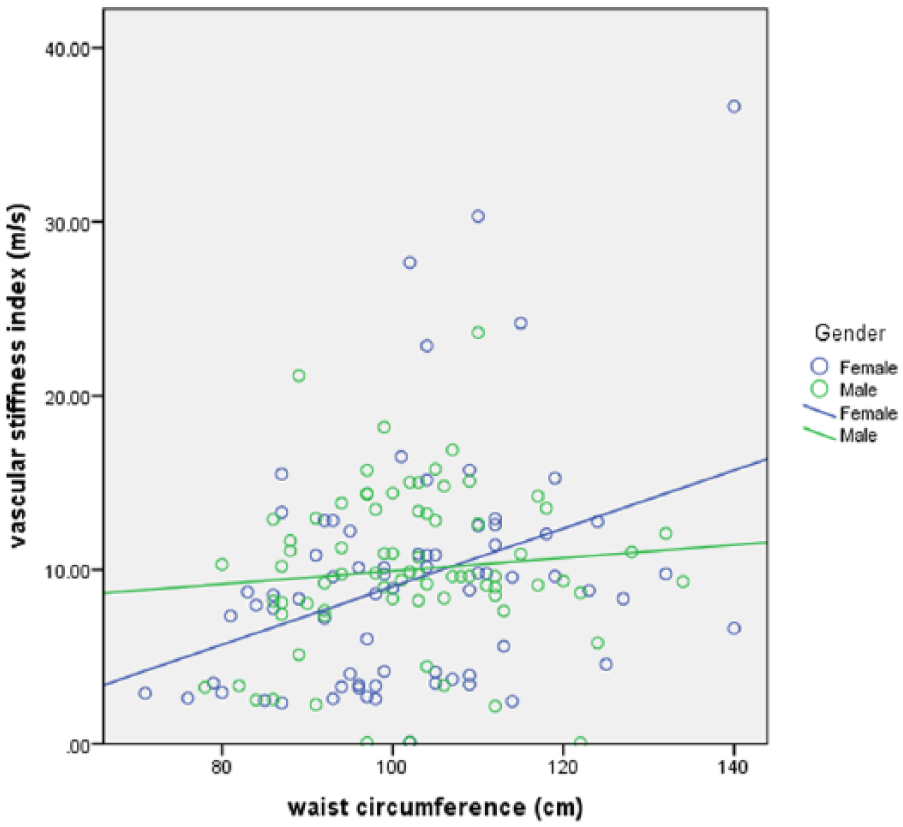
Regression line fitted showing slope parameters of the relationship between vascular stiffness index and waist circumference in women and men with type 2 diabetes at increased risk of progressive renal dysfunction.
There was a statistically significant negative slope parameter for the relationship between eGFR and SI for women, B = −0.15 (95% CI: −0.22 to −0.09, p < 0.001). The slope parameter for men was 0.01, and statistically significantly different from that of women, p = 0.001, indicating a significant interaction between eGFR and gender (Figure 2).
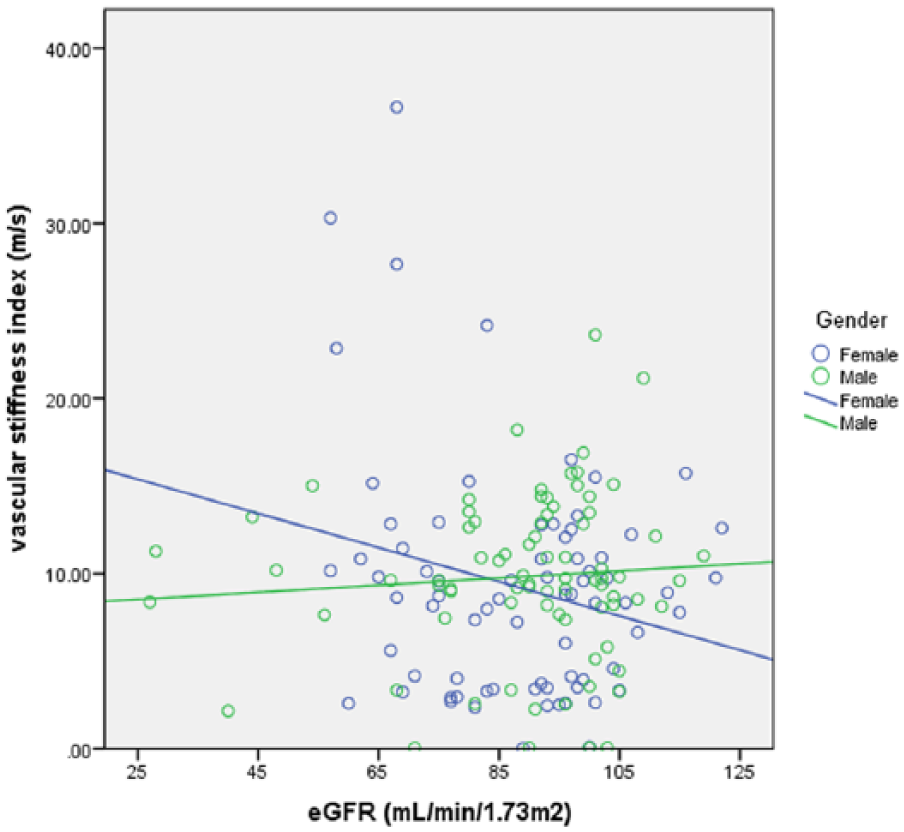
Regression line fitted showing slope parameters of the relationship between vascular stiffness index and renal function (eGFR) in women and men with type 2 diabetes at increased risk of progressive renal dysfunction.
Discussion
In these patients with type 2 diabetes, we found a positive association between vascular stiffness and waist circumference, which was significant and stronger in women compared with men. In women, there was a significant and inverse relationship between renal function and vascular stiffness – the higher the vascular stiffness, the lower the eGFR. Our data suggest that the interaction between eGFR and female gender is related to an effect of abdominal obesity on systemic arterial compliance.
CVD risk in women changes in relation to the menopause which is associated with increases in intra-abdominal adiposity and features of the metabolic syndrome. 22 Women with diabetes, particularly in their post-menopausal years, have strikingly poorer outcomes than men with diabetes, and women without diabetes with hazard ratios for vascular complications and all-cause mortality which is two- to sixfold greater.23–25 Moreover, the development of renal disease itself, which our patients are at risk of developing, further increases the CVD risk.26,27
In the Kidney Early Evaluation Program (KEEP), in which 14,631 patients were followed up for 8 years, body mass index was not predictive of ESRD in people of Black or White racial origin. 28 However, in the prospective, multi-ethnic cohort WHI study, increased waist circumference was associated with a near threefold increased risk of ESRD and death. 7 In both of these studies, the baseline eGFR was an important determinant of the risk of progression to ESRD. In the WHI cohort, the development of ESRD was linked with central obesity in those women who did not have baseline chronic kidney disease with reduced glomerular filtration. It was considered that the effects of central obesity on the risk of ESRD were mediated by diabetes and hypertension. In both the KEEP and WHI studies, there are no sub-analyses of patients with propensity scores or characterization of risk of renal disease progression as we have done. However, these data support our findings that suggest that increases in waist circumference influence the progression of renal disease in women with type 2 diabetes at risk of ESRD when renal function is preserved. We consider that in women characterized as being at high risk of ESRD, increasing vascular stiffness is a probable mechanistic link of increasing waist circumference associated with the early decline in eGFR.
Interventions to limit increases in waist circumference before and during the menopause transition could be of benefit in modifying vascular stiffness and the risk of progressive renal and the associated CVD. 29 Some authors have reported that poorer achievement of treatment targets for glucose, blood pressure control and lipid profile optimization may also contribute to poorer vascular disease outcomes in women.7,30 Trials of statins in patients with hypertension, hypercholesterolaemia and chronic kidney disease have shown stabilization or improvement in arterial stiffness according to the measures of central arterial pressure.31,32 In our cohort, women had higher levels of total and LDL-cholesterol and were less likely to receive statin therapy, but this difference did not confound the findings in our study. Together, these data contribute to the emerging debate as to whether a separate approach to women’s health is required with gender-specific propensity risk scores to better manage traditional, modifiable risk factors for renal and vascular disease. 33
Whether the development of vascular stiffness is related to exposure to hyperglycaemia is also influenced by treatment for diabetes is of interest. 34 A weight reduction strategy in overweight, normotensive, non-diabetic subjects significantly reduced both fasting insulin and vascular stiffness. 35 In patients with type 1 diabetes, consumption of large amounts of refined carbohydrate is associated with higher levels of vascular stiffness. 36 We noted that patients prescribed insulin had a lower vascular SI which was not confounded by the quality of diabetes control measured by the HbA1c level. Insulin combined with metformin therapy has been shown to improve both endothelium-dependent and endothelium-independent vasodilatation in patients with type 2 diabetes. 37 However, it remains to be determined whether the modulatory effects of insulin, diet and weight loss on vascular stiffness are effective in reducing the risk of renal disease.
Prospective data investigating the relationships of gender with the development of early renal disease in patients with diabetes are limited. A recent study of 1464 patients with diabetes found that incident cases of chronic kidney disease were higher in women than men after adjusting for known biologic risk factors and importantly was not driven by levels of urinary albumin. 38 These data, with ours, indicate that non-traditional risk factors, such as vascular stiffness, need further evaluation with respect to the gender specificity of renal and CVD outcomes in the longer term.
We did not measure arterial stiffness using the assessment of aortic pulse wave velocity which may be a limitation in this study. However, several authors have shown good repeatability and close correlation of the SI (r = 0.85) derived from finger photoplethysmography and aortic pulse wave velocity measurement.39,40 Follow-up data from our cohort will be of value in understanding the implications of the associations we found with respect to the occurrence of chronic kidney disease. Studies are now required to test whether weight management can abrogate increases in waist circumference and vascular stiffness in women at high risk of developing progressive renal disease.
Footnotes
Acknowledgements
We would like to specifically thank Dr John Pepe of Richmond University, Staten Island, New York, United States, and Dr J Godbold of the Icahn School of Medicine, New York, United States, for their contributions in setting up this programme and developing the protocol, respectively.
Declaration of conflicting interests
The author(s) declared no potential conflicts of interest with respect to the research, authorship and/or publication of this article.
Funding
The author(s) disclosed receipt of the following financial support for the research, authorship, and/or publication of this article: This work was made possible through grant support from the National Institutes of Health Research, United Kingdom (UKCRN ID 8432), and Dialysis Clinic, Inc. (DCI RF #C-3305) and was carried out in the Clinical Research Facility at St George’s University Hospitals Foundation Trust, London, United Kingdom.