
Abstract
Objective:
Adiponectin and leptin are associated with insulin resistance and cardiovascular disease. Information on the prognostic value after an acute myocardial infarction is still conflicting.
Methods:
Patients (n = 180) without known diabetes and with admission glucose of <11 mmol/L admitted for an acute myocardial infarction in 1998–2000 were followed for mortality and cardiovascular events (first of cardiovascular mortality/acute myocardial infarction/stroke/heart failure) until the end of 2011 (median: 11.6 years). Plasma adiponectin and leptin were related to outcome in Cox proportional-hazard regression analyses.
Results:
Median age was 64 years and 69% were male. Total mortality was 34% (n = 61) and 44% (n = 80) experienced a cardiovascular event. Adiponectin at discharge predicted cardiovascular events (hazard ratio; 95% confidence interval; 1.45; 1.02–2.07, p = 0.038), total mortality (2.53; 1.64–3.91, p < 0.001) and cancer mortality (3.64; 1.51–8.74, p = 0.004). After adjustment for age, sex, body mass index, previous myocardial infarction and heart failure, adiponectin predicted total mortality (1.79; 1.07–3.00, p = 0.027) but not cardiovascular events. High levels of leptin were associated with cardiovascular events during the first 7 years, after which the association was attenuated. Leptin did not predict total mortality.
Conclusion:
In patients with acute myocardial infarction but without previously known diabetes, high levels of adiponectin at discharge predicted total mortality. The present results support the hypothesis that high rather than low levels of adiponectin predict mortality after acute myocardial infarction.
Introduction
Cardiovascular (CV) disease is the leading cause of death globally. Despite favourable trends in early mortality rates after acute coronary syndromes, there is still a high CV risk beyond 1 year, especially in people with diabetes. 1 This is also true for individuals with newly discovered glucose abnormalities. 2 Biomarkers that are easily available in the acute setting of an acute coronary event are highly warranted to identify high-risk patients and could further elucidate underlying causes of the long-term risk. Adipokines, derived from the adipose tissue, such as adiponectin and leptin, are closely related to the metabolic syndrome and development of diabetes3,4 where females have higher levels of adiponectin and leptin than men. Adipokines are also predictive of future CV disease.5–7 A proposed joint mechanism is a metabolically unhealthy distribution of adipose tissue with defective adiponectin response with reduced insulin sensitivity and increased degree of activated systemic inflammation. 8 Experimental data indicate that adiponectin has anti-inflammatory, anti-atherogenic and insulin-sensitising effects 8 and have protective effect on several stages of the atherosclerotic process such as reducing the expression of adhesion molecules in endothelial cells, 9 proliferation and migration of smooth-muscle cells 10 and inhibiting the transformation from macrophages to foam cells. 11 Thus, in some but not all studies, low levels of adiponectin are associated with a future myocardial infarction (MI). 12 The relationship between adiponectin and the risk of CV complications and death is, however, complex. Low levels predict CV events, while high levels predict mortality after such events.13–15 In 2006, this pattern was labelled ‘the adiponectin paradox’. 16 In contrast to adiponectin, leptin is a pro-inflammatory adipokine associated with several components of the atherosclerotic process such as endothelial dysfunction, sympathetic activation and thrombogenicity.17,18
The present investigation aimed to explore the value of adiponectin and leptin as prognostic, long-term markers after an acute myocardial infarction (AMI) in patients without previously known diabetes. The hypothesis tested was that low levels of adiponectin but high levels of leptin were associated with a future CV event in these patients.
Methods
Research design
A total of 181 patients with AMI included in the Glucose Tolerance in Patients with Acute Myocardial Infarction (GAMI) cohort with admission capillary blood glucose of <11.1 mmol/L and without known diabetes were prospectively enrolled on two coronary care units in Sweden between 1998 and 2000. 19 All patients had elevated troponin T levels (>0.05 g/L). The exclusion criteria were age >80 years and serum creatinine of >200 µmol/L. 19 Patients were managed according to established international guidelines at that time including acute reperfusion and revascularisation previously described in details. 19 Blood sampling was performed after an overnight fast on the first morning after admission (day 2) and on the day of discharge (days 4–5). Venous plasma was stored at −70°C until analysis. A standardised oral glucose tolerance test (OGTT) was performed on 167 patients on the day of hospital discharge and patients were classified as having a normal glucose tolerance (NGT), impaired glucose tolerance (IGT) or newly discovered diabetes mellitus (DM) according to World Health Organization (WHO) 1999. Patients with IGT or DM were grouped together as having abnormal glucose tolerance (AGT).
Laboratory analyses
Glucose concentration was measured in whole capillary blood immediately after sampling using a HemoCue® portable photometer (HemoCue® AB, Ängelholm, Sweden). HbA1c was analysed by high-performance liquid chromatography on whole blood applied on filter paper (Boehringer-Mannheim Scandinavian AB, Bromma, Sweden). The upper normal limit was 5.3% and the coefficient of variation was <3%.
Plasma leptin and total adiponectin were analysed in Umeå with a double-antibody radioimmunoassay (Linco Res., St Louis, MO, USA). The total coefficient of variation for leptin was 4.7% at both low (2–4 ng/mL) and high (10–15 ng/mL) levels. The corresponding values for adiponectin were 15.2% at low (2–4 µg/mL) levels and 8.8% at high (26–54 µg/mL) levels.
Plasma lipids were measured in fasting state at the local laboratory using standard methods. Plasma insulin and intact proinsulin were quantified with commercially available immunoassays (DAKO Ltd, Cambridgeshire, UK). Insulin resistance was estimated in a fasting steady state by the homeostasis model assessment of insulin resistance (HOMA-IR). The insulinogenic index (IGI) was calculated as the difference between 30 and 0 min plasma insulin divided by the difference between 30 and 0 min plasma glucose at OGTT.
Outcome measurements and definitions
All, but one patient lost to follow-up, were followed until 31 December 2011. Information on CV events was derived from hospital and outpatient clinical records, supplemented if possible by a telephone interview with the survivors (or close relatives when needed). Death certificates were obtained from the Swedish National Death Registry and the cause of death given in these certificates was checked against available hospital records.
Causes of deaths were categorised as CV (caused by AMI/stroke/aortic dissection or sudden death without any obvious reason), cancer or other. AMI was diagnosed according to national guidelines. To be accepted as a re-infarction, time to the event had to be >72 h after index infarction. Stroke was defined as a neurological deficit observed by a physician and persisting for >24 h without any other disease explaining the symptoms. Severe congestive heart failure (CHF) was defined as clinician-judged heart failure necessitating hospital admission including intensified treatment. A major CV event was defined as the first occurrence of re-infarction/AMI, stroke, severe CHF or CV death.
Statistical analysis
Baseline characteristics are presented as median with lower and upper quartiles for continuous and numbers and percentages for categorical variables. Chi-squared test or, when appropriate, Fisher’s exact test or Wilcoxon rank-sum test were used to compare baseline characteristics between groups. A two-sided p value of <0.05 was accepted as statistically significant. Independent association of biomarkers to future event was analysed before and after age adjustments using Cox proportional-hazard regression models and hazard ratio (HR) with 95% confidence interval (CI) was calculated. When appropriate (if traversing Kaplan–Meier curves), logistic regression models were performed and odds ratio (OR) with 95% CI is presented. For leptin, stratified HR for 1 year at a time was calculated, due to converging event curves indicating a non-proportional occurrence of events. Skewed continuous variables were log transformed before analysis to limit the influence of extreme values. If still statistically significant after age adjustments, we adjusted for clinically relevant covariates with a p < 0.10; previous MI, previous CHF and body mass index (BMI). In addition to this, sex was forced into the final model. We further analysed the predictive value of log-transformed leptin and adiponectin dichotomised by sex-specific median levels. To identify a predictive level of adiponectin at discharge, adiponectin and leptin levels were also analysed by sex-specific quartiles. Kaplan–Meier curves were computed to assess time to major CV event and mortality by sex-specific median levels of leptin and adiponectin. Analyses were conducted using the SAS statistical program (SAS version 9.4), software from SAS Institute, Cary, NC, USA.
Ethical consideration
The study complied with the Declaration of Helsinki and the local ethics committee at the Karolinska Institute approved the study protocol. All participants gave their written informed consent to the initial study and the follow-up.
Results
Baseline characteristics and biochemical variables are presented in Table 1. Median age was 64 years [interquartile range (IQR): 57–71] and 69% were males. In total, 20% had previous MI, 8% CHF and 3% stroke. Among patients performing OGTT, 32% were classified as NGT and 68% as AGT (IGT n = 58; DM n = 55). Median level of adiponectin on day 2 was 10.2 mg/L for men (IQR: 6.7–14.5) and 16.6 mg/L (IQR: 12.2–24.1) for women. Corresponding levels for adiponectin at discharge were 8.6 mg/L (IQR: 5.9–14.4) for men and 16.3 mg/L (IQR: 10.2–21.7) for women. Clinical and laboratory characteristics for patients by the median level of adiponectin at discharge are presented in Table 2. Patients with adiponectin levels above the median were older, had a lower BMI and HOMA-IR and more often a history of heart failure. Reperfusion therapy and treatment at discharge did not differ between the groups. The cut-off level for the highest quartile of adiponectin at discharge was 14.4 mg/L in men and 21.7 mg/L in women. The median level of leptin was 8.9 ng/mL for men and 22.6 ng/mL for women on day 2 and 6.7 ng/mL for men and 22.2 ng/mL for women at discharge. Clinical and laboratory characteristics for patients by the median level of leptin on day 2 are presented in Table 3. Patients with leptin levels above median had higher BMI, HOMA-IR, C-reactive protein (CRP), triglycerides, more frequent AGT and previous hypertension but a less frequent history of cancer. Treatment at discharge did not differ between the groups.
Clinical and laboratory characteristics in patients (n = 180).
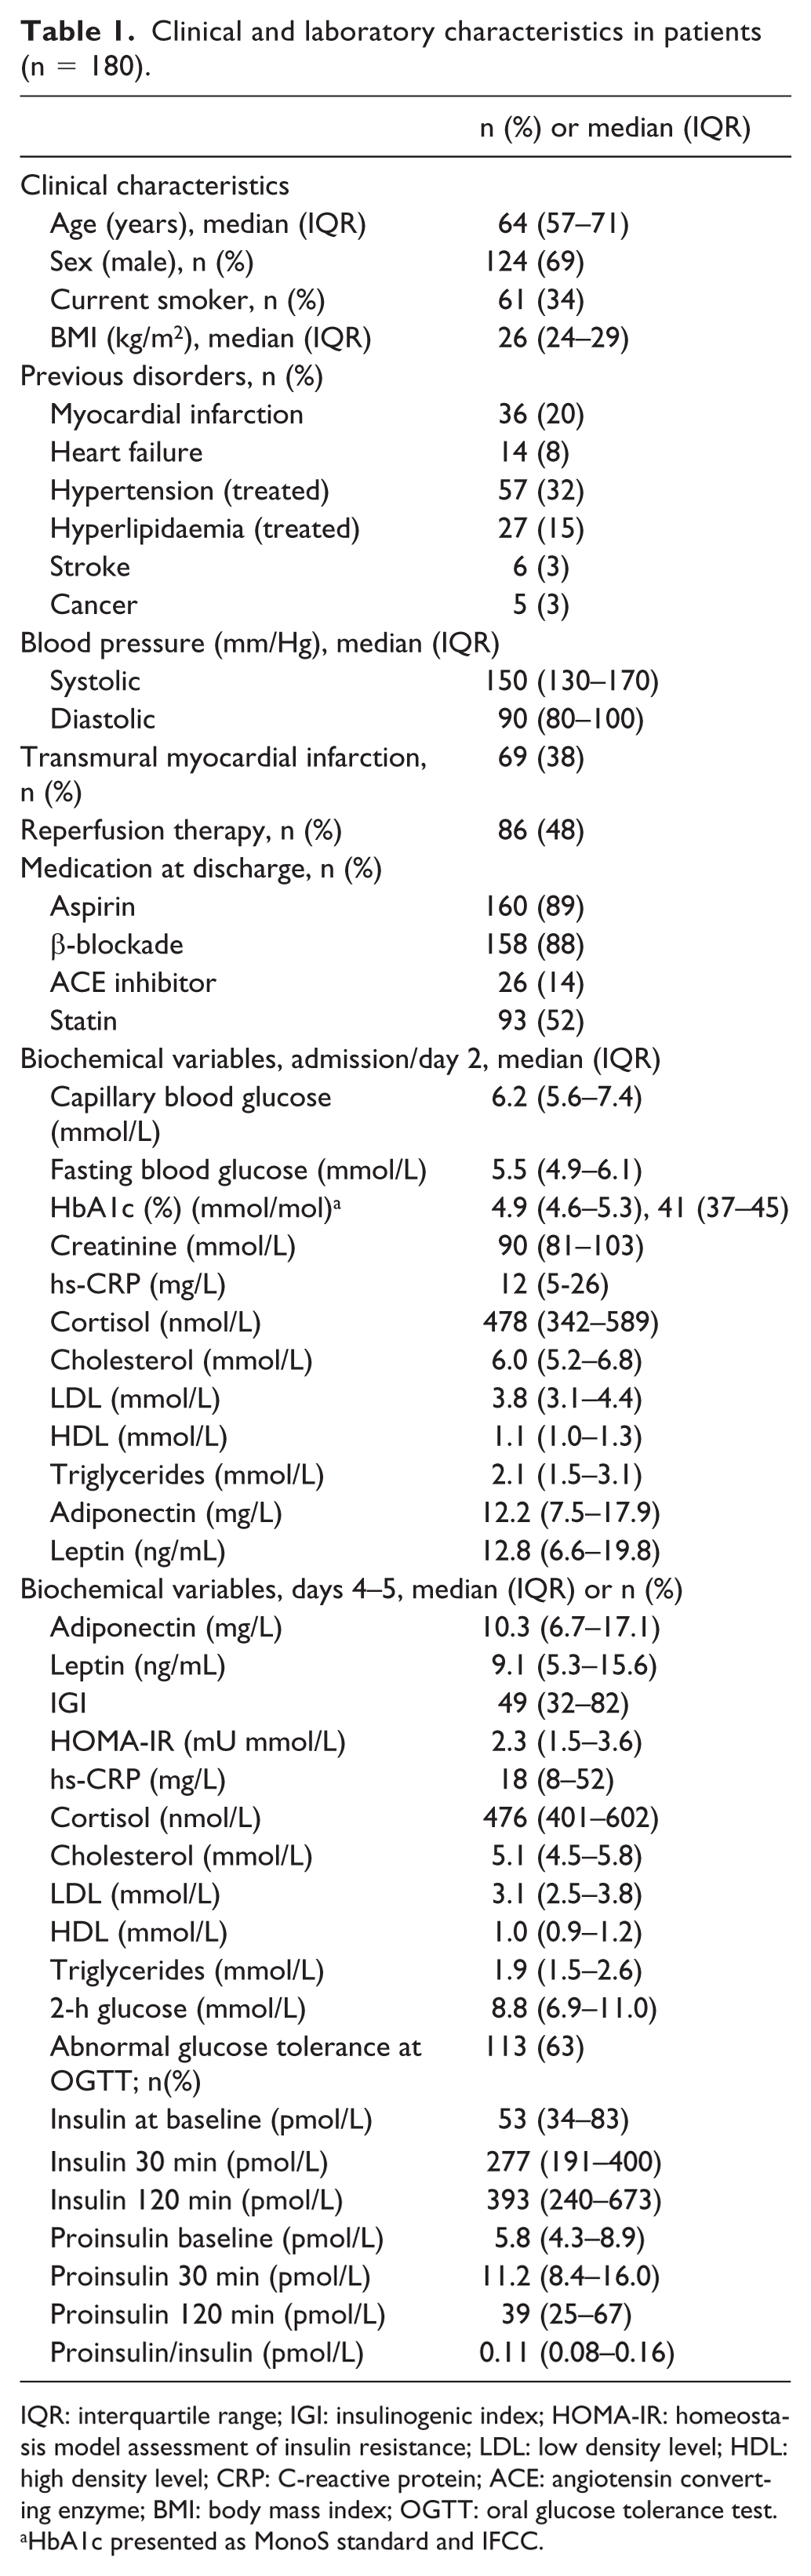
IQR: interquartile range; IGI: insulinogenic index; HOMA-IR: homeostasis model assessment of insulin resistance; LDL: low density level; HDL: high density level; CRP: C-reactive protein; ACE: angiotensin converting enzyme; BMI: body mass index; OGTT: oral glucose tolerance test.
HbA1c presented as MonoS standard and IFCC.
Clinical and laboratory characteristics in patients divided into those above and below the median (men: 8.6 mg/L, women: 16.3 mg/L) for adiponectin at discharge.
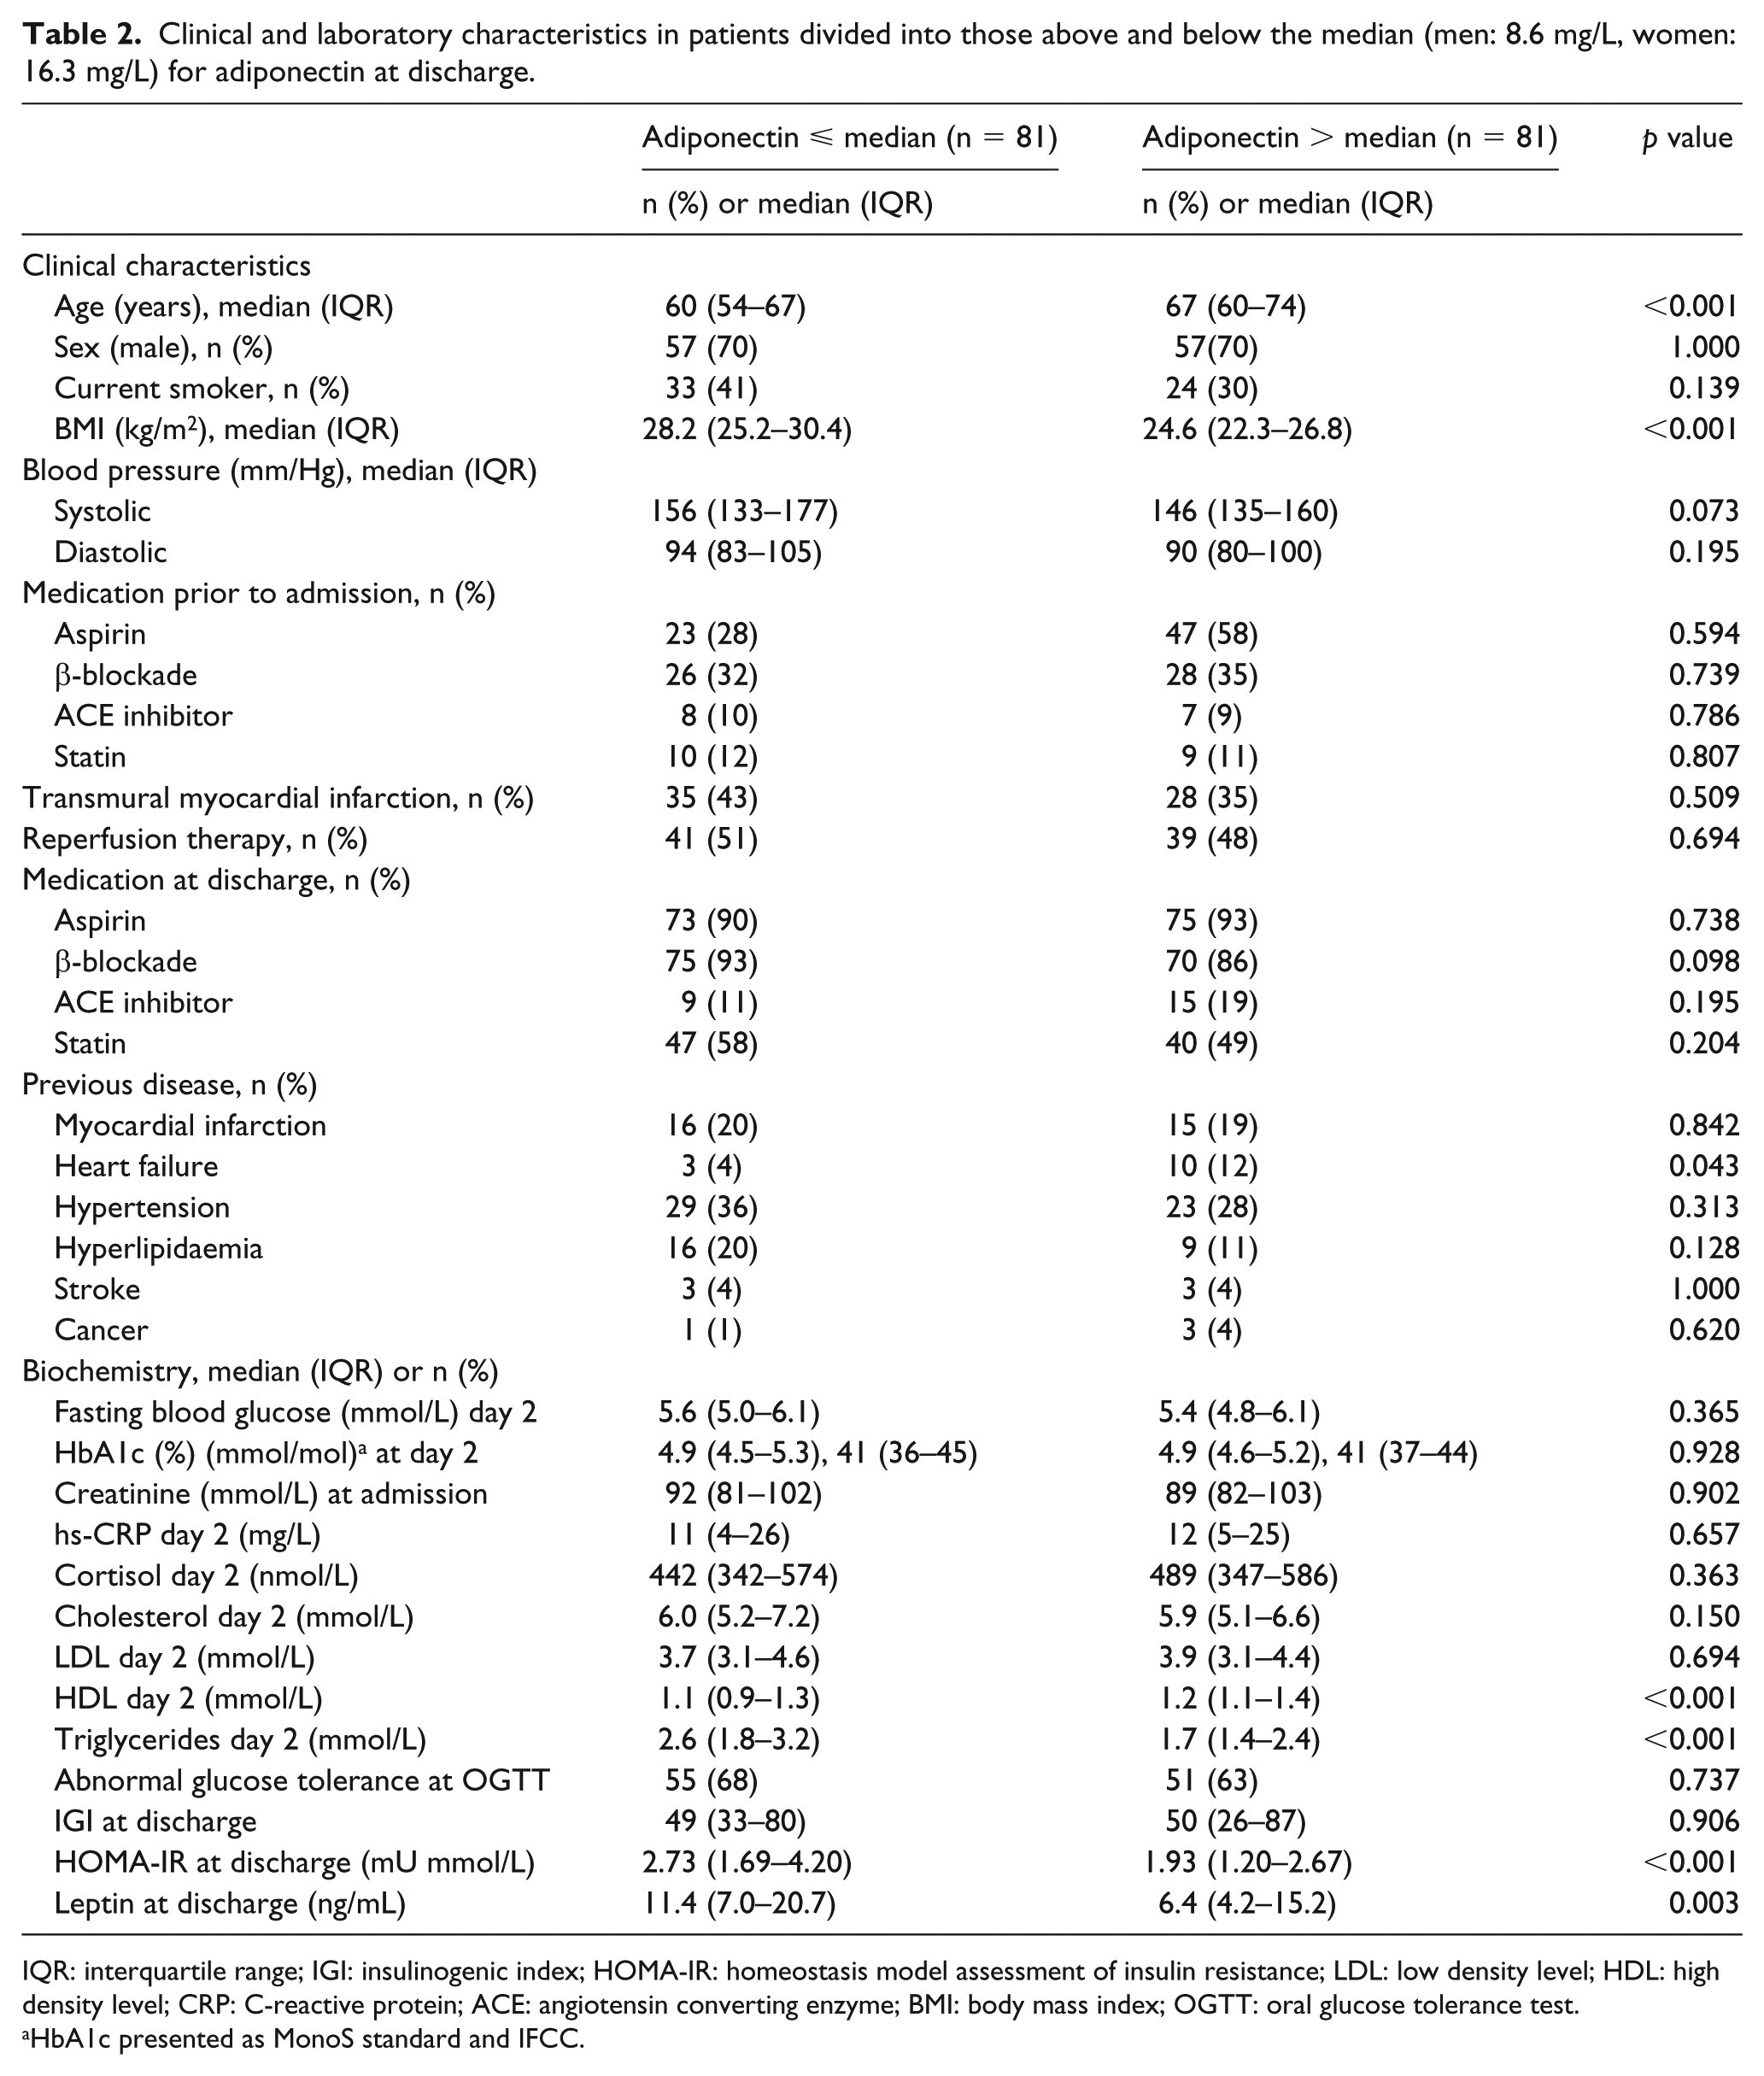
IQR: interquartile range; IGI: insulinogenic index; HOMA-IR: homeostasis model assessment of insulin resistance; LDL: low density level; HDL: high density level; CRP: C-reactive protein; ACE: angiotensin converting enzyme; BMI: body mass index; OGTT: oral glucose tolerance test.
HbA1c presented as MonoS standard and IFCC.
Clinical and laboratory characteristics in patients divided into those above and below the median (men: 8.9 ng/mL and women: 22.6 ng/mL) for leptin on day 2.
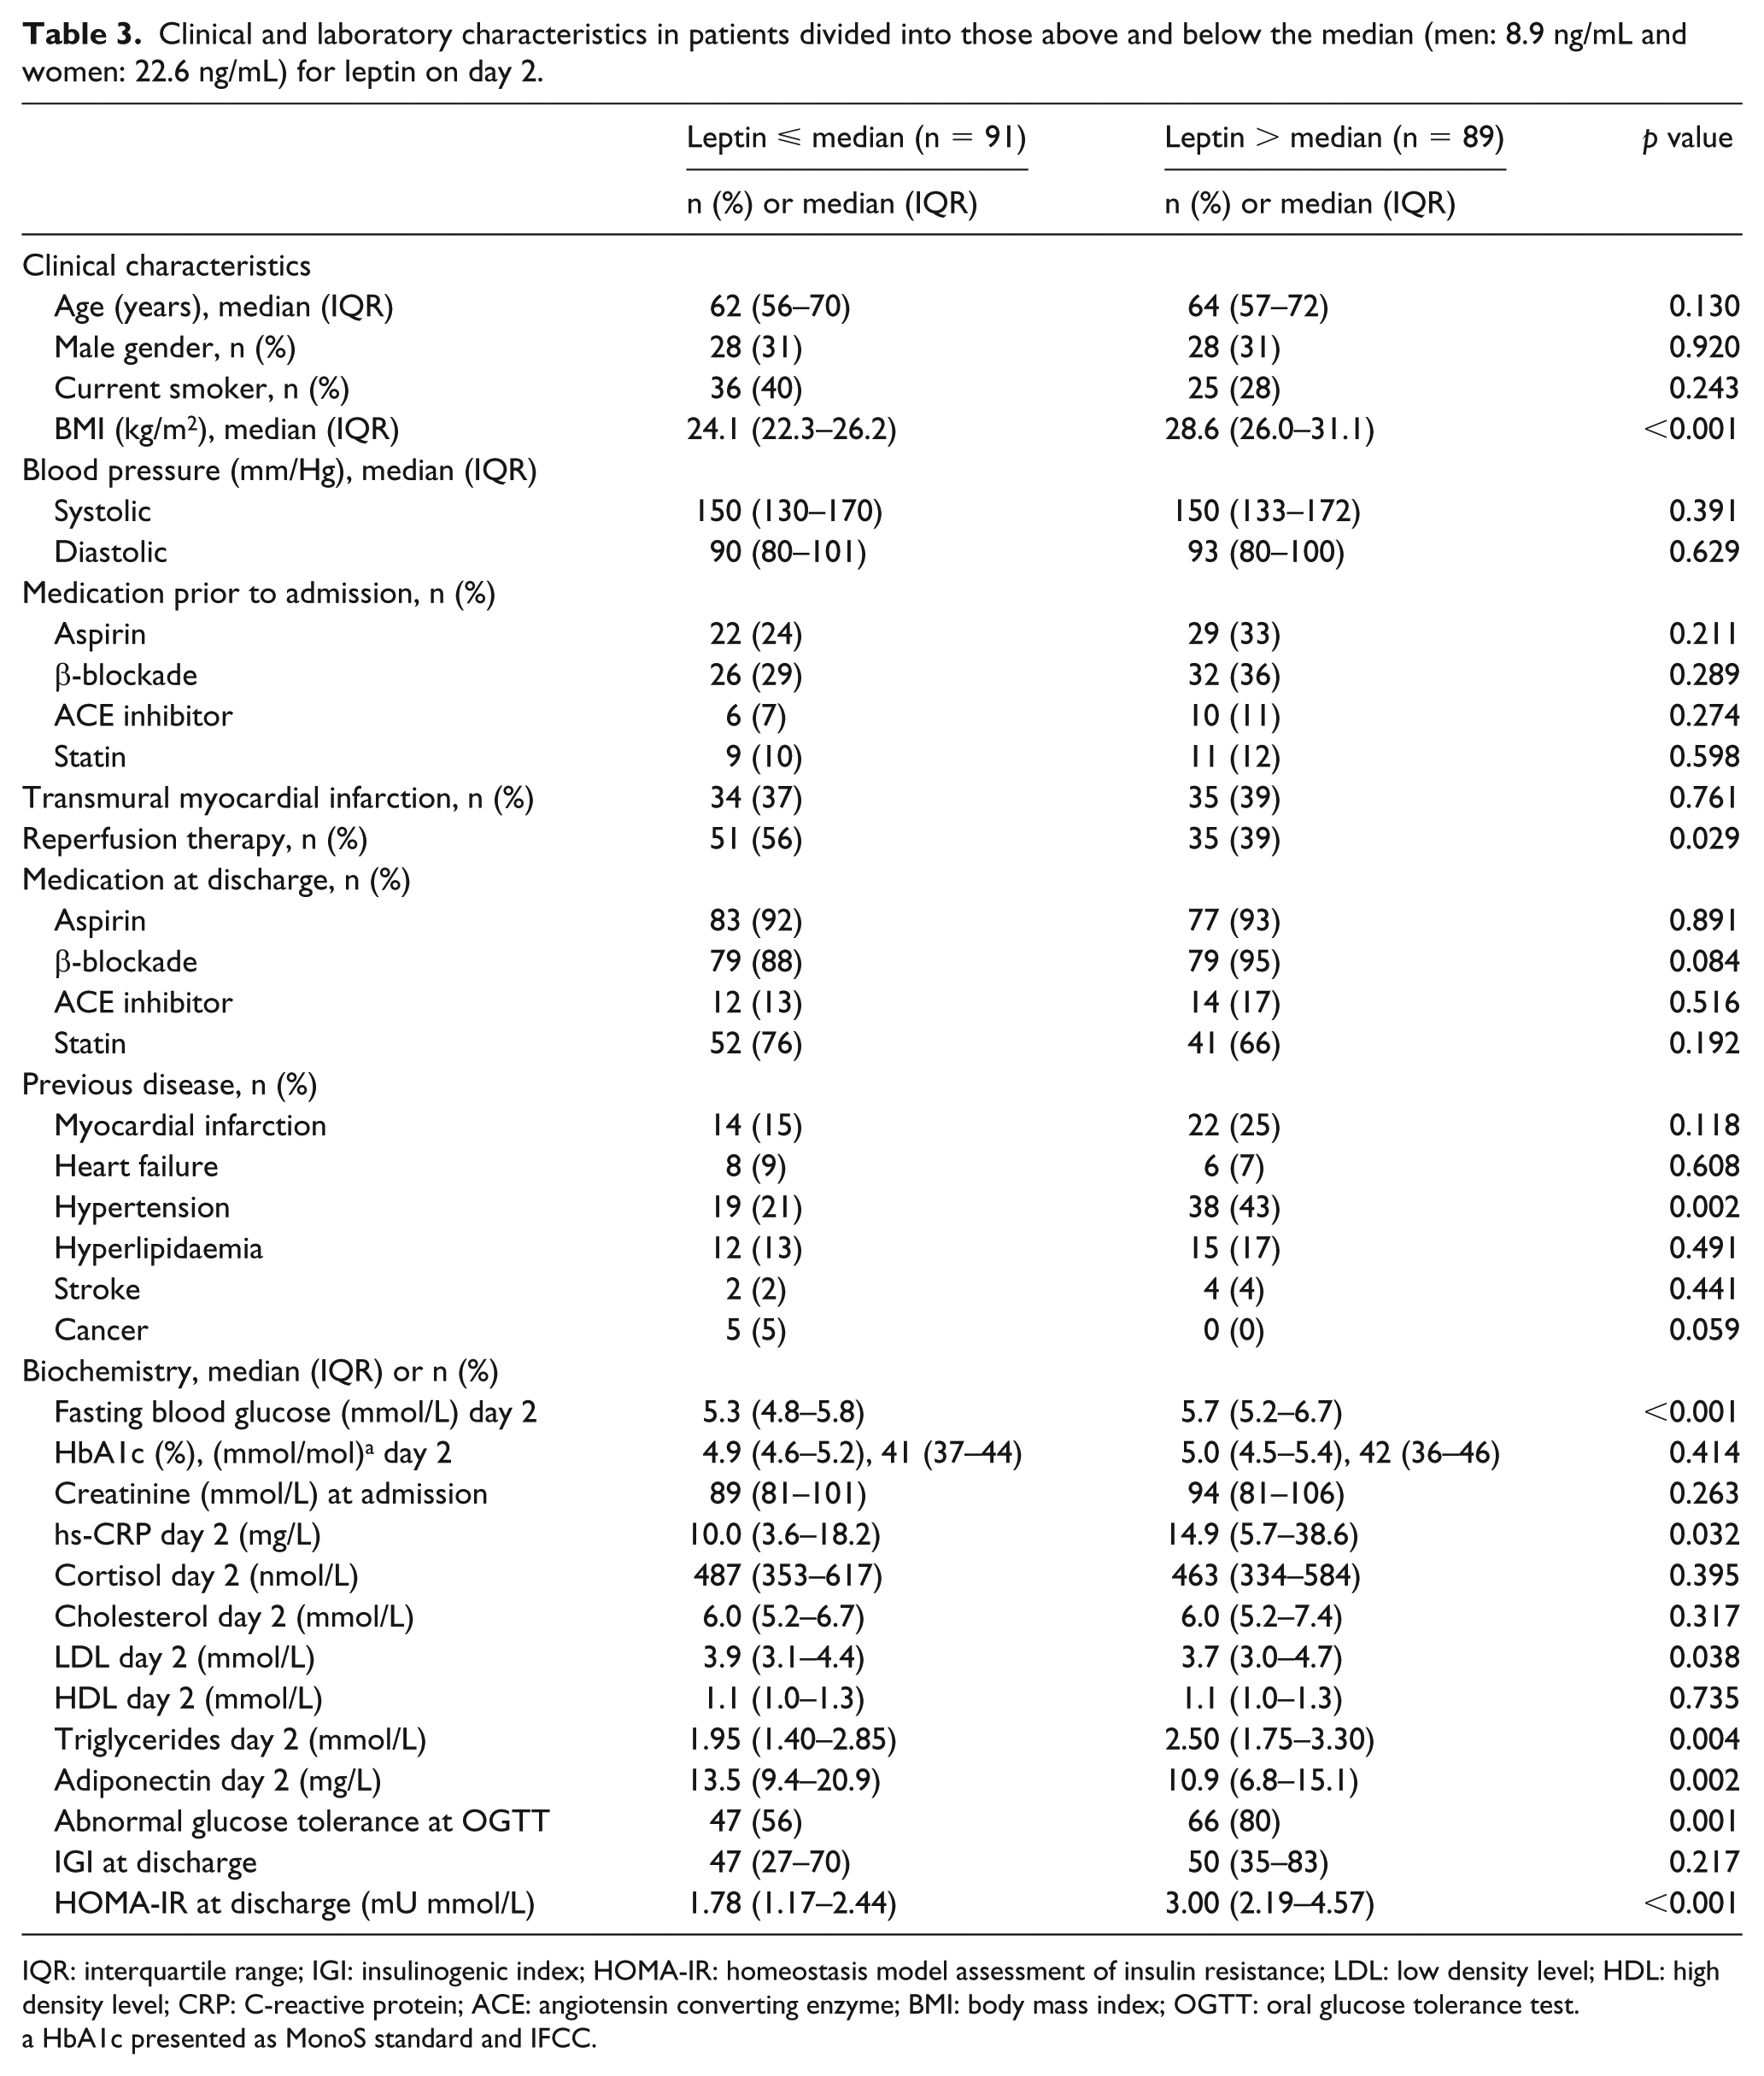
IQR: interquartile range; IGI: insulinogenic index; HOMA-IR: homeostasis model assessment of insulin resistance; LDL: low density level; HDL: high density level; CRP: C-reactive protein; ACE: angiotensin converting enzyme; BMI: body mass index; OGTT: oral glucose tolerance test.
HbA1c presented as MonoS standard and IFCC.
Outcome
Patients were followed for a median period of 11.6 years (IQR: 9.6–12.1). Total mortality was 34% (n = 61) and 44% (n = 80) experienced a major CV event. Eight percent (n=15) was diagnosed with a stroke, 19% (n=34) had a MI and 13% (n=23) severe CHF. CV reasons were behind 57% (n = 35) of the deaths while cancer death (30%, n = 18) and death due to other causes (infections or accidents, 11%, n = 7) were less common. Patients who succumbed during the total follow-up time but who survived until discharge had increasing levels of adiponectin during hospitalisation (median change: 0.2 mg/L, IQR: 2.7 to −2.7, p = 0.011) compared to survivors. Mortality by quartiles of adiponectin at discharge is presented in Figure 1. Adiponectin levels above the median at discharge were associated with higher mortality (p < 0.001; Figure 2(a)), with gradually separating curves over time, while the rate of major CV events did not differ between those above/below the median levels of adiponectin (log-rank p = 0.234; Figure 2(b)). Leptin levels on day 2 were not associated with total mortality (log-rank p = 0.650) or major CV event-free survival (log-rank p = 0.419) (Figure 3(a) and (b)). However, leptin levels above the median were associated with an increased number of major CV events up to 7 years after the index AMI, diminishing thereafter (Figure 3(b)).
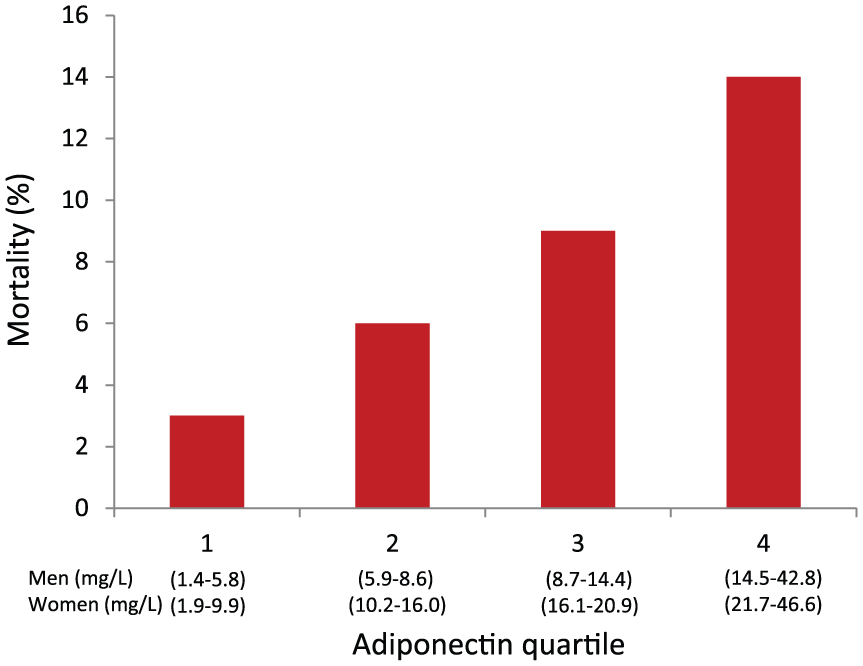
Mortality (%) by quartiles of adiponectin at discharge.
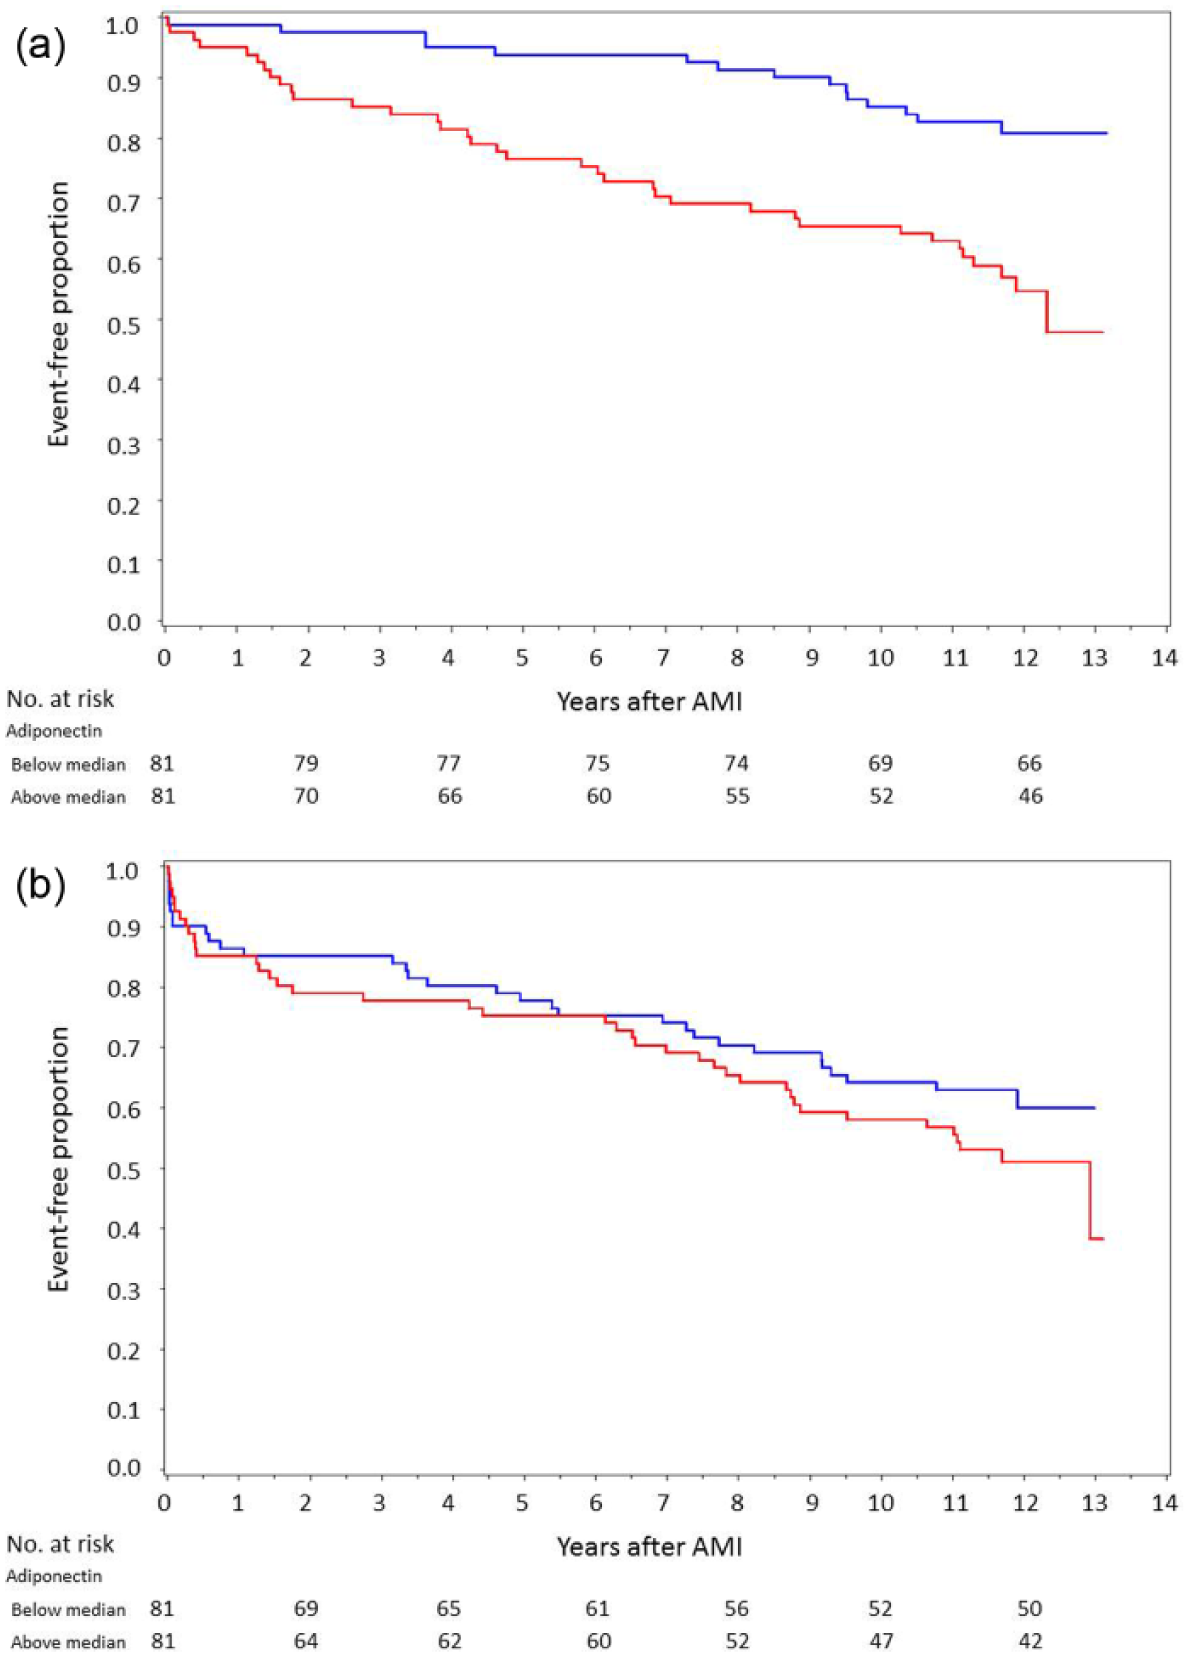
Kaplan–Meier curves showing time to (a) all-cause mortality, log-rank test p < 0.001, and (b) CV events, log-rank test p = 0.234, divided into those above (red) and below (blue) the median (men: 8.6 mg/L, women: 16.3 mg/L) for adiponectin at discharge.
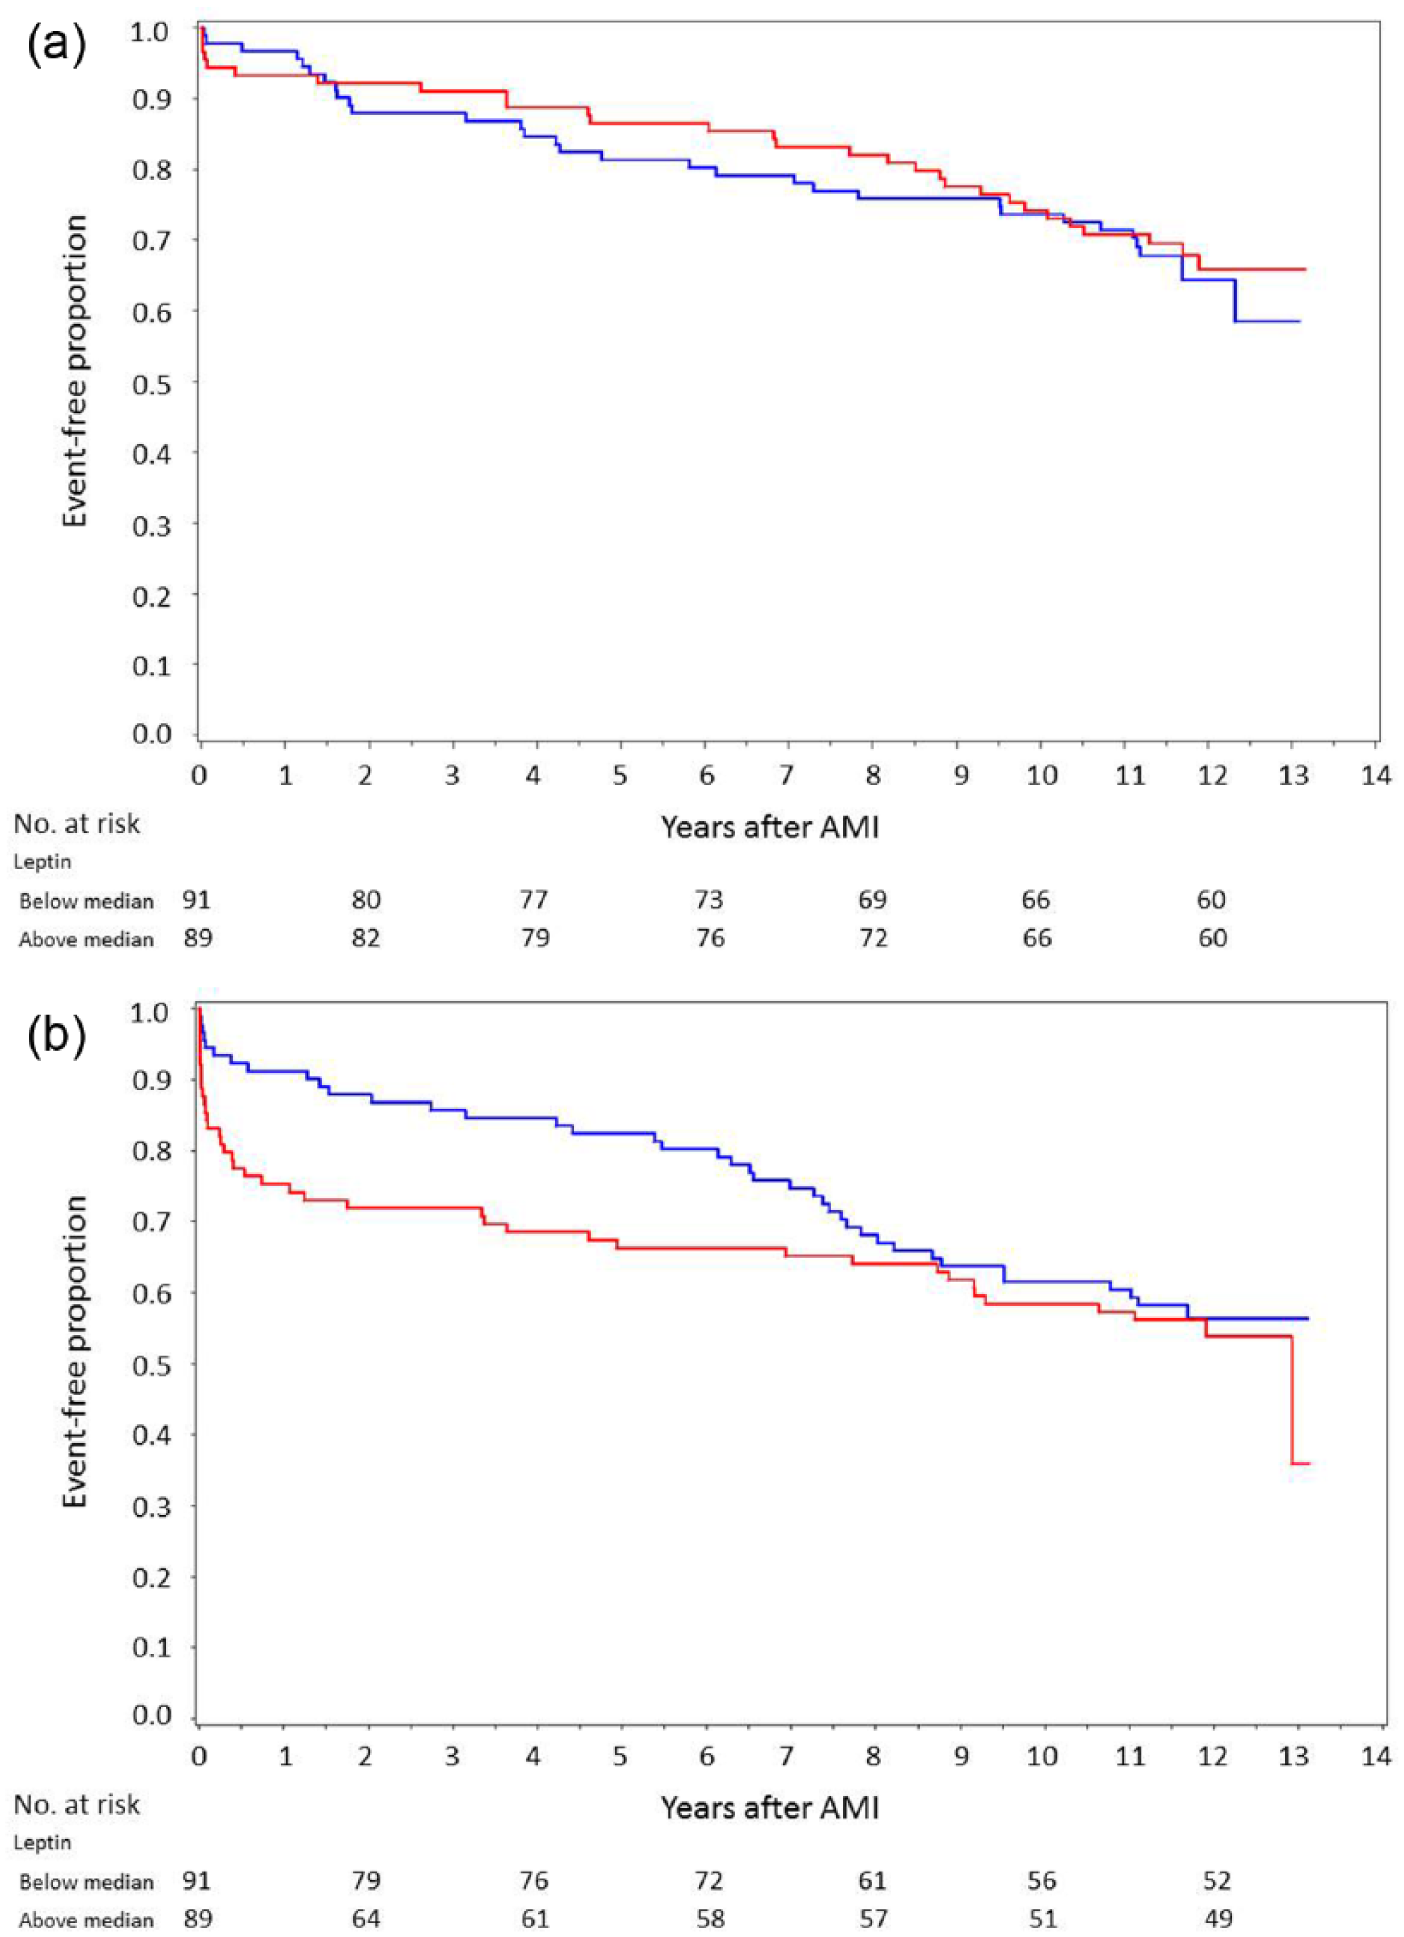
Kaplan–Meier curves showing time to (a) all-cause mortality, log-rank test p = 0.650, and (b) CV events, log-rank test p = 0.419, divided into patients above (red) and below (blue) the median (men: 8.9 ng/mL, women: 22.6 ng/mL) for leptin on day 2.
Univariate and multivariate analyses
Univariate and age-adjusted Cox proportional-hazard regression analyses are presented in Table 4. Adiponectin levels on day 2 did not predict mortality or major CV events when adjusted for age. In contrast, high adiponectin levels at discharge predicted major CV events (OR; 95% CI: 1.65; 1.03–2.63, p = 0.038), total mortality (HR: 2.53; 1.64–3.91, p < 0.001 stratified into men: 3.41; 1.90–6.11, p < 0.001 and women: 1.88; 0.84–4.23, p = 0.124), CV mortality (1.87; 1.08–3.21, p = 0.025) and cancer mortality (3.64; 1.51–8.74, p = 0.004). After adjustments for age, adiponectin remained a positive predictor of total mortality (1.69; 1.07–2.68, p = 0.026) and cancer mortality (3.87; 1.43–10.48, p = 0.008). After further adjustment for age, previous MI, previous CHF and BMI, adiponectin still predicted total mortality (1.67; 1.04–2.68, p = 0.035) even when sex was forced into the model (1.79; 1.07–3.00, p = 0.027). High levels of adiponectin at discharge corresponding to the highest quartile (above 14.4 mg/L in men and above 21.7 mg/L in women) were strongly associated (age adjusted) with total mortality (3.57; 1.30–9.82, p = 0.014).
Predictors of future events in patients, unadjusted and age adjusted by Cox proportional-hazard regression models [HR (95% CI)] or logistic regression models [marked as *, OR (95% CI)].
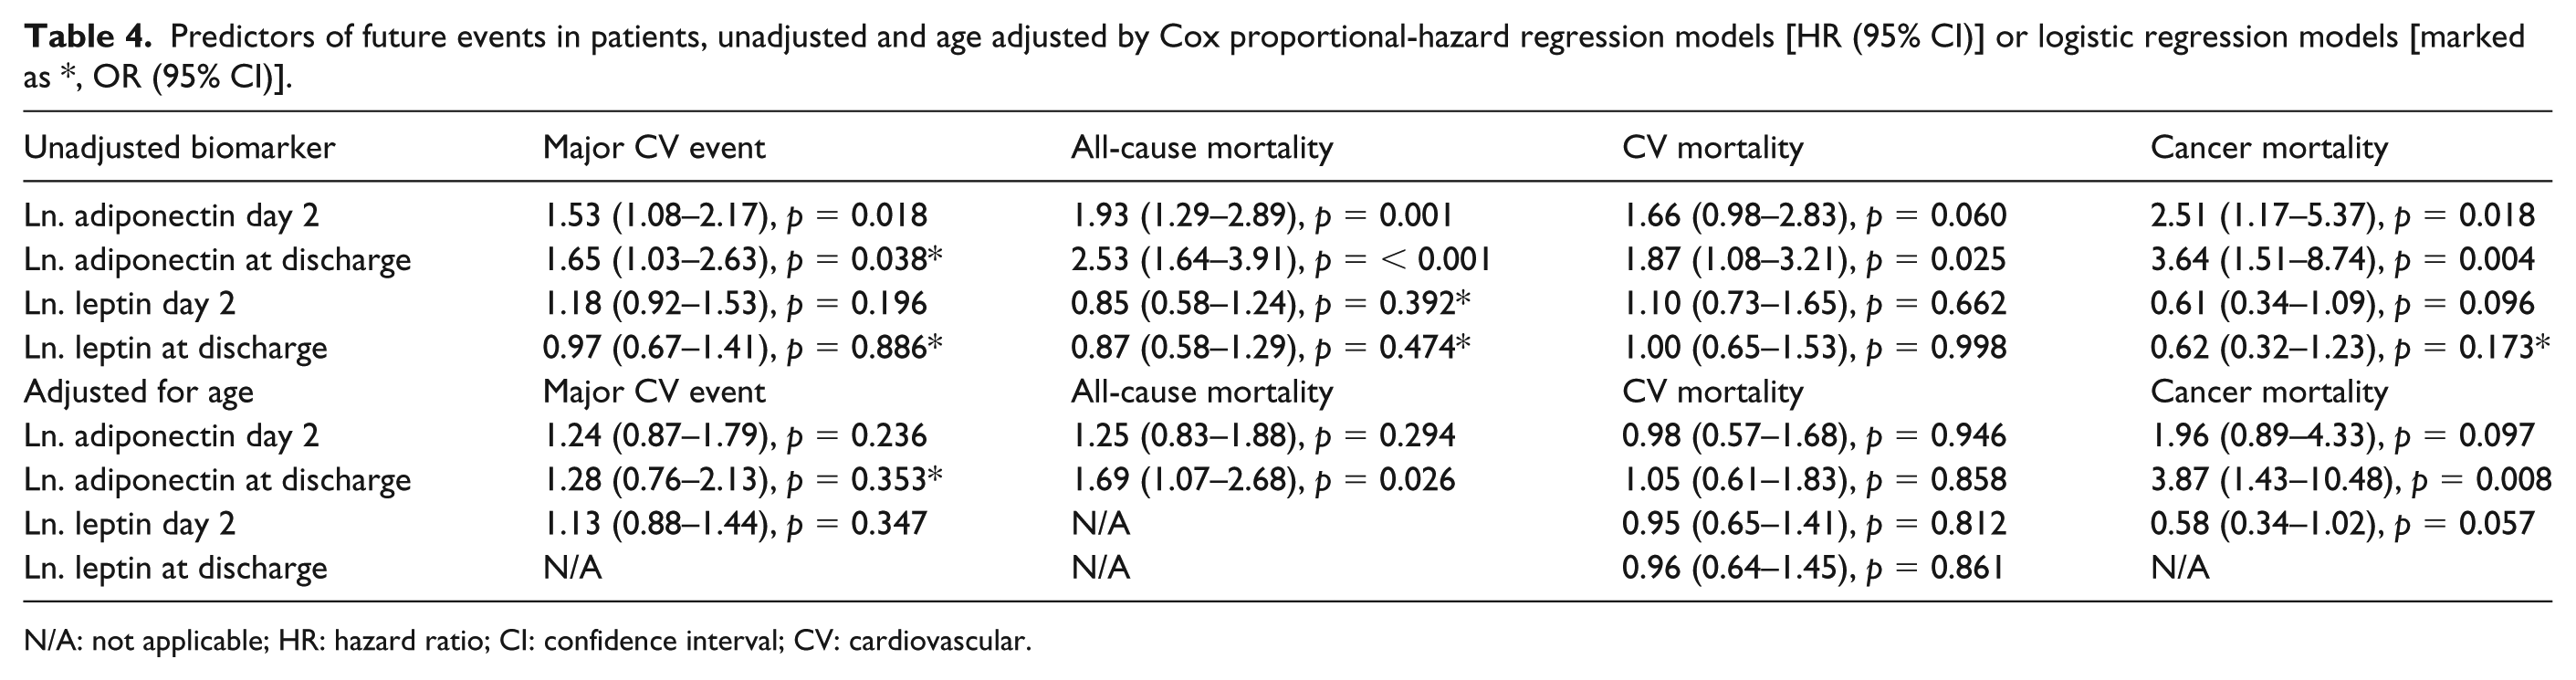
N/A: not applicable; HR: hazard ratio; CI: confidence interval; CV: cardiovascular.
Leptin levels on day 2 or at discharge with or without categorisation by sex-specific medians did not predict total mortality or any major CV events during the total follow-up period. However, leptin levels above median on day 2 predicted major CV events for the first 7 years following the index AMI (the unadjusted HR, 95% CI by year; year 1: 1.70; 1.10–2.63, year 2: 1.70; 1.15–2.53, year 3: 1.55; 1.06–2.28, year 4: 1.57; 1.09–2.26, year 5: 1.52; 1.07–2.15, year 6: 1.48; 1.05–2.07, and year 7: 1.39; 1.01–1.91), as illustrated by the converging Kaplan–Meier curves (Figure 3(a) and (b)).
Discussion
There are two major findings in the present report. First, that high levels of adiponectin is a rather strong independent predictor of long-term mortality after an AMI but not predictive of CV events. Second, the leptin predicted major CV events but not mortality.
The predictive capacity of adiponectin remained following adjustments for age, sex, previous MI, previous CHF and BMI. Moreover, the risk associated with high adiponectin tended to increase with time, as illustrated by the separating Kaplan–Meier curves. In the context of an AMI, adiponectin measured at the time for hospital discharge appears to identify people with a high risk of mortality that is not explained by traditional and CV risk factors such as age and obesity. It can instead be seen as an expression of more severe comorbidities as patients with high adiponectin at discharge were older, had more often a history of heart failure, a lower HOMA index and a lower BMI. In patients with already established CV disease, there are several reports demonstrating that elevated levels of adiponectin are related to increased CV death and total mortality 15 but few studies had follow-up periods exceeding 3 years. In this cohort with over 10 years of follow-up, high levels of adiponectin at discharge (about 8.6–14.4 mg/L in men and about 16.3–21.7 mg/L in women) were associated with an increased risk of mortality following an AMI. Normal values for adiponectin in plasma range from 1.9 to 17.0 mg/L in lean, healthy individuals 20 and increase with age and female sex, with mean levels of 7.4 mg/L [standard deviation (SD): 3.6 mg/L] in men and 10.8 mg/L (SD: 4.7 mg/L) in women. 4 In patients followed for 1-year mortality after elective cardiac surgery, the highest quartile (11.7 mg/L, not divided by gender) versus the lowest of adiponectin predicted mortality with an OR of 2.9 and combined CV events with an OR of 1.7, while insulin resistance did not. 21 The predictive value of adiponectin was equal to that of the European System for Cardiac Operative Risk Evaluation (EuroSCORE; a calculated score for outcome after cardiac surgery by preoperative risk factors). 21 In accordance with our report of a predictive value of adiponectin at the time of hospital discharge but not admission, there was no relationship to in-hospital events or short-term mortality, but to events 30 days thereafter. 21 Also in the setting of CHF, high levels of adiponectin have been shown to predict mortality even after adjusting for N-terminal pro b-type natriuretic peptide (NT-proBNP) 22 as well as being associated with a more severe heart failure state [New York Heart Association (NYHA) classes] and cardiac cachexia. 23 The mechanism behind the positive association of adiponectin and mortality is not fully understood and at a first glance seems contradictory as adiponectin has anti-inflammatory and anti-atherogenic properties. However, one could speculate if stressful conditions such as an acute cardiac event further enhance the release of adiponectin as a compensatory mechanism. Accordingly, increased adiponectin levels should in such situations not be regarded as harmful but instead as indicative of a natural defense in a severe situation. Antonopoulos et al. 13 suggested that plasma brain natriuretic peptide (BNP) and cytokines are key determinants of adiponectin by regulating the release of adiponectin from the adipose tissue, depending on the individual’s activated grade of systemic inflammation. In a state of activated low-grade inflammation, as in an ongoing silent atherosclerotic process but without significant CV disease, adiponectin levels may be suppressed, while in patients with advanced CV disease, adiponectin is driven upward by circulating BNP levels. 13 We have no information on NT-proBNP in this cohort, but only 8% of the patients had previous heart failure. Elevated adiponectin levels could also be related to weight loss or a more severe state including cachexia and catabolism. 23 Interestingly, adiponectin has been suggested to induce malnutrition and cachexia as well. 24 There is evidence indicating that weight loss increases adiponectin levels, after gastric by-pass surgery. 25 Furthermore, elevated levels of adiponectin can be the result of a dysfunction or the down-regulation of adiponectin receptors in obesity-induced insulin resistance.26,27 Recent reports have revealed that a low BMI after AMI is associated with a poorer outcome, often referred to as ‘the obesity paradox’. 28 In obesity, adipokines are highly dysregulated, with elevated levels of most adipokines but with reduced levels of adiponectin, especially if adipocytes are enlarged and hypertrophied. 8 As a result, it is reasonable to assume that there is a connection or shared mechanism between the obesity and the adiponectin paradoxes. We recently demonstrated that individuals with glucose abnormalities newly discovered by OGTT at discharge from an AMI run a high CV risk during the following decade, 2 and that leptin is a predictor of CV events during a period of 3 years following an AMI in patients without previously known diabetes. 29 In this long-term follow-up, leptin remained a predictor of major CV events up to 7 years after AMI but did not predict total mortality contrary to the finding on adiponectin. While adiponectin captures patients with a high, long-term mortality risk, it does not necessarily reflect the same risk group as that detected by an OGTT or elevated leptin levels. Plausible contributory causes associated with elevated leptin levels may be acute thrombosis, sympathetic activation and plaque rupture.17,18 In the present cohort with only slightly obese patients but with a high proportion of AGT, it is likely that adipose tissue is redistributed to intra-abdominal locations, as leptin is closely associated with AGT, contributing to the increased risk of CV events. 18
Adiponectin has been described to be related to development of cancer. Several studies report that elevated levels of adiponectin are associated with improved prognosis in patients with cancer while some studies report the opposite.30,31 In the present cohort, age-adjusted high levels of adiponectin at discharge predicted cancer mortality. Further exploration of this association is not possible due to few events. The confounding effect of obesity should be considered, both as related to the incidence of cancer and as a determinant of circulating levels of adiponectin.
The main limitation with this study is the small sample size and number of events. However, the limited number of patients provided an opportunity to obtain careful ascertainment of CV events during an unusually long period with only one patient lost to follow-up. Furthermore, we conducted gender-specific analyses with dichotomisations of leptin and adiponectin into median levels and by quartiles and no significant diversity in the main result was found. However, due to the small sample size, it is not possible to identify any exact cut-off levels for adiponectin and leptin as biomarkers and this should therefore be evaluated in larger studies. The limited number of women in this cohort with few events did not allow us to perform any more in-depth sex analysis.
Conclusion
To conclude, in patients with AMI without manifest diabetes but with a substantial proportion of glucose abnormalities, high levels of adiponectin at discharge constitute an independent predictor of long-term mortality.
Footnotes
Acknowledgements
The authors would like to thank Christina Edman Jönsson, RN, at the Cardiology Unit at Karolinska University Hospital Solna, for valuable assistance in collecting patient records and events by interviewing patients and Eleni Tanoglidi, MD, for collecting events in Västerås. The authors also want to thank Margareta Danielsson at Department of Public Health and Clinical Medicine at Umeå University for performing the laboratory analyses of leptin and adiponectin.
Authors’ contributions
All authors have made substantial contributions to this article. All authors took part in the interpretation of the results. L.R., K.M., Å.T. and A.N developed the study design and collected all the patients. V.R. analysed the death certificates together with A.N. V.R. managed the database and performed the statistical analyses. P.N. provided supervision and support within the frameworks of statistical analyses. S.S. contributed with expert knowledge on adipokines. V.R. and A.N. finalised the article after adjustments by all authors.
Declaration of conflicting interests
The authors have no conflicts of interest to declare in relation to this article. K.B., K.M., L.M., P.N., S.S. and Å.T. report no conflicts.
Funding
This work was supported by the Swedish Heart-Lung Foundation; the Department of Research and Development, Region Kronoberg; Västerås Hospital and the Kamprad Family Foundation. L.R. has received research support from the Swedish Heart-Lung Foundation, Swedish Diabetes Foundation, Karolinska Institute, Stockholm County Council, Swedish Medical Assembly, Private donators, Amgen, Bayer AG, Boehringer-Ingelheim, Merck and Novo Nordisk. He has received honoraria for lectures and expert group meetings from Bayer AG, Boehringer-Ingelheim, MSD and Sanofi. A.N. has received honoraria for expert group participation from Astra Zeneca, MSD and Boehringer-Ingelheim. V.R. has received an honorarium from Astra Zeneca for expert group participation.