
Abstract
Aims:
To determine the prevalence of amputation and revascularisation among diabetics and non-diabetics between 2003 and 2013.
Methods:
Retrospective analysis of English hospital data with census estimates for population aged 50–84 years.
Results:
There were 42,294 major and 52,525 minor amputations and 355,545 revascularisations. Major amputation rates fell by 20% (27.7–22.9), with minor amputations (22.9–35.2) and revascularisations (199.8–245.4) rising. The major amputation rate reduced in diabetics (men, 180.5–111.8; women, 92.8–52.7) faster than non-diabetics (men, 24.6–18.7; women, 11.0–8.9). In total, 48.2% of men and 58.0% of women amputees were not diabetic.
Conclusion:
Diabetics continue to experience six times the rate of amputation than non-diabetics. However, half of major amputees were not diabetic and experienced slower rates of decrease. Non-diabetics, particularly those with peripheral arterial disease, should have access to appropriate services, particularly foot care.
Introduction
Major lower limb amputation, that is, above the ankle, is a devastating consequence of both diabetes and peripheral arterial disease (PAD). PAD affects the lower limbs and has the same underlying pathology as coronary heart disease and classically presents as intermittent claudication but can lead to foot ulcers, gangrene and ultimately amputation.1–3 While diabetes is a major cause of all amputations (major and minor) in England, the vast majority (over 90%) of the 5000 major amputations undertaken in England every year4,5 in people over 50 years are related to PAD.5,6
Our aim was to ascertain the yearly prevalence of lower limb amputation (both major and minor) and revascularisation in England between 2003 and 2013 in those aged 50–84 years and investigate the changing prevalence in the diabetic and non-diabetic population.
Method
We interrogated the Hospital Episode Statistics (HES) database which captures every hospital patient encounter in England with approximately 52 million inpatient and outpatient episodes added each year. 7 Information regarding patient demography, risk factors, diagnosis and intervention is collected. A subset of this main database covering inpatient admissions between 1 April 2003 and 31 March 2013 was created.
From HES, we obtained the number of lower limb amputations (major and minor) and revascularisation (both endovascular and surgical), as defined by the Office of Population, Census and Surveys (OPCS) classification 8 performed in patients aged 50–84 years. All 10 operative field codes were searched. Amputations were defined as major, if they were above the ankle (OPCS code X09) and minor if below (X10,11). We additionally collated procedures on amputation stumps (X12), the majority of which were re-amputation to a higher level. However, this code did include additional procedures such as debridements of stumps. Lower limb revascularisation procedures included both endovascular and surgical procedures from the aorta to distal lower limb vessels (OPCS code L26, L51, L52, L54, L59, L60, L63, L66).
We chose the age group 50–84 as they represent 40% of the entire English population 9 and the vast majority likely to have amputations attributable to PAD. We omitted 2% of the population aged 85 years and over (half of whom are over 90 years) 9 as life expectancy in England is 78 years for a man and 82 years for a woman, 10 and it was felt that a higher proportion in this age group could be performed for palliative reasons, regardless of significance of PAD (e.g. pain control in bedridden patients with mixed ulceration or pressure necrosis).
Prevalence rates, per 100,000, were calculated using HES data as the numerator with the denominator population derived from the Office for National Statistics (ONS) 11 mid-year population estimates. The denominator diabetic population was calculated by applying the age-specific prevalence of diabetes to census estimates from the national Health and Lifestyle survey for England 2003–2012. 12 This is an annual government run survey since 1991 collecting information on physical health, lifestyle behaviours, social care, physical measures, mental health and well-being. 12 The age-specific non-diabetic population was derived by removing the diabetic population from the whole population. The number of major amputees who were diabetic was based on co-morbidities coded in the HES database using the ICD-10 code of diabetes (E10-E14). We applied the same proportions of major amputees with diabetes to those who had minor and amputation stump procedures.
We age standardised the overall rates in England to the 2011 census and additionally standardised the diabetic population to the 2011 European population 13 to facilitate international comparisons using standard techniques. 14 We did not calculate confidence intervals as we used the whole population to calculate prevalence.
Results
Ten-year period prevalence
There were 42,294 major lower limb amputations (22,645 above knee; 19,658 below knee), 52,525 minor amputations and 355,545 revascularisations (endovascular 288,148; surgical 67,397) over the 10-year period. Figure 1(a) and (b) illustrates the yearly age adjusted prevalence of amputation (major and minor) and revascularisation from 2003 to 2013, respectively. The prevalence, per 100,000, of major amputation has reduced by 17% (27.7–22.9), whereas minor amputations have increased by 18% (29.9–35.2). Revascularisations have increased by 23% (199.8–245.4), although surgical revascularisations have risen at three times the rate of endovascular revascularisations (surgery 52% rise, 34.0–51.6; endovascular 18% rise, 165.0–193.9). The overall ratio of endovascular to surgical revascularisation in England has reduced over the last 10 years from 4.7:1 to 3.9:1.
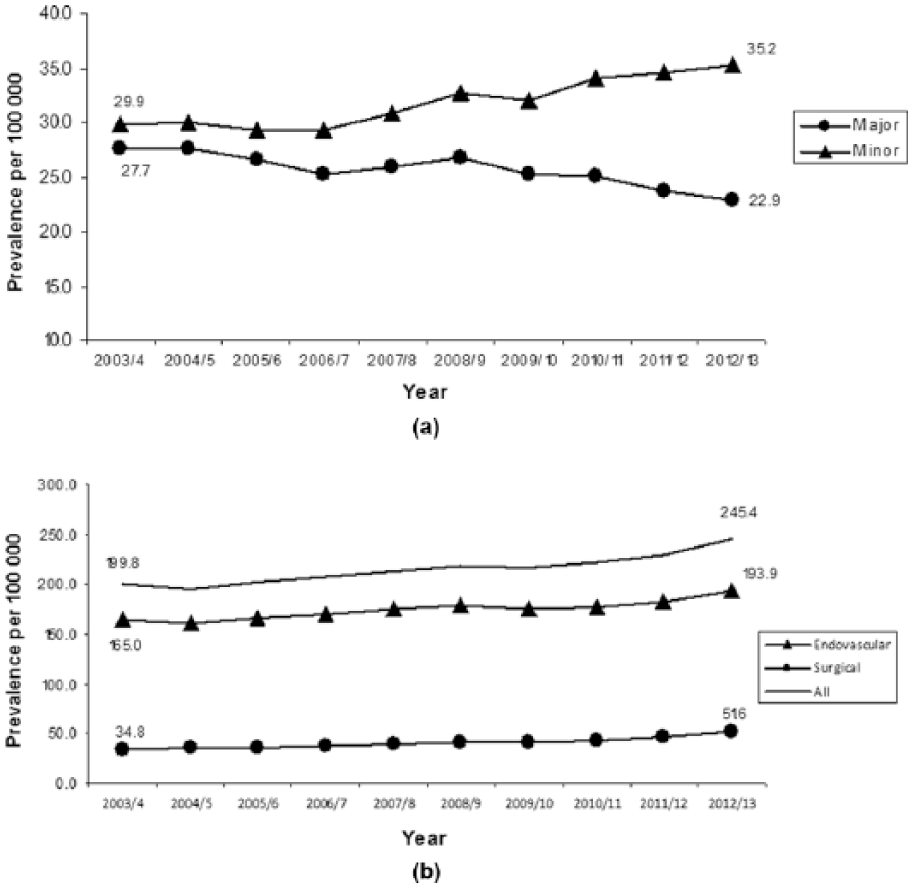
Age-adjusted lower limb: (a) major and minor amputation rates and (b) endovascular and surgical revascularisation rates in men and women: England 2003–2013.
Relationship between diabetes, gender and prevalence of major amputation
Table 1 describes the proportion of diabetics among major amputees and the general population with Table 2 giving the absolute numbers used to derive rates. Age standardised absolute prevalence rates in male and female diabetics in 2003 and 2013 are given in Table 3. Although decreasing over time, major amputation rates remain six times higher in diabetics compared with non-diabetics. Amputation rates in both groups remain approximately double in men compared with women. Approximately half of major amputees are not diabetic with this group experiencing a rate of decrease that is approximately half that of diabetics.
Percentage of major amputees and England population with diabetes.
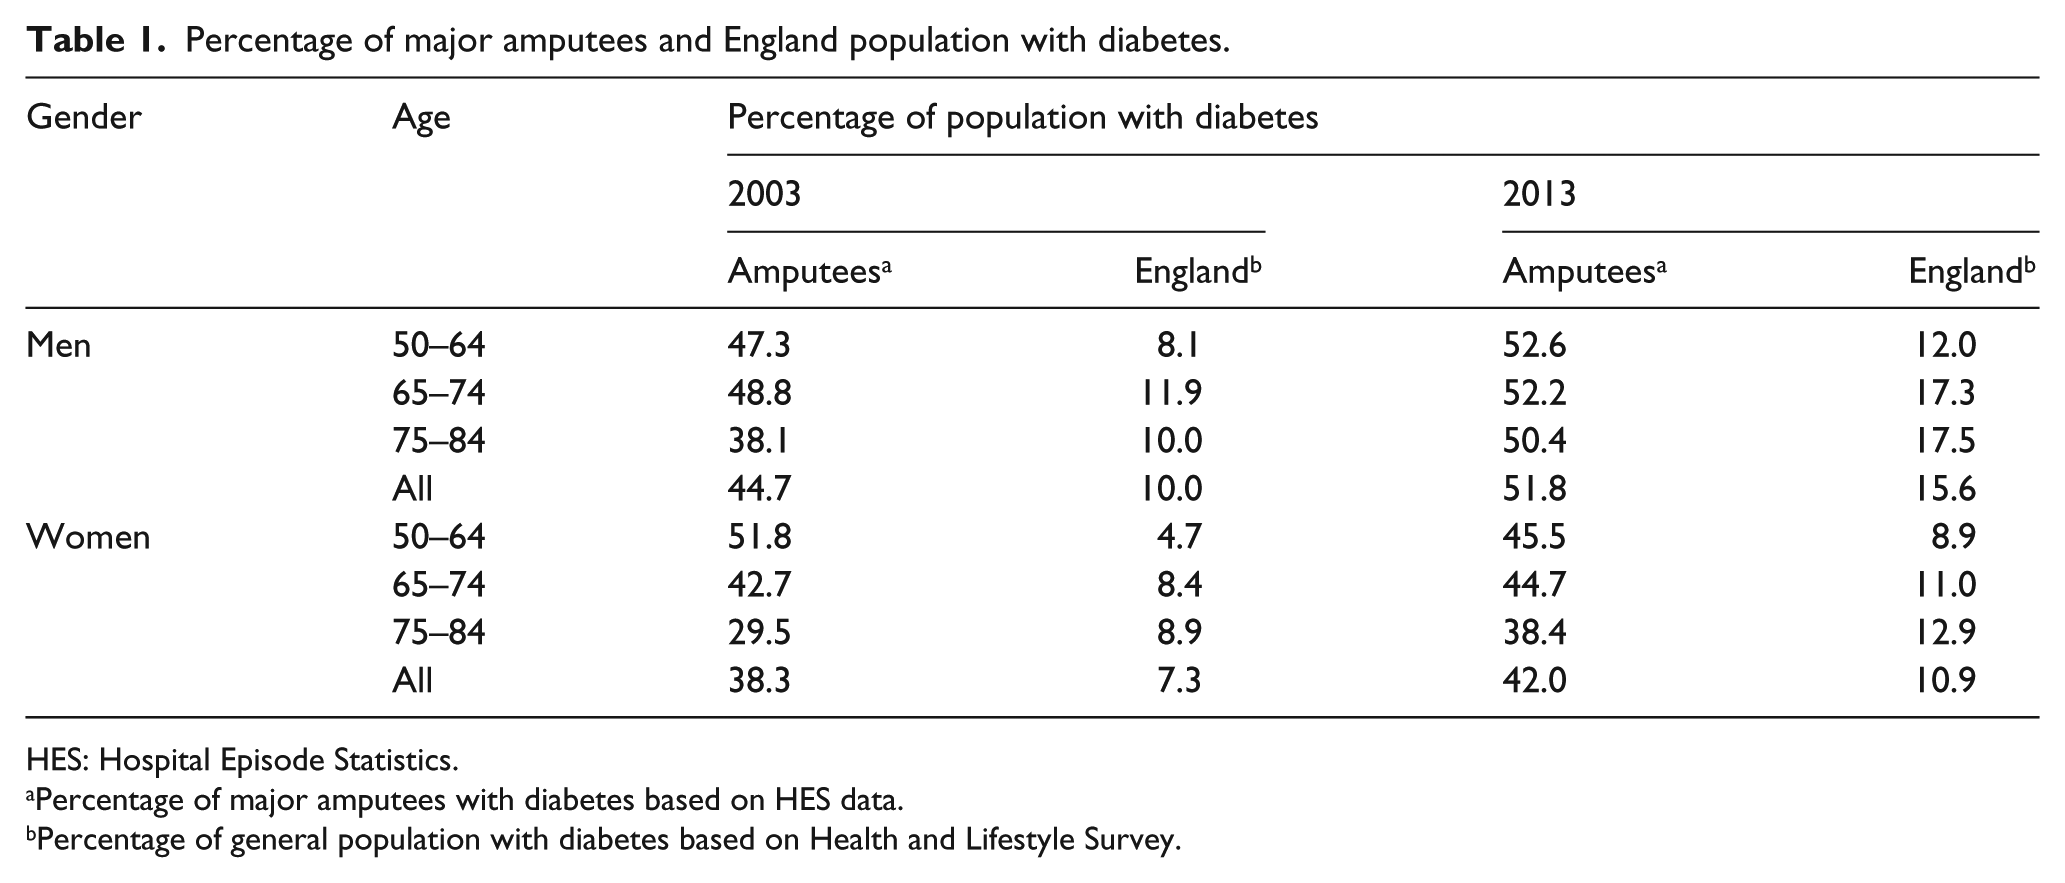
HES: Hospital Episode Statistics.
Percentage of major amputees with diabetes based on HES data.
Percentage of general population with diabetes based on Health and Lifestyle Survey.
Number of procedures and denominator populations used for calculations.
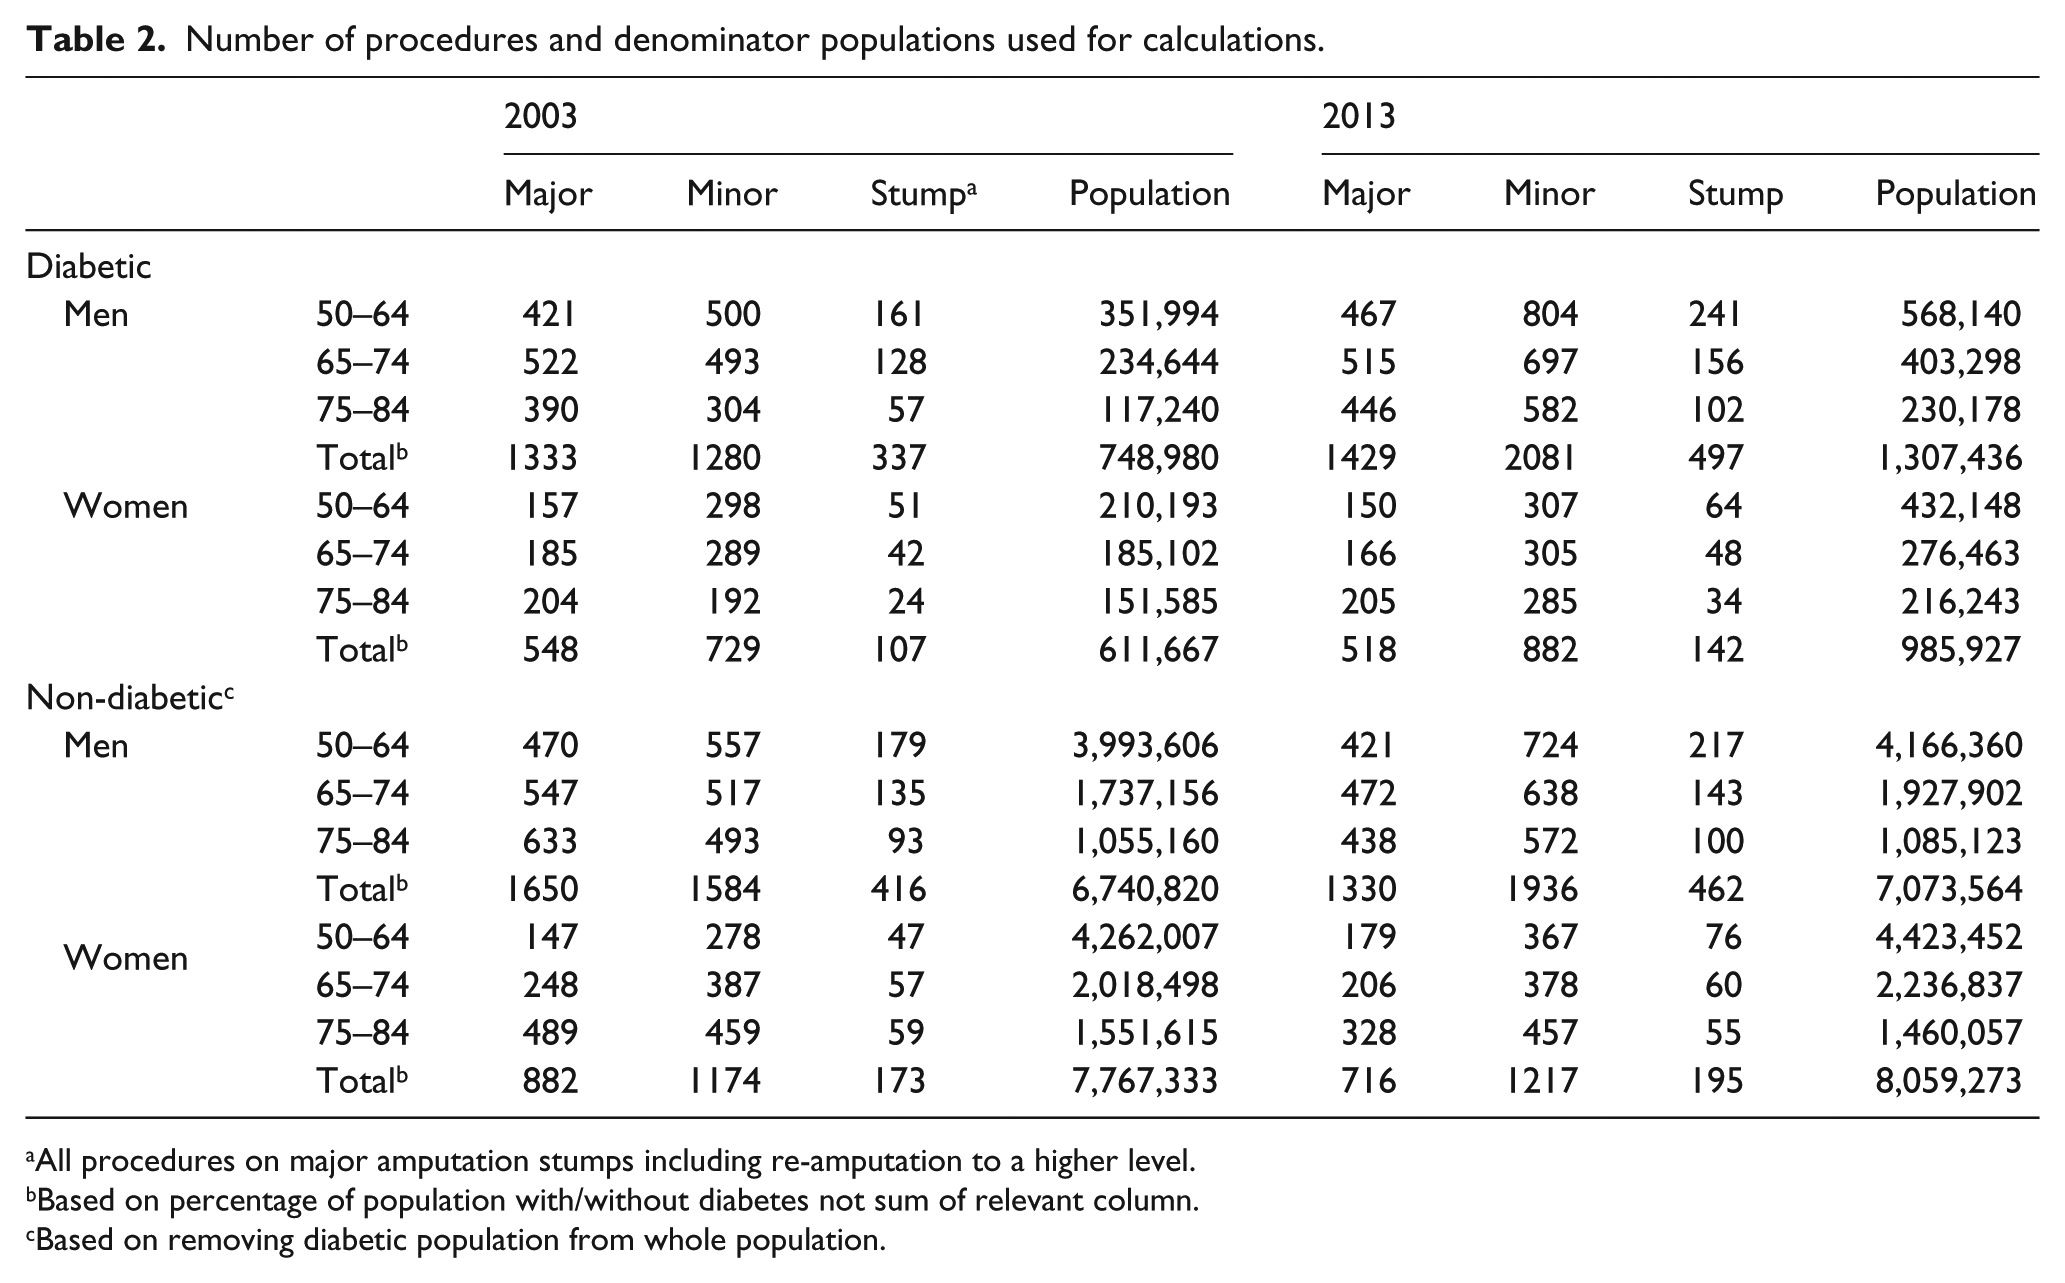
All procedures on major amputation stumps including re-amputation to a higher level.
Based on percentage of population with/without diabetes not sum of relevant column.
Based on removing diabetic population from whole population.
Prevalence, per 100,000, and percentage change of major amputation in the diabetic and non-diabetic population England 2003–2013.
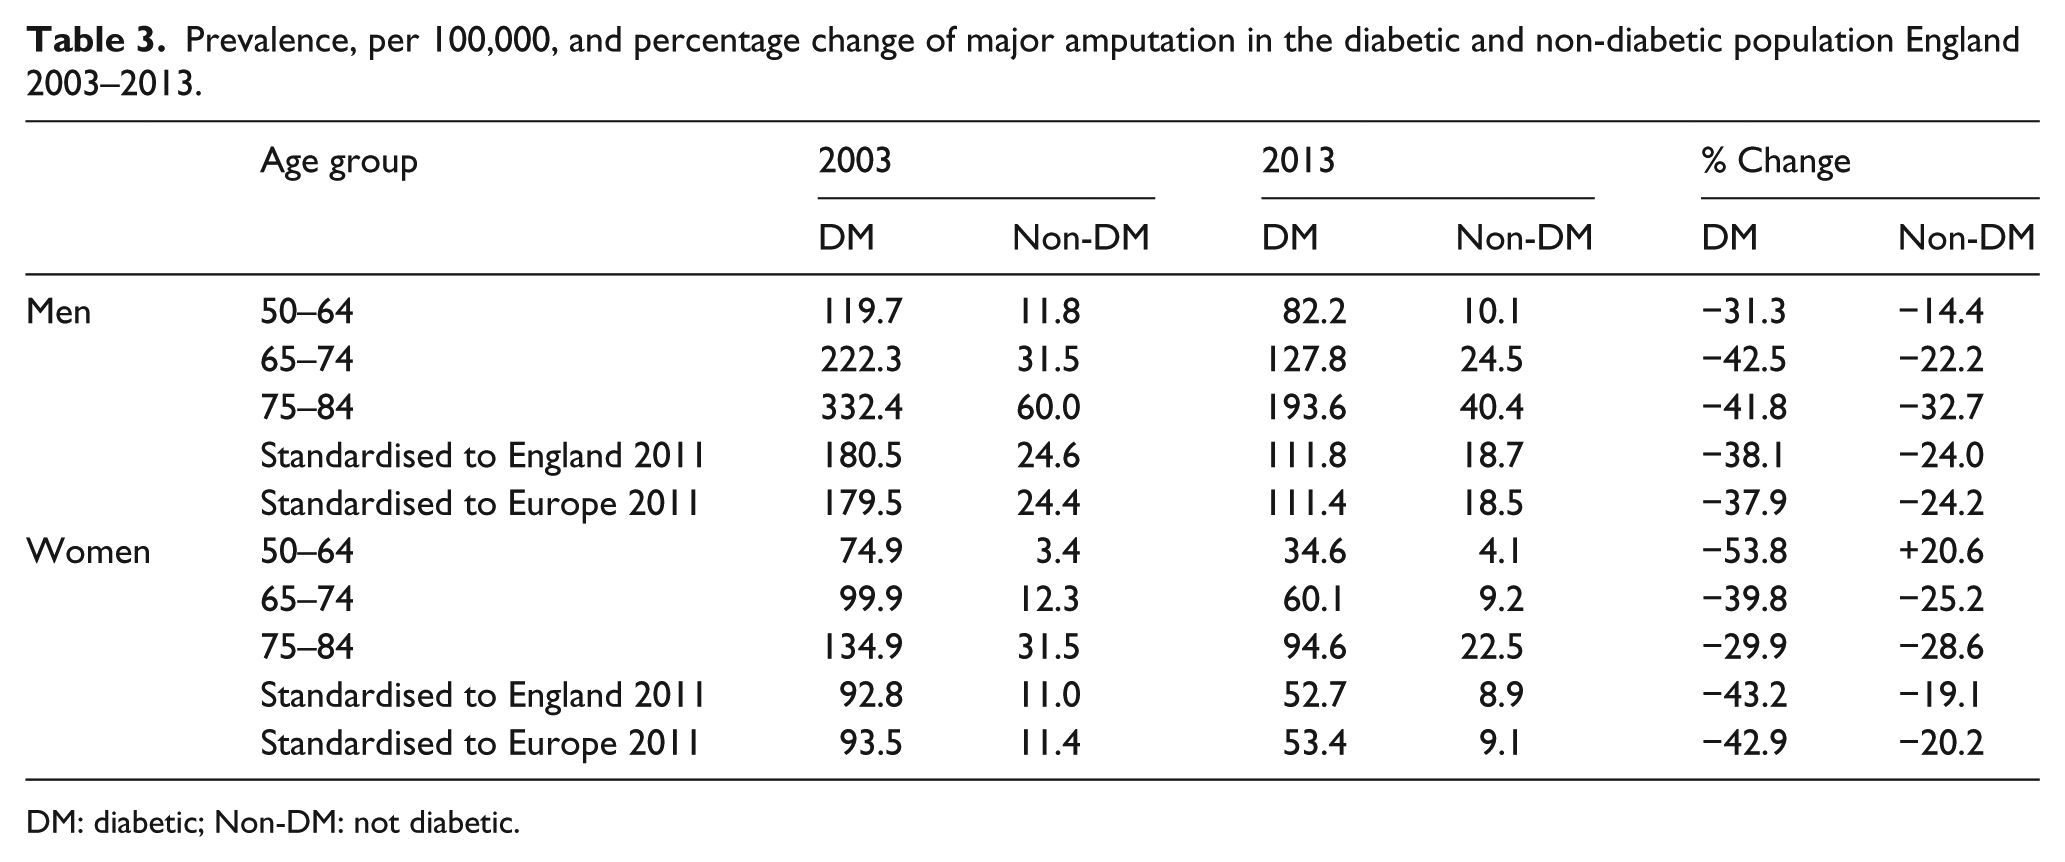
DM: diabetic; Non-DM: not diabetic.
Relationship between diabetes, gender and prevalence of minor amputations
The rise in the overall minor amputation rate (Figure 1) appears to be driven by the non-diabetic male population (Table 4). The rate in the diabetic population is stable in men and decreasing in women. The same pattern is seen for stump procedures (Table 5), that is, a rise in the non-diabetic population with a fall in the diabetic population. In contrast to major and minor amputations, women experienced a greater rise in stump procedures than their male counterparts.
Prevalence, per 100,000, and percentage change of minor amputation in the diabetic and non-diabetic population England 2003–2013.
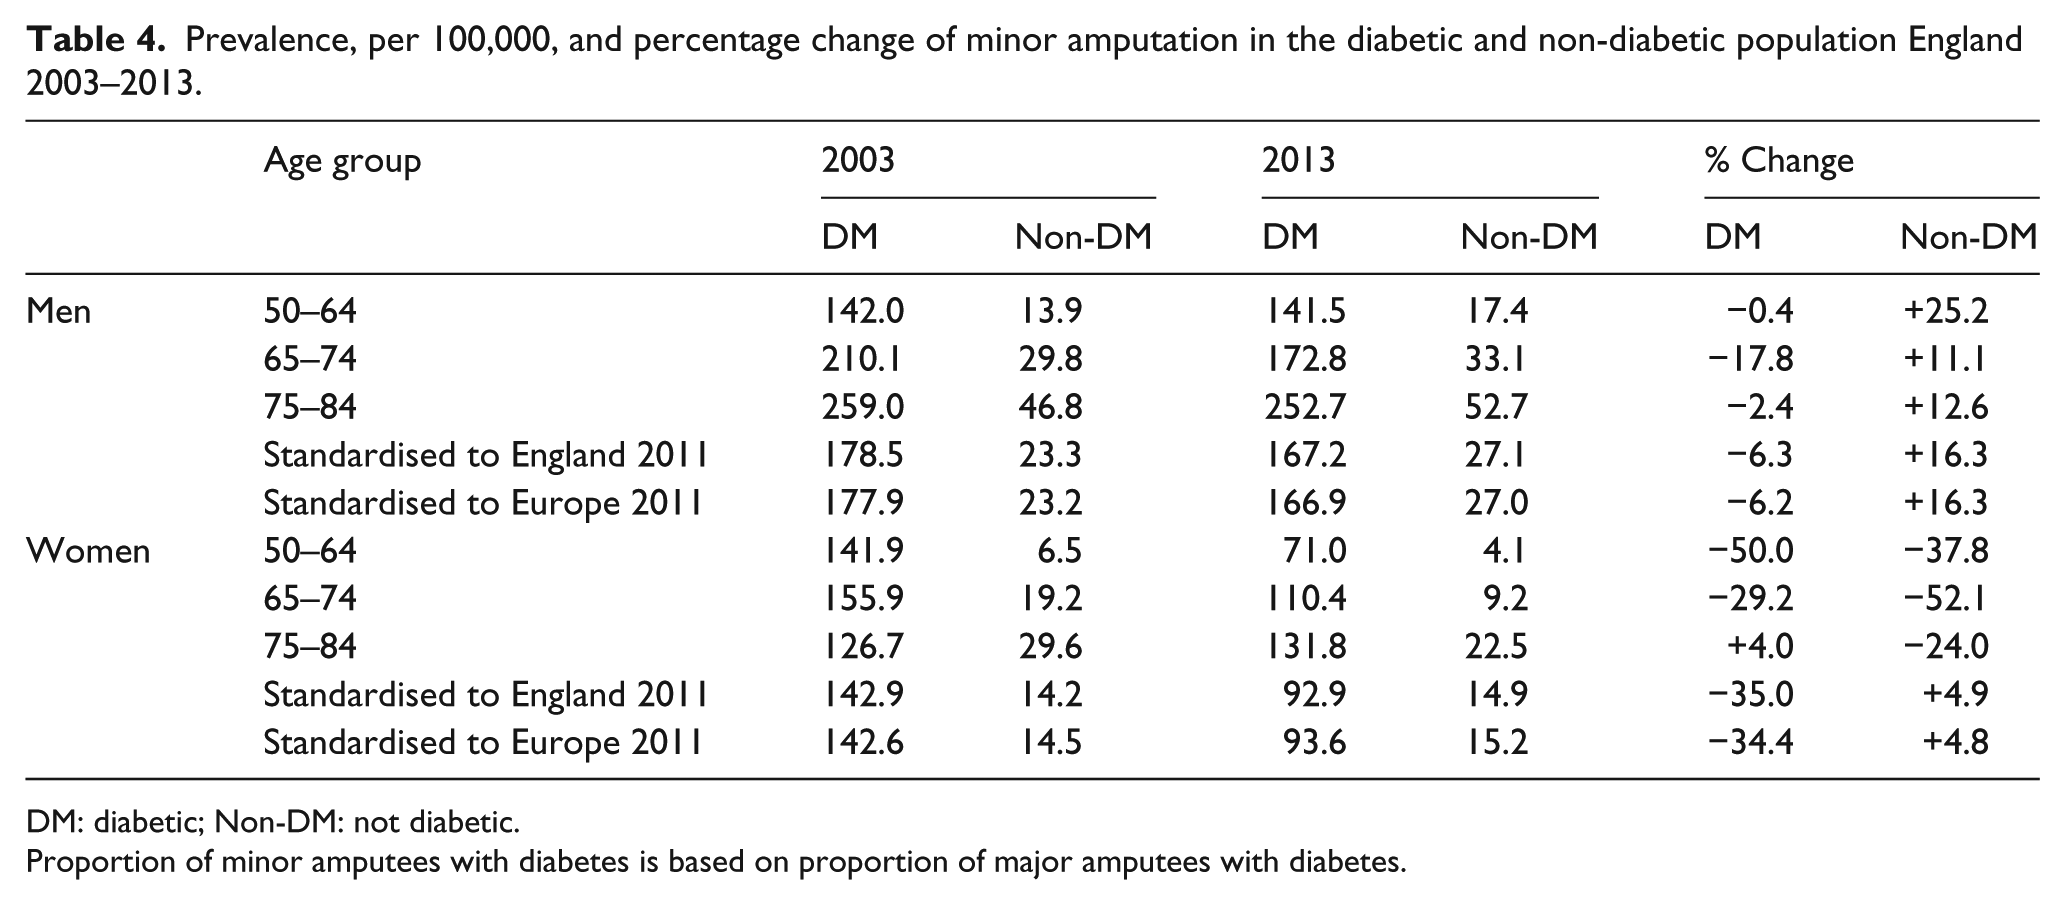
DM: diabetic; Non-DM: not diabetic.
Proportion of minor amputees with diabetes is based on proportion of major amputees with diabetes.
Prevalence, per 100,000, and percentage change of procedures on major amputation stumps (including re-amputation to a higher level) in the diabetic and non-diabetic population England 2003–2013.
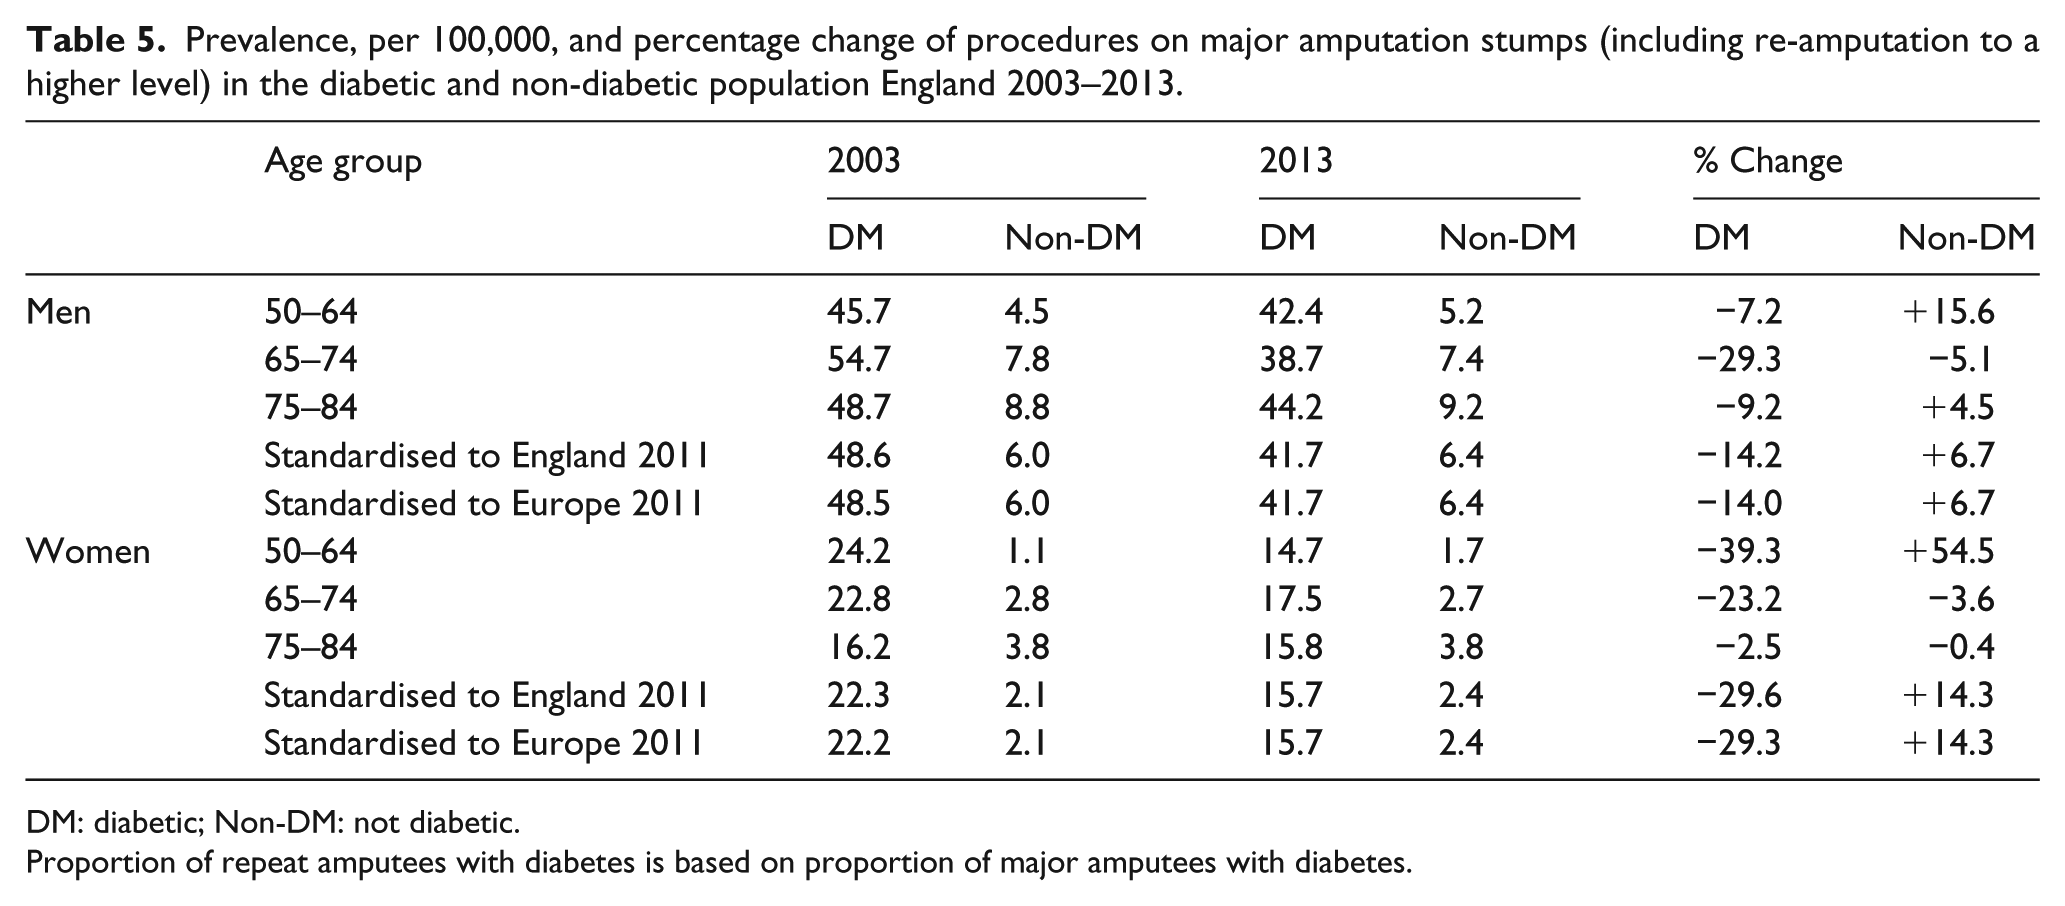
DM: diabetic; Non-DM: not diabetic.
Proportion of repeat amputees with diabetes is based on proportion of major amputees with diabetes.
Discussion
Summary
Our 10-year analysis of English hospital data has shown the overall prevalence of major amputation to have decreased by approximately 20% and both minor amputation and revascularisation rates increased by a similar proportion. The rates of major amputation in the diabetic population have reduced by approximately 40% over the last 10 years yet remain six times higher than non-diabetics. However, half of all major amputations undertaken in England were in non-diabetics with this group experiencing a much slower rate of decrease.
Context of study
The reduced rates of major amputation in diabetics despite a rising prevalence of diabetes 12 suggest national campaigns such as Putting Feet First and improvements in the processes of diabetes care delivery via the Quality and Outcomes Framework and annual audits of these processes via the National Diabetes Audit are contributing positively to outcomes.15,16 However, as prevalence of major amputation in diabetics remains much higher than non-diabetics, continued vigilance is required especially as around one-fifth of diabetics do not get annual foot checks. 16
Our overall age adjusted rate in England is, however, very different from those studies reporting the prevalence of major amputation in England to be in the region of 5/100,000.5,17,18 Of these studies, only Moxey et al. 5 presented sufficient methodological data to allow comparison. They reported the 5-year period prevalence (2003–2008) of both major and minor amputation using HES and census data across England and its regions but only included those with an admission diagnosis of ‘peripheral vascular disease’ regardless of age. They reported a prevalence rate that was five times lower than this study. We believe the dissimilar rates between our studies can be explained by methodological differences. First, their rates were actually per 10,000 and not per 100,000; second, their denominator was the whole of the United Kingdom (including children) whereas their numerator was only England (age groups studied not given). Finally, they did not present either age- or gender-specific results and did not age standardise their overall result.
What our study adds
The pattern of major amputation in non-diabetics, particularly the slower rate of decrease, was concerning. Furthermore, the increase in the minor amputation rate appears to be driven by male non-diabetics. We believe the prevailing pathology in this group is PAD and as this disease also leads to foot ulcers and amputation, we suggest the diabetic foot model, where access to vigilant foot care services reduces the risk of amputation, be investigated for non-diabetic sufferers of PAD.
Limitations of study
There are, however, several limitations to our study. First is our choice of using the 50–84 years age group to capture PAD amputations. Our strategy excluded cases in those aged 85 years and over but included those relating to cancer and trauma – this is in contrast to Moxey et al. 5 who used PAD in the diagnosis to exclude non-PAD-related amputations. We did not employ this strategy because a recent systematic review found primary diagnosis in HES to be only 83% accurate; 19 furthermore, many of the 5% of major amputations not related to PAD, mainly trauma, 6 are outside those aged 50–84 years. Finally, the excluded population over 84 years comprise approximately 350,000 people, of whom half are over 90 years. 11 Despite, the different strategies, our numerator over a comparable period was approximately 13% lower than that of Moxey et al. 5 We therefore do not believe these limitations affected our conclusions and only minimally affected our age-specific rates. The use of the Health and Lifestyle Survey to determine the diabetic population has been employed before 17 although general practitioner returns data, 18 primary care trust quality and outcomes framework (PCT-QoF) data, 20 census data removing an appropriate diabetic populations21,22 and validated diabetic registers used in regional Scottish prevalence studies23–25 can be used instead. Third, we did not look specifically at primary versus conversion amputations, that is, below knee to above knee as the code we used, that is, X12 also included other procedures on stumps, for example, debridements. Our experience is that these procedures are badly coded, that is, conversion to above knee amputation is generally coded as ‘above knee amputation’ and thus is likely to be an under-estimate. Our data are therefore reliant on accurate hospital coding. The sensitivity of HES comorbidity coding especially diabetes has not been published; a small scale validation study of our own (in press) has shown sensitivity of diabetes coding to be approximately 76% with specificity of 98%. While this is true for major amputations, we have not looked at diabetes coding accuracy for minor and repeat amputations. Thus, our calculation of age-specific prevalence of minor and repeat amputation by diabetic status derived by applying major amputation diabetes proportions maybe, again, be an under-estimate.
Conclusion
We have shown the overall major amputation rate in England over the last 10 years to have decreased. Over the same period, minor amputation and revascularisation procedures (particularly surgical) have increased. However, rates of major amputation in diabetics remain six times higher than non-diabetics suggesting continued vigilance is essential. However, half of all major amputees are not diabetic with the rise in minor amputations driven by non-diabetic men. We suggest services for this group, that is, non-diabetics, particularly access to foot services, be evaluated.
Footnotes
Acknowledgements
The authors thank Sacha Wyke at Public Health England for providing access to the data. N.A. generated the hypothesis, set up, analysed and interpreted all data and was lead writer. G.N.T., P.G. and F.T. helped develop the hypothesis, analyse and interpret the data and critically commented on the manuscript.
Declaration of conflicting interests
The author(s) declared no potential conflicts of interest with respect to the research, authorship and/or publication of this article.
Ethical approval
Provided by North Cheshire REC ref: 10/H1017/4.
Funding
The author(s) received no financial support for the research, authorship and/or publication of this article.
Guarantor
N. A. had full access to all the data in the study and takes responsibility for the integrity of the data and accuracy of the data analysis.