
Abstract
Background:
A previous cross-sectional study suggested that tissue plasminogen activator–activity might be an early marker of asymptomatic lower extremity arterial disease, but the long-term relationship is unknown.
Subjects and methods:
This study included 96 diabetic (48 type 1/48 type 2) and 62 non-diabetic subjects aged 30–70 years without previously known lower extremity arterial disease (age: 50.3 ± 9.3 years, gender: M/W 47.5/52.5% and body mass index: 26.6 ± 4.5 kg/m2). The relationships between asymptomatic lower extremity arterial disease and fibrinolytic markers (tissue plasminogen activator–activity, tissue plasminogen activator–mass, plasminogen activator inhibitor-1 activity) at baseline and after 10 years were assessed by logistic regression analysis adjusting for age, hypertension, statin treatment, HbA1c, triglycerides and low-density lipoprotein cholesterol as fixed covariates.
Results:
The tissue plasminogen activator–activity at baseline and at the 10-year follow-up significantly predicted the presence of sign(s) of lower extremity arterial disease (odds ratio = 1.78, 95% confidence interval: 1.02–3.10, p = 0.043 and odds ratio = 1.78, 95% confidence interval: 1.12–2.23, p = 0.014, respectively). In addition, tissue plasminogen activator–mass at the 10-year follow-up was associated with signs of lower extremity arterial disease (odds ratio = 1.07, 95% confidence interval: 1.00–1.15, p = 0.046). Baseline age, hypertension and HbA1c were independently associated with sign(s) of lower extremity arterial disease at 10 years (odds ratio = 1.09, 95% confidence interval: 1.04–1.14, p = < 0.001; odds ratio = 3.68, 95% confidence interval: 1.67–8.12, p = 0.001 and odds ratio = 1.54, 95% confidence interval: 1.21–1.95, p = < 0.001, respectively).
Conclusion:
This long-term study supports previous findings of a significant association between asymptomatic lower extremity arterial disease and tissue plasminogen activator–activity. Thus, tissue plasminogen activator–activity may be an early marker of lower extremity arterial disease although the mechanism of this relationship remains unclear.
Introduction
Lower extremity arterial disease (LEAD) is a manifestation of generalized atherosclerotic disease and is characterized by reduced blood pressure in the lower extremities. 1 The LEAD can be asymptomatic in early stages, but in more advanced disease it causes symptoms such as intermittent claudication, ischaemic rest pain and diminished wound healing capacity. The prevalence of LEAD varies between studies due to differences in classification and the populations studied.2–4 The prevalence of LEAD was 10% in the large population-based Edinburgh Artery Study, in which LEAD was defined as an ankle brachial index (ABI) < 0.9 3 . The prevalence of LEAD increases with age and the disease is more severe in men than in women. 5
Diabetes increases the risk of LEAD and diabetic subjects develop LEAD at an earlier age than non-diabetic (ND) subjects. 6 In diabetic subjects, LEAD is more generalized and extends further into the peripheral vasculature than in age-matched, ND subjects. 7 In diabetic subjects, a foot ulcer may be the first sign of LEAD due to neuropathy and loss of sensation.8–10 The aetiology of atherosclerosis is multifactorial and well-known traditional risk factors are hyperglycaemia (diabetes), smoking and hypertension. Age, the duration of diabetes, obesity and dyslipidaemia also contribute to the risk. 11 In addition to these traditional risk factors, alterations in fibrinolysis and thrombophilic risk factors such as lipoprotein (a), homocysteine and antiphospholipid antibodies may be of importance for the development of atherosclerosis and LEAD.12–14 The aetiology of LEAD may differ between type 1 diabetes (T1D) and type 2 diabetes (T2D) since T1D is characterized by absolute insulin deficiency as compared to T2D where insulin resistance, hyperinsulinaemia and later on also relative insulin deficiency is found. When it comes to development of LEAD hypertension, dyslipidaemia and other cardiovascular risk factors are more common in T2D. As shown in our previous study, there is a marked difference in fibrinolysis between T1D and T2D. T2D was associated with hypofibrinolysis, whereas this is not found for T1D. 15
The fibrinolytic system has been suggested to play a role in the development of T2D. An epidemiological study demonstrated that high levels of tissue plasminogen activator (tPA) may precede the development of T2D. 16 In this study, elevated levels of fibrinolytic variables predicted the manifestation of T2D after adjustments for metabolic and cardiovascular risk factors and a change in fibrinolytic variables could be detected several years before changes in glucose tolerance. 16 Disturbances of the fibrinolytic system have previously been associated with cardiovascular disease (CVD), particularly in diabetic patients17–19 and a previous study has suggested that elevated tPA-mass indicated a higher long-term risk of mortality in patients with coronary heart disease. 20 A cross-sectional study suggested that tPA-activity might be an independent and early risk marker for asymptomatic LEAD in diabetic subjects, but the cause-effect and long-term relationship remain unclear. 15
Here, we present a 10-year prospective longitudinal follow-up study. 15 The primary aim was to assess whether tPA-activity is associated with early signs of LEAD at the 10-year follow-up. However, it is important to assess both tPA-mass and tPA-activity since these variables carry different information and hypofibrinolysis is characterized by high tPA-mass and low tPA-activity.
The secondary aim of this study was to evaluate whether fibrinolytic markers at baseline predict the presence of signs of LEAD 10 years later. This was evaluated in diabetic and ND subjects.
Subjects and methods
Subjects
This is an observational, cross-sectional and prospective longitudinal study. At baseline (years: 1997–2000), 143 diabetic subjects diagnosed according to the World Health Organization (WHO) criteria 21 were included: 74 with T1D, 69 with T2D and 80 ND subjects (M/F: 42/38). The inclusion criteria were 30–70 years of age and no symptoms compatible with LEAD according to a standardized interview and medical records, as previously described in detail. 15 A total of 158 participants completed the 10-year follow-up, 96 diabetic subjects (M/F: 45/51), 48 with T1D and 48 with T2D, and 62 ND subjects (M/F: 30/32). In all, 65 subjects (18 ND and 47 diabetic, 26 T1D and 21 T2D) did not complete the study.
Tobacco use was defined as regular use of tobacco (smoking or snuff) within 3 months prior to the study. Information on antihypertensive medication and the presence of any CVD, that is, ischaemic heart disease, previous myocardial infarction, or stroke, was collected from the participants and later confirmed or retrieved from medical records. Hypertension was defined as having a clinical diagnosis of hypertension in medical records, on-going treatment with antihypertensive medication, or a systolic blood pressure (SBP) or diastolic blood pressure (DBP) above 140 or 90 mmHg, respectively, at baseline or at the 10-year follow-up visit. The study was approved by the Ethics Committee of Umeå University (dnr 97-77 and conducted according to the Declaration of Helsinki. All the participants gave their written informed consent.
Measurements and blood chemistry
Validated screening methods were used to measure arm SBP and DBP, ankle blood pressures (ABPs) and toe blood pressures (TBPs) . 4 At all the locations the mean of two blood pressure readings was calculated. Reduced peripheral blood pressure, that is, sign(s) of LEAD, was defined as a blood pressure below the normal range as previously described.4,15 The normal ranges were the means ±2 standard deviations (SD) in 134 ND subjects without previously known LEAD, as reported in a previous larger study using the same method to assess lower extremity blood pressures. 4 Blood samples were collected at baseline and follow-up visits in the morning after an over-night fast (10 h). Markers of fibrinolysis were analysed from stored frozen samples. Venous blood samples for haemostatic assays were drawn without the use of a tourniquet and stored frozen at −80°C until analysis. All samples were analysed at the same time at baseline and at follow-up using the same assays. Analyses of serum triglycerides (TG) and cholesterol were performed by routine methods at the Department of Clinical Chemistry, University Hospital of Umeå. There were no changes in chemical methods/tests over time.
Statistical methods
Data are presented as the means ± SD and as odds ratios (ORs) with 95% confidence intervals (CIs) or as indicated. The Shapiro–Wilk test was used to assess the distribution of data for each subgroup separately and for all participants taken together. Differences in mean values between groups were analysed using the Student’s two-tailed t-test for normally distributed data. For variables not normally distributed, a non-parametric Mann–Whitney U test was used. To assess relationships between measured variables and the presence of signs of LEAD, univariate logistic regression was used. To assess the possible independent effects of markers of fibrinolysis on signs of LEAD, these variables were included one by one in a multivariate logistic regression model with age, hypertension, HbA1c, TGs and low-density lipoprotein (LDL)-cholesterol as fixed covariates and the presence of signs of LEAD as the dependent variable. A p-value <0.05 was considered statistically significant. One control subject developed diabetes during the study. This subject was analysed as a control subject throughout the study (intention to treat). The IBM SPSS Statistics v 22.0 software was used for statistical analysis.
Results
Clinical characteristics
The flow chart of study participants is illustrated in Figure 1. Changes in clinical and biochemical characteristics of all study participants from baseline (Visit 1, years: 1997–2000) to the 10-year follow-up (Visit 6, years: 2007–2010) are displayed in Table 1. Data on all diabetic subjects taken together are shown in Supplementary Table 1. T2D subjects always have numerically higher levels of fibrinolytic markers [plasminogen activator inhibitor (PAI)/t-PA mass]. Over time, PAI-1 activity increased significantly in ND (p = 0.002) and T1D (p = 0.005), but not in T2D, in whom PAI-1 levels decreased significantly (p = 0.006). Also, tPA-mass increased significantly over time in both the ND (p < 0.001) and T1D (p = 0.002) groups but not in the T2D (p = 0.33). No significant change in tPA-activity over time was found in any of the subgroups (ND, p = 0.32; T1D, p = 0.62 and T2D, p = 0.11).
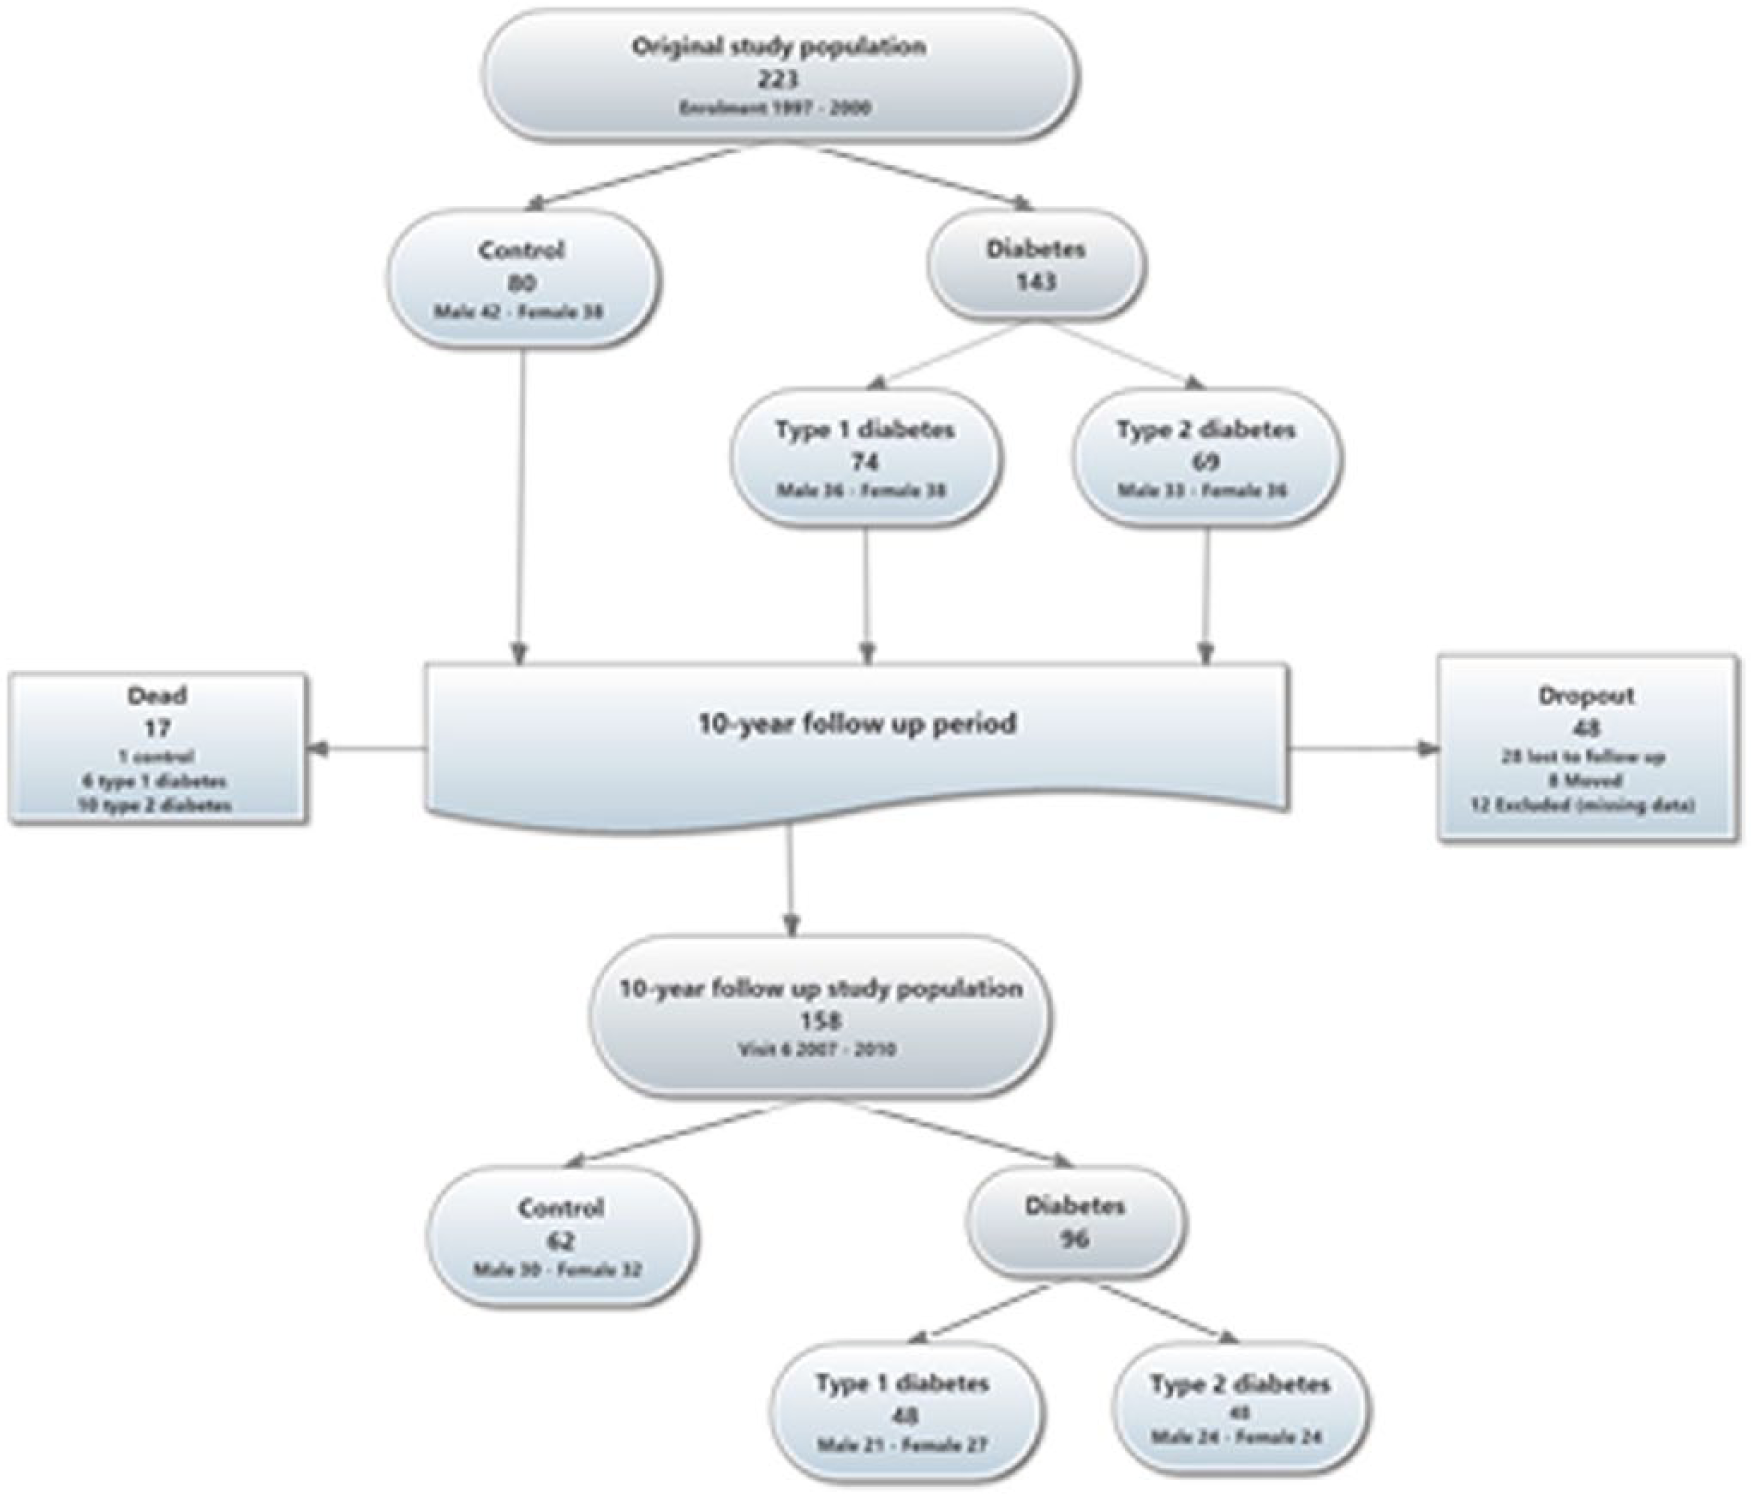
Flow chart of study participants. A total of 158 of the original 223 subjects completed the 10-year follow-up; 65 subjects did not complete the study; 17 died during the study period; 28 were lost to follow-up and 8 moved out of the region.
Clinical and biochemical characteristics, including markers of fibrinolysis, in study participants (n = 158) with and without sign(s) of LEAD at baseline and after 10 years of follow-up.
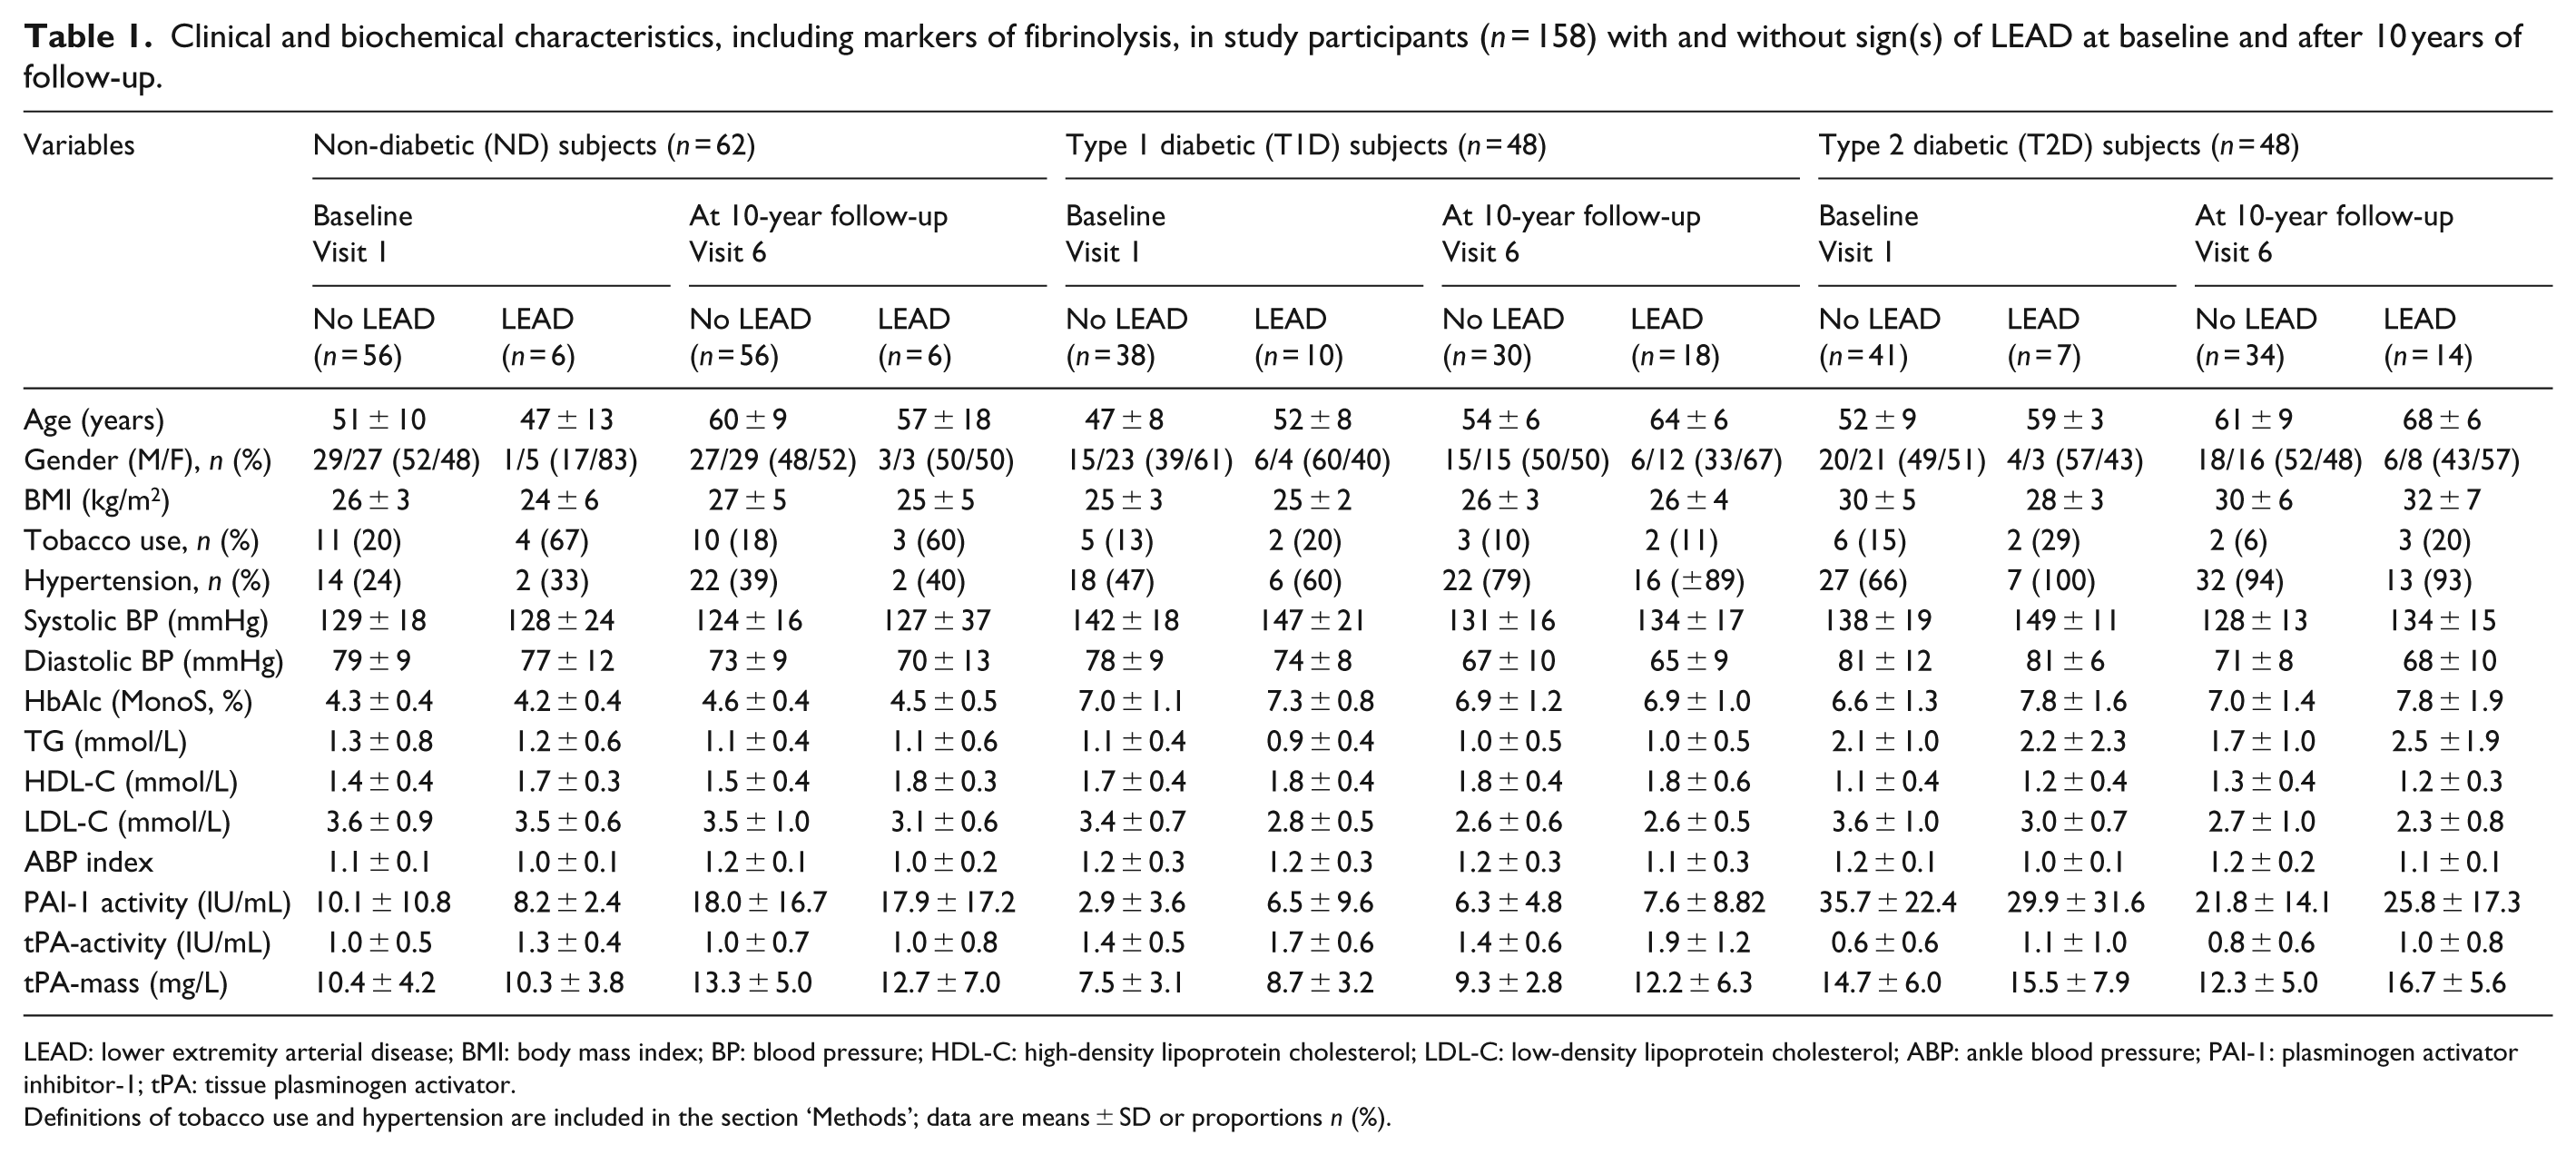
LEAD: lower extremity arterial disease; BMI: body mass index; BP: blood pressure; HDL-C: high-density lipoprotein cholesterol; LDL-C: low-density lipoprotein cholesterol; ABP: ankle blood pressure; PAI-1: plasminogen activator inhibitor-1; tPA: tissue plasminogen activator.
Definitions of tobacco use and hypertension are included in the section ‘Methods’; data are means ± SD or proportions n (%).
Significant changes in medication were also seen over time with a higher proportion of statin treatment in all groups (ND, p = 0.001; T2D, p < 0.001 and T2D, p < 0.001). This significant change in statin treatment may also partly explain the significant reduction in LDL-C found in all groups during follow-up (Table 1). The proportion of T2D on metformin increased significantly (p < 0.001) and the use of sulphonylurea (SU) decreased significantly (p = 0.001). In T2D subjects, the proportion of subjects that used insulin also increased significantly over time (33% vs 85%, p < 0.001) (not shown). Use of inhibitors of the renin–angiotensin–aldosterone system (RAASi) increased significantly in the ND (p = 0.021) group but no significant change was seen in T1D (p = 0.60) subjects. In T2D, RAASi decreased non-significantly (p = 0.08) over time. These changes in medication over time are displayed in Table 2.
Changes in medication in study participants (n = 158) with and without sign(s) of LEAD at baseline and after 10 years of follow-up.
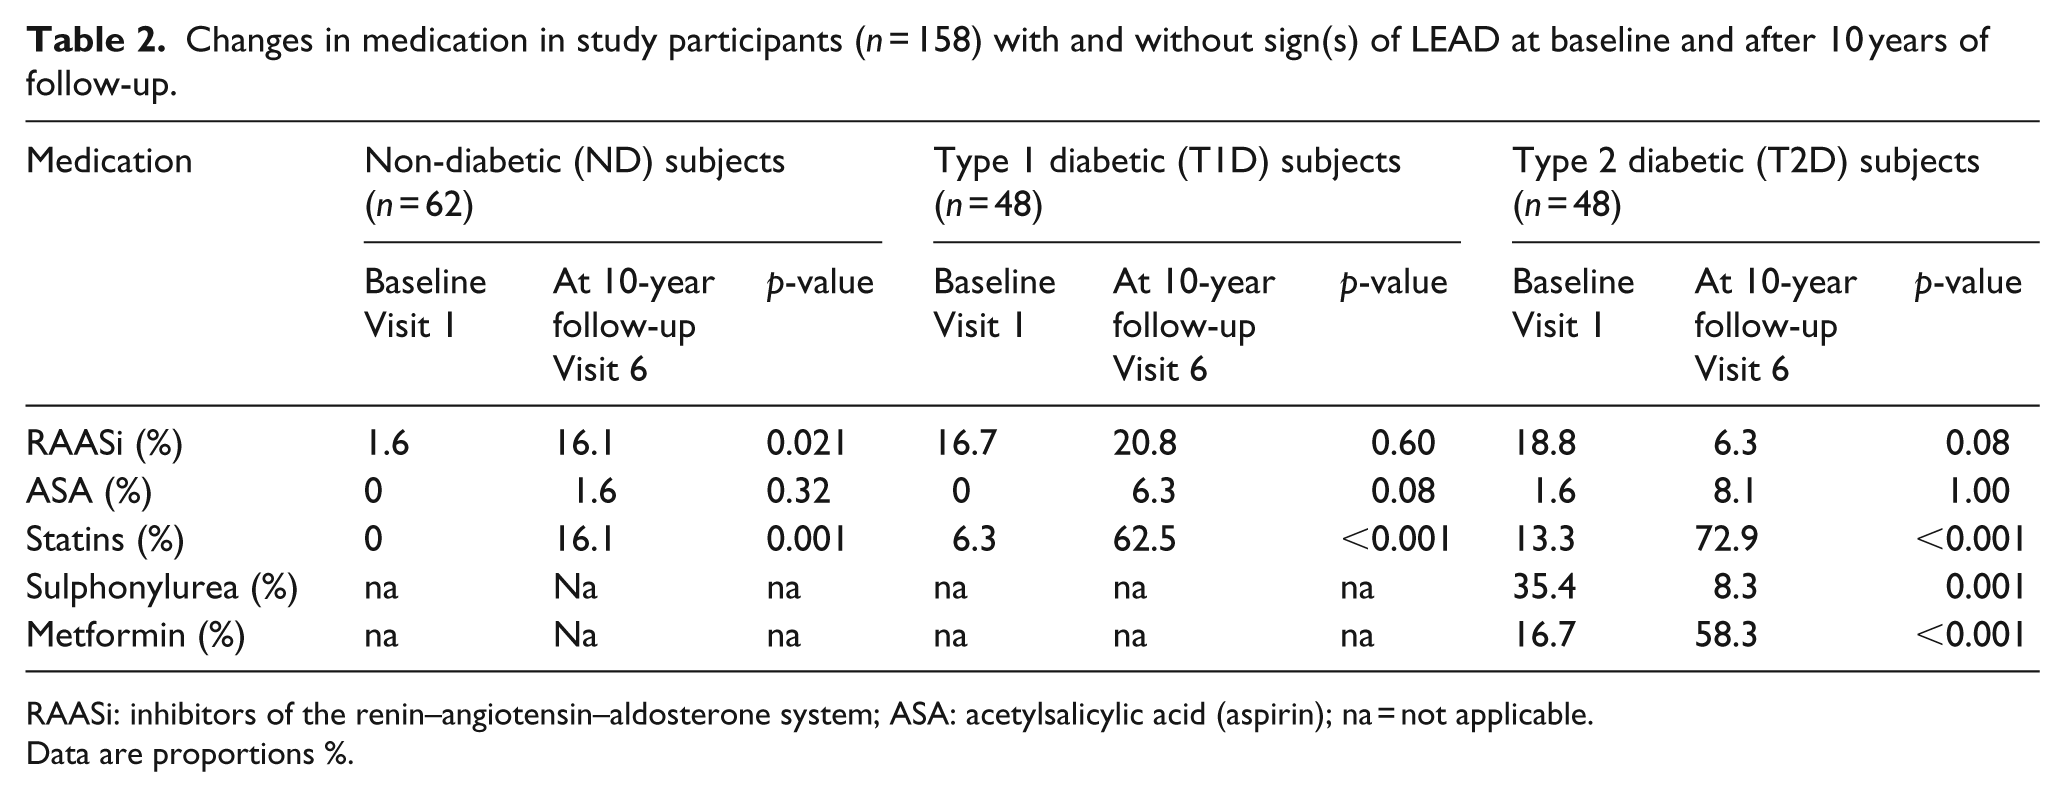
RAASi: inhibitors of the renin–angiotensin–aldosterone system; ASA: acetylsalicylic acid (aspirin); na = not applicable.
Data are proportions %.
Prospective analyses from baseline to 10 years of follow-up
In univariate analyses, baseline age (OR = 1.08, 95% CI: 1.04–1.14, p < 0.001), hypertension (OR = 3.68, 95% CI: 1.67–8.12, p = 0.001), HbA1c (OR = 1.54, 95% CI: 1.21–1.95, p < 0.001) and tPA-activity (OR = 1.78, 95% CI: 1.02–3.10, p = 0.04) were significantly associated with sign(s) of LEAD at 10 years of follow-up in the total study population. Similar associations were found in all diabetic subjects taken together age (OR = 1.14, 95% CI: 1.07–1.23, p < 0.001) and tPA-activity (OR = 1.94, 95% CI: 1.06–3.57, p = 0.032). In the diabetic subgroups, only age at baseline was significantly associated with sign(s) of LEAD at 10 years in T1D (OR = 1.31, 95% CI: 1.12–1.52, p < 0.001) and T2D (OR = 1. 13, 95% CI: 1.92–1.24, p = 0.015). Univariate analyses are shown in Supplementary Tables 2 and 3.
In multivariate analyses, tPA-activity, PAI-1 and tPA-mass were analysed one by one in the model adjusting for age, hypertension and HbA1c. Baseline age, hypertension, HbA1c and tPA-activity (OR = 1.09, 95% CI: 1.03–1.14, p < 0.001; OR = 2.11, 95% CI: 0.89–5.03, p = 0.09; OR = 1.54, 95% CI: 1.20–2.02, p < 0.001 and OR = 1.90, 95% CI: 1.03–3.48, p = 0.039, respectively) were significantly and independently associated with sign(s) of LEAD after 10 years of follow-up in the total study population. In all diabetic subjects taken together and in T1D but not T2D or ND subjects baseline age was significantly associated with sign(s) of LEAD (all diabetic subjects OR = 1.20, 95% CI: 1.10–1.31, p < 0.001; T1D OR = 1.36, 95% CI: 1.14–1.61, p < 0.001; T2D OR = 1.09, 95% CI: 0.98–1.20, p = 0.11 and ND OR = 1.03, 95% CI: 0.94–1.13, p = 0.54, respectively). In all diabetic subjects taken together, but not in T1D or T2D respectively, baseline glycaemic control (HbA1c) was significantly associated with sign(s) of LEAD (OR = 1.63, 95% CI: 1.06–2.52, p = 0.028). Multivariate analyses are shown in Table 3 and Supplementary Table 4.
Multivariate analyses of clinical and biochemical characteristics, including markers of fibrinolysis, in study participants (n = 158) with and without sign(s) of LEAD at baseline with the presence of LEAD at 10 years of follow-up as the dependent variable.
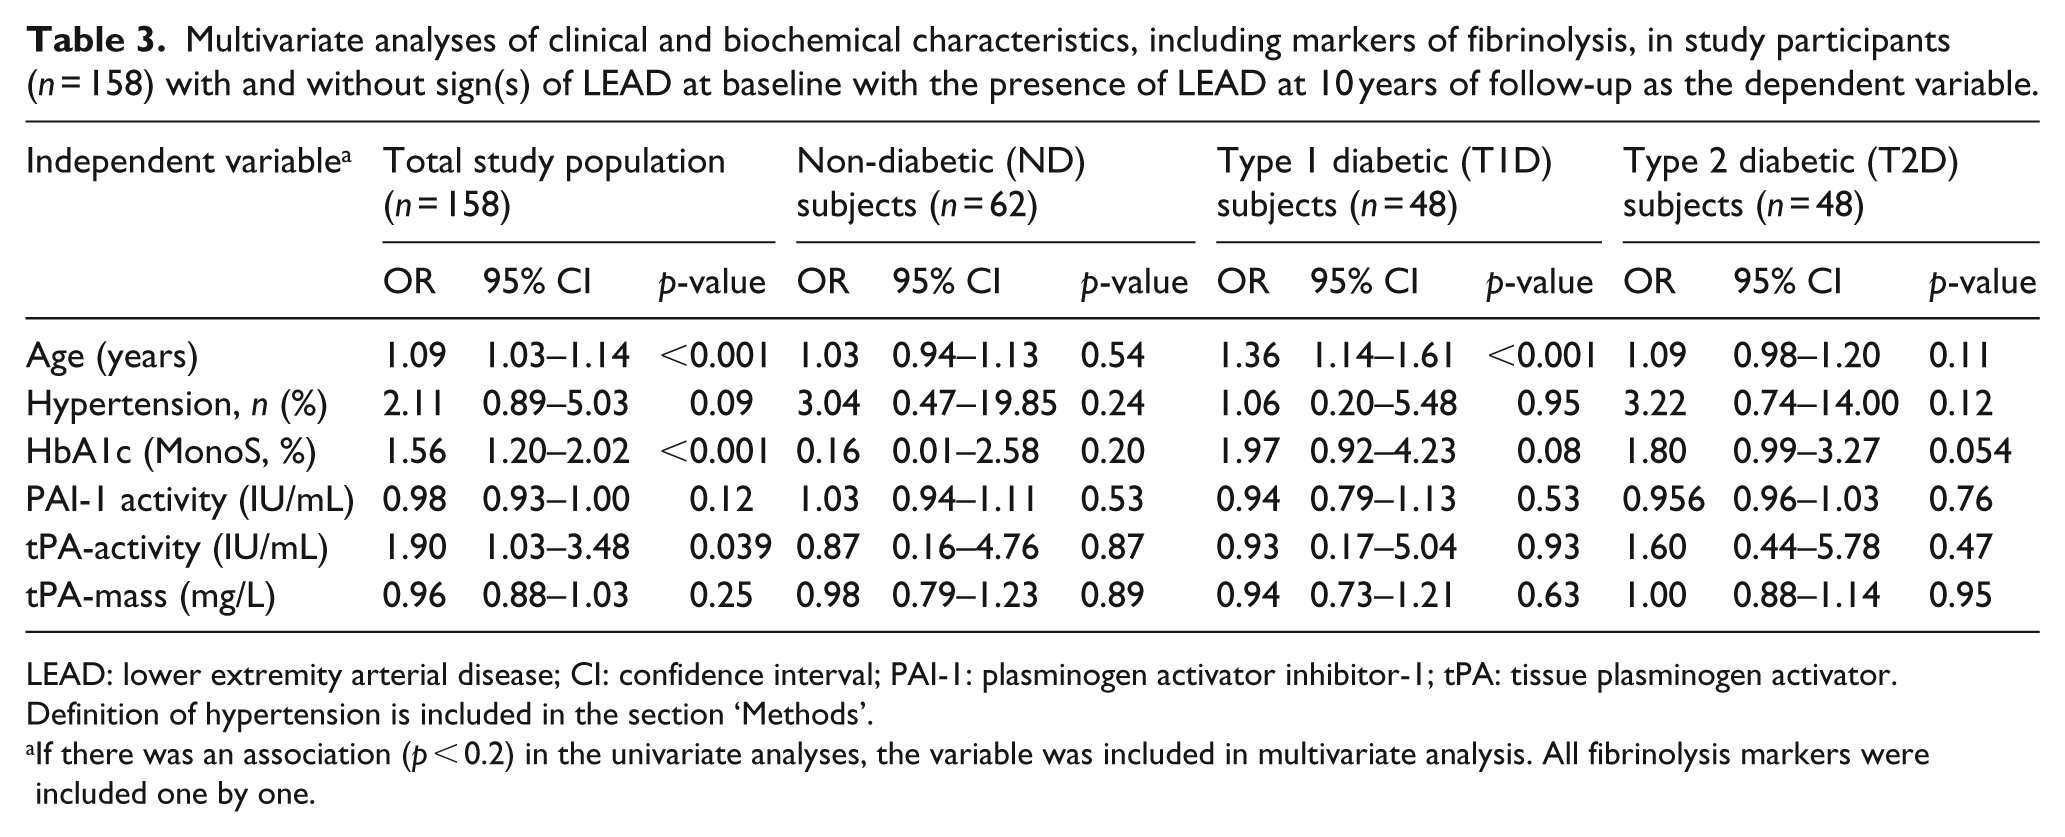
LEAD: lower extremity arterial disease; CI: confidence interval; PAI-1: plasminogen activator inhibitor-1; tPA: tissue plasminogen activator.
Definition of hypertension is included in the section ‘Methods’.
If there was an association (p < 0.2) in the univariate analyses, the variable was included in multivariate analysis. All fibrinolysis markers were included one by one.
Cross-sectional analyses at 10 years of follow-up
In univariate analyses, age (OR = 1.08, 95% CI: 1.04–1.13, p < 0.001), hypertension (OR = 4.67, 95% CI: 1.82–11.98, p < 0.001), HbA1c (OR = 1.45, 95% CI: 1.16–1.82, p < 0.001), TGs (OR = 1.48, 95% CI: 1.01–2.18, p = 0.046), LDL-cholesterol (OR = 0.52, 95% CI: 0.32–0.84, p = 0.008), tPA-activity (OR = 1.78, 95% CI: 1.12–2.83, p = 0.014) and tPA-mass (OR = 1.07, 95% CI: 1.00–1.15, p = 0.046) at 10 years of follow-up were significantly associated with sign(s) of LEAD in the total study population. In all diabetic subjects taken together (age OR = 1.14, 95% CI: 1.07–1.22, p < 0.001), hypertension (OR = 3.78, 95% CI: 1.02–13.99, p = 0.046), tPA-activity (OR = 1.88, 95% CI: 1.06–3.35, p = 0.032) and tPA-mass (OR = 1.12, 95% CI: 1.03–1.22, p = 0.009) were significantly associated with the presence of sign(s) of LEAD. No significant association was found between glycaemic control (HbA1c) and the presence of sign(s) of LEAD (OR = 1.17, 95% CI: 0.87–1.94, p = 0.16). In subgroup analyses, age was significantly associated with sign(s) of LEAD in T1D and T2D (OR = 1.31, 95% CI: 1.13–1.52, p = 0.001 and OR = 1.11, 95% CI: 1.01–1.21, p = 0.026, respectively). tPA-activity and tPA-mass both had a borderline significant association with sign(s) of LEAD in T1D (OR = 2.56, 95% CI: 0.95–6.91, p = 0.063 and OR = 1.18, 95% CI: 0.99–1.40, p = 0.057, respectively). tPA-mass was significantly associated with sign(s) of LEAD in T2D (OR = 1.16, 95% CI: 1.02–1.33, p = 0.025). Univariate analyses are shown in Supplementary Tables 5 and 6.
In multivariate analysis, tPA-activity, PAI-1 and tPA-mass were analysed one by one, adjusting for age, hypertension, HbA1c, TG and LDL-cholesterol. Age, HbA1c, LDL-cholesterol and tPA-activity (OR = 1.08, 95% CI: 1.03–1.14, p = 0.004; OR = 1.41, 95% CI: 1.03–1.92, p = 0.031; OR = 0.54, 95% CI: 0.30–0.96, p = 0.036 and OR = 1.04. 95% CI: 1.08–3.07, p = 0.025, respectively) were independently associated with sign(s) of LEAD at 10 years of follow-up. In all diabetic subjects taken together age and TGs (OR = 1.18, 95% CI: 1.08–1.30, p < 0.001 and OR = 2.75, 95% CI: 1.06–7.14, p = 0.04, respectively) were independently associated with sign(s) of LEAD at 10 years of follow-up. In the subgroups, age was independently associated with sign(s) of LEAD in T1D and T2D (OR = 1.40, 95% CI: 1.13–1.71, p = 0.002 and OR = 1.33, 95% CI: 1.08–1.64, p = 0.007, respectively). In T2D, TG and LDL-cholesterol were also independently associated with the presence of sign(s) of LEAD (OR = 11.3, 95% CI: 1.50–84.83, p = 0.018 and OR = 0.16, 95% CI: 0.03–0.81, p = 0.027, respectively). In T2D, the glycaemic control (HbA1c) showed a borderline significant association with the presence of sign(s) of LEAD at 10 years of follow-up (OR = 2.73, 95% CI: 0.99–7.54, p = 0.053, respectively). The multivariate analyses are shown in Table 4 and Supplementary Table 7.
Multivariate analyses of clinical and biochemical characteristics, including markers of fibrinolysis, in study participants (n = 158) with and without sign(s) of LEAD at the 10 year follow-up with the presence of LEAD at 10 years of follow-up as the dependent variable.
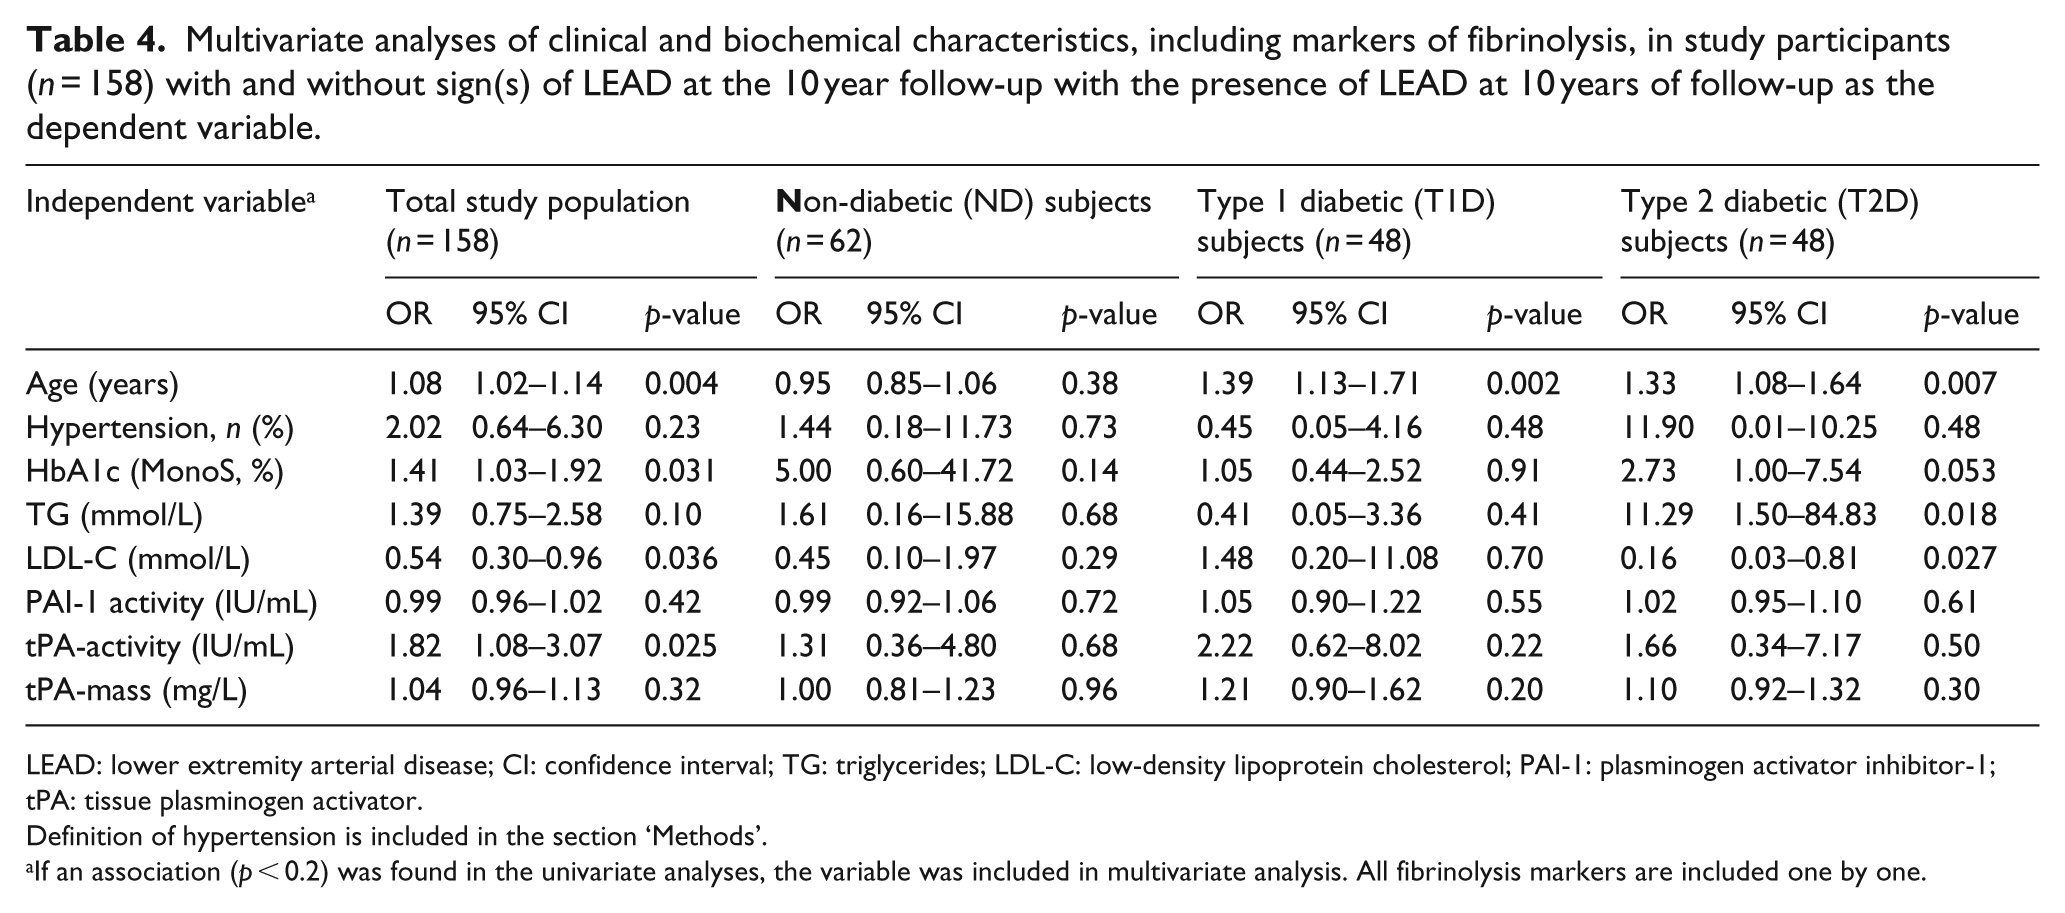
LEAD: lower extremity arterial disease; CI: confidence interval; TG: triglycerides; LDL-C: low-density lipoprotein cholesterol; PAI-1: plasminogen activator inhibitor-1; tPA: tissue plasminogen activator.
Definition of hypertension is included in the section ‘Methods’.
If an association (p < 0.2) was found in the univariate analyses, the variable was included in multivariate analysis. All fibrinolysis markers are included one by one.
Discussion
The most interesting finding in this long-term study was that baseline tPA-activity was prospectively associated with the presence of sign(s) of LEAD 10 years later in the total population and in diabetic subjects, indicating that tPA-activity may predict the development of LEAD. We also confirmed a cross-sectional association between tPA-activity and sign(s) of LEAD. In addition, we found a cross-sectional association between tPA-mass and sign(s) of LEAD. The cause-relationship between tPA-activity and sign(s) of impaired peripheral circulation or LEAD is still not fully evaluated.
So does alterations of the fibrinolytic system precede development of diabetes and signs of LEAD or are the changes in tPA-activity and tPA-mass merely consequences and markers of a disturbed peripheral circulation?
It has previously been shown that disturbances of the fibrinolytic system are present early in metabolic syndrome and diabetes, 22 and that hypofibrinolysis may predict development of the diseases. 23 However, in this study, an increased level of tPA-activity was associated with signs of LEAD both at baseline and at the 10-year follow-up, thus, this could be a compensatory mechanism to maintain peripheral circulation by preventing blood clot formation. This is of course a hypothesis and a speculation. In our study, we show that diabetic subjects patients with signs of LEAD have numerically higher values for both tPA-mass and tPA-activity when measured in the circulation. It could be hypothesized that tPA may increase due to the underlying deterioration of endothelial function and that both tPA-mass and activity increases as a consequence. Interestingly, in our previous study, we actually found lower levels of tPA-activity but significantly higher tPA-mass among T2D than the other groups. 15 These relationships are complex and have to be further evaluated. The synthesis of tPA requires a relatively intact endothelium,24,25 indicating that this postulated compensatory mechanism should be active early on in atherosclerotic disease. The findings at 10 years in this study are consistent with the previous baseline findings in the same population 15 and support that tPA-activity is associated with the presence of sign(s) of LEAD. However, it is still unclear if tPA-mass is only a risk marker or a true risk factor for CVD. The relationship found between tPA-mass and signs of LEAD in this study should be further evaluated.
Epidemiological studies have demonstrated that plasma PAI-1 is elevated in patients with T2D and metabolic syndrome. 22 This increase in PAI-1 may contribute to the increased risk for thrombotic events found in these patients.12,26 Our study showed an increase in PAI-1 levels in ND and T1D subjects, but not in those with T2D, over time. In contrast, the PAI-1 levels decreased during the 10-year follow-up period in T2D subjects. The significance of the decrease in PAI-1 levels in T2D is unclear. A previous study suggested that an increase in tPA-activity could be a compensatory mechanism to protect against the otherwise prothrombotic state in subjects with T2D. 27 In our study, the significant changes in statin and metformin treatment over time may have contributed since these medications may alter fibrinolytic markers.28,29
The strength of our study is the long 10-year observation time. To our knowledge, there are no other long-term studies on changes in fibrinolytic factors in diabetic and ND subjects assessing the signs and symptoms of peripheral vascular disease. In addition, the consistent methodology during the study adds reliability to our results. The associations between more traditional risk factors for CVD such as age, hypertension, HbA1c, LDL-cholesterol and sign(s) of LEAD indicate that the study population may be representative of a more generalized population.
There are also limitations of our study. A main concern is that 65 out of 223 (29%) actually did not complete follow-up and drop-outs may led to a selection bias that is difficult to account or adjust for. Diabetic subjects were selected from a hospital outpatient clinic with a possible selection bias towards a more advanced diabetes compared with the population treated and followed in general practice. Our study could not show any significant associations between fibrinolysis factors and the presence or development of sign(s) of LEAD in subgroups. A plausible reason for this is the lack of power due to the relatively small number of subjects in each subgroup. The size of the study population was limited at 10 years of follow-up and may, therefore, restrict the possibility to detect significant associations. The observed associations of fibrinolytic parameters with LEAD in the total study population may be biased due to the merge of data from ND as well as T2D subjects. The definitions of LEAD and reduced peripheral circulation are somewhat arbitrary and based on a healthy normal population, but this should not have influenced our 10-year results since the definitions and diagnostic measures were exactly the same as at baseline. Potential confounders affecting the results are temporal changes in medications, such as a larger proportion of subjects receiving treatment with statins, metformin and acetylsalicylic acid (aspirin) at the 10-year follow-up compared with baseline. Use of metformin increased substantially after The UK Prospective Diabetes Study (UKPDS) was presented and metformin treatment has been shown to decrease PAI-1 levels.29,30 Observed changes in body weight over time can also be a confounder via obesity-driven chronic inflammation and impaired fibrinolysis. 31 Data on other inflammation markers such as C-reactive protein (CRP) were not available at follow-up. Finally, subjects lost to follow-up were younger and possibly also healthier than the subject that completed the 10-year follow-up, also suggesting a selection bias. In studies with very long observation times, the stability of frozen plasma samples could be questioned. However a relatively recent study showed that storing plasma at −80°C for up to 20 years only affects tPA-activity, PAI-1 antigen and the tPA-PAI-1 complex to a quantitatively negligible extent. 32
In conclusion, an interesting finding in this study was that tPA-activity at baseline predicted the development of early LEAD 10 years later. We also confirmed the previously described association between tPA-activity and the presence of sign(s) of LEAD. The findings in this study are hypothesis generating but cannot determine if this is the effect of a cause-relationship between tPA-activity and disturbances of the peripheral circulation. The exact nature of the relationships between tPA-activity and LEAD are still unclear and need to be further evaluated.
Footnotes
Acknowledgements
The authors would like to thank the study nurses, Kristina Öjbrant and Hjördis Andersson, for skilful assistance and for making this study possible.
Author contributions
All authors researched the data. Aslak Rautio performed the statistical analyses. Aslak Rautio and Maria K Svensson drafted the manuscript, and all authors reviewed and contributed to the article. The results presented in this article have not been published previously in whole or part.
Declaration of conflicting interest
The author(s) declared the following potential conflicts of interest with respect to the research, authorship, and/or publication of this article: Maria K Svensson is currently employed by Amgen AB (Sweden).
Funding
The author(s) disclosed receipt of the following financial support for the research, authorship, and/or publication of this article: This study was supported by the Swedish Research Council (Medicine, project 14287), the Torsten and Ragnar Söderberg Foundation, the Swedish Diabetes Association, the Umeå University Medical Faculty Foundations, Eli Lilly Sweden AB, the Northern Sweden County Councils (VisareNorr), as well as the Elsa and Folke Sahlberg, Loo and Hans Osterman, Sigurd and Elsa Golje, and Trygg-Hansa Foundations.
References
Supplementary Material
Please find the following supplemental material available below.
For Open Access articles published under a Creative Commons License, all supplemental material carries the same license as the article it is associated with.
For non-Open Access articles published, all supplemental material carries a non-exclusive license, and permission requests for re-use of supplemental material or any part of supplemental material shall be sent directly to the copyright owner as specified in the copyright notice associated with the article.