
Abstract
Insulin resistance is associated with endothelial dysfunction in type 2 diabetes mellitus, which can lead to impaired vascular reactivities of both systemic and cerebral circulations. Appropriate ‘correction’ of vascular reactivity results for non-endothelium-dependent systemic effects avoids misinterpretation of endothelial function. Therefore, we ‘corrected’ vascular reactivity results and explored the potential correlations between systemic vascular reactivity, cerebrovascular reactivity and insulin resistance. In 34 patients, ‘systemic vascular reactivity’ was assessed by quantifying reactive hyperaemia. Cerebrovascular reactivity was assessed by quantifying changes in cerebral blood flow velocity during hypercapnia. To minimize the influence of non-endothelium-dependent systemic effects on vascular reactivity results, ‘corrected systemic vascular reactivity’ was calculated by normalizing systemic vascular reactivity using the measurements from the contralateral side; and cerebrovascular reactivity results were corrected by calculating percentage and absolute changes in cerebrovascular conductance index (‘percent cerebrovascular conductance index’ and ‘delta cerebrovascular conductance index’, respectively). Insulin resistance was estimated by homeostatic model assessment. Correlation between conventional cerebrovascular reactivity and systemic vascular reactivity was not significant. But correlations between ‘corrected systemic vascular reactivity’ and ‘percent cerebrovascular conductance index’ (r = 0.51; p = 0.002) and ‘corrected systemic vascular reactivity’ and ‘delta cerebrovascular conductance index’ (r = 0.50; p = 0.003) were significant. Among all vascular reactivity parameters, only ‘delta cerebrovascular conductance index’ was significantly correlated with homeostatic model assessment of insulin resistance (r = −0.38; p = 0.029). In conclusion, endothelial function in the systemic and cerebral circulations is moderately correlated, provided that vascular reactivity estimates are corrected for non-endothelium-dependent influences.
Keywords
Introduction
Insulin resistance (IR) and hyperglycaemia in type 2 diabetes mellitus (DM) are associated with endothelial dysfunction in various vascular beds.1,2 Endothelial dysfunction precedes the development of clinically evident vascular complications3,4 and in many vascular beds has been shown to be proportional to the severity of DM or IR.5,6
Endothelial function can be assessed by quantifying the vascular reactivity (VR) of any vascular bed in response to a stimulus. In the systemic circulation, endothelial function can reliably be assessed by quantifying reactive hyperaemia produced after temporary occlusion of the brachial artery.7,8 Numerous reports have demonstrated that endothelial dysfunction in the systemic vascular bed correlates with IR.1,5 In the cerebral circulation, endothelial dysfunction can reliably be assessed by measuring the increase in cerebral blood flow velocity in the middle cerebral artery in response to hypercapnia.6,9 However, very few studies have reported the correlation between endothelial dysfunction in the cerebral circulation and IR. 10
From a methodological point of view, VR in response to an adequate stimulus is considered to largely reflect endothelium-induced changes. In addition, non-endothelium-mediated systemic effects of the stimulus also influence VR, which may lead to false interpretation. Several methods have been advocated for the ‘correction’ of VR results, which may permit a more accurate assessment of endothelium-dependent changes in the vascular bed.11–13
There are very few studies which have explored the association between endothelial function in the systemic and cerebral circulation and those have reported no relationship between them.14–16 However, none of these studies have taken into account the influence of non-endothelium-dependent systemic effects. The present study was designed and conducted to explore potential correlations between conventional or ‘corrected’ VR in the systemic and cerebral circulation and IR in patients with type 2 DM.
Methods
Study population and design
This cross-sectional study was conducted in the Vascular and Autonomic Function Laboratory, Department of Physiology, All India Institute of Medical Sciences, New Delhi, India. The experimental protocol was approved by the Institutional Ethics Committee for research on human subjects. Consecutive male patients 35–60 years of age with clinically apparent type 2 DM, and managed with diet, exercise and/or sulfonylureas, were enrolled from the Department of Endocrinology & Metabolism. Patients were evaluated for comorbidities including hypertension, ischaemic heart disease, stroke and DM-related vascular complications. Patients with any of the comorbidities, complications and tobacco-users were excluded. All subjects underwent heart-rate-variability (HRV) assessment for the estimation of autonomic tone, 17 after 5 min resting electrocardiogram (ECG). Impaired autonomic tone as indicated by the time and frequency domain measures of HRV was a criterion for exclusion from the study. The diagnosis of type 2 diabetes mellitus was established as per the criteria of American Diabetes Association. 18 Informed written consent was obtained from all participants before the recordings.
Subjects were asked to report at 8.30 a.m. after an overnight fast. Demographic details and clinical history were recorded and blood sample obtained for fasting glucose and insulin estimation.
Assessment of systemic vascular reactivity
Systemic vascular reactivity (SVR) was assessed by quantifying reactive hyperaemia following temporary occlusion of the brachial artery using finger photoplethysmographic signals. The photoplethysmograph finger probe comprises an infrared, reflection type photoelectric transducer (MLT1020PPG; ADInstruments, Australia), which is connected with the ‘PowerLab’ (ADInstruments) data acquisition unit. Depending on the variations in the intensity of light received, the transducer generates an output voltage which is subsequently amplified, filtered and displayed as a digital volume pulse waveform. Before the assessment, patients rested in the supine position for 15 min, after which recordings were carried out in a noiseless, temperature-controlled laboratory environment. Digital pulse waves were acquired from the middle finger of both hands using separate transducers. Right middle finger was considered as the ‘test finger’ (as right brachial artery was occluded to produce reactive hyperaemia) and left middle finger the control. After 5 min of baseline recording, brachial artery occlusion was produced by a cuff pressure of 50 mmHg above the subject’s baseline systolic blood pressure on the right arm. Cuff pressure was released after 5 min. Continuous recording of photoplethysmographic signals was carried out during rest, occlusion and for 5 min after release of occlusion. Signals were analysed offline using LabChart Pro 7 software. SVR was calculated as the maximum percentage increase in the running average of post-deflation pulse wave amplitude during reactive hyperaemia from baseline.
To minimize the influence of non-endothelium-dependent systemic effects on SVR results, ‘corrected SVR’ 12 was calculated as a natural logarithm of the ratio of post-deflation to baseline pulse wave amplitude in the test finger divided by the same ratio in the control finger.
Assessment of cerebrovascular reactivity
Cerebrovascular reactivity (CVR) was assessed by a steady-state technique of measuring changes in cerebral blood flow velocity and cerebrovascular conductance index (CVCi) in response to inhaled 7% CO2 (with 21% O2, balanced by nitrogen).11,13,19 The middle cerebral artery blood flow velocity (MCAV) was measured by insonating the right middle cerebral artery with a 2-MHz probe using the MultiDop T2 ultrasound (DWL Elektronische Systeme, Germany). The probe was positioned to record the maximum blood flow velocity (monitoring programme QL software 2.5; DWL Elektronische Systeme) and was stabilized using a head-fixation-band. In order to establish the baseline, subjects were asked to rest in sitting position until heart rate and arterial blood pressure (ABP) stabilized. Continuous tracings of ABP, ECG and MCAV were recorded. After 5 min of baseline measurements, subjects breathed a gas mixture containing 7% CO2 via Bain circuit (set at 2.5 times their minute ventilation) for 2 min. MCAV was detected from the envelope of the arterial flow waveforms. Mean MCAV was derived by dividing the area under the curve of each waveform by the time dura-tion. ABP was recorded beat-to-beat by ‘volume clamp method’ from the right middle finger using a finometer (finometer® model 2; FMS, The Netherlands). Offline analysis of ABP and MCAV was carried out using signal acquisition and analysis software LabChart Pro 7® (ADInstruments).
The increase in ABP during hypercapnic stimulus can independently increase the MCAV and may confound the CVR results if calculated as changes in MCAV. In order to negate the effect of raised blood pressure on CVR results, CVCi was calculated as ratio of mean MCAV to mean ABP.11,13 CVR was measured by four methods, un-corrected as percentage and absolute change in MCAV (‘percent MCAV’ and ‘delta MCAV’, respectively); and corrected as percentage and absolute change in CVCi (‘percent CVCi’ and ‘delta CVCi’), from baseline, during hypercapnia.
Estimation of IR
IR was estimated using the homeostatic model assessment of insulin resistance (HOMA-IR). Morning fasting blood samples were collected from an antecubital vein, into ethylenediaminetetraacetic acid (EDTA) tubes. Plasma was separated by centrifugation at 3000 r/min for 15 min. Fasting blood glucose was measured by an enzymatic colorimetric method (Giesse Diagnostics, Italy) and fasting insulin by enzyme-linked immunosorbent assay (ELISA; DRG International, USA). Measurements of absorbencies were carried out using a microplate reader Benchmark plus (BIORAD, USA). HOMA-IR was calculated using the formula HOMA-IR = {[Fasting plasma glucose (mmol/L)] × [Fasting plasma insulin (µU/mL)]}/22.5.
Statistical analysis
Descriptive statistics were used to summarize all variables. Each parameter was tested for the normality in distribution using standard normality tests (D’Agostino–Pearson omnibus normality test and Shapiro–Wilk test). Depending upon the normal or non-normal distribution of parameters, data were expressed as mean ± standard deviation (SD) or median with interquartile range (1st quartile–3rd quartile). Appropriate parametric and nonparametric tests were chosen for data analysis. To compare post-reactive photoplethysmographic pulse wave amplitude, MCAV, CVCi and ABP, with their corresponding baseline values, a paired t-test was applied. The relationship between two parameters was evaluated using Pearson’s correlation coefficient or Spearman’s rank correlation coefficient as appropriate. The level of statistical significance was set at p < 0.05. Statistical analyses were carried out using GraphPad prism version 5.00 for Windows (GraphPad Software, Inc., USA).
Results
The study was conducted in 34 patients with type 2 DM without clinical evidence of complications. Baseline demographic and vascular characteristics are listed in Table 1. All patients were managed by diet and exercise. Out of 34 patients, 21 were managed by second generation sulfonylureas with the mean duration of treatment recorded as 4.02 ± 1.69 years.
Demographic and basal vascular characteristics of the subjects.
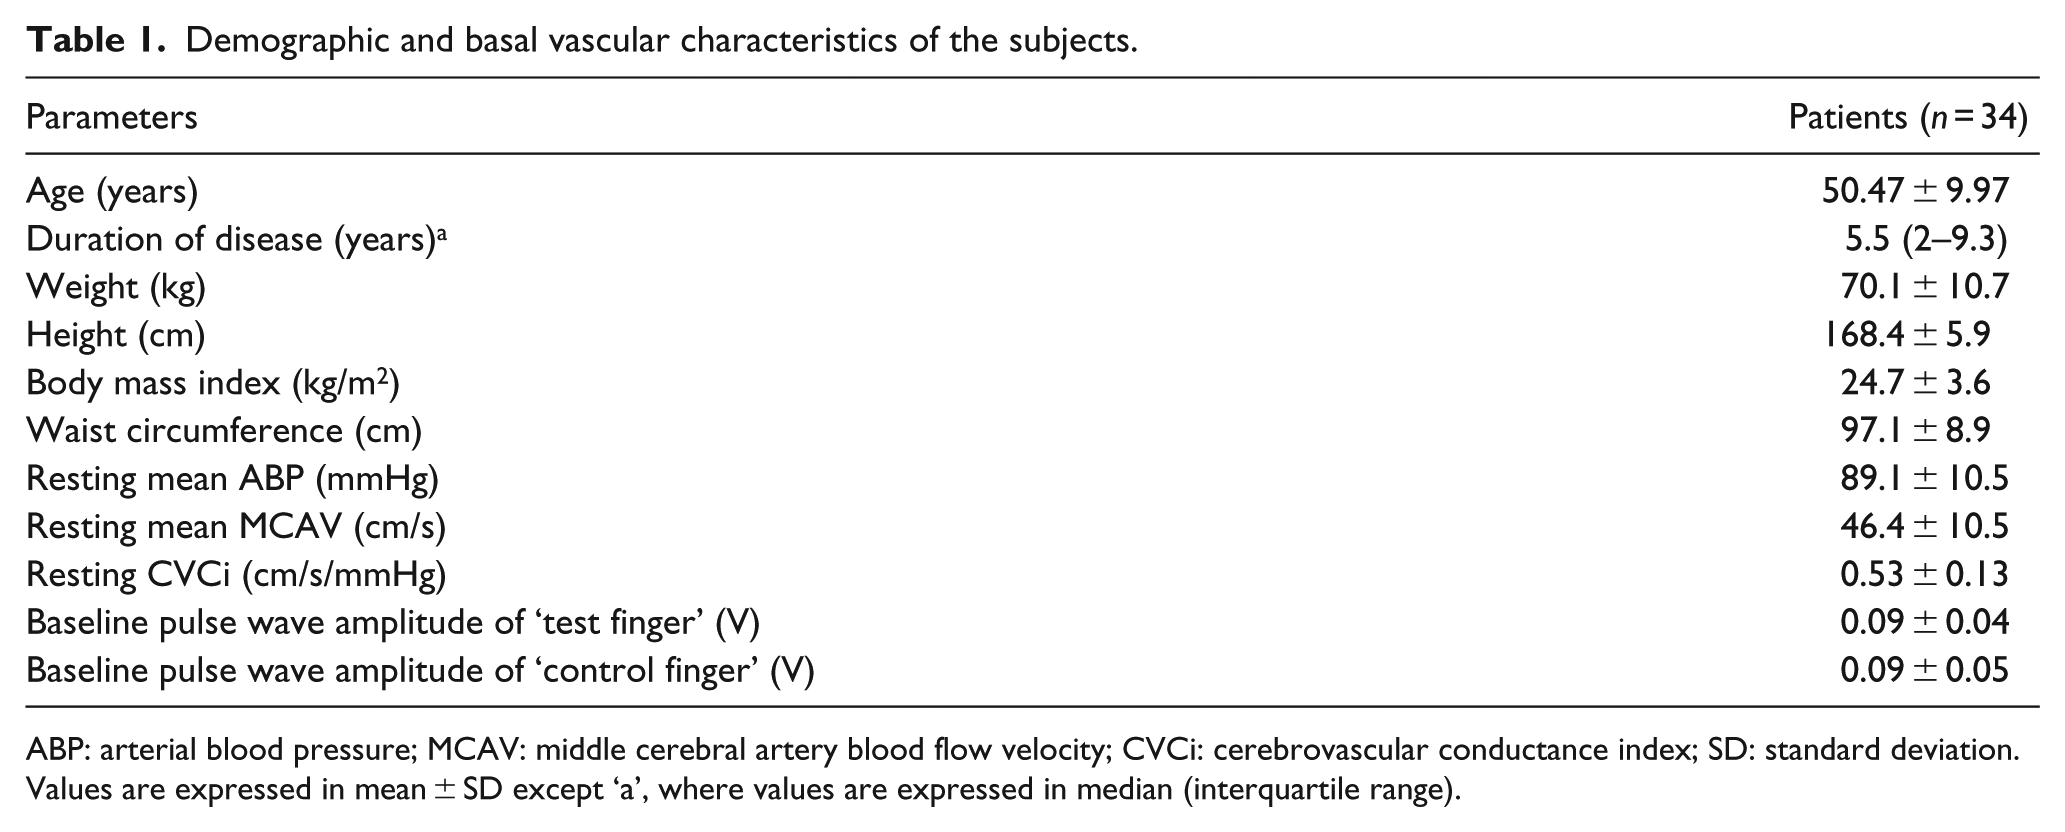
ABP: arterial blood pressure; MCAV: middle cerebral artery blood flow velocity; CVCi: cerebrovascular conductance index; SD: standard deviation.
Values are expressed in mean ± SD except ‘a’, where values are expressed in median (interquartile range).
Photoplethysmographic pulse wave amplitude respon-ses during reactive hyperaemia were analysed to assess SVR. Moving average filtering of photoplethysmographic pulse wave amplitude was carried out to smooth out short-term fluctuations and to obtain better estimate of maximum pulse wave amplitude change. The maximum of post-deflation, running averaged pulse wave amplitude from the test finger was found to be significantly higher as compared to baseline (0.12 ± 0.04 V vs 0.09 ± 0.04 V; p < 0.0001). The post-deflation pulse wave amplitude of the control finger was not found to be significantly changed as compared to its baseline (0.11 ± 0.04 V vs 0.09 ± 0.05 V; p = 0.345). Group median of SVR calculated as percentage increase in the running average of post-deflation pulse wave amplitude from baseline was 26.0% (9.14%–53.10%). Group median of ‘corrected SVR’ (natural logarithm of the ratio of post-deflation to baseline pulse amplitude in the test finger divided by the same ratio in the control finger) was 0.27 (0.13–0.50).
Changes in MCAV and CVCi during hypercapnic breathing were quantified to assess CVR. There was a significant increase in MCAV and mean ABP compared to baseline during breathing 7% CO2 (46.4 ± 10.5 cm/s vs 70.2 ± 22.2 cm/s; p < 0.0001; and 89.1 ± 10.5 mmHg vs 100.2 ± 17.2 mmHg; p < 0.0001, respectively) [Figure 1(a) and (b)]. CVCi calculated as ratio of mean MCAV to mean ABP was also found to be significantly increased as compared to the baseline during 7% CO2 breathing (0.53 ± 0.13 cm/s/mmHg vs 0.72 ± 0.25 cm/s/mmHg; p < 0.0001) [Figure 1(c)]. Percent MCAV (70.2% ± 22.2%), delta MCAV (23.8 ± 13.4 cm/s), percent CVCi (34.4% ± 26.6%) and delta CVCi [0.16 (0.08–0.25) cm/s/mmHg] were calculated as measures of CVR.
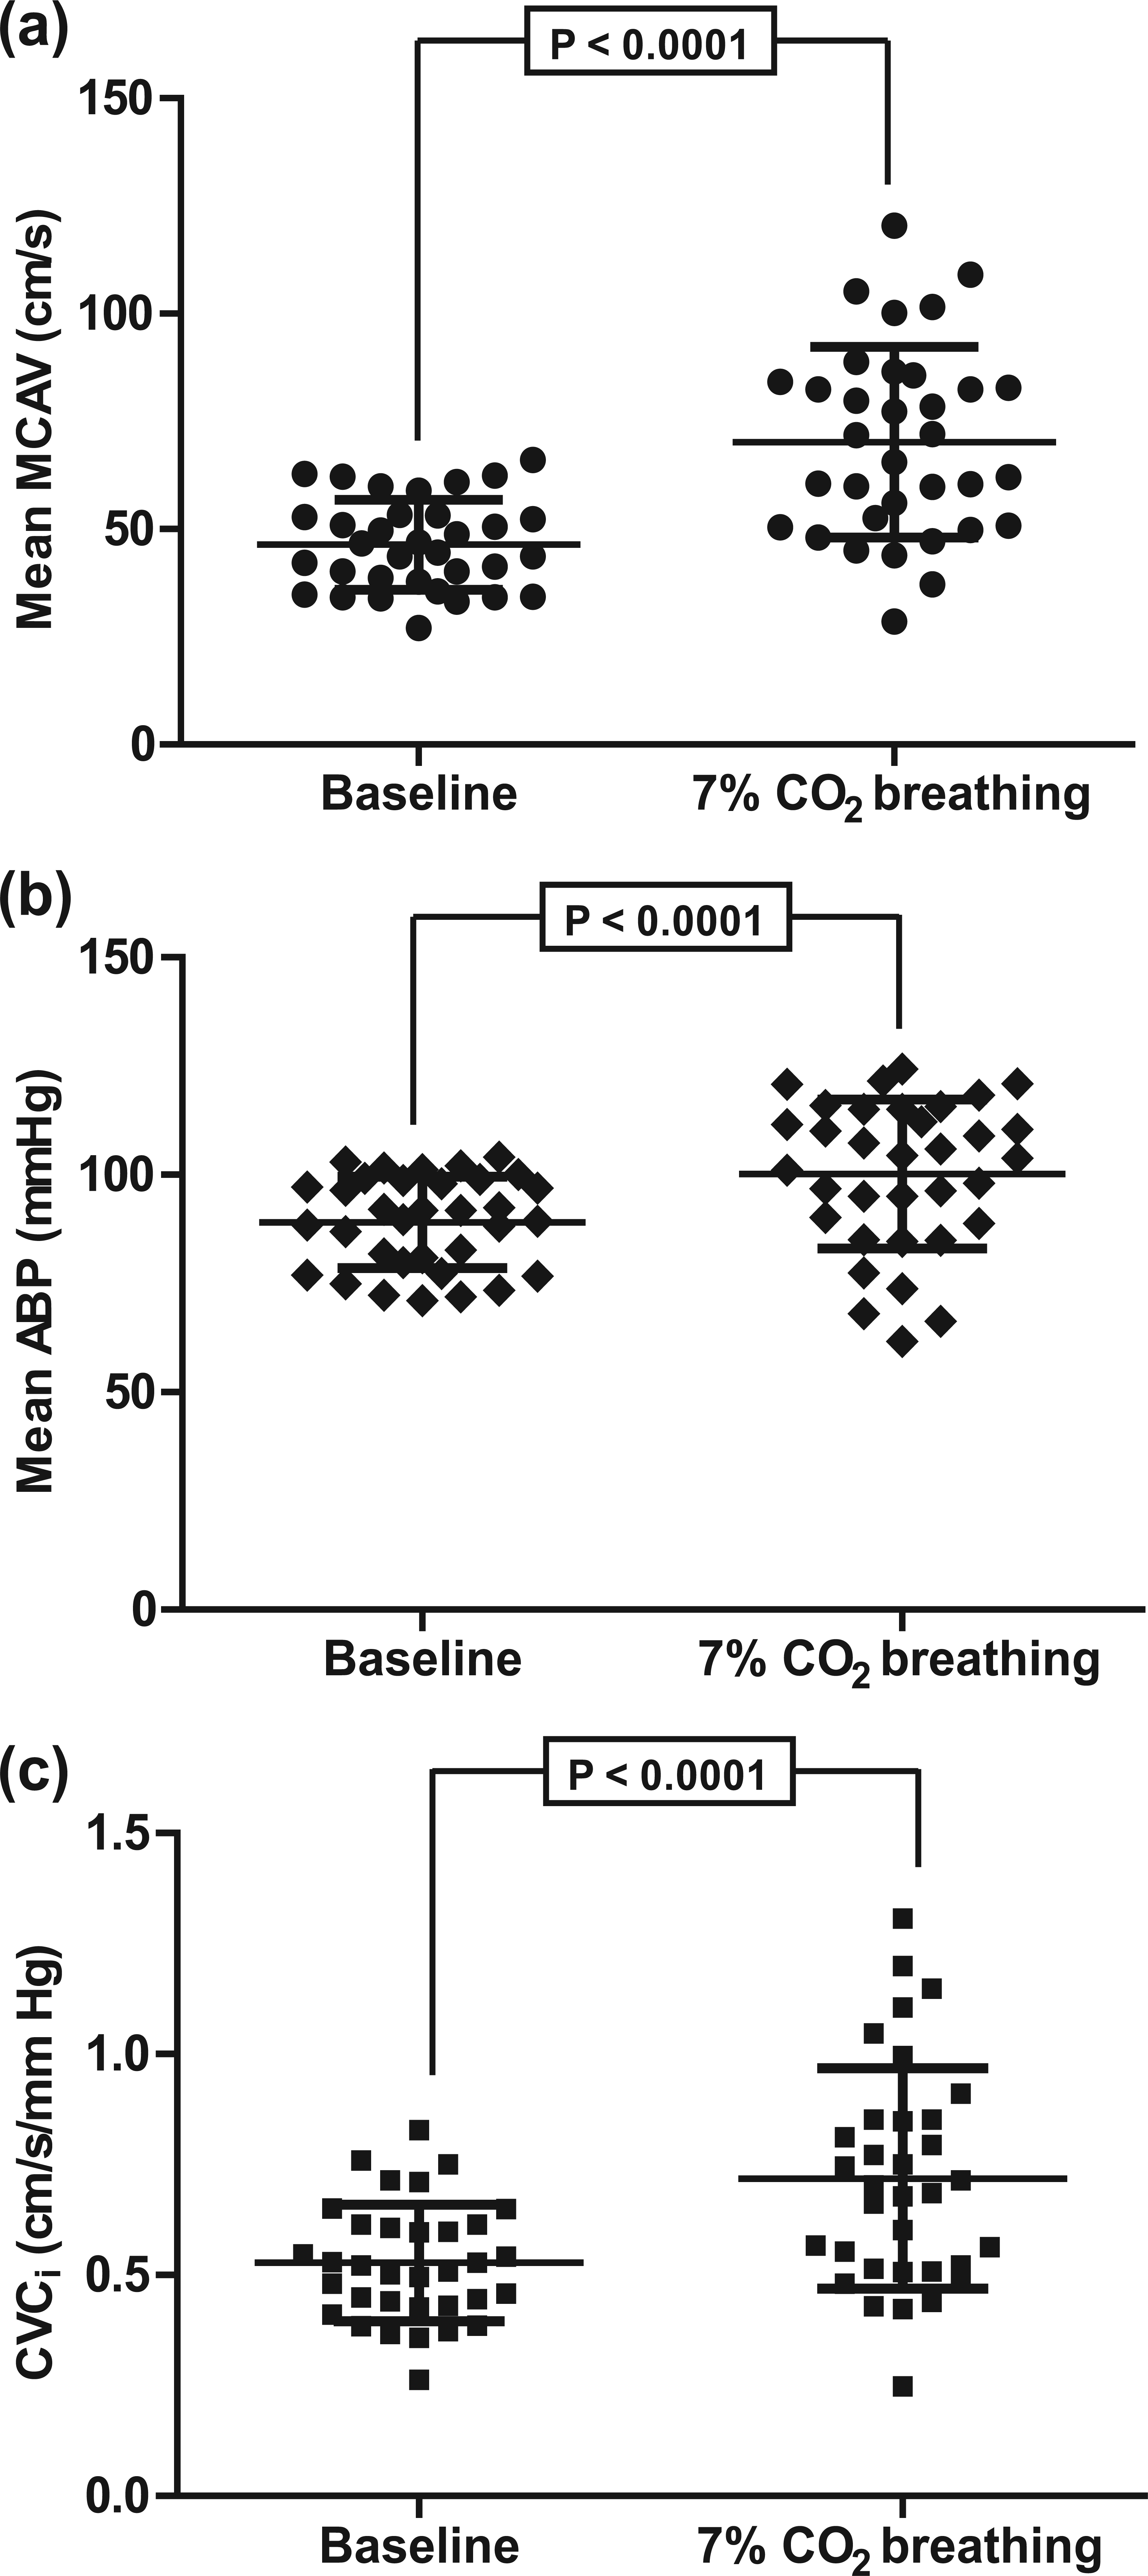
Changes in (a) mean MCAV, (b) mean ABP and (c) CVCi in response to 7% CO2 breathing, from baseline.
Group median of plasma glucose was 7.5 (6.8–9.3) mmol/L and of plasma insulin was 10.6 (8.1–12.8) units. HOMA-IR values ranged from 1.8 to 17.1, having a median value of 3.6 with interquartile range from 2.6 to 5.1.
To evaluate the association between vascular reactivities of systemic and cerebral vessels, correlation analyses between different CVR and SVR parameters were carried out. Correlations between SVR and percent MCAV (r = 0.14; p = 0.422) as well as delta MCAV (r = 0.09; p = 0.609) were non-significant. But these correlations became significant when SVR and CVR were corrected for non-endothelium-dependent systemic influences. The correlation analysis between corrected SVR and percent CVCi (r = 0.51; p = 0.002) as well as corrected SVR and delta CVCi (r = 0.50; p = 0.003) showed significant positive correlation [Figure 2(a) and (b)].
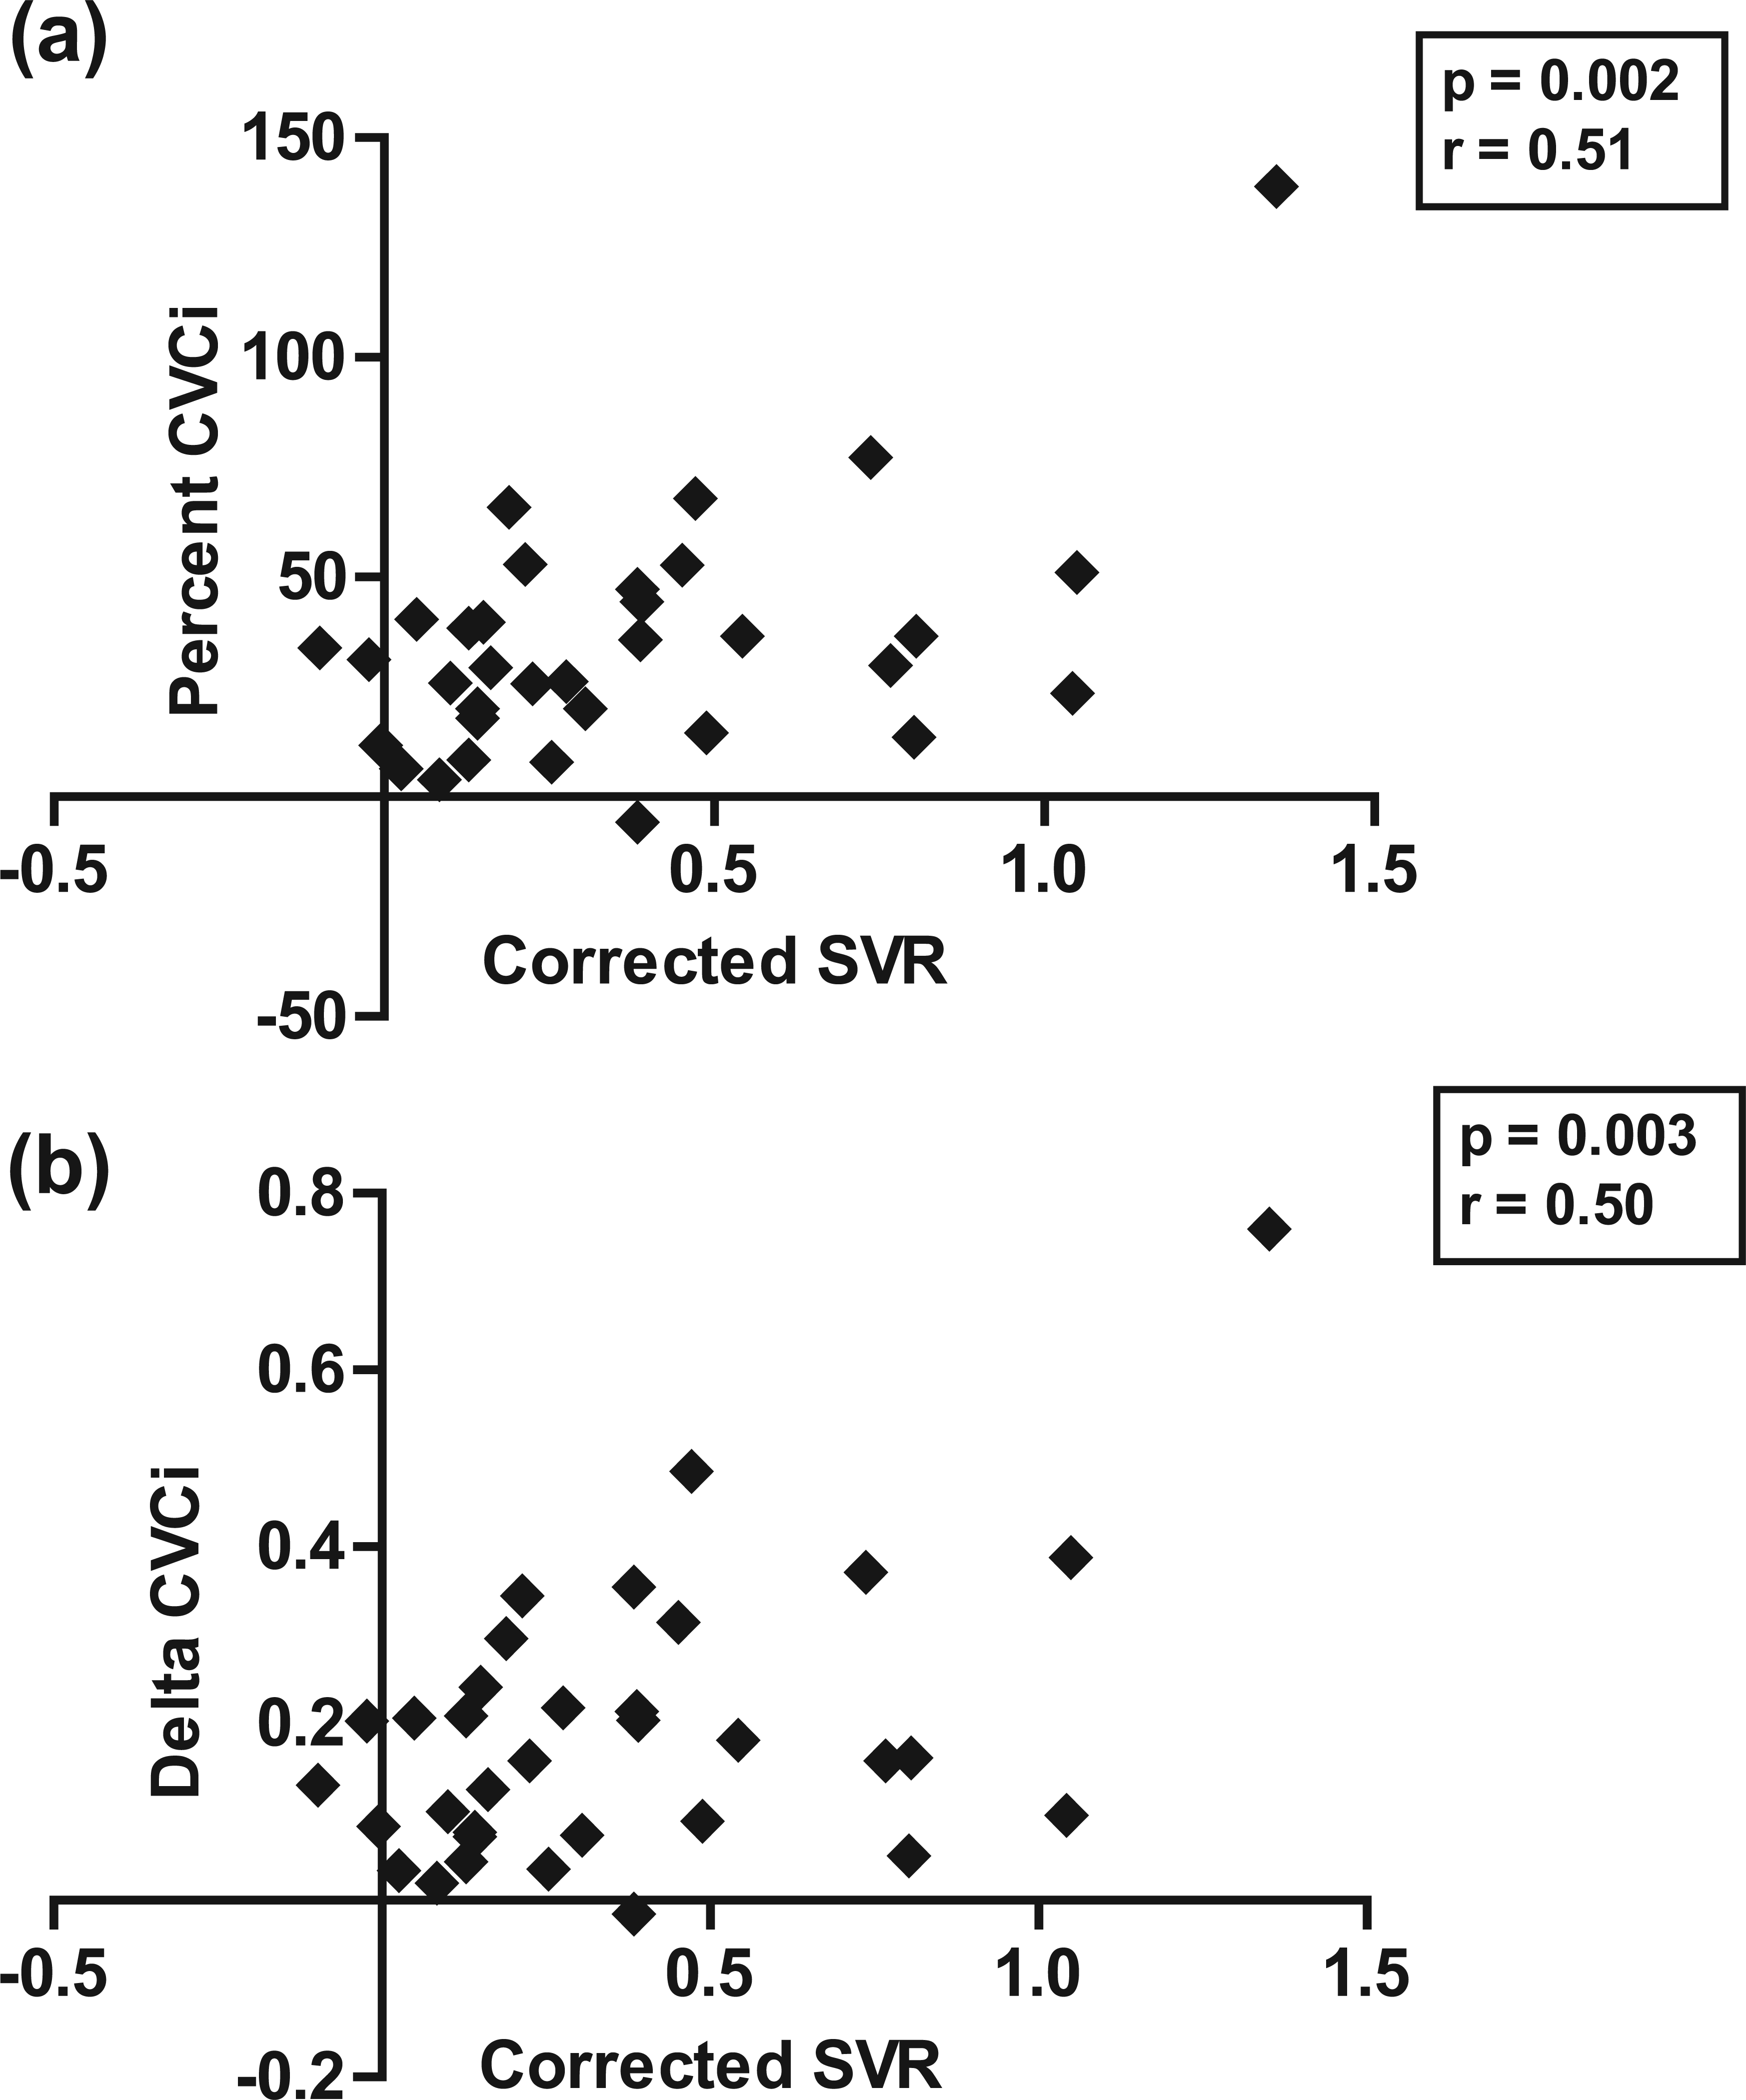
Significant positive correlations between (a) ‘Corrected SVR’ and ‘Percent CVCi’ and (b) ‘Corrected SVR’ and ‘Delta CVCi’.
To explore the possibility that IR contributes to the impaired VR, we assessed the relationship between HOMA-IR and various VR parameters in the patients with type 2 DM. Correlations between HOMA-IR and none of the SVR parameters (SVR and corrected SVR) were found to be statistically significant. The correlation between HOMA-IR and percent MCAV, delta MCAV and percent CVCi was not significant, but the correlation between HOMA-IR and delta CVCi was statistically significant (r = −0.38; p = 0.029) (Figure 3).
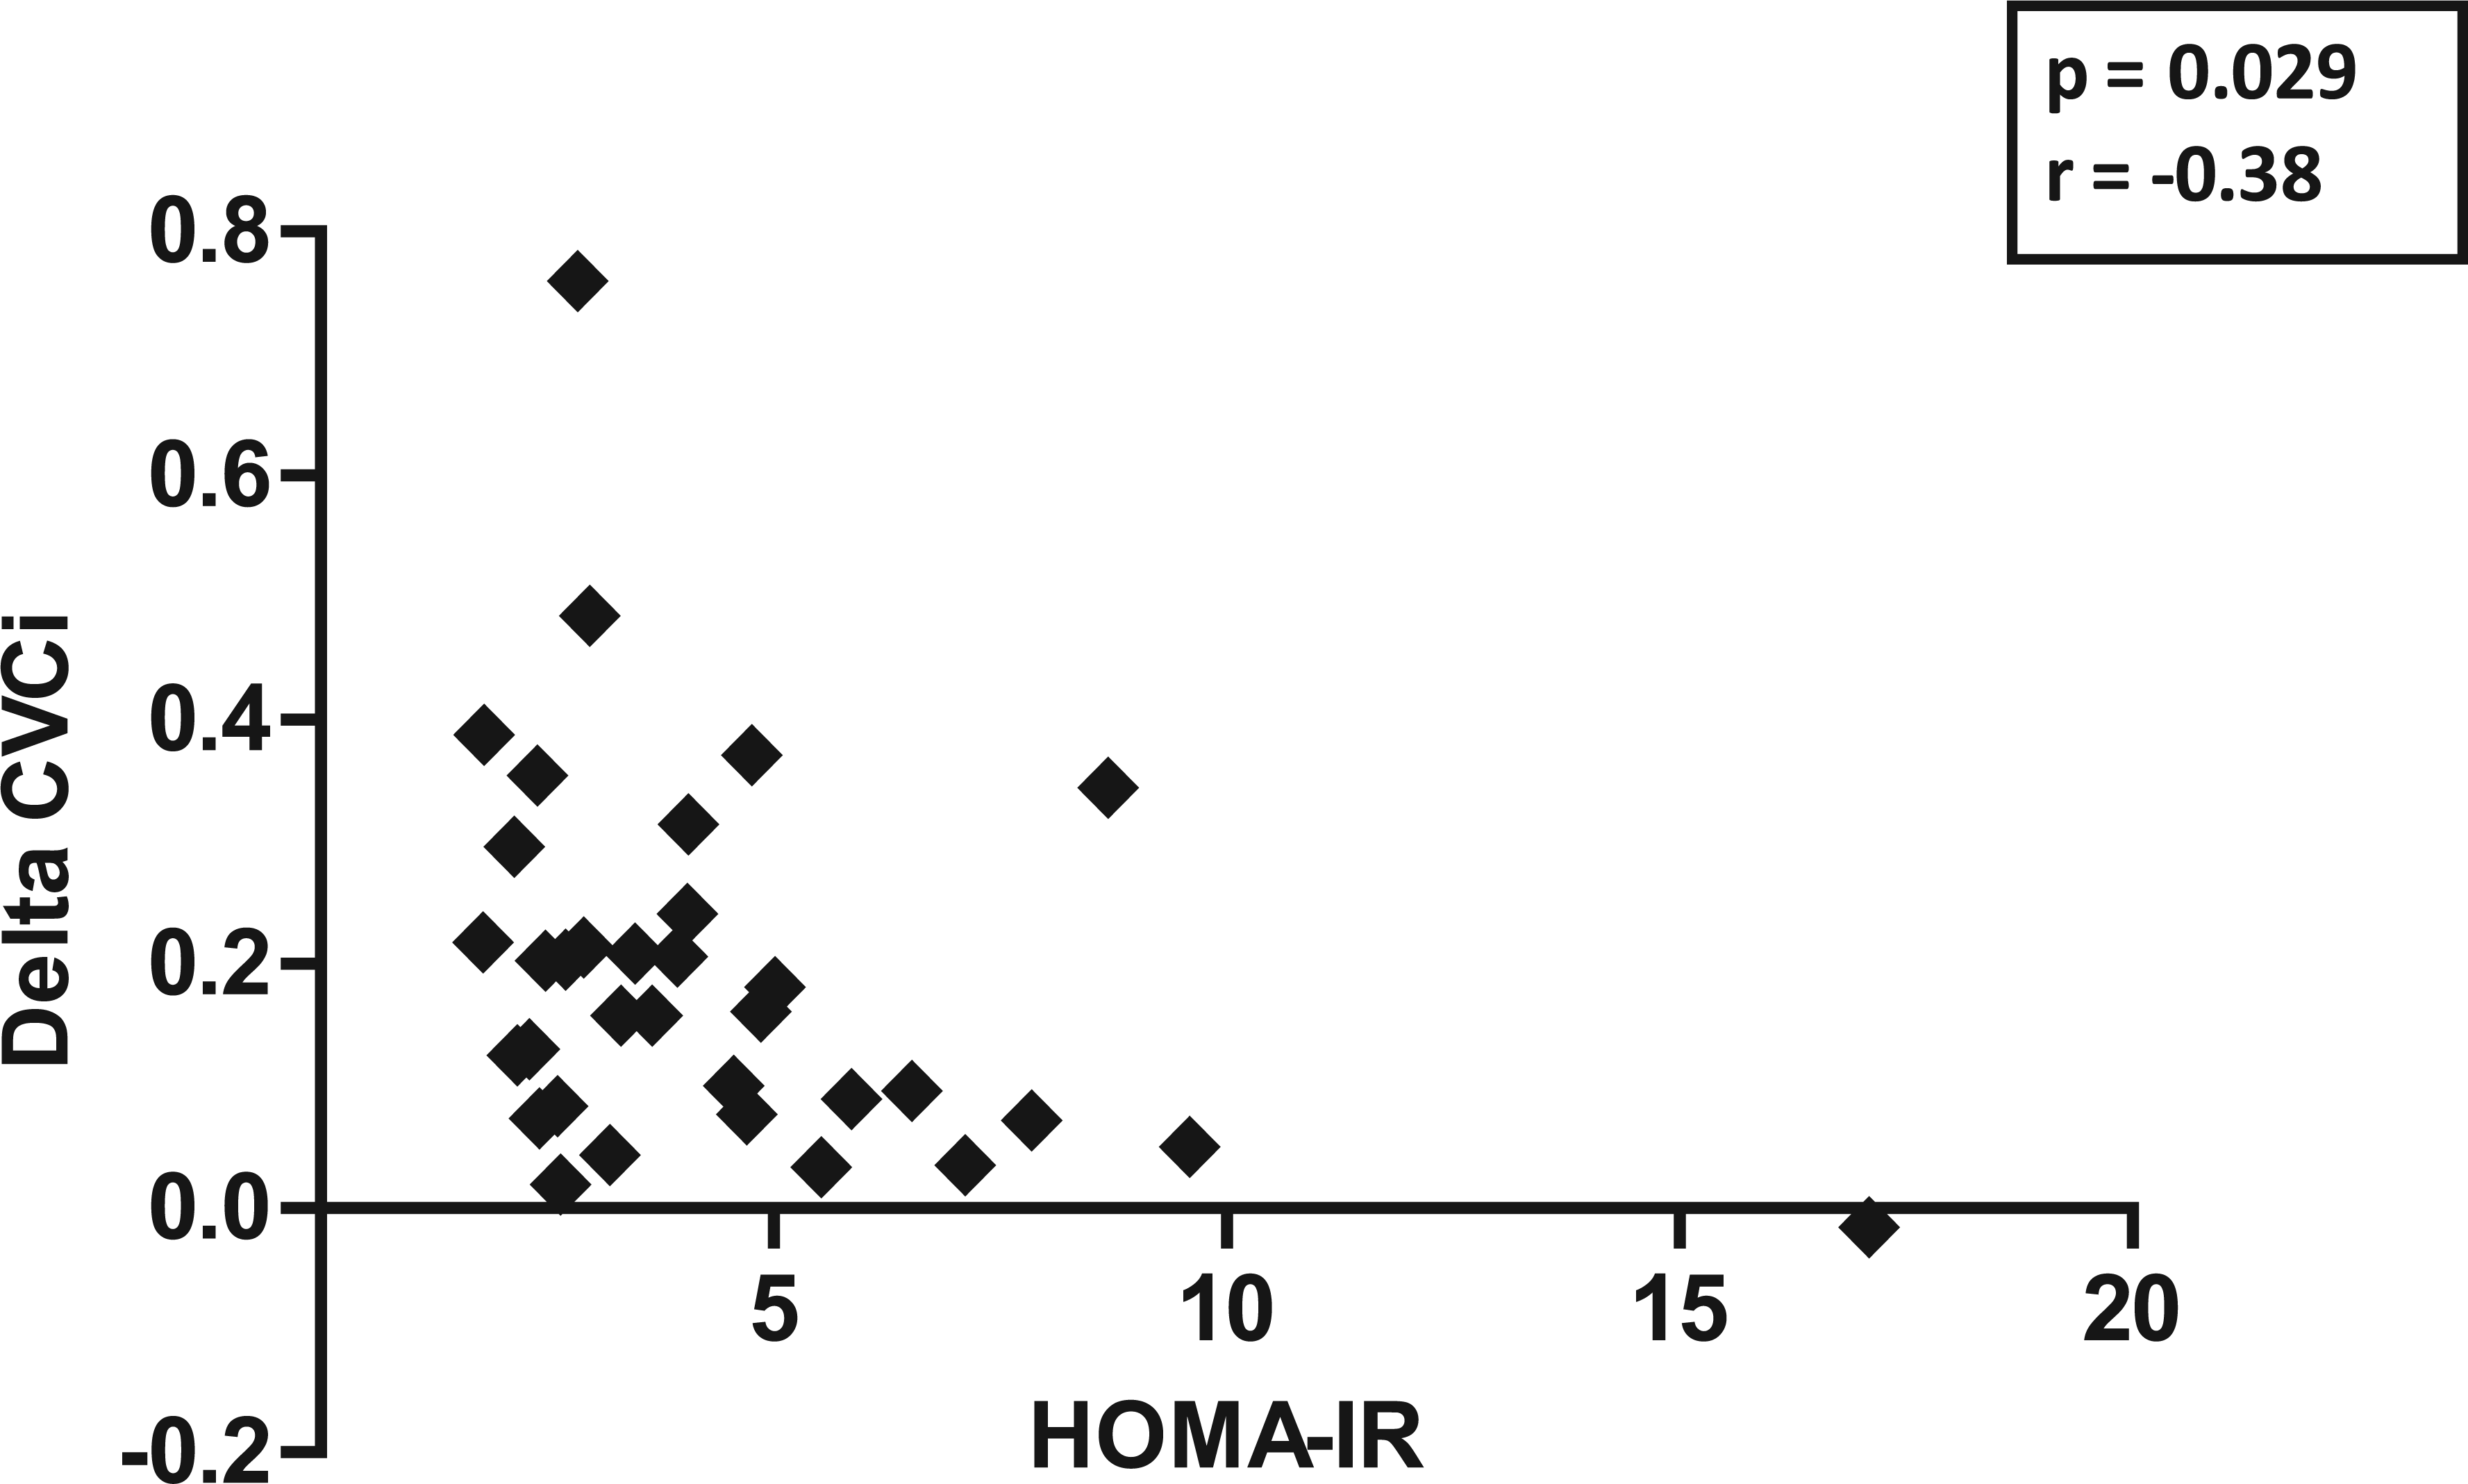
Significant negative correlation between ‘HOMA-IR’ and ‘Delta CVCi’.
Discussion
The major novel finding of the present study is the significant positive correlation between CVR and SVR, observed when the results were corrected for the non-endothelium-dependent systemic factors. We did not find any significant correlation between HOMA-IR and any of the VR parameters except delta CVCi.
The commonly employed method for SVR estimation is by quantifying the post-occlusion reactive hyperaemia in brachial artery indirectly by measuring changes in peripheral pulse wave amplitude of the corresponding finger or directly by measuring post-occlusive changes in brachial artery diameter following temporary occlusion (flow-mediated dilation).8,20 An important methodological issue which has largely been neglected is that the quantum of reactive hyperaemia induced vascular responses has not been corrected for the non-endothelium-dependent systemic effects.12,21 This correction can be carried out by normalizing vascular responses observed in the hyperaemic arm to the measurements from the contralateral arm, 12 which probably minimizes the sympathetic activation induced vascular response superimposed over the locally driven hyperaemic response. Therefore, in the present study, we have recorded finger pulse waveform from the middle fingers of both the hands and applied the appropriate correction to obtain the corrected SVR.
The commonly employed technique to assess endothelial function of cerebral vessels involves the transcranial ultrasonographic measurement of changes in cerebral blood flow velocities observed in response to experimentally induced hypercapnia.13,19 A flaw with this technique is that hypercapnia also causes a substantial rise in ABP which results in non-endothelium mediated increases in cerebral blood flow culminating in falsely high CVR values.11,22,23 The CVCi calculation minimizes this influence of increased ABP on the CVR results and increases the probability of detecting true positive cases of endothelial dysfunction.11,13 Unfortunately, very few studies have been carried out in DM patients in which this correction has been applied.13,24 In the present study, we assessed CVR with and without applying this correction and showed that CVR is better correlated with SVR in type 2 DM when corrected for associated changes in ABP.
We calculated CVR by computing percentage and absolute changes in MCAV and CVCi, during hypercapnia. Assessment of CVR as percentage change in MCAV has been employed in many studies, but in few studies has its assessment as a percentage change in CVCi been carried out.13,25 However, CVR assessment as an absolute or delta change in MCAV or CVCi has not been considered previously. In our experience, for the assessment of CVR, absolute changes seem to be less prone to error than percentage changes of MCAV or CVCi. Calculating percentage change normalizes the absolute change to its baseline values. Normalization assumes that changes in the MCAV or CVCi in response to hypercapnia are directly proportional to their respective baseline values. However, this assumption may not be justified in patients with DM. Studies in DM reported that changes in cerebral vessels compromise the cerebral blood flow even at the resting level.26,27 Therefore, to maintain adequate tissue perfusion, cerebral vessels may have already utilized their functional reserve. Cerebral vessels which are already dilated and therefore operating at higher MCAV or CVCi values at baseline will show lesser increases in dilatation with hypercapnia. Therefore, we assume that normalization of absolute changes in MCAV or CVCi to their baseline (i.e. percent change) may actually misrepresent the CVR results. Reporting absolute changes in MCAV or CVCi will minimize this problem. Moreover, among absolute changes of cerebrovascular parameters, delta CVCi is better than the delta MCAV because CVCi calculation minimizes the influence of ABP over MCAV in computing CVR results. There are studies which have shown that changes in cerebrovascular conductances are a better measure of CVR than the changes in cerebral blood flow velocities.11,13
An important finding of our study is the significant positive correlation between CVR and SVR after correction for non-endothelium-dependent systemic influences. Very few studies14,15,16 have explored the correlation between CVR and SVR. Perko et al. 14 studied the systemic and cerebral endothelial function in the patients with migraine. They studied endothelial function of cerebral vessels by assessing changes in cerebral blood flow velocity in response to L-arginine, and endothelial function of systemic vessels by flow-mediated dilation. They did not find a significant correlation between the CVR and SVR. Similarly, Pretnar-Oblak et al. 15 also reported non-significant correlation between CVR to L-arginine and SVR by flow-mediated dilation technique, in patients with lacunar infarctions. A study by Palazzo et al. 16 too reported non-significant correlation between CVR to hypercapnia and SVR by flow-mediated dilation in type 2 DM. None of these studies corrected the VR results for non-endothelium-dependent systemic influencers which might explain the lack of association between CVR and SVR.
This is probably the first study to report correlations between CVR and IR in type 2 DM, although Rodríguez-Flores et al. 10 found a significant negative linear association between HOMA-IR and breath-holding index (a method to assess CVR) in obese individuals. In the present study, significant correlations were found between HOMA-IR and Delta CVCi, but not between HOMA-IR and other CVR parameters. This supports the view that calculation of CVR as delta CVCi is more physiologically plausible than other CVR parameters. We did not find significant correlations between HOMA-IR and any of the SVR parameters. There are few studies in which correlation between IR and SVR has been studied1,28,29 and significant correlations have been found using either flow-mediated dilation1,28 or acetylcholine-induced vasodilatation. 29
In conclusion, the present study addressed the relationship between CVR and SVR in type 2 DM and provides evidence that CVR and SVR are significantly correlated when they are corrected for non-endothelium-dependent systemic influences. As the correlation between these two vascular-reactivity-measures is moderate (r ~ 0.5), it seems very unlikely that CVR can be predicted from SVR, or vice versa, for any individual, although further work would be needed to investigate this possibility. CVR and SVR estimation helps in identifying patients at increased risk of developing cerebrovascular and cardiovascular complications. Early intensive management of such patients may decrease their morbidity and mortality. We also propose delta CVCi to be a better parameter to assess CVR as compared to percent CVCi, percent MCAV and delta MCAV.
Footnotes
Declaration of conflicting interests
The author(s) declared no potential conflicts of interest with respect to the research, authorship and/or publication of this article.
Funding
The author(s) received no financial support for the research, authorship and/or publication of this article.