
Abstract
Aim:
To evaluate the association between non-alcoholic fatty liver disease and arterial stiffness in adults with normal glucose tolerance, pre-diabetes and newly diagnosed diabetes after excluding known diabetes.
Methods:
A total of 4860 subjects were divided into normal glucose tolerance, pre-diabetes and newly diagnosed diabetes groups according to the American Diabetes Association 2011 diagnostic criteria. The severity of non-alcoholic fatty liver disease was divided into mild and moderate to severe. Increased arterial stiffness was defined as brachial–ankle pulse wave velocity (baPWV) ⩾ 1400 cm/s.
Results:
There was a significant difference in the prevalence of mild and moderate to severe non-alcoholic fatty liver disease between subjects with and without increased arterial stiffness. Mild (odds ratio (OR) = 2.02, 95% confidence interval (CI) = 1.43–2.84) and moderate to severe (OR = 2.15, 95% CI = 1.33–3.46) non-alcoholic fatty liver disease were independently associated with increased arterial stiffness in the normal glucose tolerance group. In the pre-diabetes and diabetes groups, neither mild nor moderate to severe non-alcoholic fatty liver disease was associated with increased arterial stiffness.
Conclusion:
The effect of non-alcoholic fatty liver disease on arterial stiffness is apparent in subjects with normal glucose tolerance, but not in diabetes and pre-diabetes.
Keywords
Introduction
Non-alcoholic fatty liver disease (NAFLD) is the most common liver disease in developed countries. It is characterized by a wide spectrum of histological abnormalities ranging from simple hepatic steatosis, non-alcoholic steatohepatitis (NASH), to liver fibrosis and then cirrhosis. 1 NASH, which accounts for 10%–20% of NAFLD patients, is the potentially progressive form of NAFLD and is often accompanied by progressive fibrosis. Long-standing NASH may progress to liver cirrhosis and then end-stage liver disease and hepatocellular carcinoma. 2 Studies have shown that NAFLD is strongly related to obesity, diabetes, hypertension and dyslipidemia, which are major risk factors for cardiovascular disease, and it is regarded as a hepatic manifestation of metabolic syndrome. 3
Arterial stiffness has shown to be a powerful independent predictor of cardiovascular events and all-cause mortality.4,5 There are several methods to evaluate the condition of arterial stiffness severity, such as carotid–femoral pulse wave velocity (cfPWV) and brachial–ankle pulse wave velocity (baPWV). However, due to ease of execution, good reproducibility and good correlation with aortic PWV, the measurement of baPWV is widely used in Asian countries.6–8 The pathogenesis of arterial stiffness includes progressive elastic fibre degeneration and collagen accumulation in the arterial wall, with increased collagen crosslinking. 9 Several factors, such as obesity, diabetes, metabolic syndrome, hypertension and dyslipidemia, are proven to be associated with arterial stiffness. 10
Although there is an insignificant association between NAFLD and arterial stiffness in hypertensive patients without additional cardiovascular risk factors, 11 studies have shown that NAFLD is positively related to arterial stiffness in general population12–14 and adolescents. 15 Furthermore, a positive association of NAFLD with arterial stiffness was also found in non-hypertensive and non-diabetic subjects. 7 Because arterial stiffness and NAFLD share similar risk factors, and no studies on their relationship are available in individuals with different glycaemic status, the aim of this work was to evaluate the relationship between NAFLD and arterial stiffness in subjects with normal glucose tolerance (NGT), pre-diabetes and newly diagnosed diabetes (NDD), as defined by history, medication, fasting plasma glucose (FPG), 2-h postload glucose (2h-PG) and HbA1c level. 16
Methods
Study population
This study uses secondary data analysis, and the research data were retrospectively extracted from an existing dataset of self-motivated physical check-ups at the health examination centre of the National Cheng Kung University Hospital between October 2006 and August 2009. The participant’s informed consent was not needed, because the data in this research were analysed anonymously. The Ethical Committee for Human Research at the National Cheng Kung University Hospital approved the study protocol used in this work (B-ER-101-331). The data included demographic information, lifestyle habits, medical history, medication use, body weight, body height, right brachial blood pressure, baPWV value, abdominal ultrasound and laboratory data, including FPG, 2h-PG, HbA1c, total cholesterol (TC), triglyceride (TG), high-density lipoprotein cholesterol (HDL-C), aspartate aminotransferase (AST), alanine aminotransferase (ALT), creatinine and haemoglobin concentration. Different glycaemic status was divided into NGT, pre-diabetes and NDD according to the American Diabetes Association 2011 diagnostic criteria. NDD was defined as FPG ⩾ 7.0 mmol/L, 2-h PG ⩾ 11.1 mmol/L or HbA1c ⩾ 6.5% without diabetes history; pre-diabetes as FPG of 5.6–6.9 mmol/L, 2-h PG of 7.8–11.0 mmol/L or HbA1c of 5.7%–6.4% without the above criteria of diabetes; NGT as FPG < 5.6 mmol/L, 2-h PG < 7.8 mmol/L and HbA1c < 5.7% without the criteria of pre-diabetes/diabetes.
Initially, 7528 subjects were recruited. The study exclusion criteria were as follows: (1) history of hypertension, diabetes mellitus, heart disease or stroke (n = 900); (2) using medications due to hypertension, diabetes mellitus or dyslipidemia (n = 753); (3) anaemia (haemoglobin < 13.0 g/dL in male and <12.0 g/dL in female) 17 (n = 685); (4) alcohol drinking ⩾ 140 g/week in male and ⩾70 g/week in female (n = 27); (5) positive results for hepatitis B virus surface antigen and hepatitis C virus antibody (n = 1217); (6) history or abdominal ultrasound findings of liver cirrhosis or hepatocellular carcinoma (n = 19); (7) ankle–brachial index (ABI) ⩽ 0.9 18 (n = 48) and (8) incomplete data information (n = 48). A cross-sectional sample of 4860 consecutive subjects (62.2% male; 37.8% female) who met these criteria was included in the final analysis.
Smoking was categorized as current smokers and non-current smokers. Current smoker was defined as at least 20 cigarettes per month for at least the previous 6 months. Alcohol use was classified into current drinker and non-current drinker. Current drinker was defined as at least one alcoholic drink per week for at least the previous 6 months. Regular exercise was defined as a minimum of 20 min of exercise at least 3 times per week.
Body mass index (BMI) was calculated and expressed as weight in kilograms (kg) divided by the height in meters squared (m2). Newly diagnosed hypertension was defined as systolic blood pressure (SBP) ⩾ 140 mmHg or diastolic blood pressure (DBP) ⩾ 90 mmHg over right brachial area, without a previous history of hypertension or using anti-hypertensive medication. Abdominal ultrasound was performed by two experienced radiologists with high-resolution ultrasonography (Xario SSA-660A; Toshiba, Nasu, Japan) using a 3.5-MHz linear transducer. The severity of NAFLD was divided into mild (slight increase in liver echogenicity, mild attenuation of the penetration of ultrasound signal and slight decrease in lucidity of the borders of intrahepatic vessel walls and diaphragm), moderate (diffuse increase in liver echogenicity, greater attenuation of the penetration of ultrasound signal and decrease in the visualization of the intrahepatic vessel walls, particularly the peripheral branches) and severe (gross increase in liver echogenicity, greater reduction in the penetration of ultrasound signal and poor or no visualization of intrahepatic vessel walls and diaphragm).19,20 In addition, we also calculated the NAFLD fibrosis score (NFS) based on the following equation: NFS = −1.675 + 0.037 × age (years) + 0.094 × BMI (kg/m2) + 1.13 × impaired fasting glucose (IFG)/diabetes (yes = 1, no = 0) + 0.99 × AST/ALT ratio − 0.013 × platelet (×109/l) − 0.66 × albumin (g/dl). 21
The baPWV values, calculated as the distance travelled by the pulse wave divided by the time taken to travel the distance, were assessed using an automatic, non-invasive vascular screening device (BP-203RPE II; Colin Medical Technology, Komaki, Japan). This was achieved by wrapping four pneumatic pressure cuffs around each of the four extremities that simultaneously measured the blood pressure levels and pulse waves of the brachial artery of both arms and tibial artery of both legs after 5 min of bed rest. The right side baPWV values were used for the analysis. Because the reference value of baPWV with a cut-off of 1400 cm/s was used as an indicator of atherosclerotic cardiovascular risk or severity of atherosclerotic vascular damage, increased arterial stiffness was defined as baPWV of 1400 cm/s or higher. 5
Statistical analysis
Data were analysed using SPSS software (version 17.0, SPSS, Inc., Chicago, IL). Comparisons between subjects with and without increased arterial stiffness were performed using Pearson’s chi-square analysis for categorical variables and the Student t-test for continuous variables, as appropriate. Because there was a significant interaction between the presence of NAFLD and different glycaemic status for the association between arterial stiffness with significant terms of ((NAFLD × pre-diabetes); p = 0.001) and ((NAFLD × NDD); p = 0.036), we used stratified analysis to assess the influence of mild and moderate to severe NAFLD on the risk of increased arterial stiffness in subjects with NGT, pre-diabetes and NDD after adjustment for age, gender, BMI, lifestyle (smoking, alcohol and exercise), newly diagnosed hypertension, TC to HDL-C ratio and FPG. p < 0.05 was considered to be statistically significant.
Results
A total of 4860 subjects were included for the final analysis. The overall prevalence rates of NAFLD and increased arterial stiffness were 38.0% and 33.1%, respectively. The baseline characteristics of the group with and without increased arterial stiffness are shown in Table 1. There was a significant difference in the prevalence of mild and moderate to severe NAFLD between subjects with and without increased arterial stiffness. Subjects with increased arterial stiffness (baPWV ⩾ 1400 cm/s) were older and predominantly male and had a higher BMI, SBP, DBP, TC, TG, FPG, 2h-PG, HbA1c, AST, ALT and creatinine level, but a lower HDL-C level, as compared to subjects with baPWV<1400 cm/s. The prevalence of increased arterial stiffness in the groups with NGT, pre-diabetes and NDD was 19.2%, 40.9% and 70.5%, respectively, while the prevalence of NAFLD was 24.0%, 47.5% and 68.6%, respectively (Table 2).
Comparison of clinical parameters of subjects with and without increased arterial stiffness.
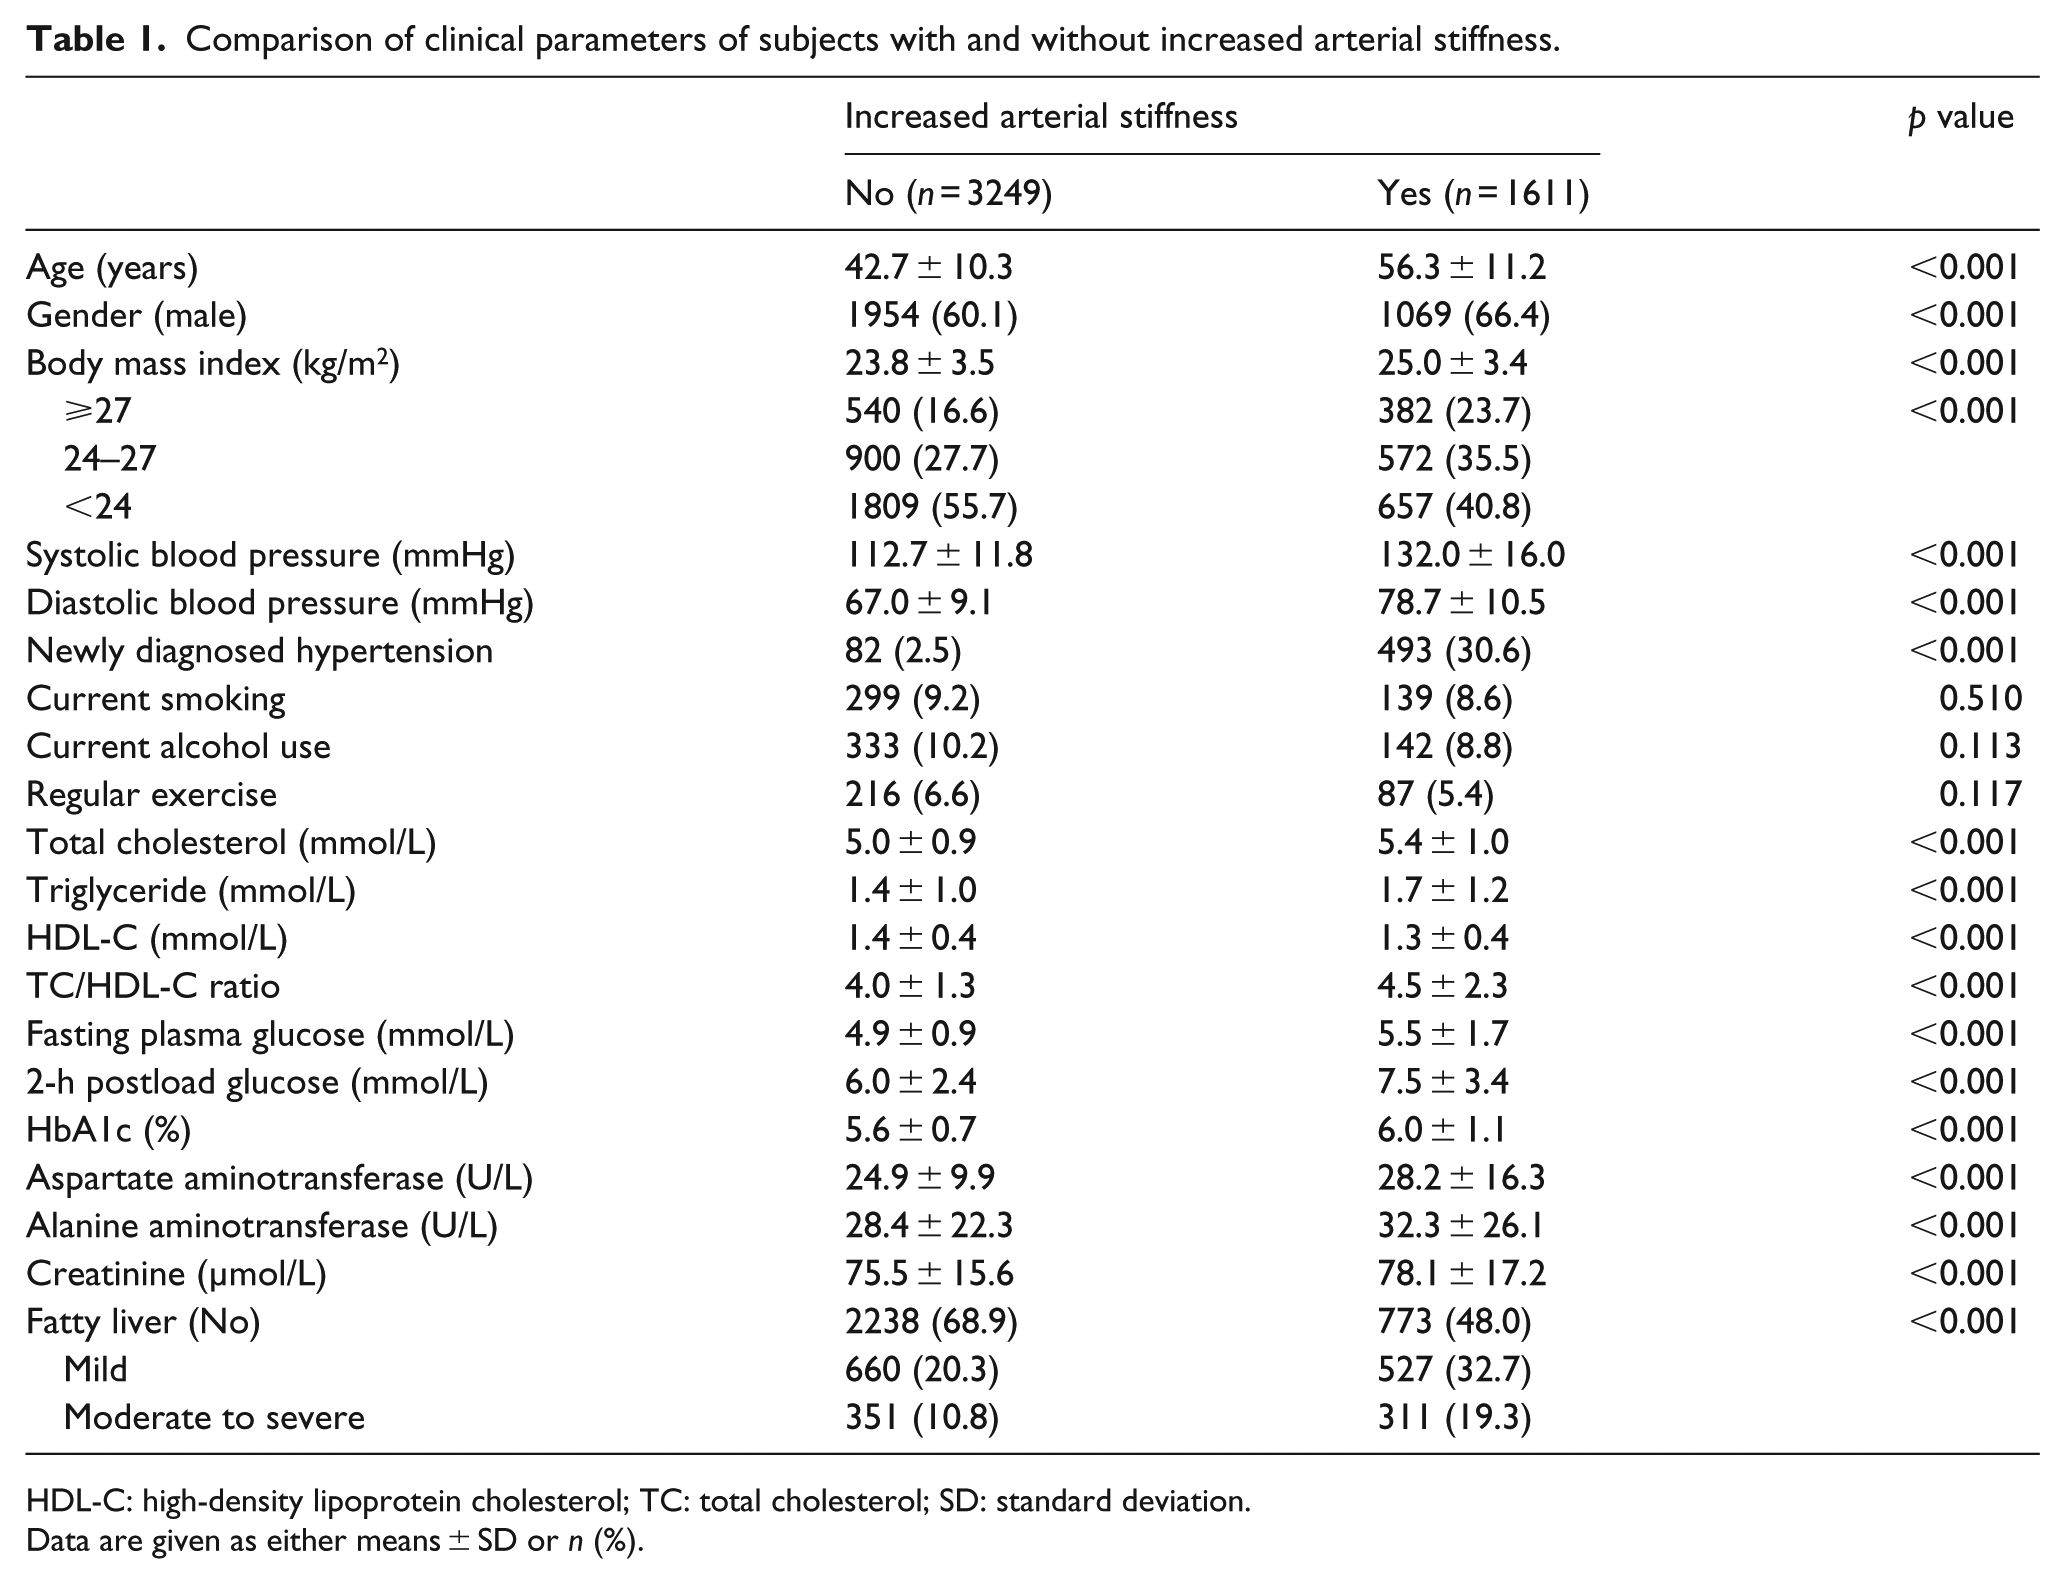
HDL-C: high-density lipoprotein cholesterol; TC: total cholesterol; SD: standard deviation.
Data are given as either means ± SD or n (%).
Comparisons of non-alcoholic fatty liver disease and increased arterial stiffness among subjects with different glycaemic status.
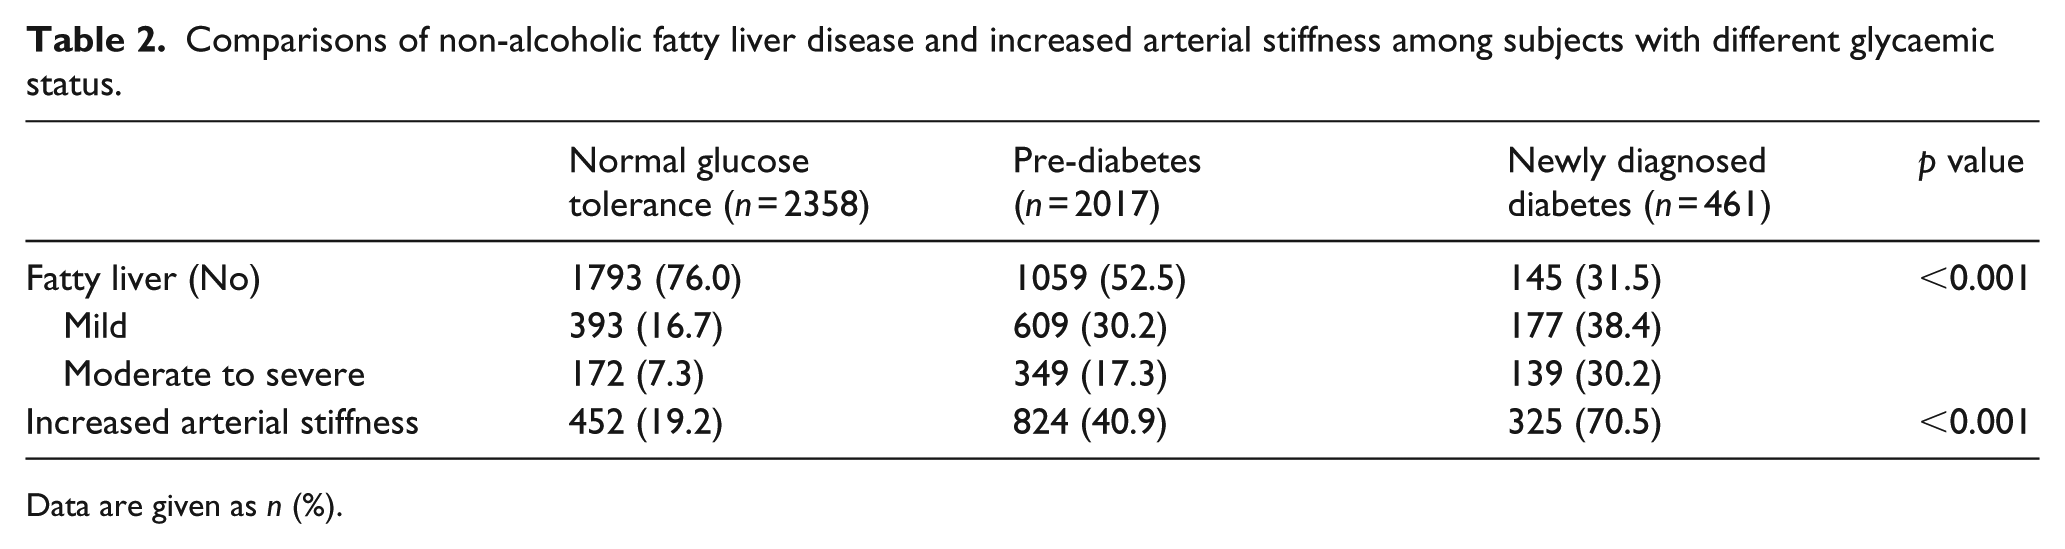
Data are given as n (%).
Multiple logistic regression analysis was used to examine the effects of mild and moderate to severe NAFLD on increased arterial stiffness with adjustment for other clinical variables in subjects with different glycaemic status. Table 3 shows that in NGT subjects, age (odds ratio (OR) = 1.11, 95% confidence interval (CI) = 1.10–1.13), mild (OR = 2.02, 95% CI = 1.43–2.84) and moderate to severe (OR = 2.15, 95% CI = 1.33–3.46) NAFLD, current smoking (OR = 1.79, 95% CI = 1.19–2.71), newly diagnosed hypertension (OR = 14.03, 95% CI = 8.60–22.87), FPG (OR = 1.02, 95% CI = 1.00–1.04) and TC/HDL-C ratio (OR = 1.28, 95% CI = 1.13–1.44) are independently associated with increased arterial stiffness when adjusting for gender, BMI, alcohol use and regular exercise. In the pre-diabetes group, mild (OR = 1.24, 95% CI = 0.95–1.63) and moderate to severe (OR = 1.18, 95% CI = 0.82–1.69) NAFLD are not associated with increased arterial stiff-ness after adjustment for age, gender, BMI, smoking, alcohol use, regular exercise, FPG, TC/HDL-C ratio and newly diagnosed hypertension. In the NDD group, both mild (OR = 1.39, 95% CI = 0.71–2.73) and moderate to severe (OR = 1.78, 95% CI = 0.81–3.94) NAFLD are not independently related to increased arterial stiffness after adjustment for other clinical variables.
Multiple logistic regression models for the relationship between NAFLD and increased arterial stiffness by different glycaemic status.
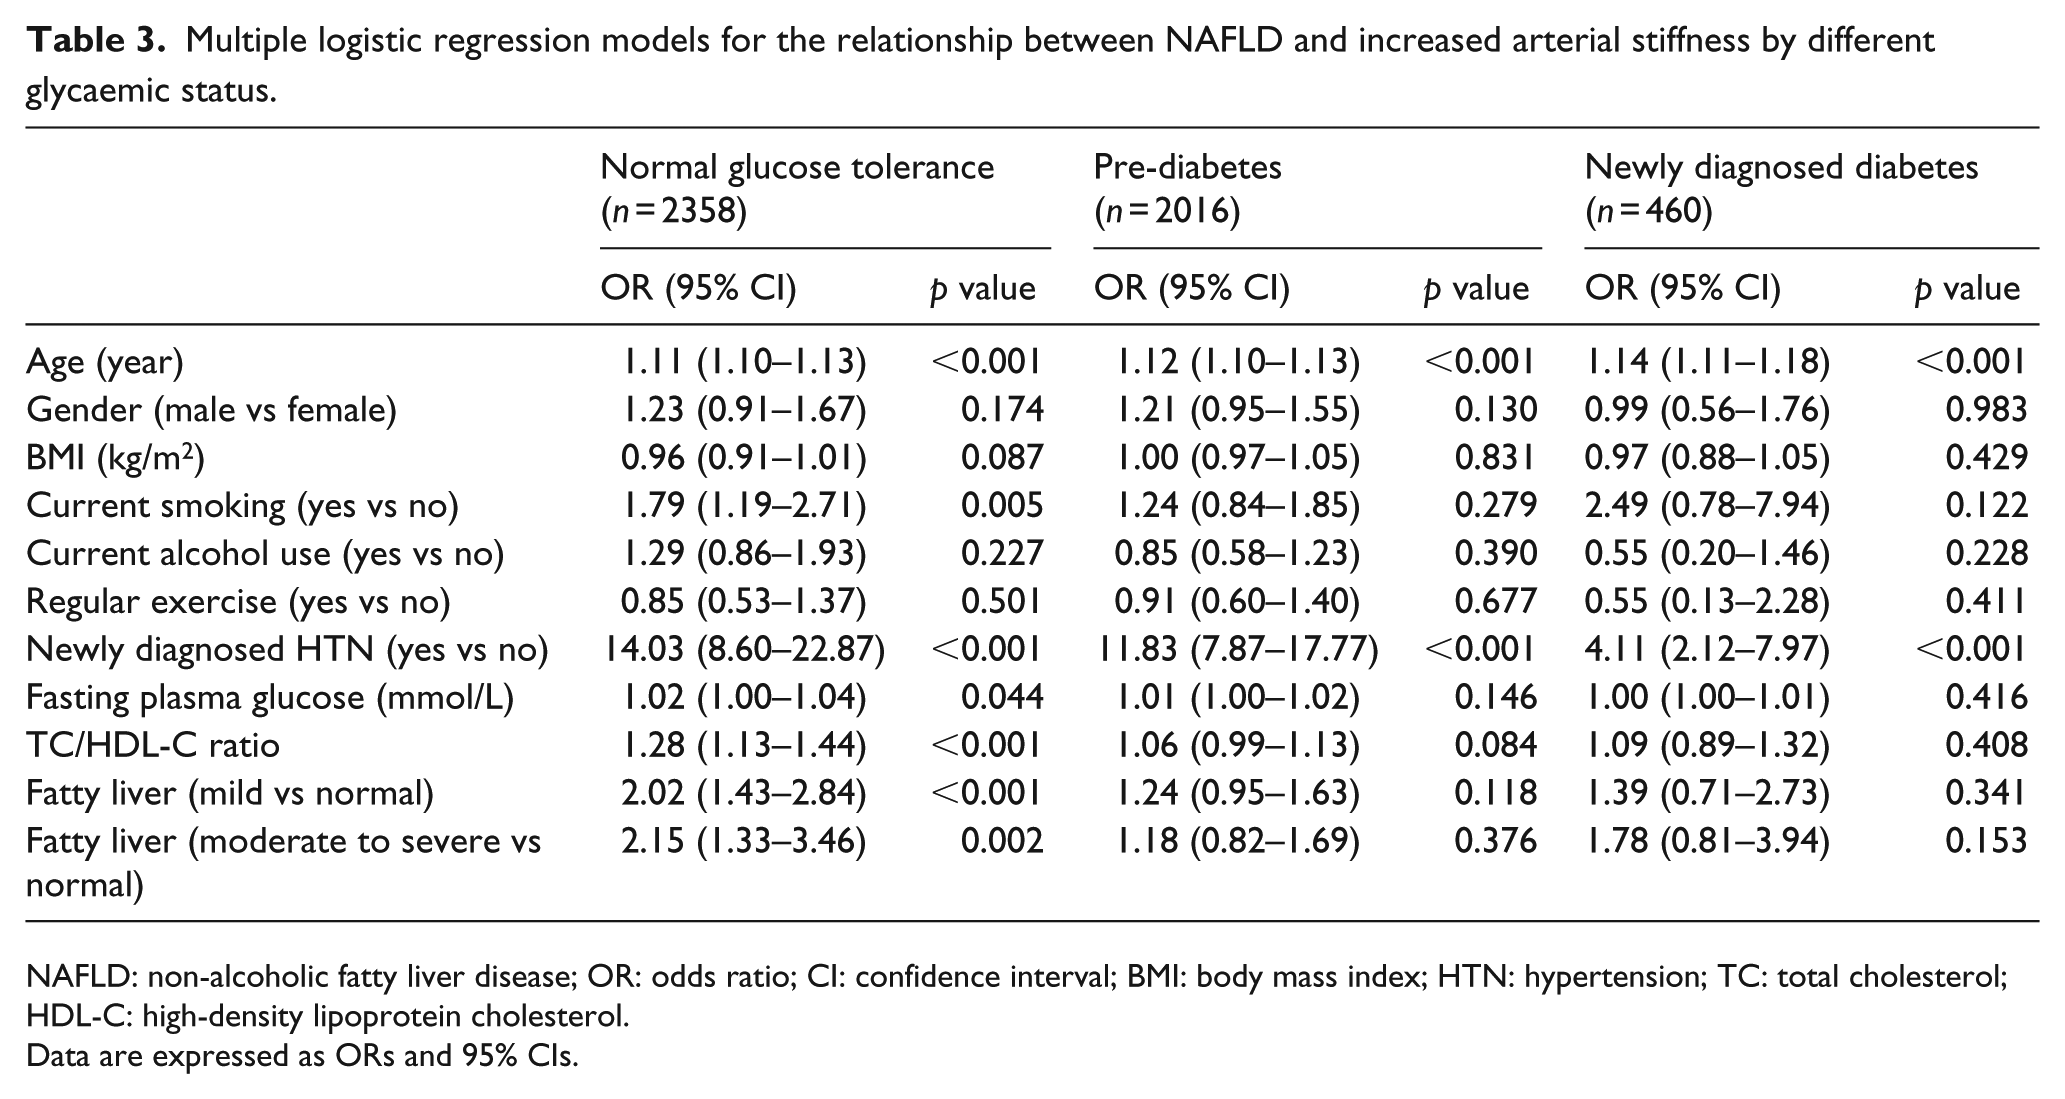
NAFLD: non-alcoholic fatty liver disease; OR: odds ratio; CI: confidence interval; BMI: body mass index; HTN: hypertension; TC: total cholesterol; HDL-C: high-density lipoprotein cholesterol.
Data are expressed as ORs and 95% CIs.
Finally, we examined the association between NFS and increased arterial stiffness. In univariate analysis, subjects with increased arterial stiffness had a higher NFS than those without. The proportion of low, intermediate and high NFS was 80.7% (2608/3232), 19.0% (613/3232) and 0.3% (11/3232) in subjects without increased arterial stiffness and 49.3% (789/1601), 47.2% (755/1601) and 3.0% (57/1601) in subjects with increased arterial stiffness, respectively. In multivariate analysis, we merged subjects with intermediate and high NFS into one group (intermediate–high NFS), because of small number of subjects with high NFS. After adjustment of other variables, subjects with intermediate–high NFS did not have a significantly higher risk of increased arterial stiffness as compared to subjects with low NFS (data not shown).
Discussion
Most previous studies have shown a positive association between NAFLD and arterial stiffness,7,12–15 except for one study that was carried out in a hypertensive population. 11 With regard to subjects with different glycaemic status, these earlier works found a positive association between NAFLD and increased arterial stiffness in non-hypertensive and non-diabetic individuals, but their subjects may have included those with pre-diabetes and NGT. In this study, we excluded subjects with a history of diabetes in order to reduce the possible confounding effect of treatment response on the association between NAFLD and increased arterial stiffness in subjects with NDD. To the best of our knowledge, this study is the first to show that there is a positive association between both mild and moderate to severe NAFLD with increased arterial stiffness in subjects with NGT but not pre-diabetes and NDD. This suggests that the effect of NAFLD, even mild NAFLD, on arterial stiffness is apparent in subjects with NGT, and this effect seems to be attenuated in those with NDD and even pre-diabetes possibly due to the overriding effect of pre-diabetes/diabetes on arterial stiffness. Since most subjects with pre-diabetes/diabetes have some degree of NAFLD and also arterial stiffness, possibly resulting in reduced statistical power in those with pre-diabetes/diabetes to show the association of NAFLD with increased arterial stiffness. As for the relationship between NFS and arterial stiffness, their insignificant association may be related to that most of our study subjects did not have apparent hepatic fibrosis.
Several possible mechanisms, including subclinical inflammation,22–24 increased oxidative stress 25 and low adiponectin levels,26,27 have been suggested as the links between NAFLD and arterial stiffness. NAFLD may result in excessive fat accumulation in hepatocytes and cause adipose tissue to activate nuclear factor κB 28 that may be linked to insulin resistance and increased inflammatory markers, such as high-sensitivity-C-reactive protein (hs-CRP), 22 interleukin-6 23 and tumour necrosis factor-alpha, 24 which may lead to inflammation of the arterial wall. Excessive free fatty acid production in NAFLD generates very reactive oxygen species which lead to cytokine production, lipid peroxidation of hepatocyte and hepatic inflammation, 25 also causing inflammatory responses in the arterial wall. In addition, adiponectin is an adipose tissue-secreted cytokine with anti-oxidant and anti-atherogenic properties. NAFLD is related to low adiponectin levels,26,27 which are associated with increased arterial stiffness. 29
Diabetes subjects were found to exhibit increased inflammation and oxidative stress but diminished adiponectin levels.30,31 In addition, acute-phase reactants, such as CRP, fibrinogen and white blood cell, are associated with arterial stiffness in patients with type 2 diabetes. 32 Compared with a group of NGT subjects, one study found that a group with IFG had higher hs-CRP and oxidative stress levels, as shown by malondialdehyde. 33 It seems that inflammation, oxidative stress and low adiponectin levels may play an important role in the link between hyperglycaemic status and arterial stiffness, and thus, the additional effect of NAFLD is insignificant. However, the actual reason for the insignificant association between NAFLD and increased arterial stiffness in hyperglycaemic status needs further study.
In this work, age and newly diagnosed hypertension were independently related to arterial stiffness in three different glycaemic status, and these findings are consistent with previous studies.34,35 Current smoking was related to arterial stiffness only in the NGT group, but not in the pre-diabetes and NDD groups. However, this may be related to the low statistical power due to the relatively small sample size in the NDD group, and the increased mortality rates in subjects with pre-diabetes and NDD.
This study has some limitations, as follows. First, it was a cross-sectional work and thus cannot establish causality between NAFLD and arterial stiffness. Second, this study uses baPWV as a measurement of arterial stiffness instead of cfPWV, the gold standard measurement of arterial stiffness. However, both cfPWV and baPWV exhibit similar associations with cardiovascular disease risk factors and clinical events.4,36 Third, liver biopsy, the gold standard measurement of the severity of NAFLD, is not used in this study as it is too invasive for an apparently health population. Abdominal ultrasonography represents the first-line imaging examination with regard to chronic liver diseases, as it is cheap, not invasive and widely available. As compared to pathology findings, the sensitivity of ultrasound for the diagnosis of NAFLD ranges between 57% and 94%, while the specificity is in the range of 84%–88%.19,37 The lower sensitivity and specificity of ultrasound will lead to non-differentiated misclassifications, which may weaken the apparent relationship between NAFLD and arterial stiffness, so the real association will be more significant than seen in this analysis. Fourth, previous studies revealed that albuminuria was also a confounding effect on the relationship between NAFLD and arterial stiffness. However, the albuminuria data were not available in this study. Fifth, the ultrasound examination was conducted by two experienced radiologists, and the bias of inter-observer cannot be completely ruled out. Finally, the study subjects were confined to a Taiwanese population, and the findings may not be generalizable to other ethnicities.
Conclusion
Both mild and moderate to severe NAFLD are associated with a higher risk of increased arterial stiffness in subjects with NGT, but not pre-diabetes and NDD. It is suggested that the effect of NAFLD, even mild NAFLD, on arterial stiffness is apparent in subjects with NGT, and this effect seems to be attenuated in subjects with NDD and even pre-diabetes.
Footnotes
Acknowledgements
The authors thank all the members for their help in the Department of Family Medicine, National Cheng Kung University Hospital.
Declaration of conflicting interests
The authors declare no conflicts of interest.
Funding
This research received no specific grant from any funding agency in the public, commercial or not-for-profit sectors.