
Abstract
This study aimed to investigate atherosclerotic mediators’ expression levels in M1 and M2 macrophages and to focus on the influence of diabetes on M1/M2 profiles. Macrophages from 36 atherosclerotic patients (19 diabetics and 17 non-diabetics) were cultured with interleukin-1β (IL-1β) or IL-4 to induce M1 or M2 phenotype, respectively. The atherosclerotic mediators’ expression was evaluated by quantitative reverse transcription-polymerase chain reaction (RT-PCR). The results showed that M1 and M2 macrophages differentially expressed mediators involved in proteolysis and angiogenesis processes. The proteolytic balance (matrix metalloproteinase-9 (MMP-9)/tissue inhibitor of metalloproteinase-1 (TIMP-1), MMP-9/plasminogen activator inhibitor-1 (PAI-1) and MMP-9/tissue factor pathway inhibitor-2 (TFPI-2) ratios) was higher in M1 versus M2, whereas M2 macrophages presented higher angiogenesis properties (increased vascular endothelial growth factor/TFPI-2 and tissue factor/TFPI-2 ratios). Moreover, M1 macrophages from diabetics displayed more important proangiogenic and proteolytic activities than non-diabetics. This study reveals that M1 and M2 macrophages could differentially modulate major atherosclerosis-related pathological processes. Moreover, M1 macrophages from diabetics display a deleterious phenotype that could explain the higher plaque vulnerability observed in these subjects.
Introduction
Diabetic patients have an increased cardiovascular risk, in relation to an earlier onset and more extensive atherosclerosis. 1 Some studies suggest that this risk is related to the increased plaque vulnerability in diabetic patients. Indeed, atherosclerotic plaques from diabetic patients present features of unstable plaques, such as high macrophage infiltration and inflammatory, proteolytic and angiogenic activities, all related to increased neo-angiogenesis. 2
Macrophages, derived from monocyte differentiation, play a key role in all these processes. In particular, they express several mediators involved in proteolytic and/or angiogenic processes such as vascular endothelial growth factor (VEGF), tissue factor (TF), matrix metalloproteinase-9 (MMP-9) and the major protease inhibitors, tissue factor pathway inhibitor-1 and -2 (TFPI-1, -2), tissue inhibitor of metalloproteinase-1 (TIMP-1) and plasminogen activator inhibitor-1 (PAI-1).3–5
Several studies have suggested phenotypic and functional diversity of macrophages according to microenvironment signals.6,7 Two predominant macrophage subtypes have been described: M1 (classically activated macrophages) with pro-inflammatory proprieties and M2 (alternatively activated macrophages) which dampen inflammation and promote tissue repair. Previously, the presence of M1 and M2 macrophages in human atherosclerotic lesions has been reported. 8 These macrophages exert different functions in the control of inflammation, cholesterol metabolism and iron handling.8,9 However, implication of these macrophage phenotypes in atherosclerotic plaque progression and instability has only recently begun to be investigated and data about the impact of diabetes on macrophage polarization, in relation to cardiovascular complications, are just emerging. 10
In this study, we aimed to compare the expression of angiogenic and proteolytic mediators in M1 and M2 macrophages from atherosclerotic patients and focus on whether the diabetic status influences the M1/M2 polarization as well as the expression of these mediators in macrophage subtypes.
Methods
Subjects
A total of 36 atherosclerotic patients were included in this study. The presence of atherosclerosis was diagnosed by coronary and carotid angiography. All patients presented significant coronary artery disease (CAD) defined by a stenosis of >75% in ⩾1 of the main coronary arteries and/or significant carotid artery stenosis (CAS) (>70%). Data from patients were prospectively collected and included cardiovascular medications and risk factors such as male sex, age, diabetes mellitus (fasting plasma glucose ⩾1.26 g/L and/or use of glucose-lowering medications), dyslipidaemia (serum triglyceride levels ⩾1.5 g/L or high-density lipoprotein (HDL) cholesterol <0.4 g/L in men or <0.5 g/L in women, and/or current treatment), obesity (body mass index (BMI) value >30 kg/m2) and smoking history (current or past smokers vs non-smokers). Additional data included history of myocardial infarction, stroke and peripheral arterial disease (PAD; patients with Fontaine claudication stage ⩾IIa or and/or history of treatment for chronic limb ischaemia) and left ventricular ejection fraction. Patients were included in this study during consultation, far from any surgery. At the inclusion, none of the patients had any clinical symptoms of systemic inflammation. The study was approved by the local ethics committee and was carried out in agreement with the Declaration of Helsinki. Written informed consent was obtained from all patients.
Determination of blood parameters
Blood samples were collected from all patients after overnight fasting by venipuncture. After centrifugation, supernatants were immediately stored at −80°C until analysis. Interleukin-6 (IL-6) and insulin were quantified by enzyme-linked immunosorbent assay (ELISA) (R&D Systems, Basel, Switzerland) according to the manufacturer’s instructions. High-sensitivity C-reactive protein was measured by immunonephelemetric method (ΒΝ™ II; Siemens, Schwalbach, Germany) and glycaemia, creatininaemia and lipid parameters were measured using enzymatic assays (Modular®, Roche Diagnostic Systems and Architect®, respectively; Abbott Diagnostics, Abbott Park, IL). Glycated haemoglobin (HbA1c) was determined in whole blood by a chromatography assay (Variant™ II Turbo; Bio-Rad, Hercules, CA), fibrinogen by the Clauss method (Sysmex CA-7000 Coagulation Analyser; Sysmex, Kobe, Japan) and leucocyte count using an automatic cell counter (Sysmex XE-2100; Sysmex). Insulin resistance was assessed by the homeostasis model assessment (HOMA-IR) according to the formula: HOMA-IR (mmol/L × µU/mL) = fasting glucose (mmol/L) × fasting insulin (µU/mL)/22.5.
Isolation of human peripheral blood monocytes and monocyte differentiation
Peripheral blood mononuclear cells (PBMC) were isolated by density centrifugation of heparinized blood on Ficoll-Paque (Pharmacia Biotech, Uppsala, Sweden). 11 Cells were suspended in culture medium Roswell Park Memorial Institute medium (RPMI) 1640 supplemented with 40 µg/mL gentamicin and 2 mM glutamine (Sigma–Aldrich, Saint Louis, MO). The PBMC viability was >95%, as determined by trypan blue exclusion. Cells were seeded in 24-well plates and incubated for 2 h at 37°C with 5% CO2. Monocytes were enriched by adherence and by eliminating non-adherent lymphocytes. Monocytes were then cultured with fresh complete medium (RPMI 1640 with antibiotics supplemented with 10% human serum (Eurobio, Courtaboeuf, France)) containing recombinant human IL-1β (10 ng/mL; PeproTech, Inc., Rocky Hill, NJ) or IL-4 (10 ng/mL; PeproTech) to obtain M1 and M2 macrophages, respectively. After 7 days of culture, macrophages were maintained in serum-free RPMI without stimulation by cytokines for 24 h before RNA extraction.
RNA extraction and analysis
Macrophages were homogenized in Trizol reagent (Life Technologies, Carlsbad, CA). Total RNA was extracted using the chloroform/isopropanol/ethanol method. A measure of 1 µg of total RNA was reverse transcribed with the High-Capacity complementary DNA (cDNA) Reverse Transcription kit (Life Technologies) according to manufacturer’s protocol. The obtained cDNA was analysed by real-time polymerase chain reaction (PCR) performed using an Applied Biosystems 7900HT Fast Real-time PCR system (Life Technologies). For TFPI, TFPI-2 and ABL transcripts, the reaction solution, containing 5 µL of cDNA, the forward and reverse primers, the probe and 12.5 µL of TaqMan Universal PCR Master Mix (Life Technologies), was prepared in a total volume of 25 µL. For other transcripts, ready-to-use mix containing both primers and the probe (TaqMan Gene Expression Assay; Life Technologies) was used: tumour necrosis factor-α (TNFα): Hs00174128_m1; IL-1β: Hs01555410_m1; mannose receptor (MR): Hs00267207_m1; Factor XIII A subunit: Hs00173388_m1; CD200 Receptor (CD200R): Hs00793597_m1; Stabilin 1 (STAB1): Hs01109068_m1; IL-10: Hs00961622_m1; MMP-9: Hs00234579_m1; TIMP-1: Hs00171558_m1; PAI-1: Hs01126604_m1; TF: Hs00175225_m1; and VEGF: Hs00900055_m1. The reaction solution contained 5 µL cDNA, 1 µL of Expression Assay mix and 10 µL of TaqMan Universal PCR Master Mix (Life Technologies) in a total volume of 20 µL. Primers and probes for TFPI and TFPI-2 were purchased from Life Technologies and those for ABL from Eurogentec (Seraing, Belgium). The nucleotide sequences of the primers and probes were as follows (forward, reverse): TFPI: 5′-GACTCCGCAATCAACCAAGGT-3′, 5′-CTGTCTGCTGGAGTGAGACACC-3′, 5′-FAM-CAGCCTTTTTGAATTTCACGGTCCCTCA-MBG-3′; TFPI-2: 5′-GCA-ACGCCAACAATTTCTACAC-3′, 5′-CGGCAAACTTTGGGAACTTTT-3′, 5′-FAM-TTGCGACGATGCTTGCTGGAGG-TAMRA-3′, ABL: 5′-TGGAGATAA-CACTCTAAGCATAACTAAAGGT-3′, 5′-GATGTAGTTGCTTGGGACCCA-3′, 5′-FAM-CCATTTTTGGTTTGGGCTTCACACCATT-TAMRA-3′.
The expression of different genes was normalized to the expression of ABL, used as housekeeping gene. The relative quantification of the transcripts was calculated by the cycle threshold (Ct) comparative method using the formula 2−ΔΔCt. For each sample, detection of PCR products was performed separately and in triplicate.
Collection of endarterectomy specimens and immunohistochemical analysis
Immediately after endarterectomy, representative parts of carotid plaques from non-diabetic and diabetic patients were embedded in Neg-50 frozen section medium (Microm International, Waldorf, Germany), frozen in liquid nitrogen and stored at −80°C. Serial 10-µm cryosections were mounted on chrome-alum-coated slides and endogenous peroxidase activity was quenched. Macrophages were detected with anti-CD68 (Dako, Carpinteria, CA), smooth muscle cells with anti-α-actin (Dako) and endothelial cells with anti-platelet endothelial cell adhesion molecule-1 (PECAM1)/CD31 (Novus Biologicals, Littleton, CO) antibodies, using N-Histofine Simple Stain (Nichirei Biosciences Inc., Tokyo, Japan). CD68 was revealed by red staining (Nova Red; Vector Laboratories, Burlingame, CA), α-actin by grey precipitate (Vector SG) and CD31 by blue staining (5-bromo-4-chloro-3-indolyl-phosphate (BCIP)/nitroblue tetrazolium (NBT); Vector Laboratories). Adjacent sections were stained with goat polyclonal anti-human MR (Santa Cruz Biotechnology, Santa Cruz, CA) or rabbit polyclonal anti-human VEGF (Abcam, Cambridge, MA) antibody and revealed by red staining (Vector Nova Red; Vector Laboratories). Finally, sections were counterstained with haematoxylin, dehydrated through increasing ethanol concentrations and mounted with Merckoglas® medium (Merck, Darmstadt, Germany) for visualization through an inverted microscope (Eclipse Ti; Nikon, Melville, NY). Images were analysed using NIS-Elements software (Nikon): areas corresponding to the CD68+MR− (M1) and CD68+MR+ (M2) macrophages were evaluated. The neovessel density, expressed by counting discrete CD31 positive structures in each plaque, was determined as well as intensity of the positive staining for VEGF antigen.
Statistical analysis
Data are expressed as mean (standard deviation) or median (interquartile ranges) for continuous variables or as absolute number (percentage) for categorical variables. The χ2 test was applied to analyse differences in categorical variables. Regarding continuous variables, Wilcoxon’s test was performed to compare two paired-groups, Mann–Whitney U test for unpaired comparisons between two groups and Kruskal–Wallis for intergroup comparison (less than two groups). The p values were corrected in case of multiple comparisons with Bonferroni method. Correlations were performed using Spearman’s method. All statistical analyses were performed using Statistical Package for Social Sciences (SPSS) software version 20.0 (IBM SPSS Inc., Chicago, IL). All p values <0.05 were considered to be statistically significant.
Results
Patients’ characteristics
Patients with severe atherosclerotic lesions, 30 males (83%) and 6 females (17%), were stratified into two groups: the type 2 diabetic group (n = 19) and the non-diabetic group (n = 17). The patients’ clinical and biochemical characteristics are presented in Table 1. The two groups did not significantly differ according to clinical characteristics. As expected, fasting glucose, HbA1c circulating levels and HOMA-IR were significantly higher in diabetic patients. There were no significant differences concerning lipid and inflammatory parameters between the two groups.
Clinical and blood parameters in all patients and according to diabetic status.
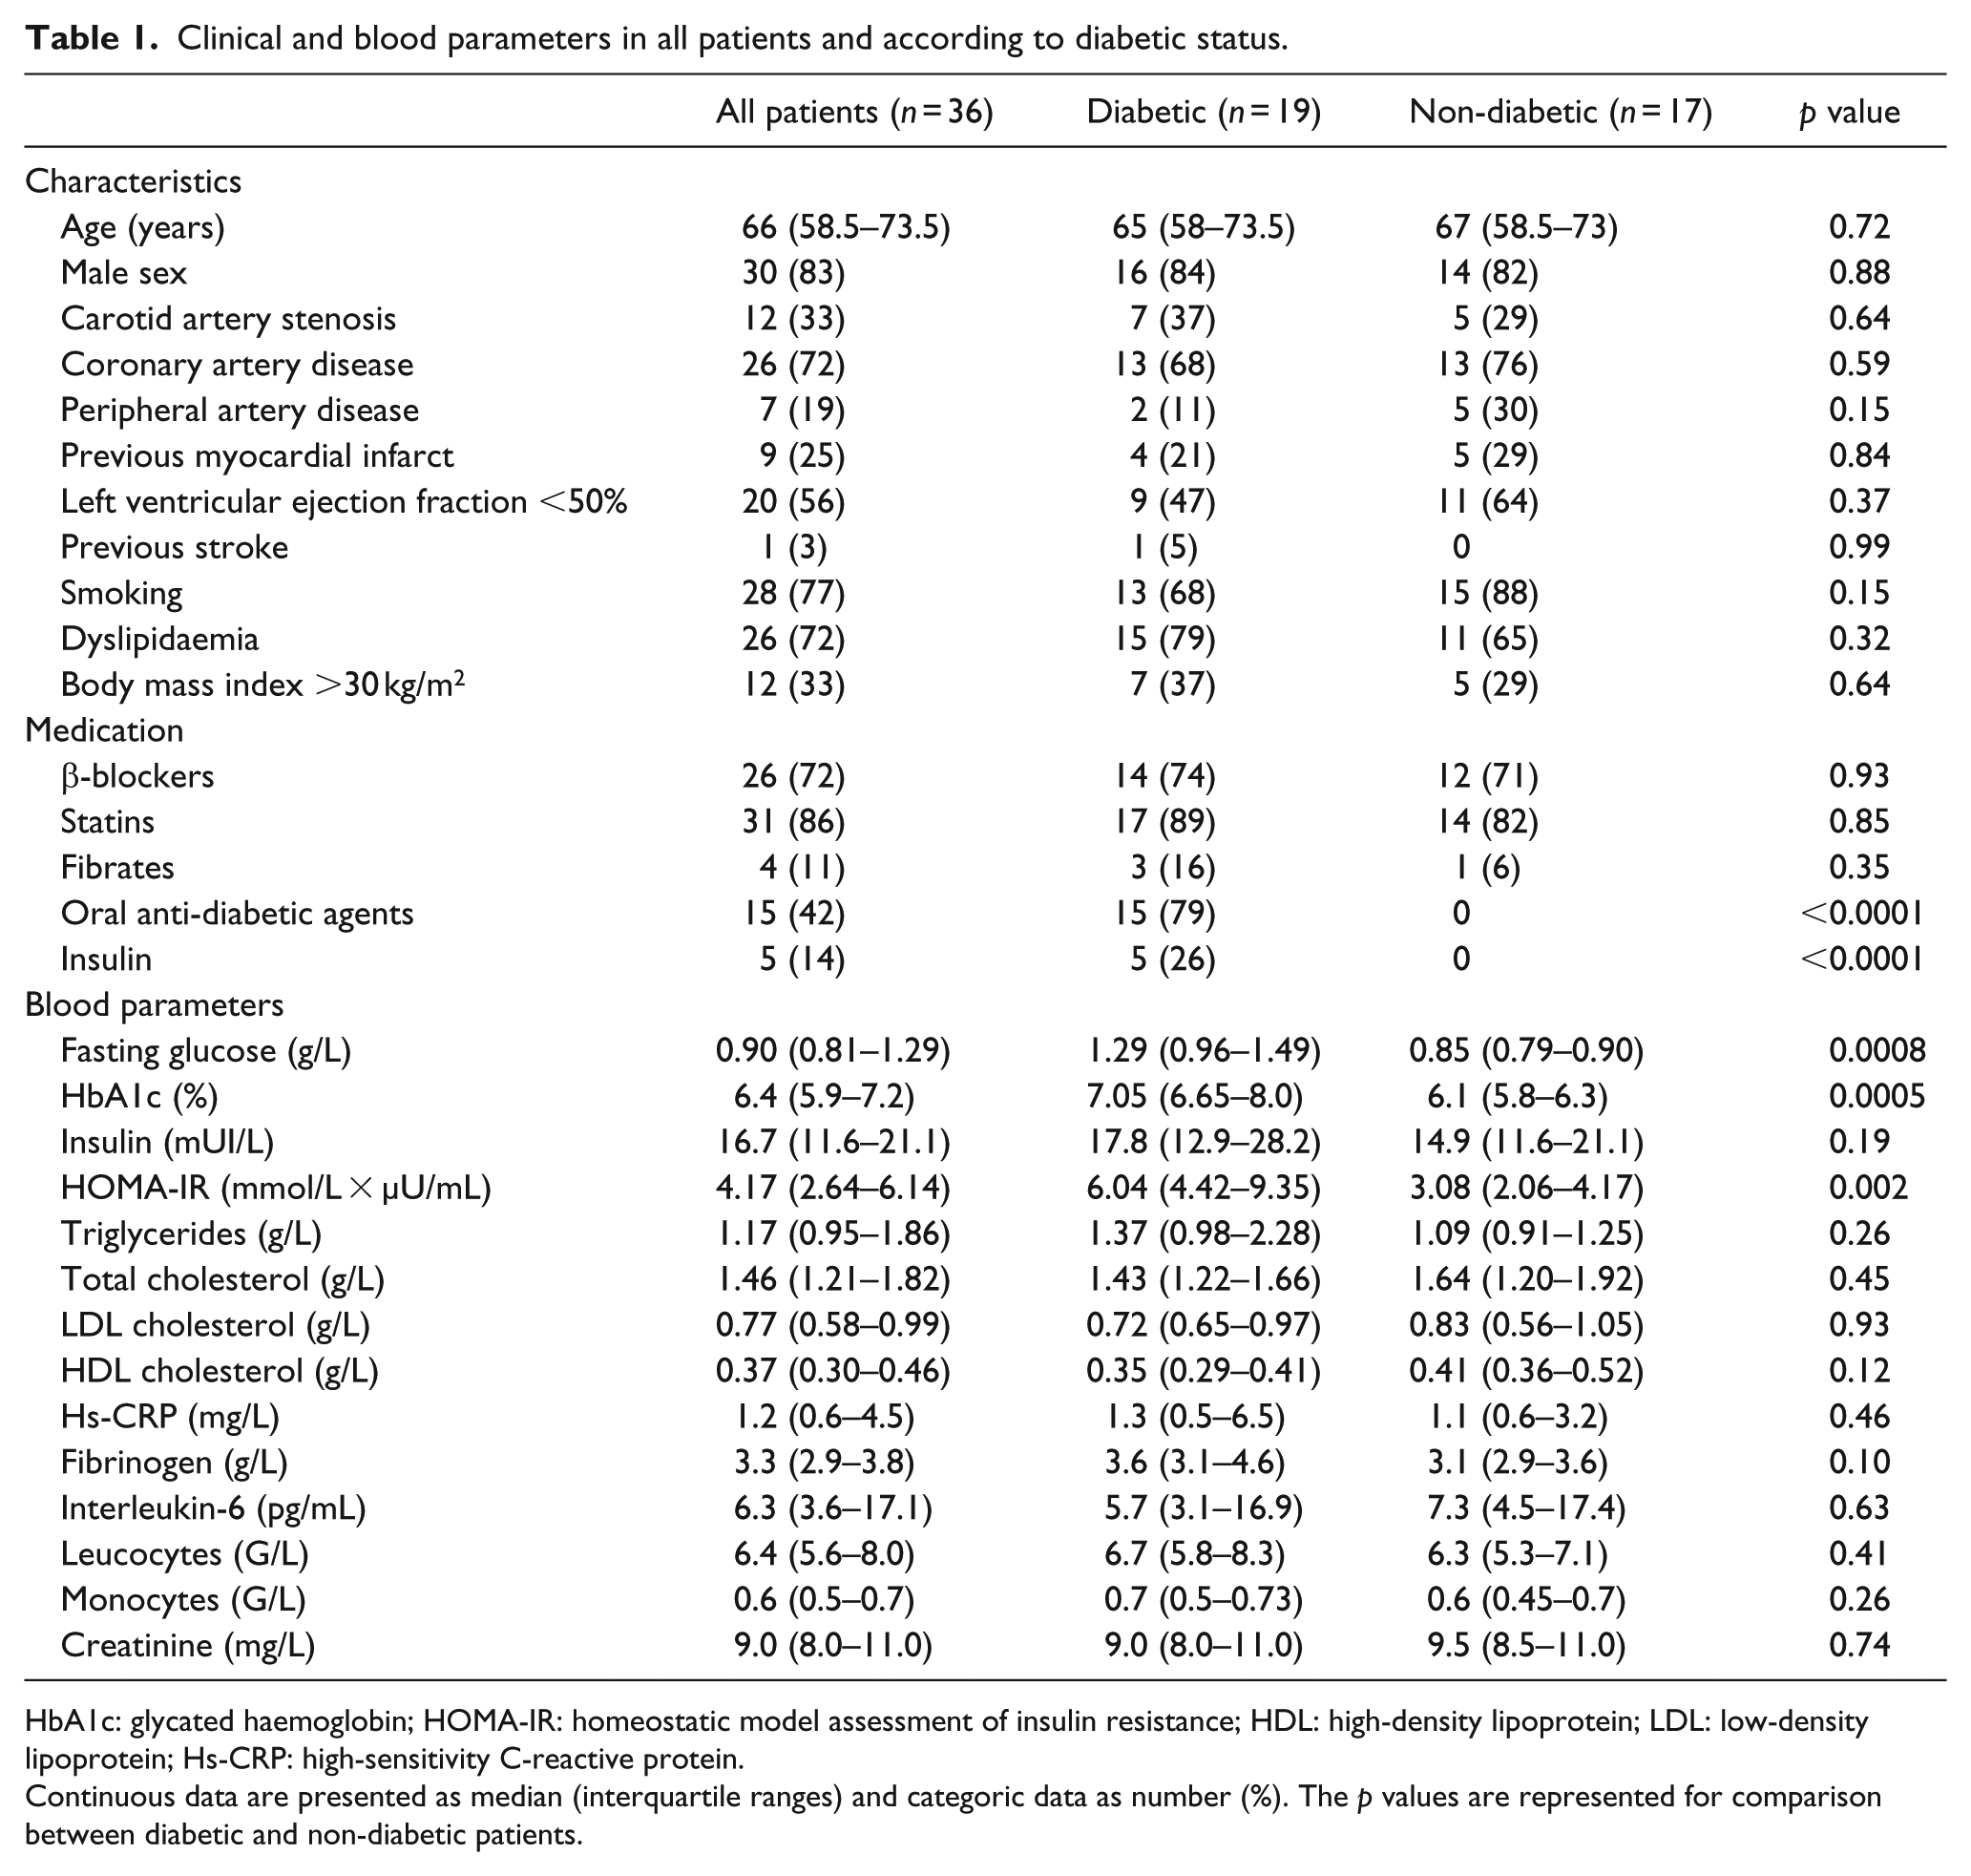
HbA1c: glycated haemoglobin; HOMA-IR: homeostatic model assessment of insulin resistance; HDL: high-density lipoprotein; LDL: low-density lipoprotein; Hs-CRP: high-sensitivity C-reactive protein.
Continuous data are presented as median (interquartile ranges) and categoric data as number (%). The p values are represented for comparison between diabetic and non-diabetic patients.
M1 and M2 polarization of monocyte-derived macrophages
Specific macrophage differentiation was validated by measuring the expression of M1 and M2 markers in cells from diabetics and non-diabetic patients. IL-1β in vitro stimulation upregulated M1 markers expression (TNF-α and IL-1β, Figure 1(a) and (b)) while IL-4 led to an increase in the expression of M2 markers such as MR, Factor XIII A-unit, CD200R, STAB1 and IL-10 (Figure 1(c) to (g)).
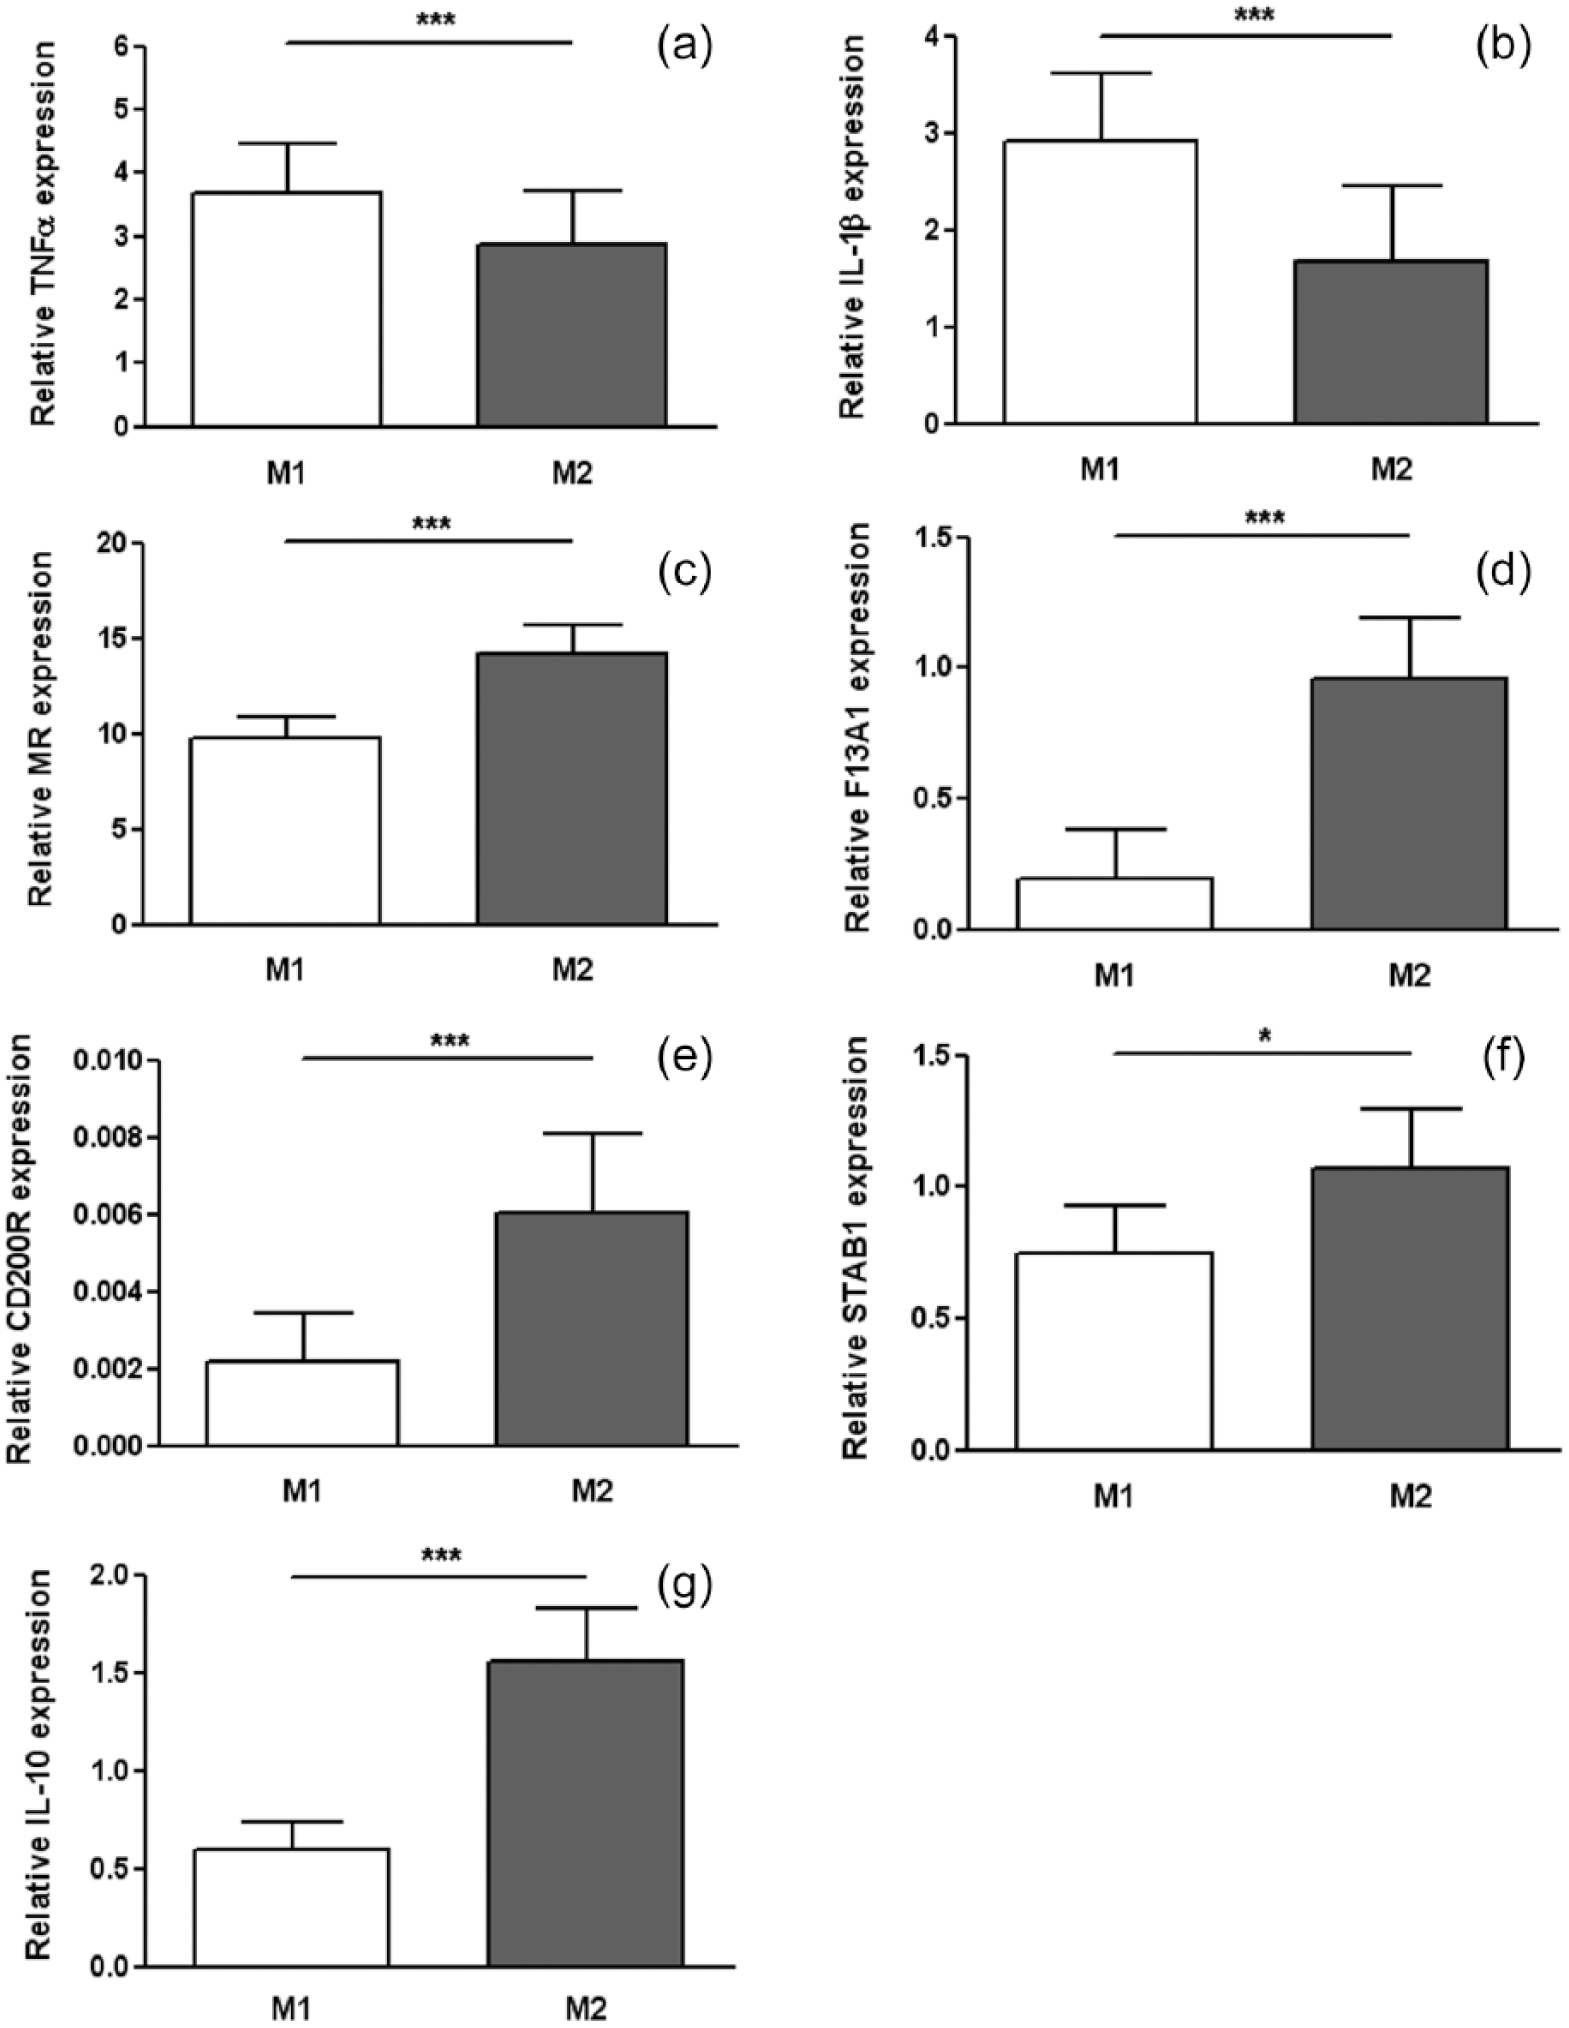
Expression levels of M1 and M2 polarization markers in monocyte-derived macrophages from atherosclerotic patients (n = 36). Expression levels were determined by quantitative RT-PCR in macrophages generated in vitro by IL-1β (10 ng/mL) or IL-4 (10 ng/mL), respectively. M1 markers: (a) TNFα and (b) interleukin-1β (IL-1β); M2 markers: (c) mannose receptor (MR), (d) Factor XIII A subunit (F13A1), (e) CD200R, (f) Stabilin-1 (STAB1) and (g) interleukin-10 (IL-10). Data are shown as mean value ± SEM (paired Wilcoxon test, ***p < 0.001, *p < 0.05).
Distinct proteolytic and angiogenic profiles of human M1 and M2 macrophages from atherosclerotic patients
Compared to M2 macrophages, M1 expressed significantly higher levels of MMP-9 as well as proteases inhibitors, TIMP-1, PAI-1 and TFPI-2 (Figure 2(a) to (d)). We also observed that M1 macrophages significantly expressed more TF (Figure 2(e)), whereas M2 macrophages significantly expressed more TFPI compared to M1 (Figure 2(f)). Finally, M2 macrophages presented significantly higher expression of VEGF, a major contributor of angiogenesis (Figure 2(g)).
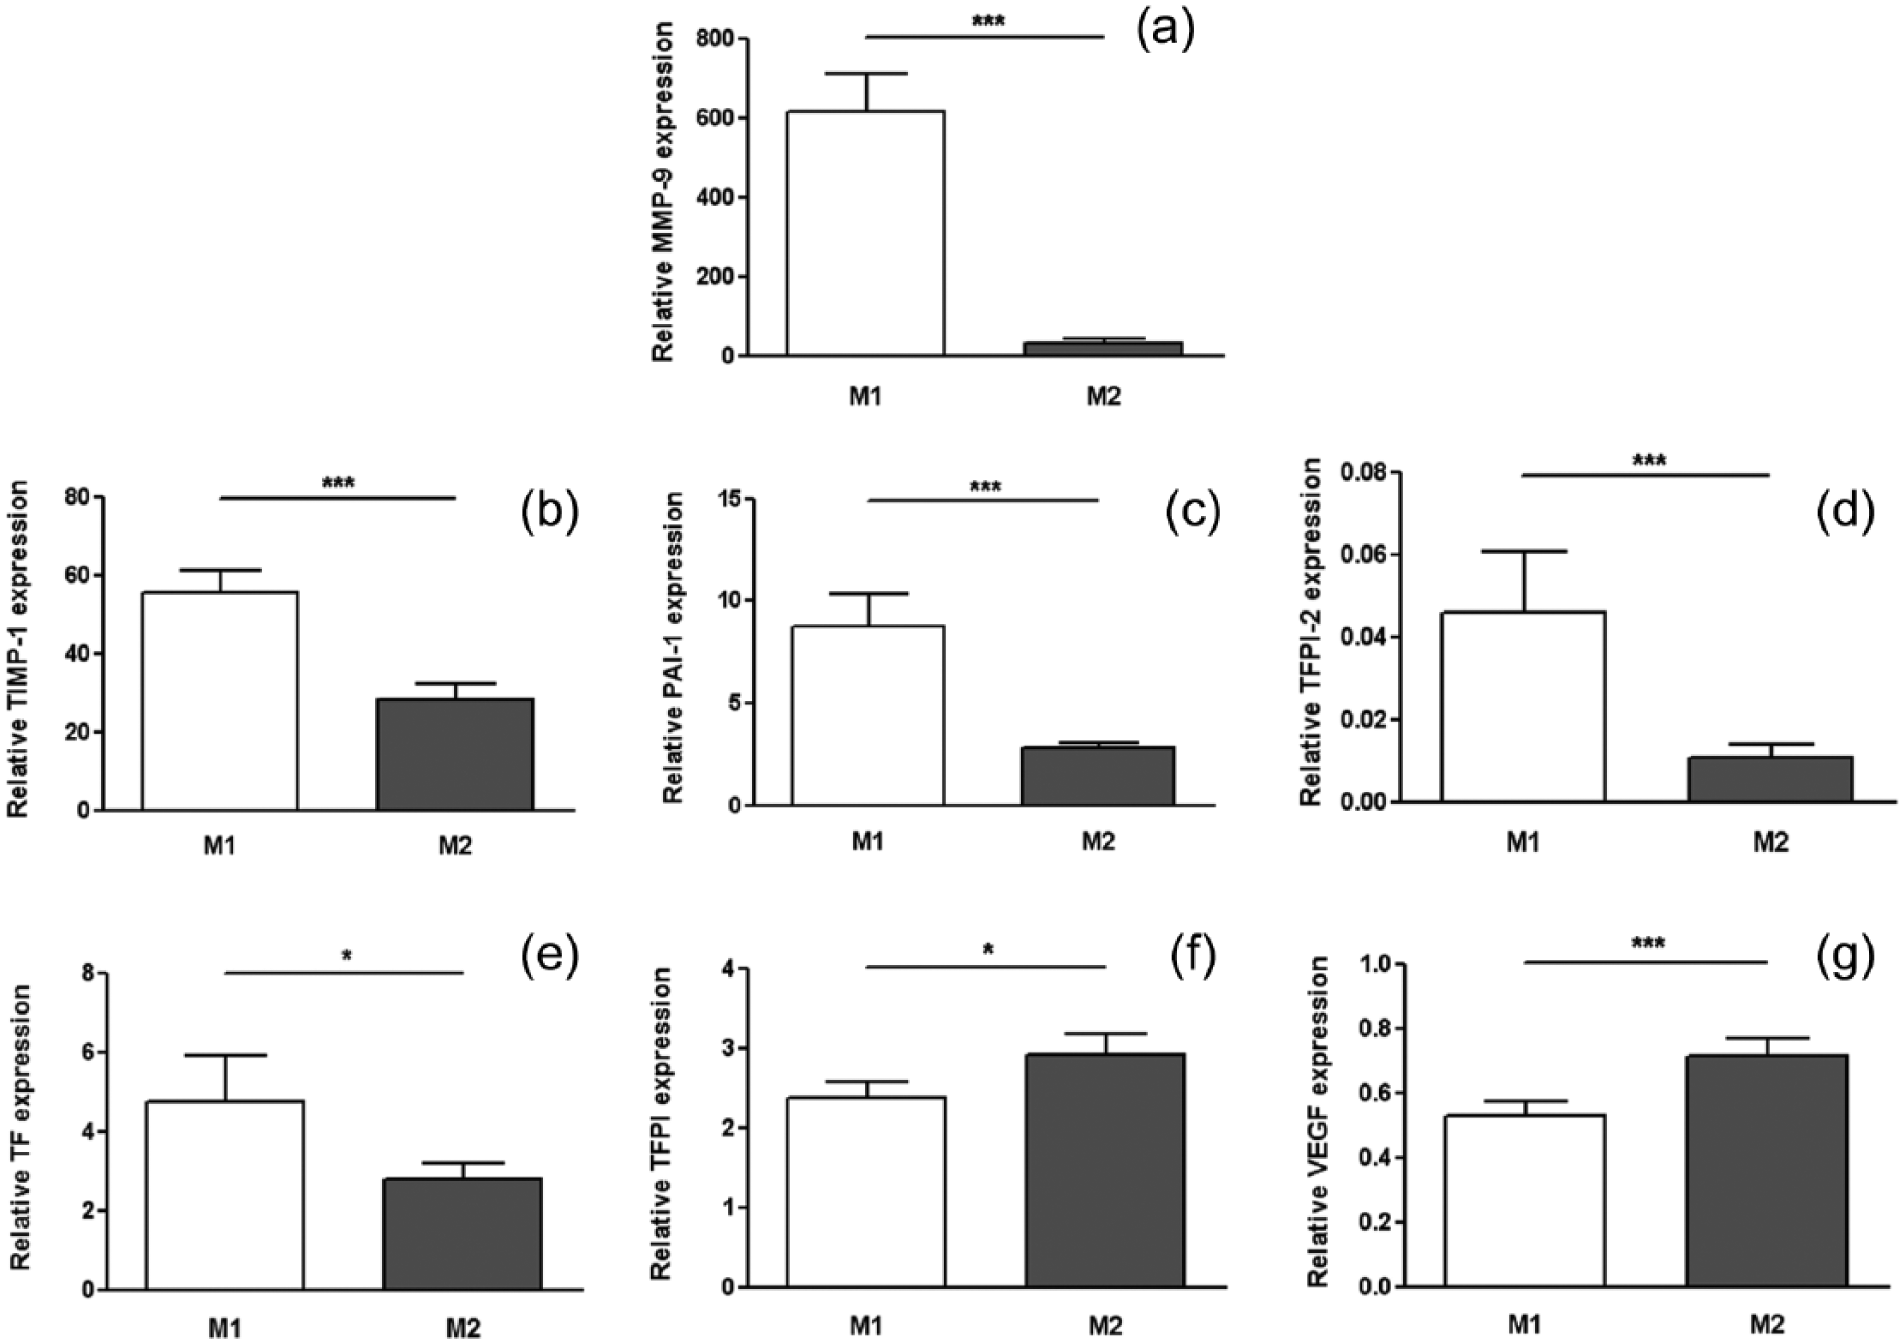
Expression of atherogenic mediators in human M1 and M2 macrophages from atherosclerotic patients. Expression levels were determined by quantitative RT-PCR in M1 and M2 macrophages: (a) MMP-9, (b) TIMP-1, (c) PAI-1, (d) TFPI-2, (e) TF, (f) TFPI and (g) VEGF. Data are shown as mean value ± SEM. Statistically significant differences are indicated (paired Wilcoxon test, ***p < 0.001, *p < 0.05).
Interestingly, the proteolytic balance expressed as MMP-9/TIMP-1, MMP-9/PAI-1 and MMP-9/TFPI-2 ratios was significantly higher in M1 macrophages compared to M2 macrophages, suggesting an implication of M1 macrophages in plaque vulnerability (Figure 3(a) to (c)). Similarly, the TF/TFPI ratio, representing the haemostatic balance, was significantly higher in M1 compared to M2 macrophages (Figure 3(d)). By contrast, since TFPI-2 is a well-known inhibitor of angiogenesis, 12 the VEGF/TFPI-2 and TF/TFPI-2 ratios were calculated and found to be higher in M2 compared to M1 macrophages (Figure 3(e) and (f)).
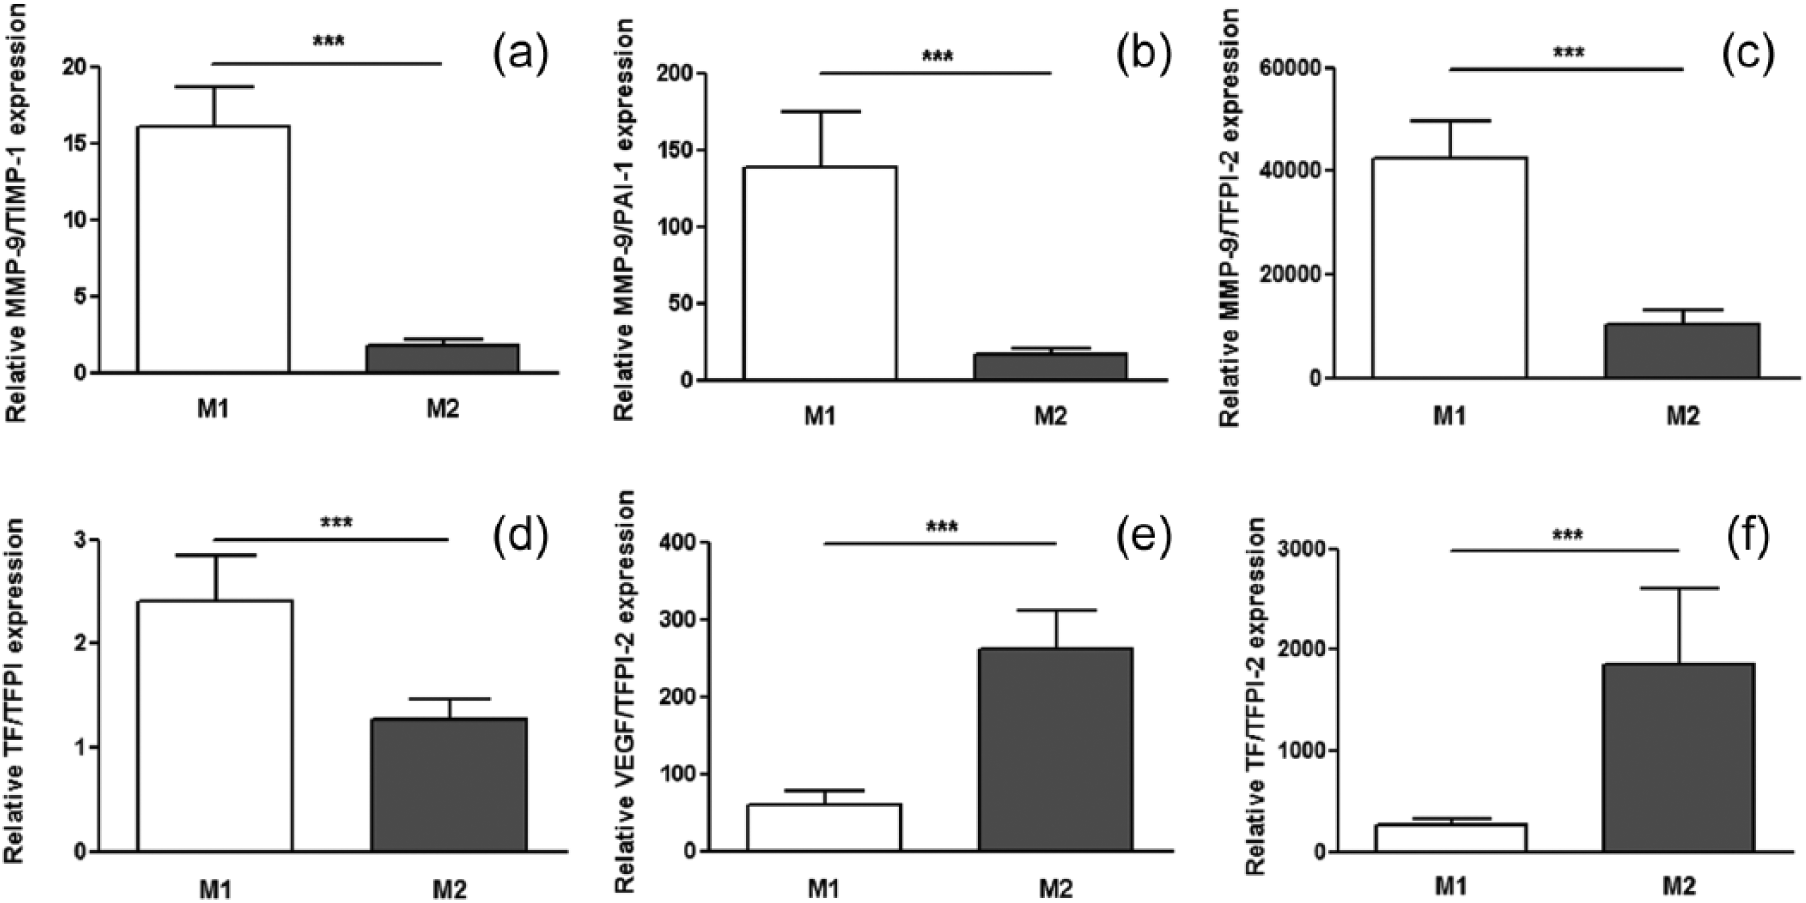
Proteolytic, haemostatic and angiogenic balance in human M1 and M2 macrophages from atherosclerotic patients. Proteolytic balance was evaluated by calculating the following ratios: (a) MMP-9/TIMP-1, (b) MMP-9/PAI-1 and (c) MMP-9/TFPI-2; haemostatic balance by (d) TF/TFPI ratio and angiogenic balance by (e) VEGF/TFPI-2 and (f) TF/TFPI-2. Data are shown as the mean value ± SEM. Statistically significant differences are indicated (paired Wilcoxon test, ***p < 0.001).
Impact of diabetes on macrophage polarization and proteolytic and angiogenic profiles
Gene expression levels of M1 markers, TNF-α and IL-1β, and of M2 markers, MR, Factor XIII A-unit, CD200R, STAB1 and IL-10, in monocyte-derived macrophages were not influenced by the diabetic status of patients, and among diabetic and non-diabetic patients, the differences between M1 and M2 markers were still significant (Table 2).
Macrophage in vitro polarization and remodelling profile of the M1/M2 phenotypes according to diabetic status.
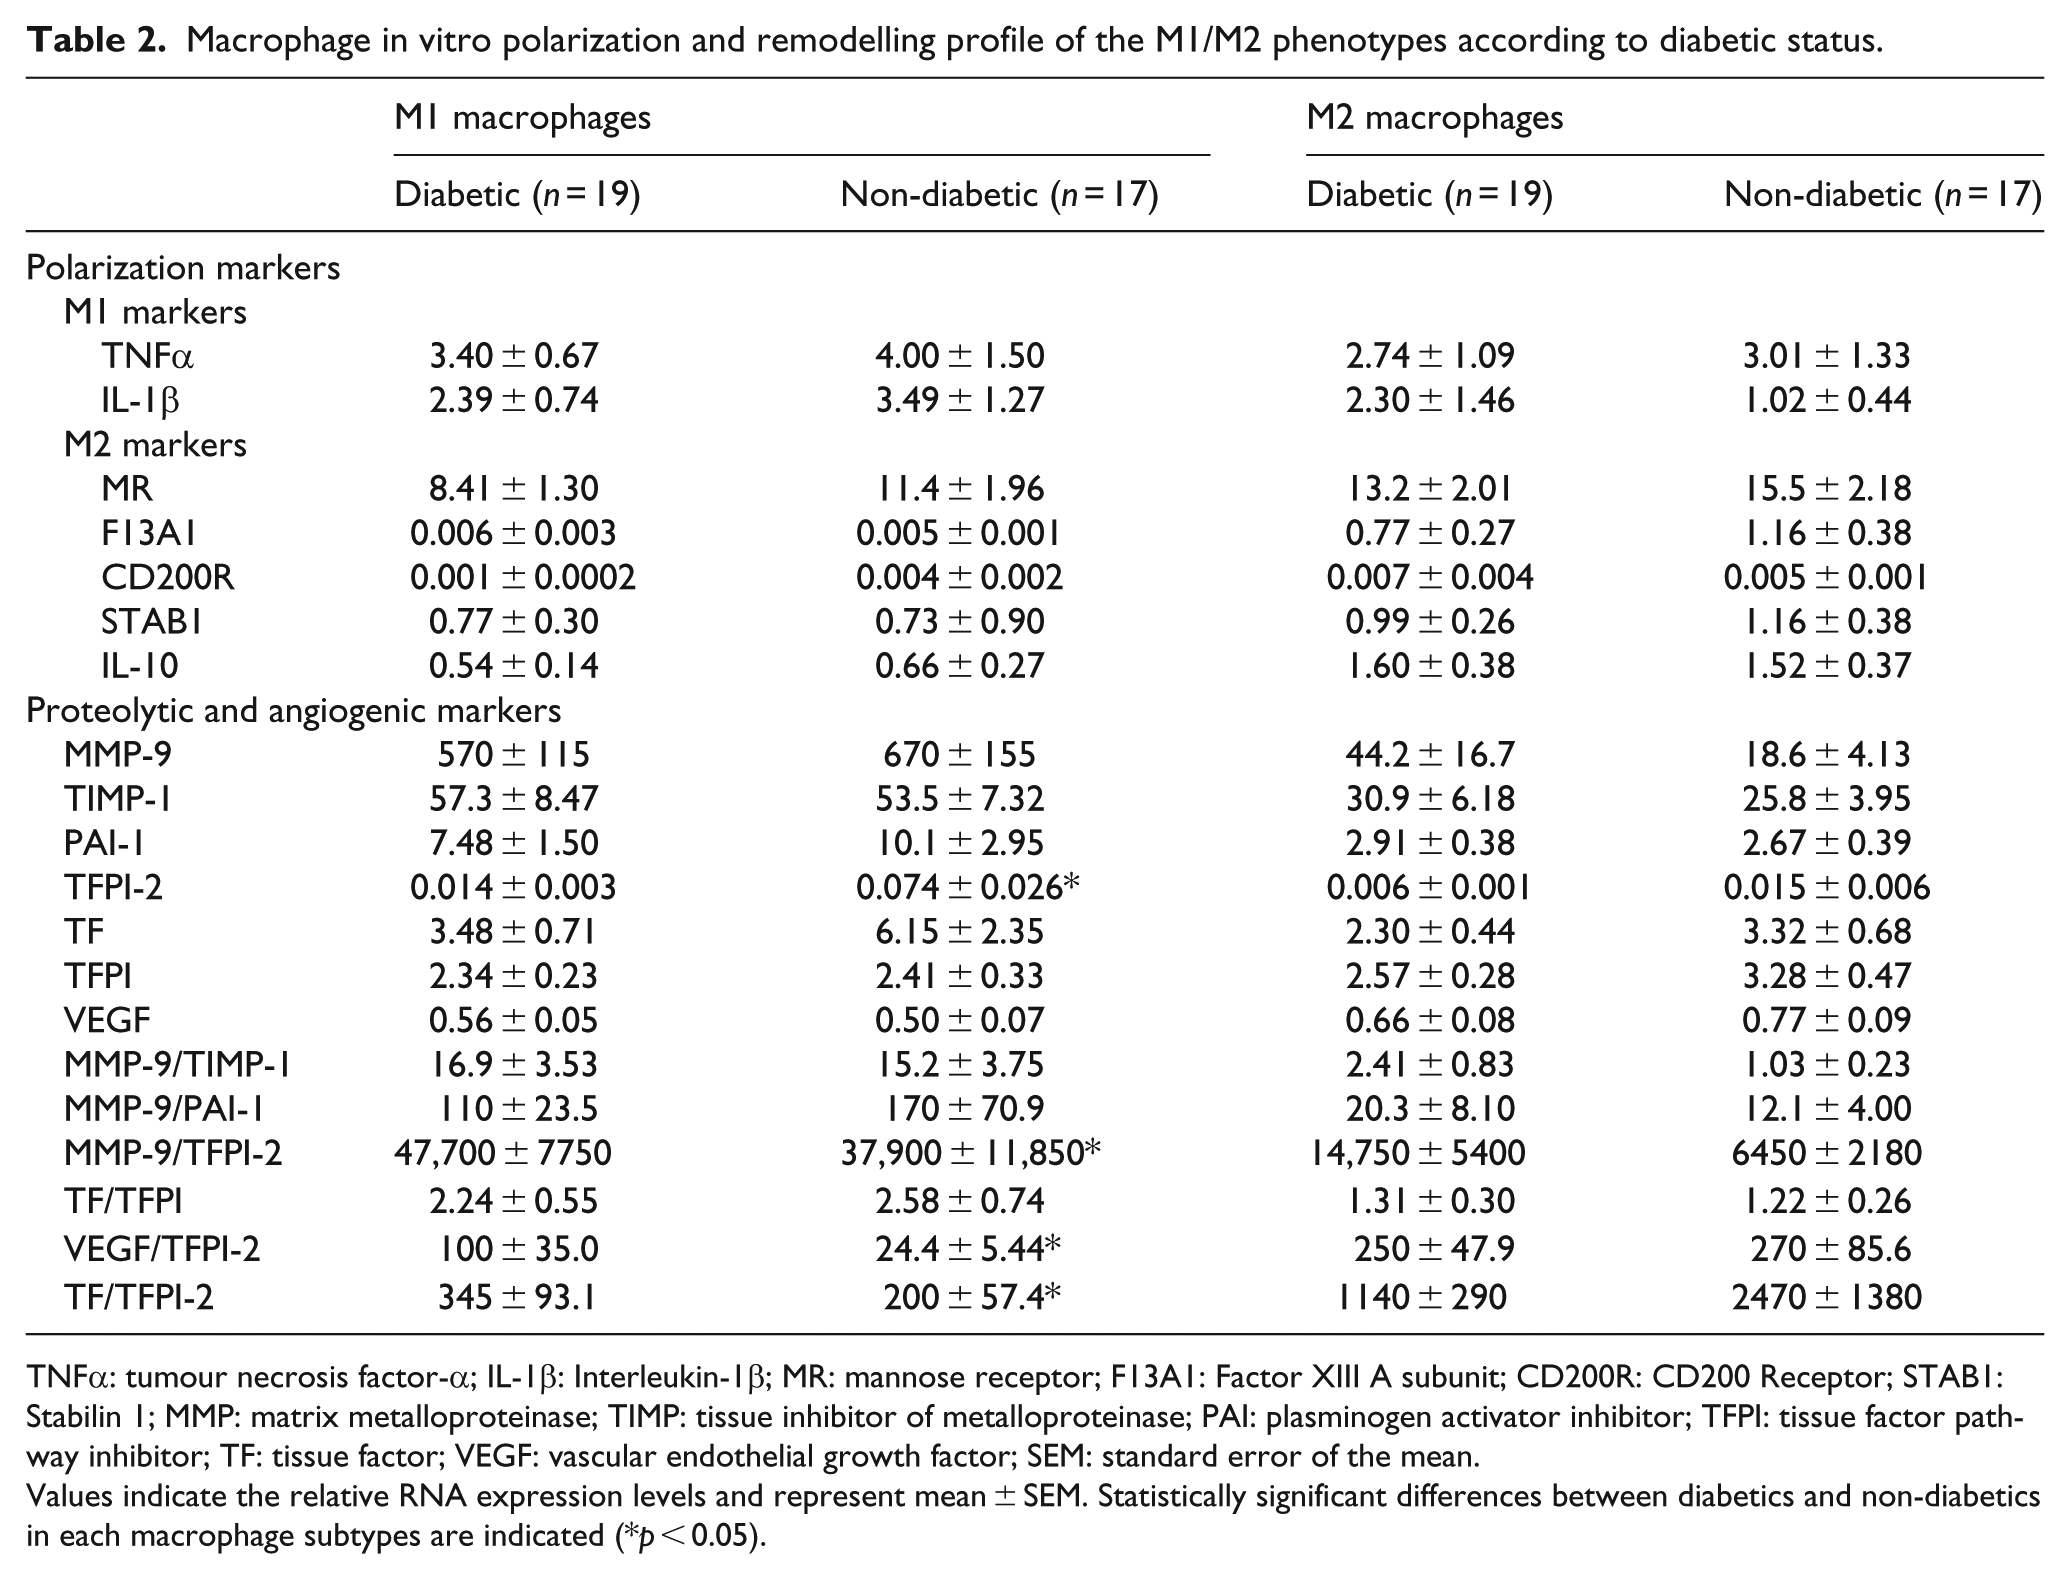
TNFα: tumour necrosis factor-α; IL-1β: Interleukin-1β; MR: mannose receptor; F13A1: Factor XIII A subunit; CD200R: CD200 Receptor; STAB1: Stabilin 1; MMP: matrix metalloproteinase; TIMP: tissue inhibitor of metalloproteinase; PAI: plasminogen activator inhibitor; TFPI: tissue factor pathway inhibitor; TF: tissue factor; VEGF: vascular endothelial growth factor; SEM: standard error of the mean.
Values indicate the relative RNA expression levels and represent mean ± SEM. Statistically significant differences between diabetics and non-diabetics in each macrophage subtypes are indicated (*p < 0.05).
No significant differences were observed in the expression levels of proteolytic and angiogenic factors in M2 macrophages according to diabetic status of patients, whereas M1 macrophage expression profiles were significantly different (Table 2). Indeed, the proteolytic balance (MMP-9/TFPI-2 ratio) was significantly higher in M1 macrophages from diabetic compared to non-diabetic patients (p = 0.036) and positively correlated with levels of HbA1c (Figure 4). Moreover, we observed that expression of TFPI-2, an anti-angiogenic molecule, was markedly downregulated in M1 macrophages in diabetic compared to non-diabetic patients (p = 0.040) and that VEGF/TFPI-2 and TF/TFPI-2 ratios were significantly higher in this subtype of macrophage in diabetics versus non-diabetic subjects (p = 0.017 and 0.043, respectively). Furthermore, we observed a higher expression of TF in M1 compared to M2 macrophages in the diabetic group only. Inversely, we observed a markedly upregulated expression of TFPI in M2 macrophages exclusively in non-diabetic patients (Supplemental Figure S1). We did not observe any statistical difference between M1 and M2 expression for the other proteolytic and angiogenic markers. Taken together, these new findings suggest that diabetes orients M1 macrophages towards an angiogenic profile. Histological analysis confirmed the higher density of neovessels and VEGF expression in carotid plaques from diabetic patients (Figure 5, Table 3). However, no differences were observed in the content of both M1 and M2 macrophages (based on the absence or presence of MR, respectively) according to the diabetic status of the subject.
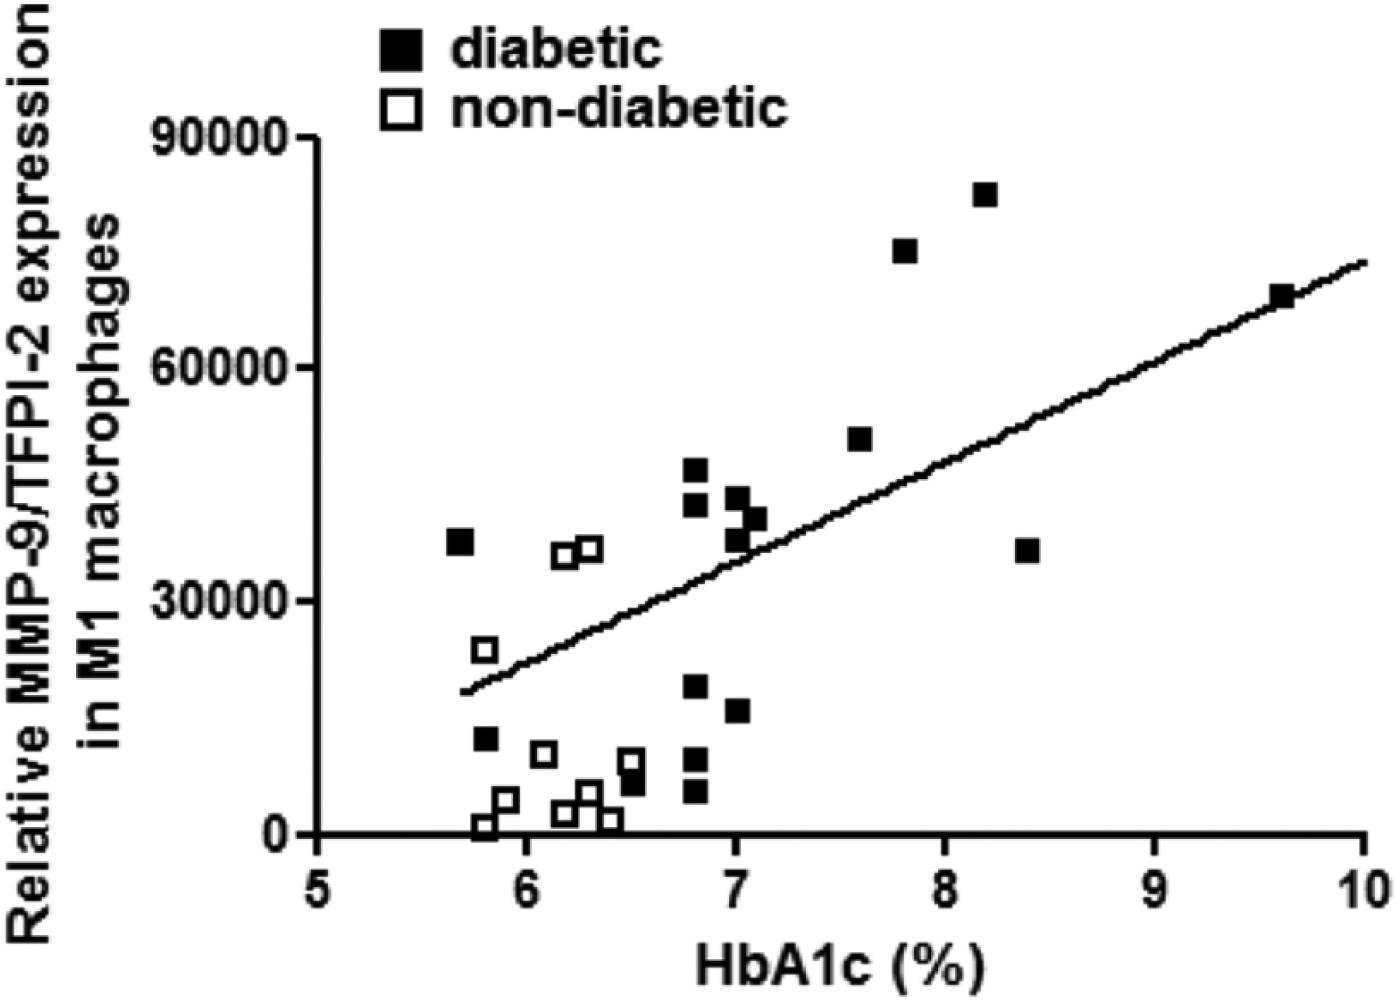
Correlation between the proteolytic balance (MMP-9/TFPI-2 ratio) in M1 macrophages and levels of glycated haemoglobin (HbA1c) in diabetic (filled squares) and non-diabetic patients (unfilled squares). The line represents the best fit for all patients (r = 0.505, p < 0.05).
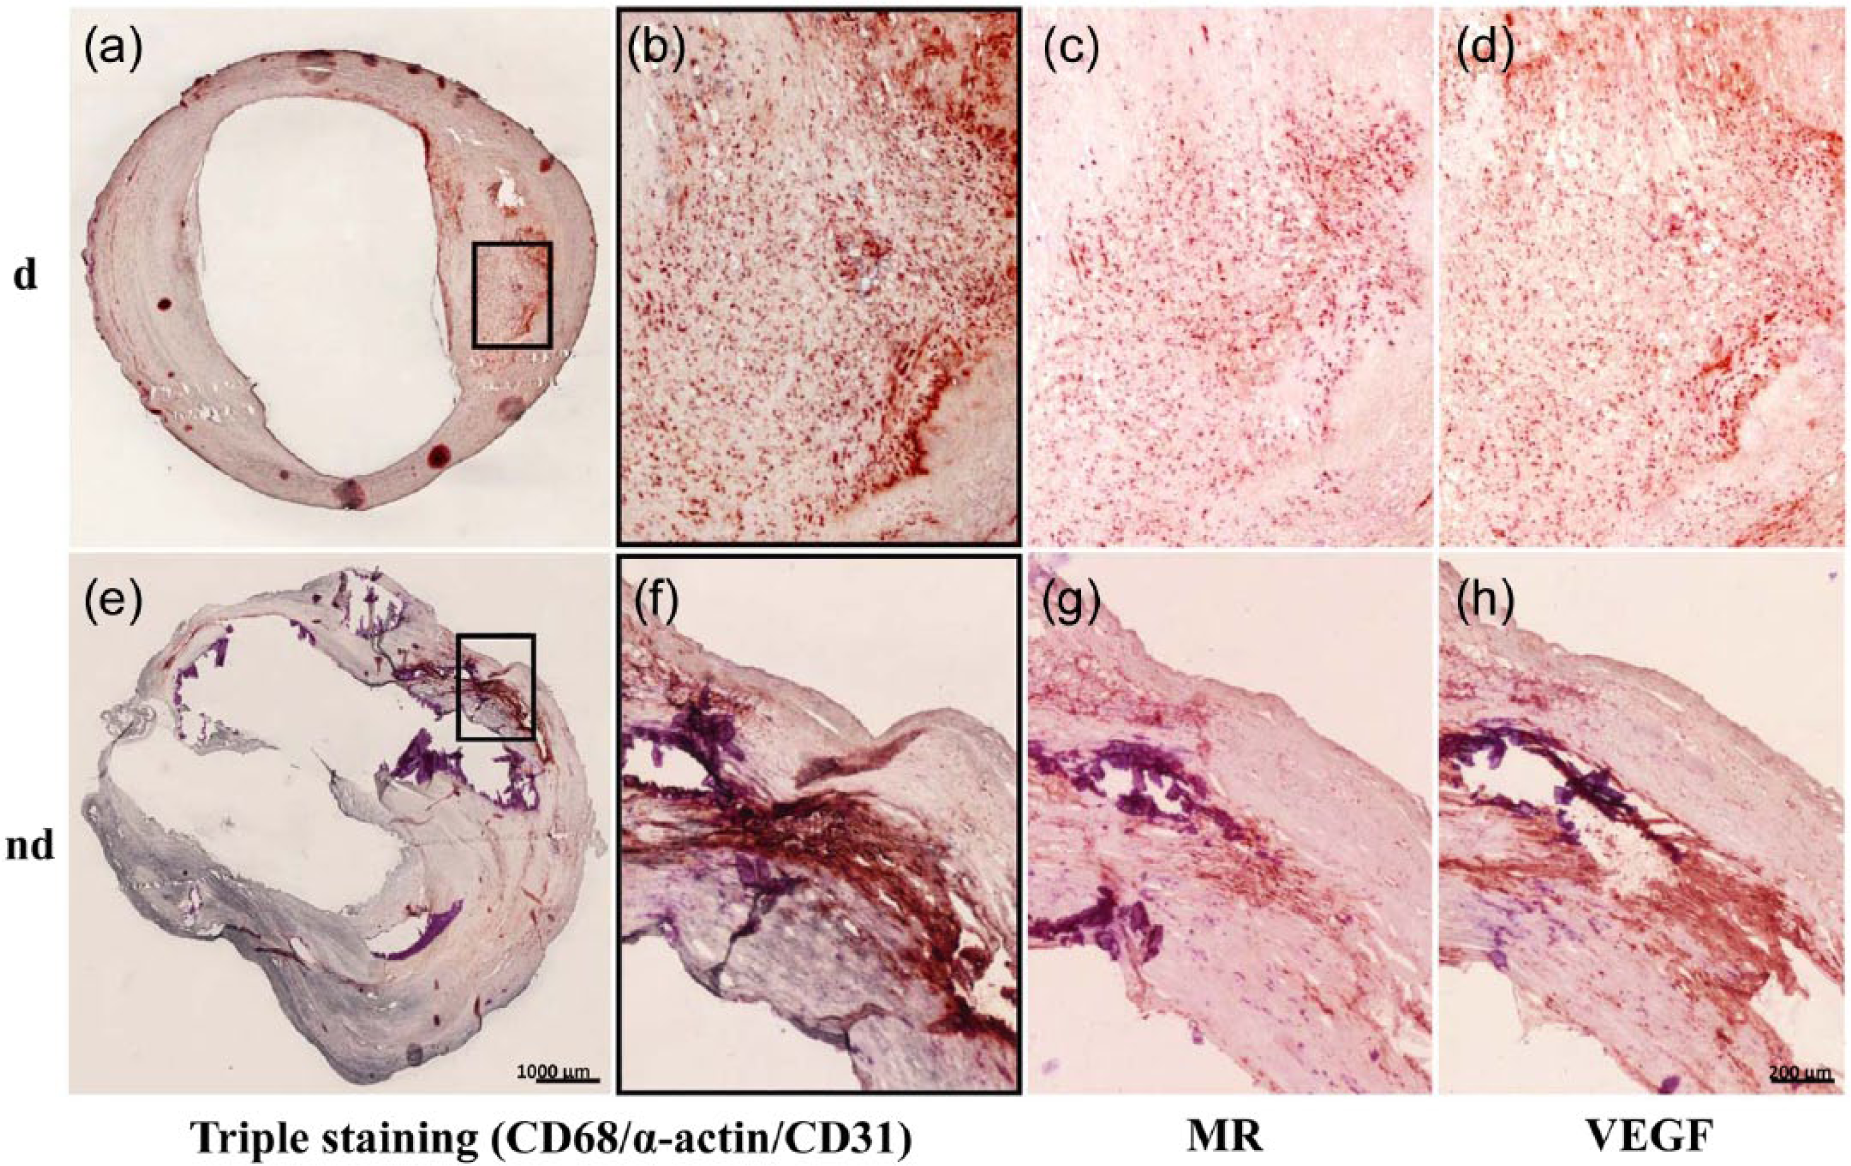
Immunohistological analysis of the representative carotid endarterectomy specimen from diabetics (d; a to d) and non-diabetics (nd; e to h). Triple immunostaining for macrophages (CD68, red), smooth muscle cells (α-actin, grey) and endothelial cells (CD31, blue) (a, b and e, f); immunostaining for M2 macrophages (MR, red) (c and g) and for VEGF (red) (d and h) with higher magnification. Scale bars are shown.
Histological differences between carotid plaques from diabetic or non-diabetic patients.
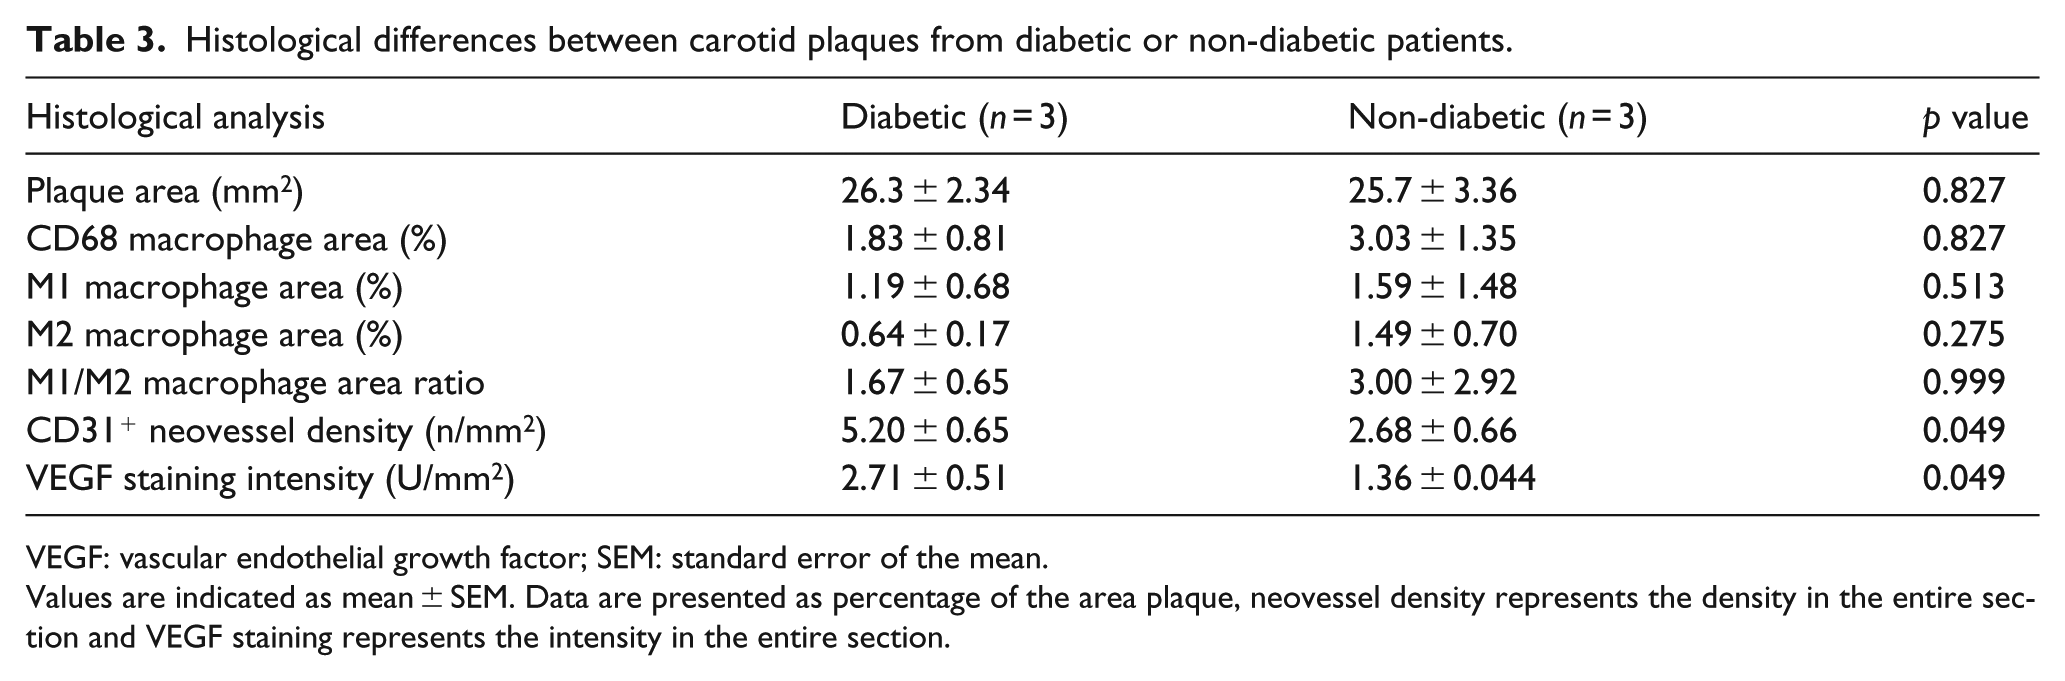
VEGF: vascular endothelial growth factor; SEM: standard error of the mean.
Values are indicated as mean ± SEM. Data are presented as percentage of the area plaque, neovessel density represents the density in the entire section and VEGF staining represents the intensity in the entire section.
Discussion
Diabetes is associated with the development of accelerated atherosclerosis, which results in increased morbidity and cardiovascular complications. Diabetic patients have more vulnerable plaques, due to increased macrophage infiltration and pro-inflammatory processes among other factors, compared to non-diabetic patients. 2
Tissue macrophages can exist in different activation states depending on the cytokine microenvironment.6,7 M1-inducing stimuli, such as bacterial (lipopolysaccharide) or Th1 cytokines (interferon-gamma (IFNγ), granulocyte-macrophage colony-stimulating factor (GM-CSF)) are widely used in literature but their relevance for atherosclerosis can be discussed. Therefore, we used IL-1β, a key pro-inflammatory cytokine in atherosclerosis development, to promote M1 macrophage differentiation. 13
IL-1β-induced M1 macrophages displayed a higher proteolytic potential than M2 macrophages. Indeed, M1 macrophages express higher levels of MMP-9 which is involved in extracellular matrix (ECM) degradation, suggesting a role in plaque rupture. 5 Previous work has shown that MMP-9 is more highly expressed in M1 macrophages in plaques from symptomatic patients. 14 MMP-9 activity is regulated by TIMP-1, its endogenous inhibitor, 15 and by other protease inhibitors, TFPI-2 and PAI-1.16,17 The balance between MMPs and these inhibitors is critical for the ECM remodelling in atherosclerotic lesions. The expression of these inhibitors was upregulated in M1 compared to M2 macrophages and the MMP-9/TIMP-1, MMP-9/PAI-1 and MMP-9/TFPI-2 ratios were significantly higher in M1 compared to M2 macrophages, suggesting a potential role of M1 macrophages in plaque vulnerability.
We observed a higher expression of TF, the main initiator of coagulation and of PAI-1, a fibrinolysis inhibitor, in M1 compared to M2 macrophages. Previously, increase in both TF and PAI-1 expression was reported in atherosclerotic plaques, and monocytes/macrophages represent a source of these coagulation/haemostasis mediators.18,19 Increased expression of TF and PAI-1 in M1 macrophages may cause a greater extent and persistence of thrombi in the arterial lumen after plaque rupture. 20 In addition, TFPI, an important inhibitor of the TF-dependent coagulation pathway, is present within human atherosclerotic plaque 21 and is more expressed in M2 macrophages, suggesting antagonistic roles of M1 and M2 in coagulation, in favour of plaque thrombogenicity for M1, whereas M2 macrophages can be involved in the control of fibrin deposition in atherosclerotic plaques.
Finally, neoangiogenesis has a pivotal role in atherosclerosis. We observed an increased VEGF expression in M2 macrophages, as already described in tumour-associated M2 macrophages, promoting tumour progression. 22 Inversely, TFPI-2, mainly expressed by vascular smooth muscle cells, endothelial cells and macrophages and overexpressed in human atherosclerotic lesions compared to normal arteries, plays an important regulatory role in the angiogenic process. 12 Here, we found that M1 expressed significantly more TFPI-2 than M2 macrophages. Interestingly, VEGF/TFPI-2 and TF/TFPI-2 ratios, which reflect the angiogenic balance, were significantly higher in M2 compared to M1 macrophages, in favour of the higher angiogenic properties of M2 macrophages. 23 Several studies suggest that neovascularization, associated with unstable vulnerable plaques, promotes the development of immature and rupture-prone microvessels, leading to intraplaque haemorrhages and contributing to plaque destabilization. 24 Yunoki et al. 25 found a positive association between intraplaque haemorrhages and M2 macrophages in human unstable coronary plaques. M2 macrophages, via scavenging functions, are involved in the clearance of apoptotic cells, as well as phagocytosis of senescent erythrocytes, so avoiding iron-induced damages and thus may play reparatory roles, contributing to plaque stabilization. 9
The functional diversity of macrophages in atherosclerosis is an emerging concept. 9 Brochériou et al. 26 already suggested a distinct transcription profile between GM-CSF- and M-CSF-induced macrophages with identification of novel candidate genes in atherosclerosis, but no data concerning haemostatic and angiogenic mediators are available in this study. Similarly, Waldo et al. 27 highlighted differences in inflammatory proteins, TF and TFPI expression between M1 and M2 in agreement with our results obtained on a large number of subjects.
Here, we also observed that diabetes does not alter M1 nor M2 macrophage in vitro polarization. This is in agreement with previous results describing an impaired alternative macrophage differentiation in PBMC from obese subjects without significant difference in the expression level of M2 markers in obese patients with diabetes. 28 Second, we observed an influence of diabetes on the gene expression of proteolytic and angiogenic factors in M1 macrophages. The higher proteolytic balance (MMP-9/TFPI-2 ratio) observed in M1 macrophages from diabetic patients is in line with the accelerating atherogenesis and the higher plaque vulnerability currently observed in diabetic patients. 2 The chronic influence of hyperglycaemia on M1 macrophage phenotype is supported by the observation of a positive correlation between proteolytic balance in M1 macrophages and HbA1c. These data are in agreement with those from Nicholls et al. 29 who observed a close correlation between atheroma burden and HbA1c. Previous studies reported that the expression of MMP-9 is increased in atherosclerotic plaques from diabetic patients and that insulin treatment reduces MMP-9 tissue expression as well as its secretion by macrophages. 30
Moreover, we observed that M1 macrophages from diabetic patients also displayed a more important proangiogenic activity (increased VEGF/TFPI-2 and TF/TFPI-2 ratios) compared to non-diabetic patients. Our histological and in vitro results could explain the link between increased number of microvessels and plaque vulnerability observed in diabetic patients. 31 Hyperglycaemia has been reported to induce abnormal angiogenesis and to promote microangiopathic neovessels in the retina via a VEGF-dependent mechanism, and similar mechanisms might take place in the vascular wall and atherosclerotic plaques. 32
Recent studies indicate that M1 macrophages are predominant in the symptomatic plaques, in particular in vulnerable zones (shoulder regions), while M2 cells dominate within the collagen-rich fibrous cap and adventitia surrounding the plaque, suggesting that plaque instability might be caused by an imbalance between M1 and M2 macrophages.8,14,33 However, no study estimated the M1/M2 ratio according to the diabetic status of the subject. In this study, diabetes does not seem to be associated with changes in both M1 and M2 macrophage content in atherosclerotic plaques. Our results show that diabetes leads to qualitative changes in M1/M2 macrophages in atherosclerotic context and seem to suggest no impact of diabetes on M1 and M2 macrophages content in atherosclerotic plaques, but the latter need to be confirmed by the analysis of a larger sample size. Numerous intracellular signalling cascades but also transcription and epigenetic factors could be involved. The persistent effect of the diabetic condition on monocytes/macrophages after 8 days of culture is probably explained by the recently described concept of ‘monocytes training’. This phenomenon consists of cellular priming through epigenetic modifications and was observed both in vitro34,35 and in vivo. 28 Further studies should identify the involved pathways in order to provide novel therapeutic targets for ameliorating the adverse cardiovascular effects of diabetes.
This is the first study on the impact of diabetes on macrophage M1/M2 profiles in humans. However, the results should be interpreted with caution. A possible limitation of our approach is that our conclusions, drawn from ex vivo experiments from a large number of atherosclerotic patients, are based on gene expression data. However, messenger RNA (mRNA) expression levels are commonly used as a proxy for estimating functional differences that occur at the protein level.
In conclusion, this study reveals that human M1 and M2 macrophages express different levels of mediators involved in proteolysis and angiogenesis, key processes in atherosclerotic plaque progression and instability. M1 macrophages from diabetic patients exhibit a deleterious phenotype that could contribute to lesion progression with a higher plaque fragility currently observed in these subjects.
Footnotes
Acknowledgements
We are grateful to Bertrand Vaast and Jonathan Vanhoutte for their excellent technical assistance.
Declaration of conflicting interests
The authors declare that they have no conflicts of interest.
Funding
This work was supported by Lille 2 University, INSERM, French Research National Agency (ANR) through Blanc programme (AIMHA, no. ANR-2010-110601), CHRU de Lille and OPAL foundation (Sanofi-Synthelabo and Bristol-Myers Squibb).
References
Supplementary Material
Please find the following supplemental material available below.
For Open Access articles published under a Creative Commons License, all supplemental material carries the same license as the article it is associated with.
For non-Open Access articles published, all supplemental material carries a non-exclusive license, and permission requests for re-use of supplemental material or any part of supplemental material shall be sent directly to the copyright owner as specified in the copyright notice associated with the article.