
Abstract
Background:
The main manifestation of hyperglycaemia during pregnancy is gestational diabetes mellitus. It can herald diabetes mellitus type 2 and its deleterious long-term effects, such as hypertension and cardiovascular disease. The aim of this study was to assess diastolic function in women with gestational diabetes mellitus, one of the first signs of future cardiovascular disease.
Methods:
A total of 21 women with gestational diabetes mellitus and 23 healthy pregnant women (control group) between 34 and 37 weeks of gestation underwent echocardiographic assessment. The diagnosis of gestational diabetes mellitus was made in agreement with the American Diabetes Association criteria. Echocardiographic images obtained were analysed according to the criteria of the American Society of Echocardiography. Data were analysed using Pearson correlation coefficient, analysis of variance and Student’s t-test.
Results:
Women with gestational diabetes mellitus had higher posterior wall and interventricular septum thickness, increased left ventricular mass and left ventricular mass index, lower early diastolic annular velocity and early diastolic annular velocity/late diastolic annular velocity ratio. There was a positive correlation between left ventricular mass index and fasting glucose and pregnancy body mass index.
Conclusion:
Patients with gestational diabetes mellitus seem to have a different diastolic profile as well as a mildly dysfunctional pattern on echocardiogram, which may show a need for greater glycaemic control.
Introduction
Gestational diabetes mellitus (GDM) is any degree of glucose intolerance, recognized or diagnosed for the first time during pregnancy. 1 A large meta-analysis conducted in 2009 identified that in women with a history of GDM, the risk of developing diabetes in the future is 7.43 times higher. 2
Clinical diabetes is one of most prevalent diseases in the world and is considered an independent risk factor for cardiovascular complications and a leading cause of morbidity and mortality. The risk of death increases with duration of disease, especially in women.3,4
In addition to disorders involving glucose metabolism, pregnancy is also characterized by significant changes in the cardiovascular system. Physiologically, there is an increase in cardiac output, heart rate, intravascular volume and vascular compliance, with reduction of the peripheral vascular resistance. 5 Therefore, pregnancy provides physiological cardiac remodelling but maintains ventricular geometry. 6
Although cardiac morphometric changes due to pregnancy are well known and documented by means of echocardiography, particularly in relation to systolic parameters and ventricular morphology,7,8 diastolic function parameters are controversial, due to different methodologies and to the fact that some measurements remain within the normal range.9–11
To correct these discrepancies, some authors8,12 proposed the use of tissue Doppler to assess diastolic function in pregnant women. The advantage of this method is that the parameters determined in the myocardium are relatively independent of preload, which results in greater accuracy in the assessment of diastolic function in pregnancy.8,13,14
There is much evidence in the literature demonstrating that diastolic dysfunction is an early manifestation of diabetic cardiomyopathy, preceding systolic dysfunction and symptomatic heart failure.15–17 Studies suggest that diastolic dysfunction is the most common cause of congestive heart failure, and in more than 50% of the population with this condition, systolic left ventricular (LV) function is normal.18,19
This study was designed to assess LV diastolic function in pregnant women with gestational diabetes, an initially transitory condition of abnormal glucose metabolism, to try to diagnose diastolic dysfunction and thus identify women at higher risk of future cardiovascular disease (CVD).
Methods
This study was approved by the Hospital Ethics Committee of the School of Medicine of Botucatu, São Paulo State University, UNESP, Brazil, where it was conducted from August 2011 to September 2013. A total of 44 patients with singleton pregnancies were assigned to participate. Of these, 21 patients had GDM and 23 patients were healthy pregnant women (control group). The diagnosis of GDM was made by performing the 75 g oral glucose tolerance test (75 g OGTT) between 24 and 28 weeks following the guidelines of the American Diabetes Association (ADA), 20 and so, one measurement above the normal range (fasting ⩾ 92 mg/dL, ⩾180 mg/dL after 1 h, and ⩾153 mg/dL after 2 h) is sufficient for confirmation. All patients participating in the study signed an informed consent form.
Women with a twin pregnancy, prior CVD, pregestational diabetes, gestational or pre-existing hypertensive disorders and thyroid diseases, and smokers were excluded.
An echocardiogram was performed between 34 and 37 weeks of gestation by a single observer, after 15 min in the left lateral recumbent position. The ultrasound equipment used was Vivid S6 GE (General Electric) with multifrequency ultrasonic transducer 2.0–3.5 MHz and recording system. Images were obtained and analysed following the recommendations of the American Society of Echocardiography. 9 All measurements were obtained and averaged in three cardiac cycles.
Left atrial (LA) volume was calculated by Simpson’s method, as demonstrated in Figure 1. 21 Relative wall thickness (RWT) was calculated with the formula RWT = 2 × left ventricular posterior wall thickness (LVPW)/left ventricular end-diastolic diameter (LVDD). LV mass was calculated using Devereux’s anatomical formula: 22 0.8{1.04[(interventricular septum (IVS) + LVPW + LVDD)3 − (LVDD)3]} + 0.6, and LV mass index (LVMi) was calculated as follows: LVMi = LV mass (g)/height (m2.7) (Figure 2).
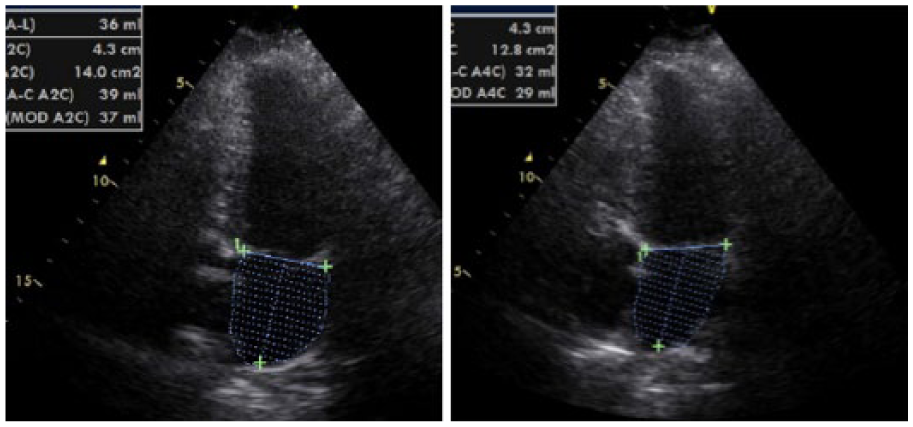
Left atrium volume calculated by Simpson’s method: (left) volume was obtained by four-chamber view and (right) volume was obtained by two-chamber view. The final volume described in the text consisted of the mean value of two volumes.
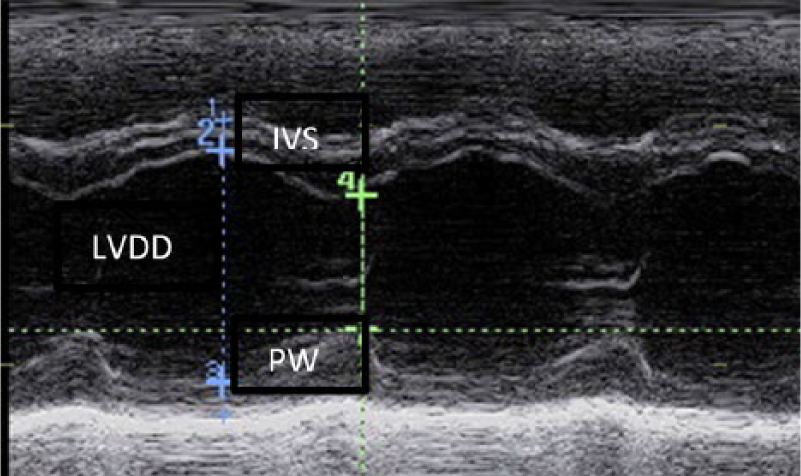
M-mode of left ventricular end-diastolic diameter (LVDD), interventricular septum (IVS) and posterior wall thickness (PW).
LV inflow velocities were measured by the pulsed wave Doppler technique in the apical four-chamber view under two-dimensional (2D) guidance. 23 The sampling volume was placed near the tips of the mitral leaflets in order to measure the mitral inflow velocities. 24 Peak mitral flow velocity in early diastole (E), peak mitral flow velocity at atrial contraction (A) and peak mitral flow velocity in early diastole to peak mitral flow velocity at atrial contraction ratio (E/A) were evaluated (Figure 3). Isovolumic LV relaxation (IVR) and deceleration time (DT) were also calculated.
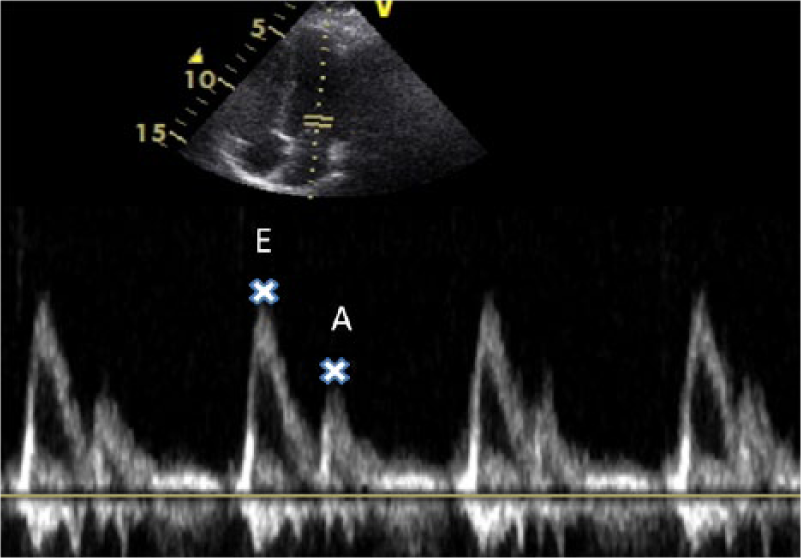
Mitral Doppler inflow. E wave = peak mitral flow velocity in early diastole and A wave = peak mitral flow velocity in late diastole (atrial contraction).
Tissue Doppler parameters are relatively load-independent indexes8,13,14 and were obtained with the sample volume placed at the lateral and medial mitral annulus. Parameters were calculated by the mean value of these measurements. Early diastolic annular velocity (E′) and late diastolic annular velocity (A′) were evaluated (Figure 4). To calculate E′/A′, the early diastolic annular velocity (E′)/late diastolic annular velocity (A′) ratio was used.
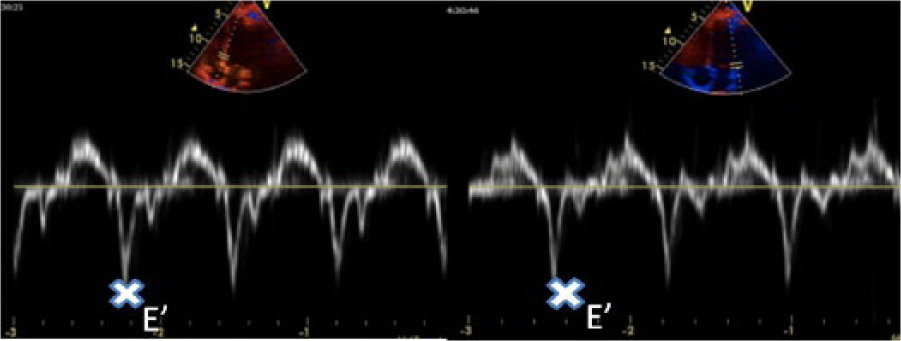
Tissue Doppler: (left) measurement of E′ wave (early diastolic annular velocity) of medial mitral annulus (E′) and (right) measurement of E′ wave of lateral mitral annulus. We calculated the final E′ by the mean value of lateral and medial E′.
Statistical analysis
Statistical analysis consisted of comparing the variables of the study groups, expressed as mean and standard deviation according to normal distribution of the data by analysis of variance (ANOVA) using Student’s t-test.
Pearson correlation coefficient was also used, and its value of r, with a 5% level of significance (p < 0.05) for all tests.
Results
Clinical and biochemical data
Regarding the control group, women with GDM had higher age, parity, pregestational and gestational body mass index (BMI) (p < 0.05), and higher fasting glucose and haemoglobin A1c values (p < 0.05), as shown in Table 1.
Clinical and biochemical data.
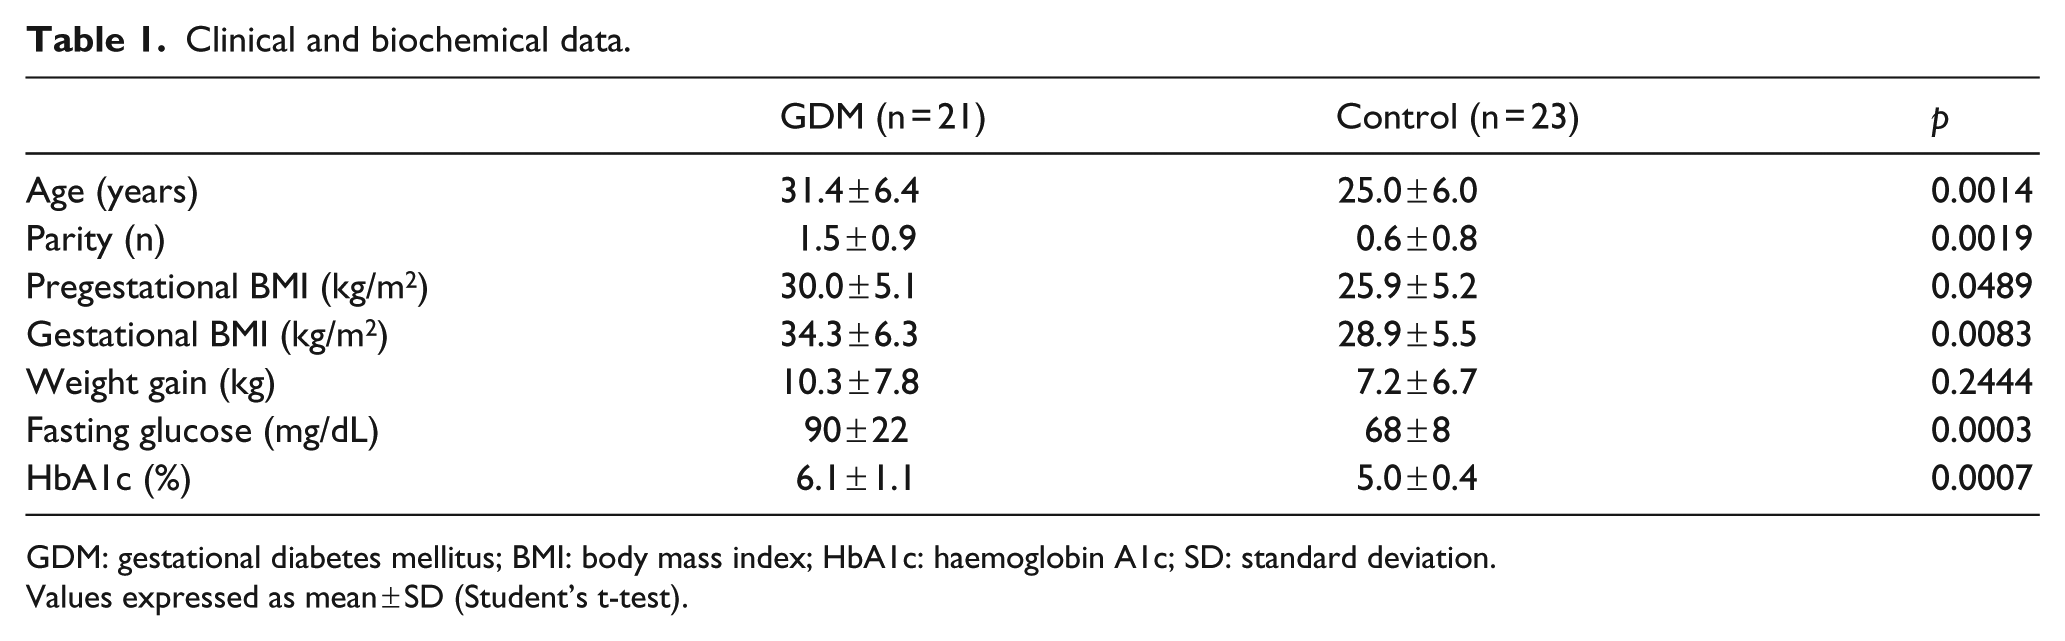
GDM: gestational diabetes mellitus; BMI: body mass index; HbA1c: haemoglobin A1c; SD: standard deviation.
Values expressed as mean ± SD (Student’s t-test).
M-mode and 2D-derived parameters
The LV posterior wall thickness (LVPW), IVS, LV mass and LVMi were significantly higher in the GDM group compared to the control group (p < 0.05) (Table 2).
Echocardiographic M-mode and 2D-derived parameters.
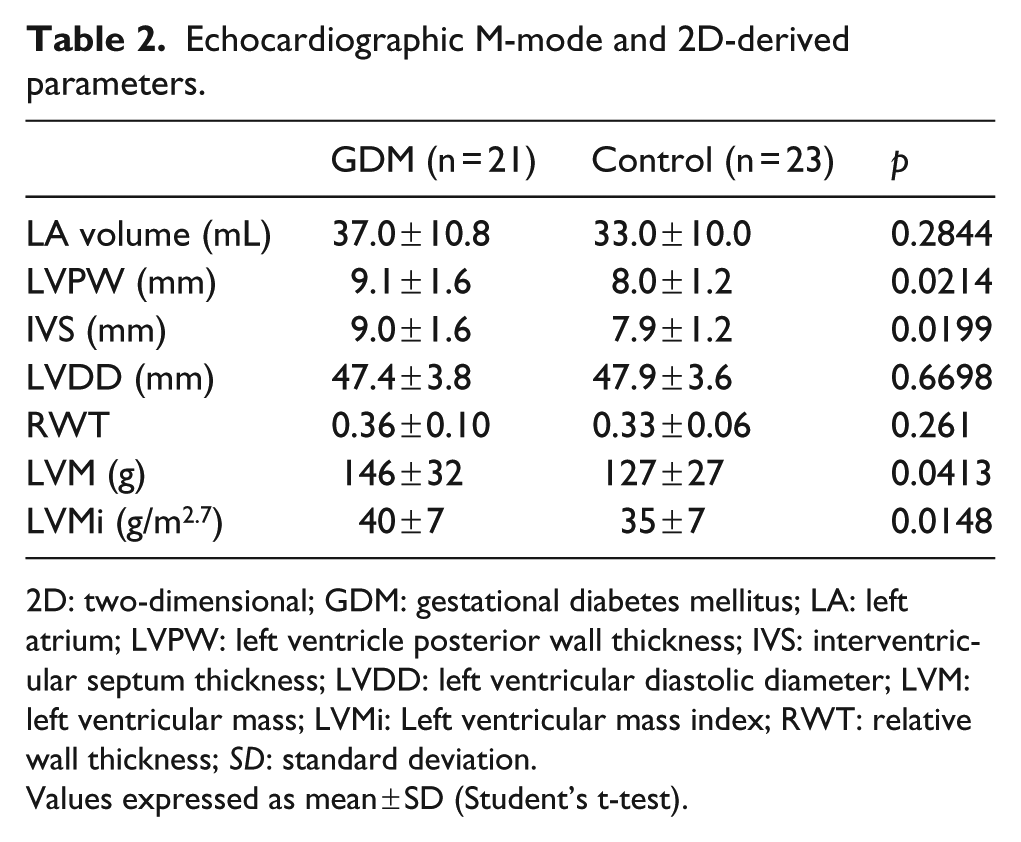
2D: two-dimensional; GDM: gestational diabetes mellitus; LA: left atrium; LVPW: left ventricle posterior wall thickness; IVS: interventricular septum thickness; LVDD: left ventricular diastolic diameter; LVM: left ventricular mass; LVMi: Left ventricular mass index; RWT: relative wall thickness; SD: standard deviation.
Values expressed as mean ± SD (Student’s t-test).
Doppler and tissue Doppler parameters
The women with GDM had significantly lower values of the early diastolic annular velocity (E′) than those in the control group, with no significant difference between the values of the late diastolic annular velocity (A′); consequently, the ratio E′/A′ was lower in women in the first group (p < 0.05) as listed in Table 3.
Doppler and tissue Doppler parameters.
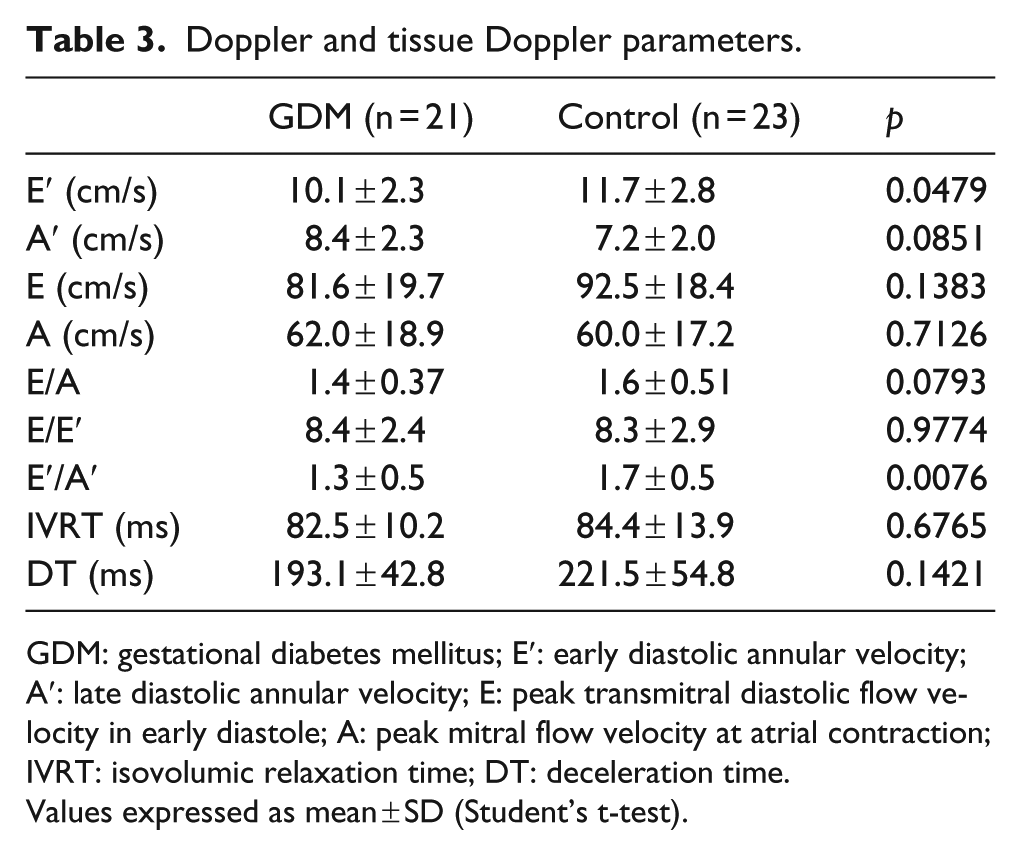
GDM: gestational diabetes mellitus; E′: early diastolic annular velocity; A′: late diastolic annular velocity; E: peak transmitral diastolic flow velocity in early diastole; A: peak mitral flow velocity at atrial contraction; IVRT: isovolumic relaxation time; DT: deceleration time.
Values expressed as mean ± SD (Student’s t-test).
Correlations between LVMi and E′/A′ and biochemical and clinical data
LVMi correlated positively with fasting glucose and pregnancy BMI only in the GDM group (p < 0.05) (Table 4).
Correlation between LVMi and biochemical and clinical data.
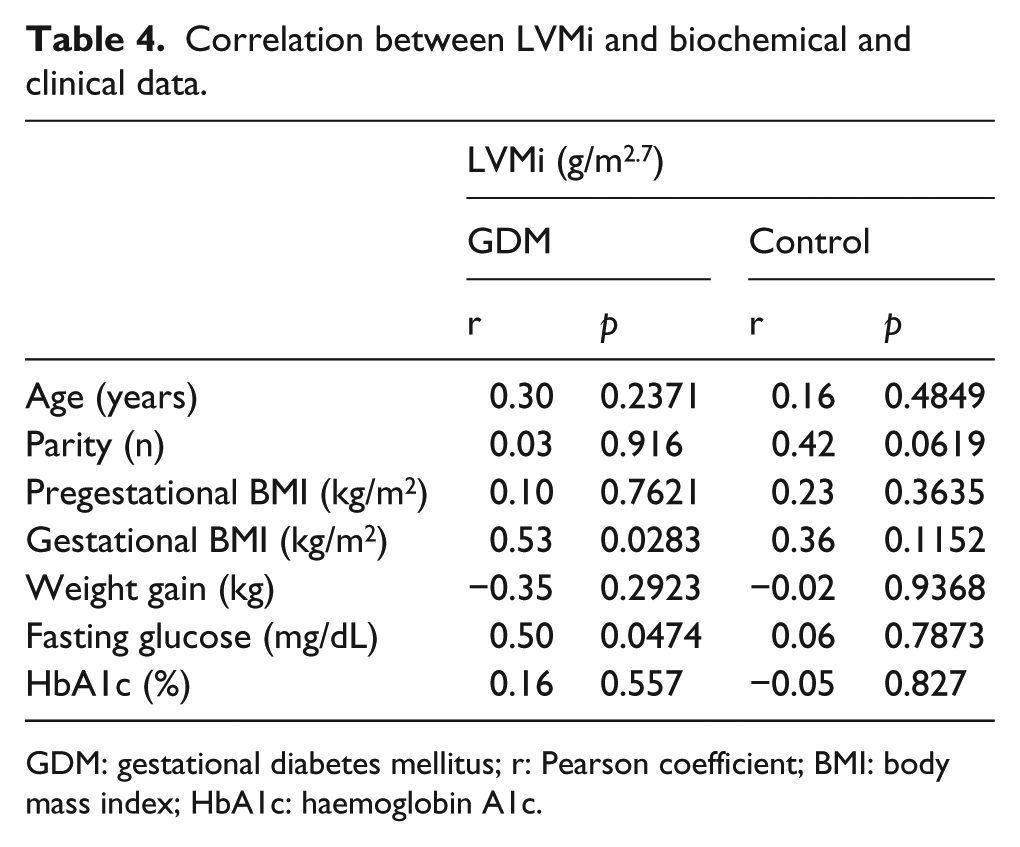
GDM: gestational diabetes mellitus; r: Pearson coefficient; BMI: body mass index; HbA1c: haemoglobin A1c.
A negative correlation between E′/A′ and maternal age only in GDM group (p < 0.05) was observed (Table 5).
Correlation between E′/A′ and biochemical and clinical data.
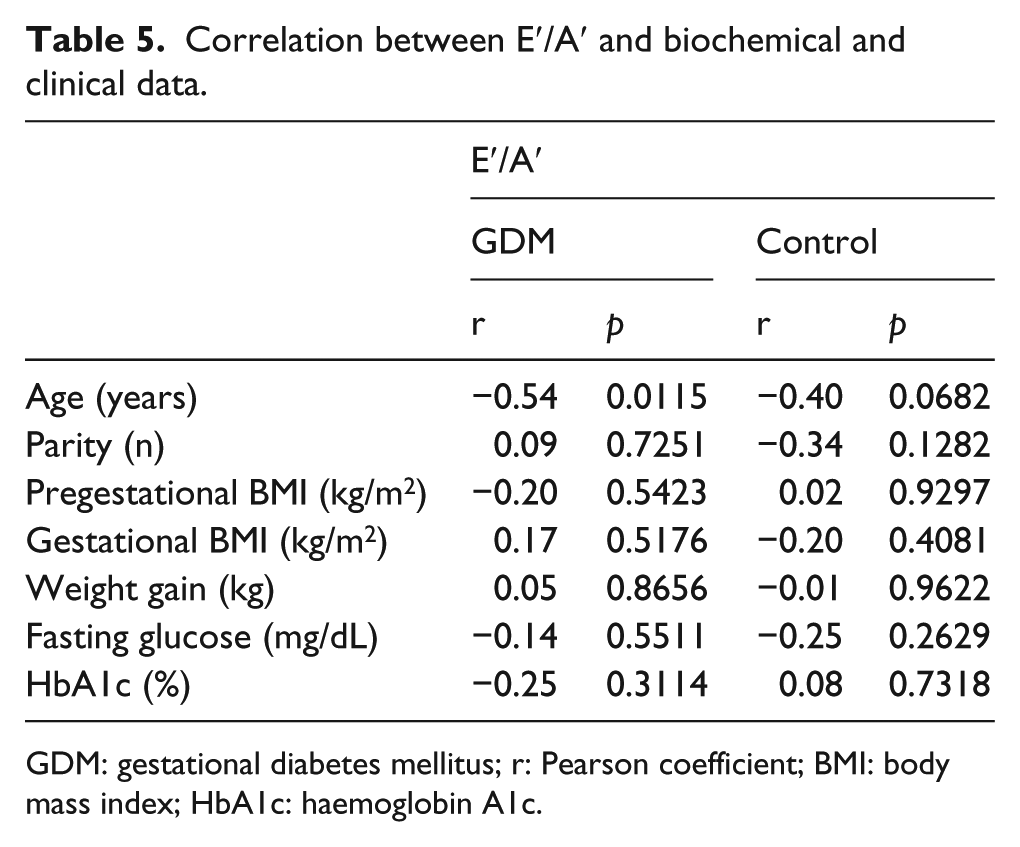
GDM: gestational diabetes mellitus; r: Pearson coefficient; BMI: body mass index; HbA1c: haemoglobin A1c.
Discussion
This study showed that pregnant women with GDM have an increased thickness of the posterior LV wall and of the IVS, higher LV mass and LVMi, and lower values of the early diastolic annular velocity (E′) and early diastolic annular velocity/late diastolic annular velocity ratio (E′/A′) when compared with the control group.
This is the first study designed for the purpose of evaluating cardiac structural changes in women with GDM. During normal pregnancy, increased cardiac mass index without changing the relative thickness of the LV wall may occur, developing eccentric hypertrophy in response to increased blood volume and thus preload. This type of hypertrophy is termed physiological. 25 Although in our study only one pregnant woman in the control group and two of the GDM group met the criteria for hypertrophy, we found that pregnant women with GDM have increased LVMi, without changing the relative thickness when compared to the control group. This finding is relevant because despite the short duration of the disease, there is cardiac involvement.
Paradisi et al. 26 showed endothelial dysfunction in pregnant women with hyperglycaemia, who were examined by means of applanation tonometry, and also a positive correlation between maternal glycaemia and endothelial dysfunction. In addition to the association between diabetes and endothelial dysfunction, other studies indicate that hypertension, obesity, dyslipidemia and metabolic syndrome are also related with this abnormality.27–29 Currently, there is evidence that endothelial dysfunction plays a role in the pathogenesis of abnormalities associated with preeclampsia and type II diabetes mellitus, which are conditions with increased risk of CVD. Although we have not assessed insulin resistance, we found a positive correlation between LVMi, gestational BMI and fasting glucose in the GDM group. This finding supports the need for good glycaemic and weight control during pregnancy in these patients.
Diastolic function analysis demonstrated that women with GDM had a different diastolic profile represented by standard reduction of E′ and the ratio E′/A′.
No pregnant women were found to have diastolic dysfunction; however, these results were obtained in a young population presenting this condition for a short period of time and who had no previous CVD. The diastolic profile observed in women with GDM is similar to a dysfunctional pattern, but within the normal range for the parameters studied, and seems to be related to their glycaemic levels. Therefore, any deviation in glycaemic control in pregnant women with gestational diabetes should be valued. Our findings are corroborated by the results of two other studies.17,30
The tissue parameters of diastolic function (E′ and A′) have a higher accuracy for this analysis because they are relatively load-independent and thus suitable for evaluation of ventricular overload states, such as pregnancy.
Although hyperglycaemia disappears postpartum in most women with gestational diabetes, these women may still present a higher risk of developing type 2 diabetes and CVD in the future. Consequently, it would be interesting for this group to have clinical monitoring to detect possible signs of cardiac hypertrophy and diastolic dysfunction with an aim to preventing CVD.
Conclusion
This study showed that GDM is associated with subclinical alterations in the structure and in the diastolic LV function. Pregnant women with GDM seem to have different structural modifications and diastolic profile similar to a dysfunctional pattern, but within the normal range for the parameters studied. In addition, as the dysfunctional pattern tends to evolve with advancing age, these women should undergo more rigorous monitoring of glycaemic control and changes in lifestyle.
Footnotes
Acknowledgements
We thank Daniel Oliveira and Lorene Guirado who performed all statistical analyses.
Declaration of conflicting interests
The authors declare that there is no conflict of interest.
Funding
This research received no specific grant from any funding agency in the public, commercial or not-for-profit sectors.