
Abstract
Background:
Efficacy of guideline cardiovascular disease prevention regimens may differ between patients with or without type II diabetes mellitus. We therefore compared change in carotid artery wall dimensions in type II diabetes mellitus and non-type II diabetes mellitus patients with a history of a major cardiovascular disease event, using magnetic resonance imaging.
Methods:
Thirty type II diabetes mellitus patients and 29 age- and sex-matched non-diabetes mellitus patients with a history of stroke or myocardial infarction and a carotid artery stenosis (15%–70%) were included. In all patients, treatment was according to cardiovascular risk management guidelines. At baseline and follow-up, carotid artery vessel wall dimensions were measured using 1.5 T magnetic resonance imaging.
Results:
After 2 years of follow-up, total wall volume of the carotid artery in type II diabetes mellitus patients decreased by 9.6% (p = 0.016). In contrast, stabilization rather than regression of carotid artery wall dimensions was observed in non-diabetes mellitus patients over a 2-year period. Body mass index was identified as a predictor of total wall volume decrease.
Conclusions:
Guideline treatment arrests atherogenesis in non-diabetes mellitus patients and even decreases vessel wall dimensions in type II diabetes mellitus patients. Baseline body mass index predicts cardiovascular disease prevention efficacy expressed as decrease in total wall volume. These data emphasize the importance of optimal cardiovascular-prevention, particularly in diabetes patients with a high body mass index.
Introduction
With a prevalence of 10%, diabetes mellitus (DM) is responsible for 1.3 million deaths per year worldwide. 1 In patients with type II diabetes mellitus (DM2), cardiovascular disease (CVD) accounts for up to 60% of mortality. Accelerated atherosclerosis in patients with DM2 has been partly attributed to direct effects of hyperglycaemia.2,3
Except hyperglycaemia, DM2 patients and non-DM2 patients share the same risk factors for CVD including central obesity, hypertension and combined dyslipidaemia.4–7 Despite these similarities, the effects of several diabetes-related metabolic disturbances may lead to different atherosclerotic structure and architecture. For example, the high prevalence of hypertriglyceridaemia and low levels of high-density lipoprotein (HDL)-cholesterol in diabetes patients is accompanied by abnormalities in lipoprotein particle structure. Indeed, the low-density lipoprotein (LDL)-cholesterol particles in diabetes patients are predominantly present in small dense, oxidized and glycated forms that possess the most atherogenic properties. 8 Next to the specific dyslipidaemia, endothelial dysfunction contributes to chronic vessel wall inflammation and accelerated atherogenesis in diabetes. These high levels of inflammation are held responsible for other structure and architecture of the atherosclerotic vessel wall, making it more prone to plaque rupture.9,10
This supposed difference in atherosclerotic structure and architecture may result in different efficacy of CVD prevention regimens on atherosclerosis in DM2 patients compared with non-DM patients. The efficacy of CVD risk reducing regimens in patients with and without DM2 has been investigated extensively. Despite the established role of elevated HbA1c levels in cardiovascular (CV) morbidity and mortality, a direct effect of interventions to decrease HbA1c on endpoints or even surrogate endpoints like carotid intima-media thickness (CIMT) decrease still has not been established. 11 The use of platelet inhibitors and antihypertensive medication, however, has been associated with a significant reduction in atherogenesis in DM2 patients, 12 as assessed as change in CIMT.
In this study, we compared progression of carotid atherogenesis over a 2-year period in patients with overt atherosclerotic disease of the CAs and a history of a major CV event, in the absence and presence of DM2. During the 2-year period, all patients received routine CVD-preventive regimens. To assess the changes in atherosclerotic burden in vivo, we measured CA wall dimensions using magnetic resonance imaging (MRI), expressed as total wall volume (TWV) in both DM2 and non-DM patients. In addition, we identified predictors for the observed change in TWV.
Materials and methods
Patient selection
The protocol was approved by the institutional review board at the University Medical Center of Leiden, The Netherlands, and the study was conducted in conformance with the Declaration of Helsinki. All patients provided written informed consent. Patients were recruited from the outpatient clinics of the department of vascular medicine, internal medicine, surgery, ophthalmology, endocrinology and geriatrics of the University Center between 2007 and 2009. Patients with a history of stroke (transient ischaemic attack included) or myocardial infarction were screened by ultrasonography for CA stenosis. In all, 30 patients met the inclusion criteria of DM2, a CA stenosis between 15% and 70% and an HbA1c of above 7.0% (53 mmol/mol). A total of 29 non-diabetic patients with a history of CVD and a CA stenosis between 15% and 70% were selected from a database, matched for sex and age. All participants were invited for blood withdrawal and a carotid MRI scan. Two years after the baseline visit, participants were re-invited for a 2-year follow-up visit, during which blood withdrawal and MRI scan were repeated.
CV prevention protocol during 2-year follow-up
At the initiation of the study, all participants continued receiving CV preventive treatment according to the Guideline Cardiovascular Risk Management from the Dutch Society of the Internal Medicine. 13 The therapeutic regimen included four times per year monitoring and control visits for lifestyle advice, a target LDL-cholesterol <2.5 mmol/L (97 mg/dL), arterial blood pressure below 140/90 mmHg in both patient groups and glycated haemoglobin (HbA1c) levels of below 7% (53 mmol/mol) in DM2 patients.
Risk factor measurements
At baseline and 2 years of follow-up visit, ethylenediaminetetraacetic acid (EDTA) anticoagulated peripheral blood samples were drawn from antecubital veins. Haematologic, inflammatory nephrologic and lipidologic analyses were performed using routine laboratory analysers. At both visits, patient information was collected concerning medical history, use of medication and information on dietary and smoking habits. Blood pressure was measured using oscillometric method (Omron Electronics, The Netherlands).
Image acquisition
MRI images were obtained on a 1.5-T MRI scanner (Philips Interna, Philips Healthcare, Best, The Netherlands). In all subjects, left common carotid artery (CA), carotid bifurcation and internal CA were scanned. Localization of these structures was performed by acquiring axial time-of-flight images. Nine transversal images were acquired with the flow-divider positioned in the fifth (centre) image, with a slice thickness of 3 mm. Five MRI sequences were acquired in the corresponding region: T1-weighted turbo field echo (TFE), T2-weighted turbo spin echo (TSE), time-of-flight angiography (TOF) and proton density weighted (PDW) TSE. Scan sequence parameters are listed in (Supplementary Data Table 1).
Image review procedure
Image analysis was performed using dedicated software (Vessel-Mass v3, Leiden University Medical Center, Leiden, The Netherlands). Before quantitative analysis, image region at baseline and follow-up scans of each patient were compared. Images outside overlapping area proximal or distal to the carotid bifurcation (Z-axis) between baseline and follow-up were excluded from analysis. Also, all images from all sequences were scored on a quality scoring system. Main quality criterion was that outer and inner CA border was recognizable.
Quantitative image analysis
A predefined delineation protocol was used to optimize manual vessel wall delineation. Quantitative image analysis was performed using dedicated software (Vessel-Mass). The reader was blinded for subject characteristics and date of scan. Baseline and follow-up scans were analysed randomly. Outer vessel wall border and inner vessel wall border were delineated from caudal to cranial. The surface area within the outer border is called total vessel area (TVA) and the surface area within the inner border is called lumen area (LA; Figure 1). At the first image superior to the carotid bifurcation, the internal CA was used for vessel wall analysis.

Overview of vessel wall dimension definitions. In the top panels, an anatomic interpretation in one slice is given. This slice is a transversal view at the cranial to the bifurcation of the carotid artery. Therefore, the ICA, ECA are visible accompanied with the JV. The lower three panels explain different wall dimension measures. TVA and LA are delineated and TWV was calculated.
Vessel wall calculations were performed using text export function from Vessel-Mass into Microsoft Excel 2003 (Microsoft, Redmond, WA, USA) and calculations were performed using an automatic macro. TWV was calculated by taking vessel wall area (VWA = TVA − LA), multiplied by slice thickness (3 mm) and summing volumes from the whole stack (mostly counting nine slices).
Statistical analysis
All are expressed as mean ± standard deviation (SD). Differences in baseline and follow-up values or levels are tested using paired nonparametric test: Wilcoxon signed ranks test. Differences between non-DM subjects and diabetic subjects are tested using independent samples t-tests. Based on a difference of 15% in TWV between non-DM subjects and diabetic subjects, 14 and an assumed SD of 20%, power of 0.8 and Type I error probability of 0.05, a minimum of 25 patients must be included in each group.
Change in TWV was calculated by deducing individual follow-up TWV from individual baseline TWV and expressed as mean differences. Predictors of change in TWV were assessed using multivariate linear regression. Potential predictors or confounders were used as explanatory variable and excluded using backward elimination. All measures were adjusted for body mass index (BMI), LDL-cholesterol, HDL-cholesterol, pulse pressure and HbA1c. All statistical tests were performed using SPSS Statistics (version 19; IBM, USA)
Results
Baseline characteristics are listed in Table 1. The majority of patients were male, with a mean age of 65 (±8.0) years for patients with DM2 and 63 (±8.3) years for non-DM subjects. The DM2 patients had higher levels of blood glucose, HbA1c, BMI, pulse pressure and triglycerides, whereas levels of total cholesterol, LDL-cholesterol and HDL-cholesterol were lower. A significantly larger proportion of DM2 patients used statins and antihypertensive drugs compared to non-DM patients (p = 0.020 and 0.029, respectively). Next to more frequent usage of statins, DM2 patients used more potent statins compared to non-DM2 subjects (p = 0.025).
Baseline characteristics of non-DM (DM−) and DM2 patients (DM+).
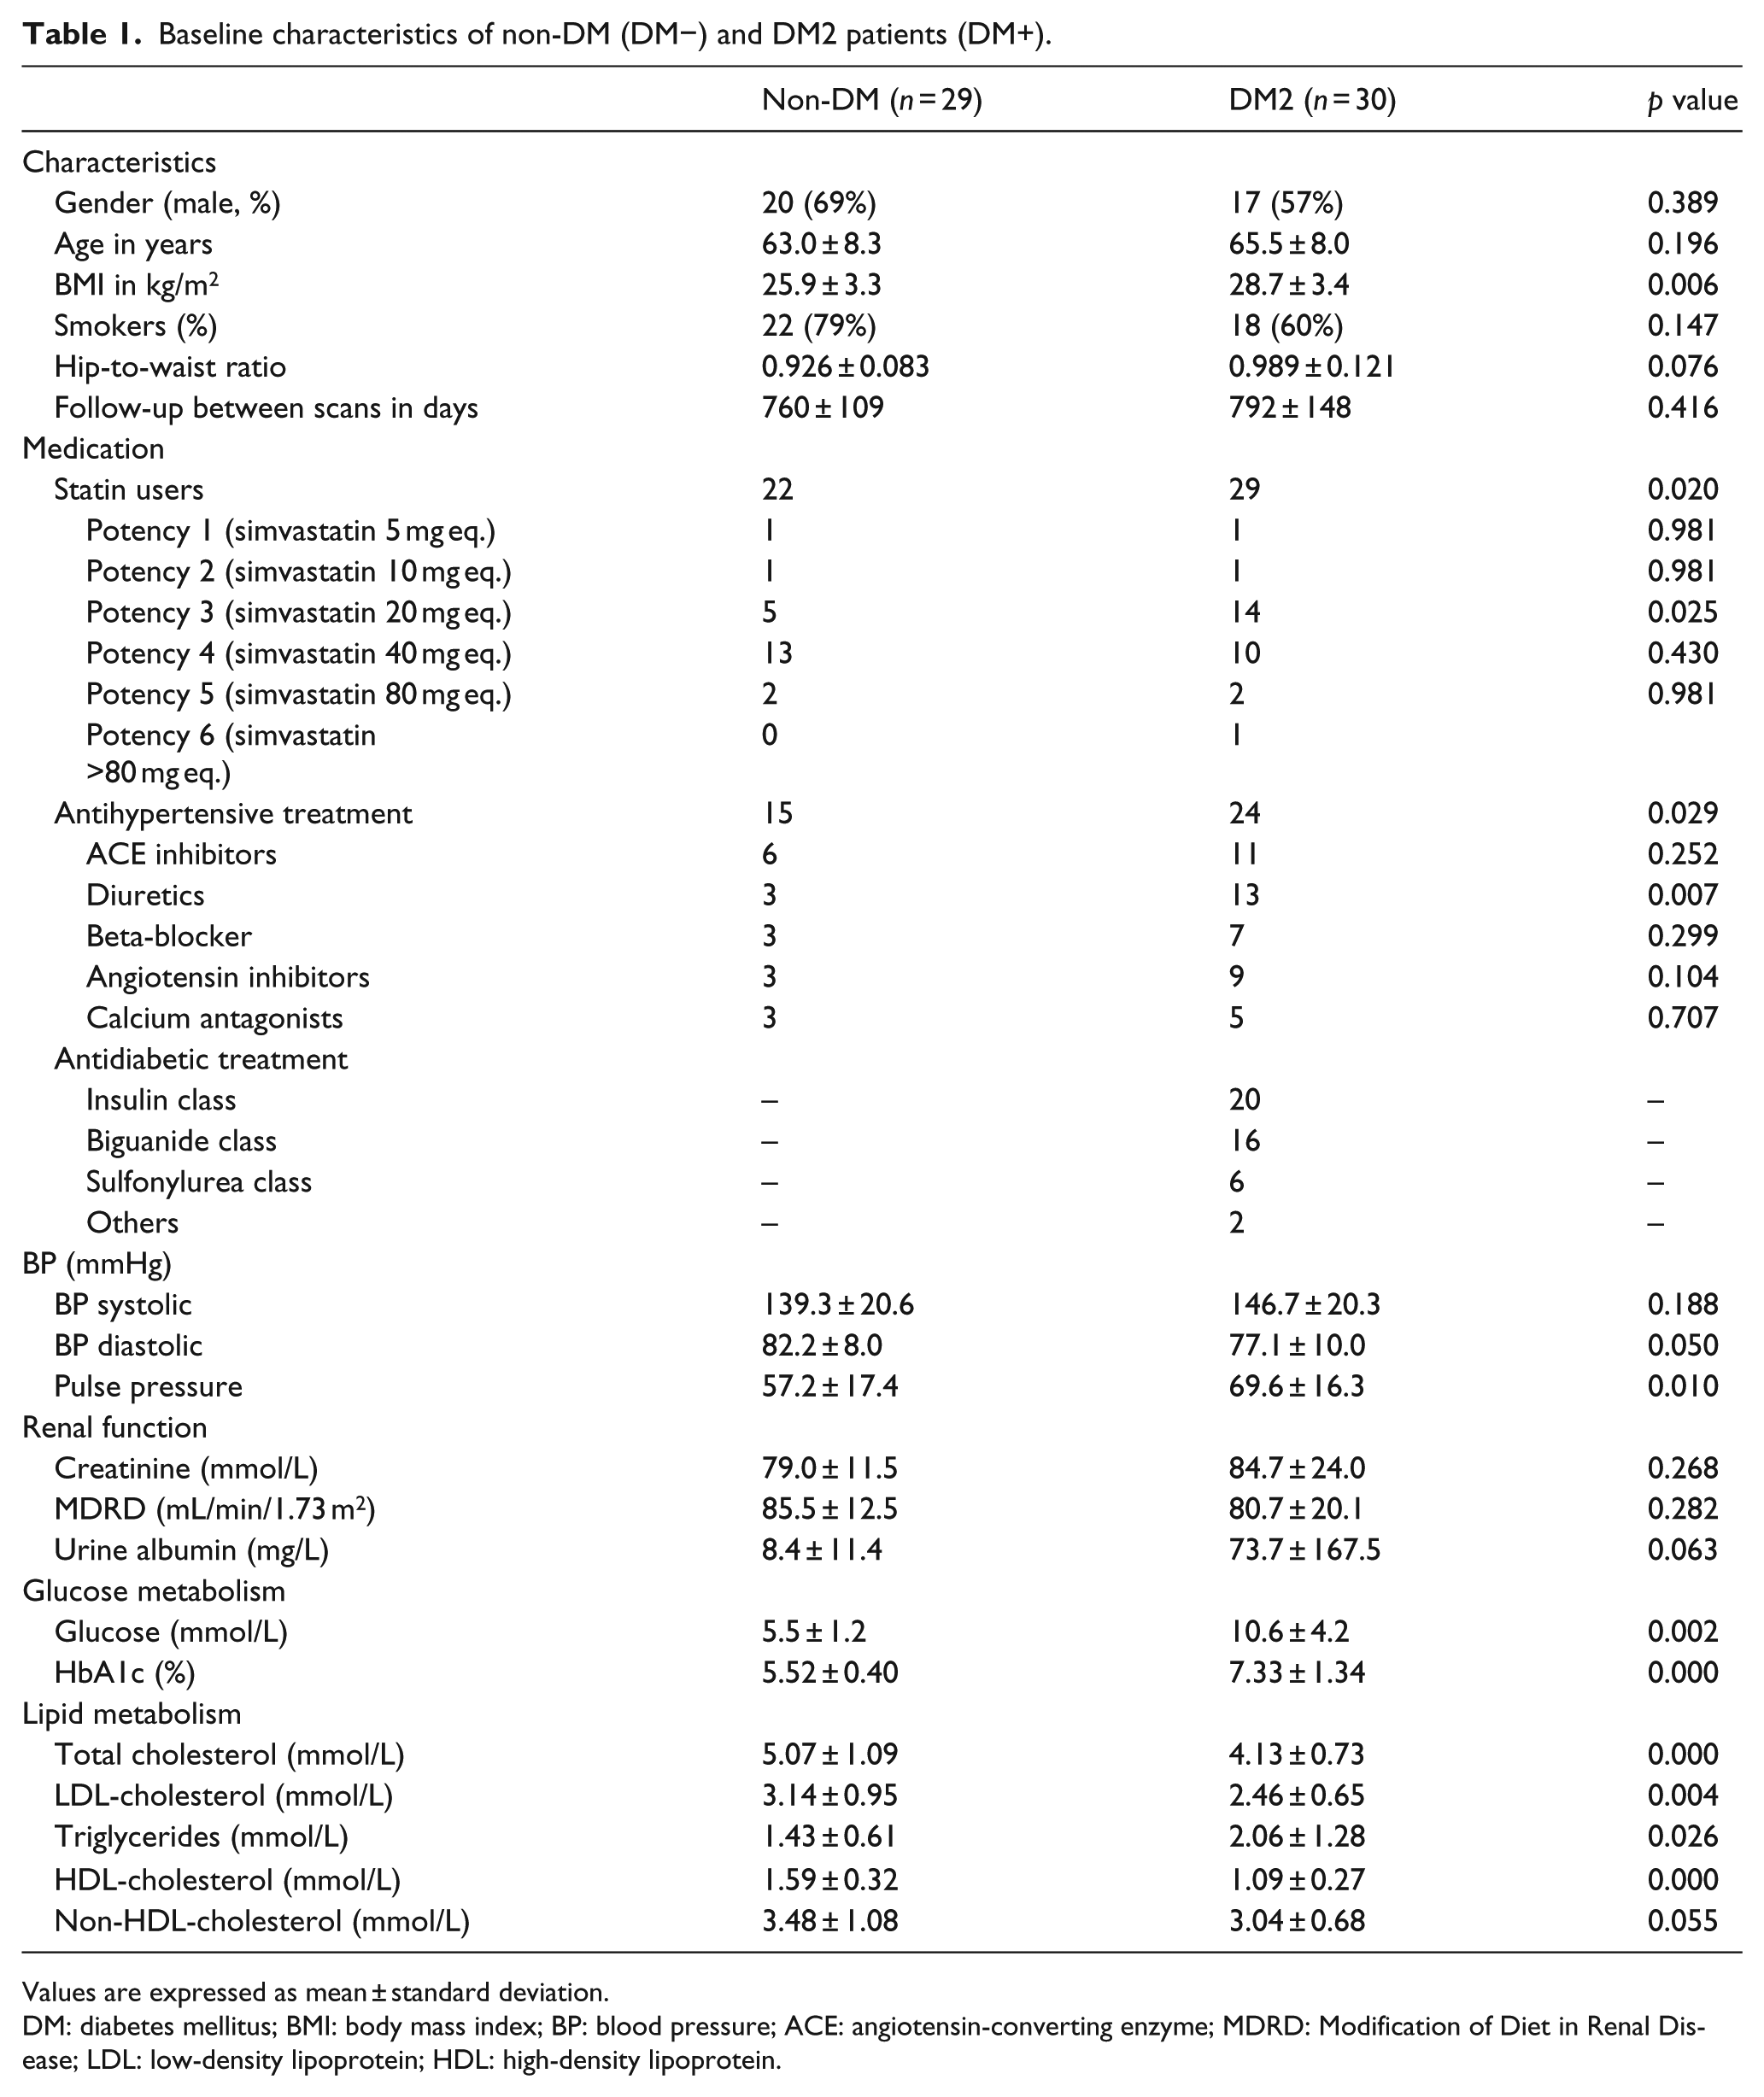
Values are expressed as mean ± standard deviation.
DM: diabetes mellitus; BMI: body mass index; BP: blood pressure; ACE: angiotensin-converting enzyme; MDRD: Modification of Diet in Renal Disease; LDL: low-density lipoprotein; HDL: high-density lipoprotein.
At baseline, no significant differences between DM2 patients and non-DM patients were observed in LA, TVA and TWV (Figure 2).
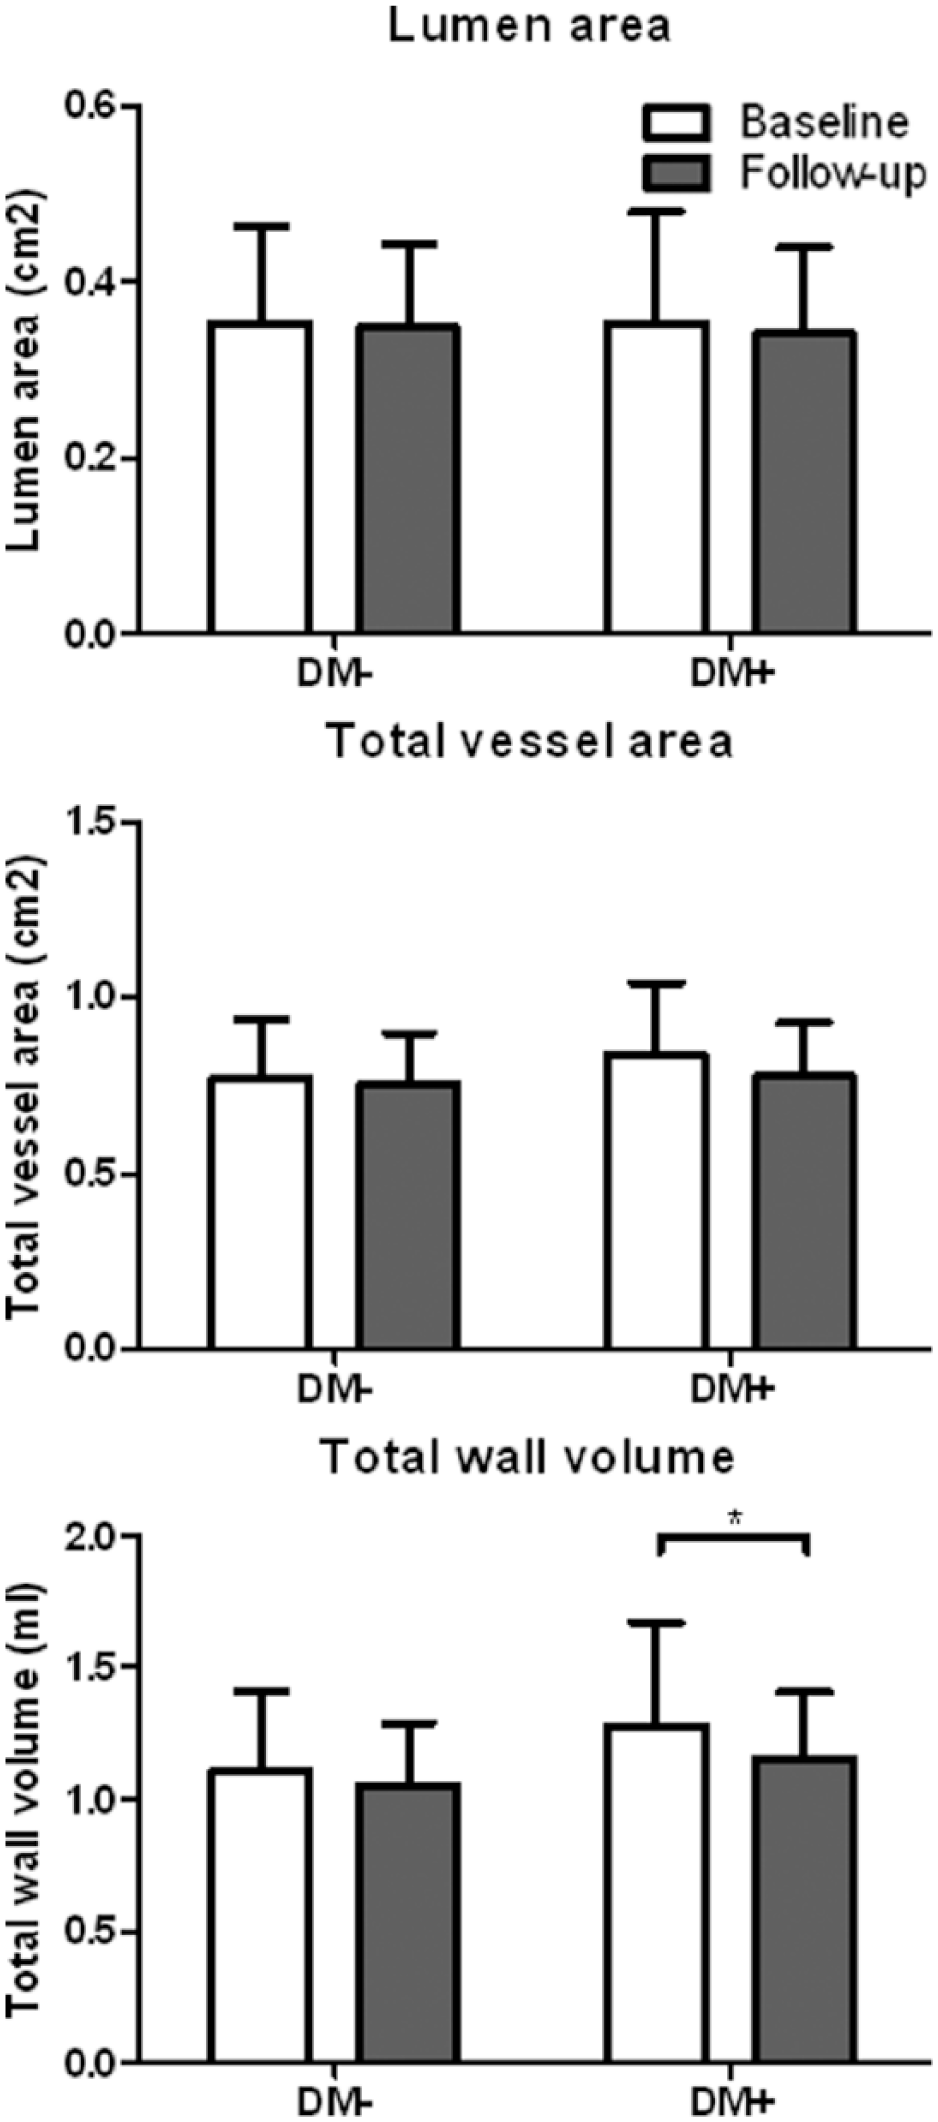
Carotid artery wall dimensions at baseline and at follow-up in non-DM (DM−) and DM2 patients (DM+). Mean and SD dimensions are shown.
At follow-up, a significant decrease was observed in the vessel wall dimension in patients with DM2 compared to baseline. TWV decreased 9.6% (p = 0.016; Figure 2). In non-DM patients, the TWV decreased 2.2% only (p = 0.259).
BMI was the single significant predictor for change in TWV in both groups (p=0.046; Table 2). The predictive role of BMI remained significant after adjustment for the contribution of LDL-cholesterol, HDL-cholesterol, pulse pressure and HbA1c at baseline.
Significant predictors for change TWV.
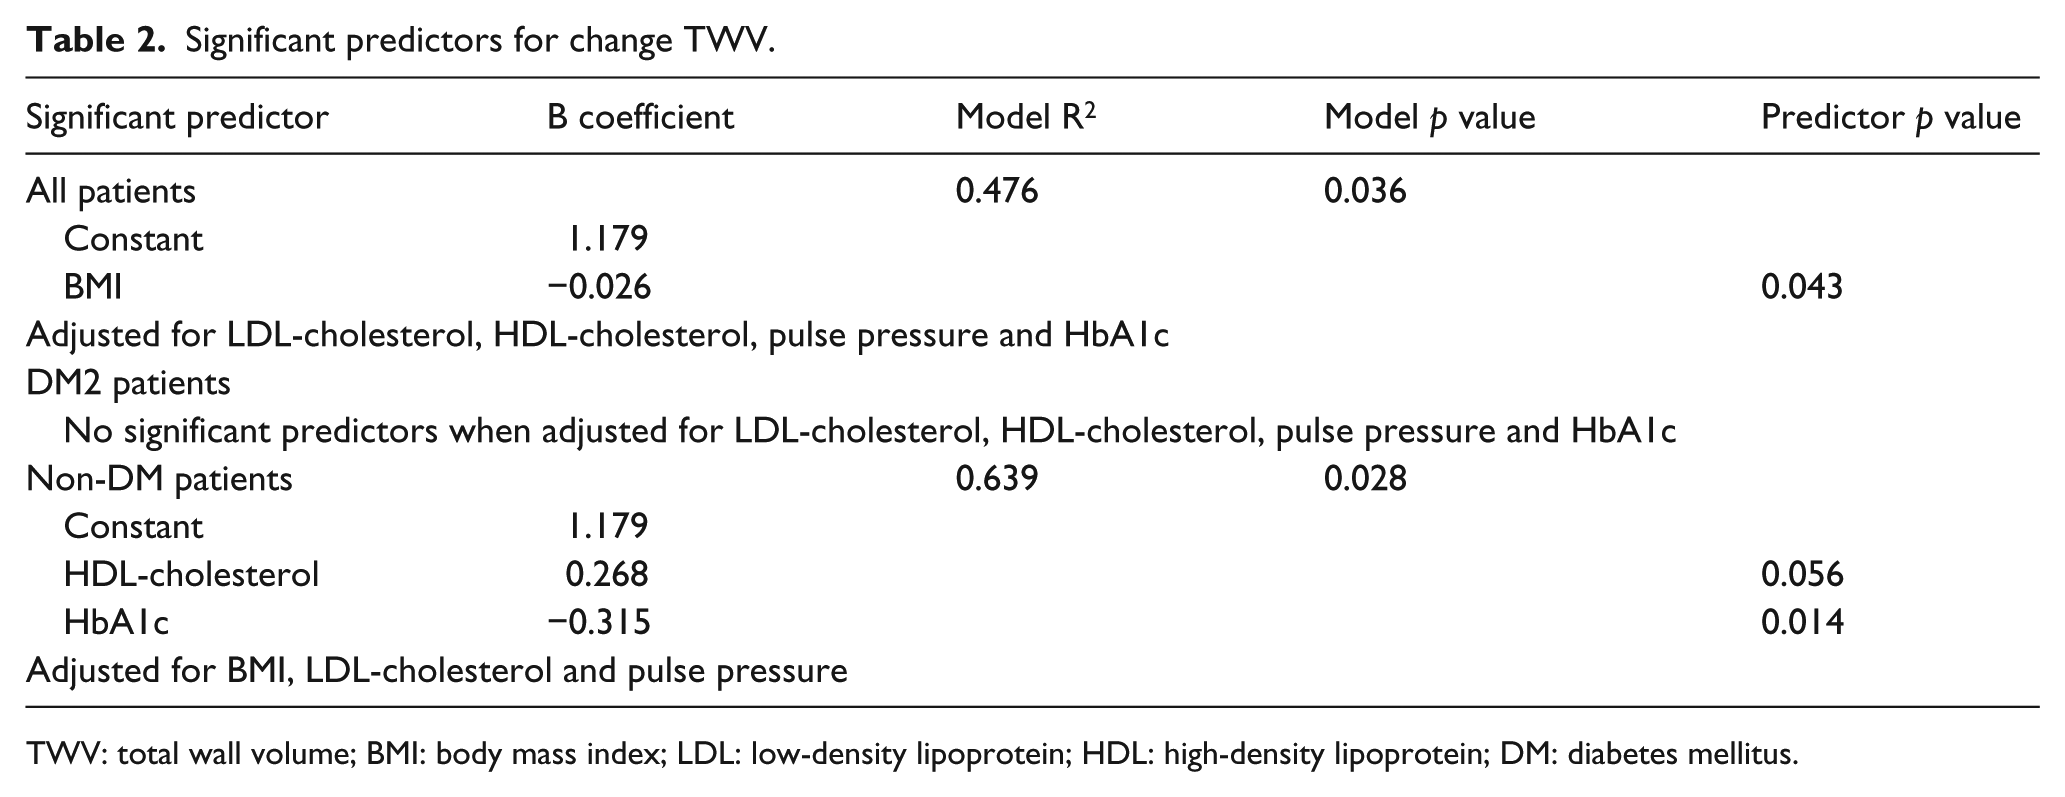
TWV: total wall volume; BMI: body mass index; LDL: low-density lipoprotein; HDL: high-density lipoprotein; DM: diabetes mellitus.
No predictors for within-group variation in TWV (ΔTWV) in DM2 patients could be identified in using multivariate linear regression analysis. In non-DM patients, HbA1C was identified as predictor for within-group variation despite insignificant difference in TWV in this group at follow-up compared with baseline, even after adjustment for contribution of baseline BMI, LDL-cholesterol and pulse pressure (p=0.014; Table 2).
No significant changes in mean LDL-cholesterol, glucose and HbA1c were observed between baseline and follow-up in both DM2 and non-DM patient groups (Figure 1 Supplemental Data).
Discussion
In this study, we show a decrease in the TWV and mean wall area of the CA in DM2 patients with CA stenosis after 2 years of guideline-based CV prevention therapy. In contrast, a stabilization of the vessel wall parameters was observed in non-DM patients with CA stenosis receiving similar CV prevention. BMI was identified as predictor for a decrease in TWV after 2 years of follow-up.
Decrease in vessel wall dimensions in DM2 patients after 2 years
The decrease in CA wall dimensions expressed as TWV at follow-up in DM2 patients illustrates that particularly in these patients guideline treatment is efficacious at CVD risk reduction. Such a decrease in TWV may not only lead to a decrease in major CV events but also might reduce mortality, especially if treatment is continued for a lifetime period.
Identification of predictive parameters for TWV decrease in DM2 patients was performed by multivariate linear regression. In this way, plasma glucose, HbA1c levels and the diagnosis DM fully participated in analysis and were ruled out as bias. By doing so, BMI was identified as the only predictor for TWV decrease.
To be specific, having a high BMI is associated with stronger decrease of TWV, even if adjusted for alternative traditional CV risk factors. The latter suggest that DM2 patients with a high BMI benefit the most from guideline CV prevention regimens.
Indeed, high BMI has been widely associated with increased CV mortality and morbidity in both DM2- and non-DM patients. 15 BMI was in addition identified as predictor for 6-year progression of CIMT in a population of young adults, independent from other components of metabolic syndrome. High BMI in patients with established CV morbidity has been associated with superior medication treatment response compared with patients with normal BMI. 16 In addition, a stronger decrease in BMI in patients with coronary artery disease (CAD) results in a higher decrease in coronary atherosclerosis, especially in patients with metabolic syndrome. 17 These findings support the hypothesis that patients with obesity have atherosclerotic lesions with higher inflammatory activity that allows stronger inhibitory effect of statins, resulting in a stronger reduction in vessel wall dimension. 18 The presence of diabetes may contribute to even higher inflammatory lesions. Opposite effect of BMI was reported by Tani et al., 19 who showed that high BMI attenuates the anti-atherosclerotic effects of pravastatin, supposed to be caused by the presence of more pro-atherosclerotic stimuli in obese patients, inhibiting the effects of pravastatin.
No predictors were identified for the within-group variation in TWV in DM2 patients. This could partly be attributed to the lack of variation and in part due to adjusting for several risk factors.
Vessel wall dimensions in non-DM patients after 2 years
In non-DM patients, CA wall dimensions were unchanged after 2 years of follow-up, indicating that atherogenesis was arrested during the 2-year follow-up. Though HbA1c was identified as significant predictor, even after adjustment for traditional risk factors. High levels of HbA1c were associated with a stronger decrease in TWV than low levels of HbA1c. We thus can conclude that long-term exposure to these high levels of glycated haemoglobin is associated with increased atherosclerosis, resulting in higher CVD and death from any cause, which is in line with recent literature concerning patients without the diagnosis of diabetes. 20
It remains unclear why higher HbA1c robustly predicts a decrease in vessel wall dimensions, despite adjustment for BMI, LDL-cholesterol and pulse pressure. High HbA1c in these patients may be accompanied with elevated levels of LDL-cholesterol. Although not identified as a predictor, the association of elevated LDL-cholesterol levels and accelerated atherogenesis has been widely acknowledged.21–24
Study limitation
MRI was performed using a 1.5-T MRI. Recently published studies that use MRI to determine changes in the CA wall often use field strengths of 3 T or above. However, the inferior field strength in a head-to-head comparison has proven to be equally utilizable for morphometric measurements, despite lower signal-to-noise ratios.25,26
Our method for patient selection using ultrasonography to detect common CA stenosis may have yielded a heterogeneous group of patients. Since carotid ultrasound measurement of plaque only includes the interior quadrant of the CA, this technique may overestimate the actual stenosis rate as measured by MRI. 27 The smaller wall dimensions of the included patients as observed by MRI may have reduced the measured effect size.
Conclusion
Our study demonstrates that especially patients with DM2 with high levels of BMI benefit from strict adherence to treatment guidelines. Although all patients were on treatment during study initiation, DM2 patients demonstrated a decrease in vessel wall dimensions, which may be translated into CV risk modulation. Our results therefore urge clinicians to progressively eliminate effects of risk factors by tenaciously supporting improvement in prescribing drug therapy according to up-to-date CV guidelines.
Footnotes
Acknowledgements
We would like to gratefully and sincerely thank Dr R.J. van der Geest for supplying quantification software (Vessel-Mass) and for his excellent technical engineering and technical advice. We also would like to thank Anne Cappon for her assistance with image analysis.
Declaration of conflicting interests
No conflicts to declare.
Funding
This research was funded with an unrestricted research grand from the Dutch Diabetes Foundation (application number: 2005.00.036). The Dutch Diabetes Foundation had no role in the study design, the collection, analysis and interpretation of the data and in the writing of the report. The authors had full access to all the data in the study and had final responsibility for the decision to submit for publication.
References
Supplementary Material
Please find the following supplemental material available below.
For Open Access articles published under a Creative Commons License, all supplemental material carries the same license as the article it is associated with.
For non-Open Access articles published, all supplemental material carries a non-exclusive license, and permission requests for re-use of supplemental material or any part of supplemental material shall be sent directly to the copyright owner as specified in the copyright notice associated with the article.