
Abstract
Background:
Type 2 diabetes mellitus (DM) severely reduces the benefits of coronary artery bypass grafting (CABG). However, few studies investigated the correlation between preoperative glucose level and endogenous extracellular matrix (ECM)-related gene expression of saphenous vein (SV) conduits in diabetic patients.
Methods:
A total of 130 patients were divided into high-glucose (HG), low-glucose (LG) and control group according to the preoperative level of blood glucose. The expression of ECM-related genes was analysed by microarray.
Results:
Compared with control group, 30 genes showed at least a threefold change in expression in HG group; up-regulation was observed in 24 genes. However, there were only 21 ECM-related genes showed at least a threefold change in expression between the LG and control group. Compared with HG group, matrix metalloproteinases’ (MMPs) expression was significantly decreased in LG and control groups. In contrast to the decrease in MMPs’ expression, expression of tissue inhibitors of metalloproteinases (TIMPs) was increased.
Conclusion:
This study suggested that different preoperative diabetic status affected the expression of ECM-related genes in SV. ECM-related genes were more significantly imbalanced in diabetic patients with uncontrolled preoperative blood glucose than those with well-controlled preoperative blood glucose.
Background
The choice of coronary artery bypass grafting (CABG) conduits has been shown to play a critical role in the prognosis of surgical revascularization.1,2 Although many studies showed that arterial conduits had the superiority in improving long-term survival and reducing recurrence of angina after CABG in all patients, including diabetic patients,3,4 saphenous vein (SV) conduits remained the backbone in graft conduits of CABG. 5 Type 2 diabetes mellitus (DM) is a well-established risk factor to reduce benefits of CABG.6,7 It plays an important role in the development and modulation of vein graft disease.8,9
Vein graft failure occurs following the deposition of extracellular matrix (ECM). 10 Endogenous matrix metalloproteinases (MMPs) and tissue inhibitors of metalloproteinases (TIMPs) regulate vascular structure and may significantly impact the tendency of vessel pathologic remodelling after CABG. 11 MMP subtypes 2 and 9 have been identified as key components in these vascular remodelling processes.12,13 There were some studies to characterize the functional and histological profiles of SV conduits in diabetic patients undergoing surgical revascularization. 14 However, to date, no studies investigated the correlation between preoperative blood glucose profile and the ECM characteristics of SV conduits in diabetic patients. The aims of this study were, therefore, to study the expression profile of ECM-related genes in SV conduits of diabetic patients with different preoperative blood glucose levels.
Subjects and methods
Study subjects
A total of 130 patients with coronary artery disease (CAD) undergoing elective CABG at our institute were enrolled in the study. They were selected by consecutive patient selection method. The study was approved by the local Research Ethics Committee, and each patient signed written informed consent. The patients were divided into three groups according to the preoperative level of fasting blood glucose (FBG) and glycated haemoglobin (HbA1c). In all, 54 subjects with type 2 DM who had long-term (at least over 1 year until hospitalization for CABG operation) high FBG (>7.0 mmol/L) and HbA1c levels (>6.5%) were enrolled in high-glucose (HG) group, regardless of whether getting current treatment with insulin or oral hypoglycaemic agents. In low-glucose (LG) group, 36 subjects with type 2 DM who had well-controlled FBG (<7.0 mmol/L) and HbA1c levels (<6.5%) were enrolled. The control group comprised other 40 patients who had no preoperative history of type 2 DM. And the diabetic patients in HG and LG groups were all matched to the controls. Exclusion criteria were inflammation, infectious diseases, overt clinical heart failure, malignancy or acute coronary event during the last 2 months. The demographic characteristics of the study population are presented in Table 1.
The demographics of the studied population.
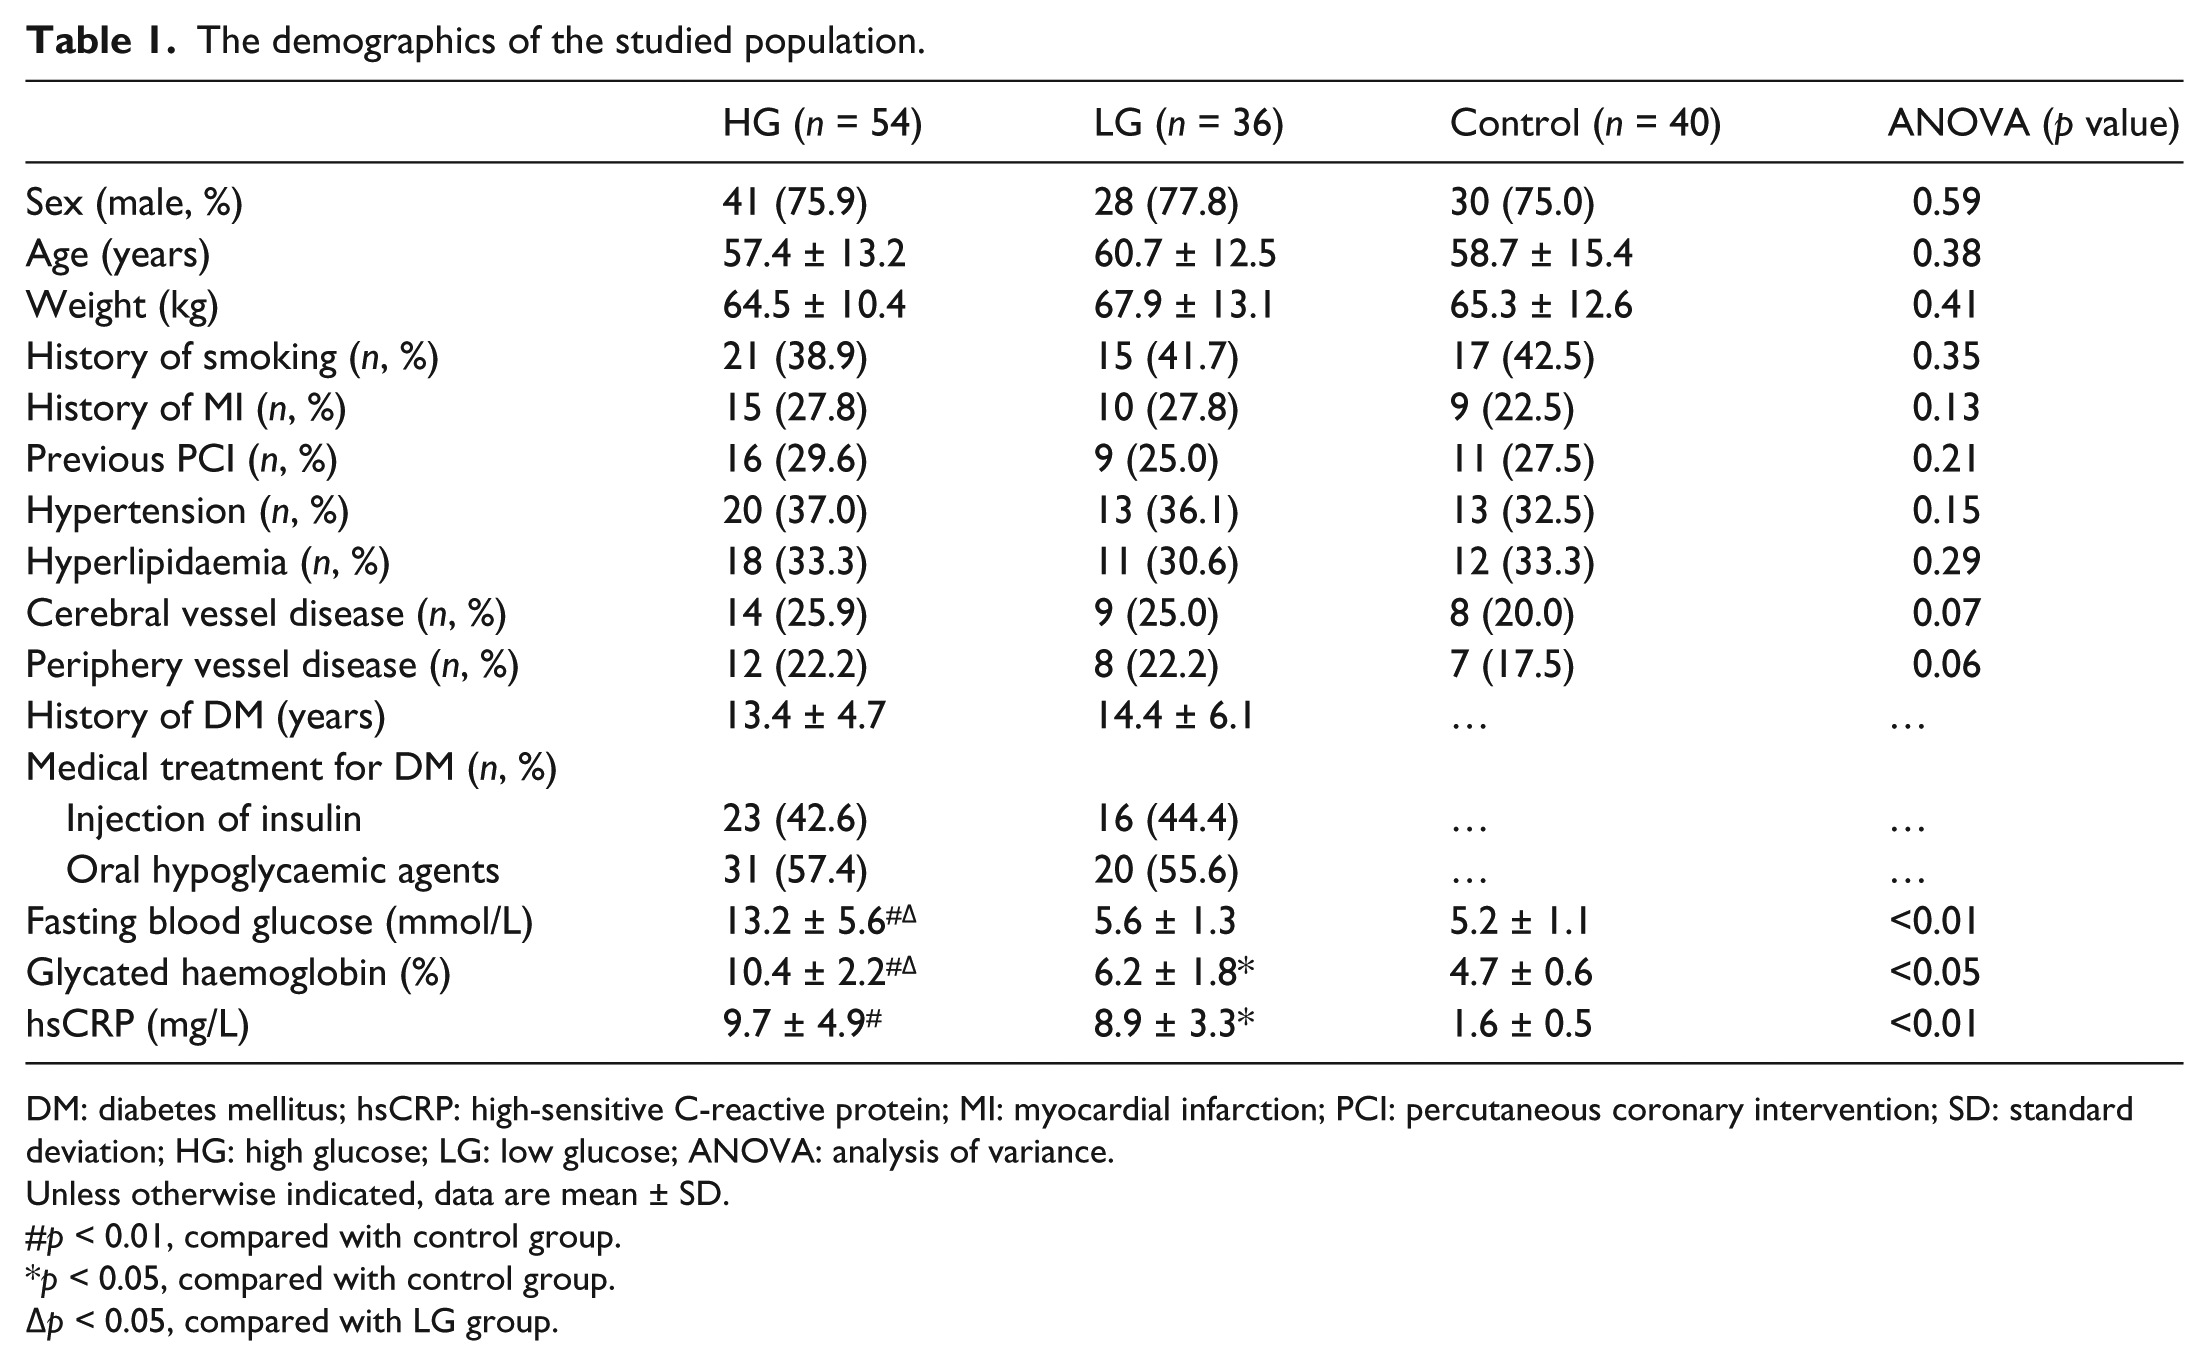
DM: diabetes mellitus; hsCRP: high-sensitive C-reactive protein; MI: myocardial infarction; PCI: percutaneous coronary intervention; SD: standard deviation; HG: high glucose; LG: low glucose; ANOVA: analysis of variance.
Unless otherwise indicated, data are mean ± SD.
p < 0.01, compared with control group.
p < 0.05, compared with control group.
p < 0.05, compared with LG group.
Tissue samples and ribonucleic acid extraction
SV tissue samples were obtained in CABG surgery and put into RNAlater™ (Ambion, Austin, TX, USA) for storage at −80°C. Total ribonucleic acid (RNA) extraction was carried out using the RNeasy® Mini Kit (Qiagen Inc., Valencia, CA, USA) according to the manufacturer’s instructions.
Gene expression profile analysis
The expression profile of ECM and adhesion molecule genes was analysed using the RT 2 Profiler™ PCR Array Human Extracellular Matrix and Adhesion Molecules (PAHS-013A; SuperArray Bioscience Corp., Frederick, MD, USA). The arrays in 96-well plates contain primer assays for 84 pathway- or disease-focused genes and 5 housekeeping genes. Using Moloney murine leukaemia virus (MuLV) reverse transcriptase (Applied Biosystems, Foster City, CA, USA), 1.0–2.0 µg of total RNA was reverse transcribed into single-strand complementary deoxyribonucleic acid (cDNA). Calculate the threshold cycle (Ct) for each well using the real-time cycler software.
Immunohistochemical Staining of MMP-2, MMP-9, TIMP-2 and TIMP-3 in SV
After paraffin sections were dewaxed and hydrated, endogenous peroxidase was blocked by 3% hydrogen peroxide. The slides were incubated overnight at 4°C with the primary antibody (anti-MMP or anti-TIMP; Santa Cruz Biotechnology, Inc., Santa Cruz, CA, USA) at dilutions of 1:100, followed by biotinylated secondary antibody (Beijing Zhongshan Co., Ltd, Beijing, China) incubation for 30 min at room temperature. Sections incubated with phosphate buffered saline (PBS) instead of the primary antibody were used as negative control. Images of immunohistochemical staining were evaluated using a semiquantitative immunoreactive score system. 15 Briefly, the expression levels of MMPs/TIMPs proteins were assessed by estimating the percentage of positively stained cells. Depending on the percentage of positive cells, four categories were established: 0, no positive cells; 1+, positive cells in less than one-third; 2+, positive cells in 33%–67% and 3+, positive cells in more than two-thirds of total cell population.
Western-blot analysis of tissue MMP-2, MMP-9, TIMP-2 and TIMP-3 protein
Protein samples (100 µg) extracted from vascular tissues were loaded onto an 8% sodium dodecyl sulphate (SDS)-polyacrylamide gel and separated at 100 mA overnight and then transferred to the membranes. The membranes were then incubated overnight at 4°C with different primary antibodies separately (anti-MMP-2, anti-MMP-9, anti-TIMP-2, anti-TIMP-3 or anti-β-actin; Calbiochem, San Diego, CA, USA) at a dilution of 1:400. After washed with PBS, the immunoblots were incubated with horseradish peroxidase–conjugated secondary antibody (Jackson Immunolab, West Grove, PA, USA). After washing, signals were detected by enhanced chemiluminescent (ECL) detection solutions (Amersham Life Sciences, Arlington Height, IL, USA) on Kodak films. MMPs/TIMPs proteins were determined according to their molecular weight, and the expression levels of these proteins were analysed by colorimetry scanning. β-actin was used as a loading control for nomalization. The images were analysed by an investigator blinded to the identity of the images.
Data analysis
All values were expressed as means ± standard deviation (SD). Quantitative polymerase chain reaction (qPCR) results were reported as relative gene expression and the fold change in target genes were determined by the 2-ΔΔCt method.
16
As the qPCR performed on the array was just comparatively quantitative, the normalized gene-expression data obtained from the PCR array were only represented by Ct value. To evaluate gene expression profile in the experimental group, fold change was determined as
Results
Demographic characteristics of patients
The three groups were well matched for age, sex and presentation profile except for preoperative diabetic profile (Table 1). Although the preoperative serum levels of FBG and HbA1c between HG and LG groups were obviously different, the medical treatment for these two groups had no difference.
ECM-related gene expression analysed by microarray
The 84 ECM-related genes in this microarray were all showed in Table 2. Between the HG and control groups, 30 genes showed at least threefold change in expression. Expression of 24 genes was up-regulated, while 6 genes appeared to be down-regulated. However, only 21 genes showed a threefold change in expression between the LG and control groups, with 16 genes up-regulated and 5 genes down-regulated.
Microarray analysis of ECM-related gene expression.
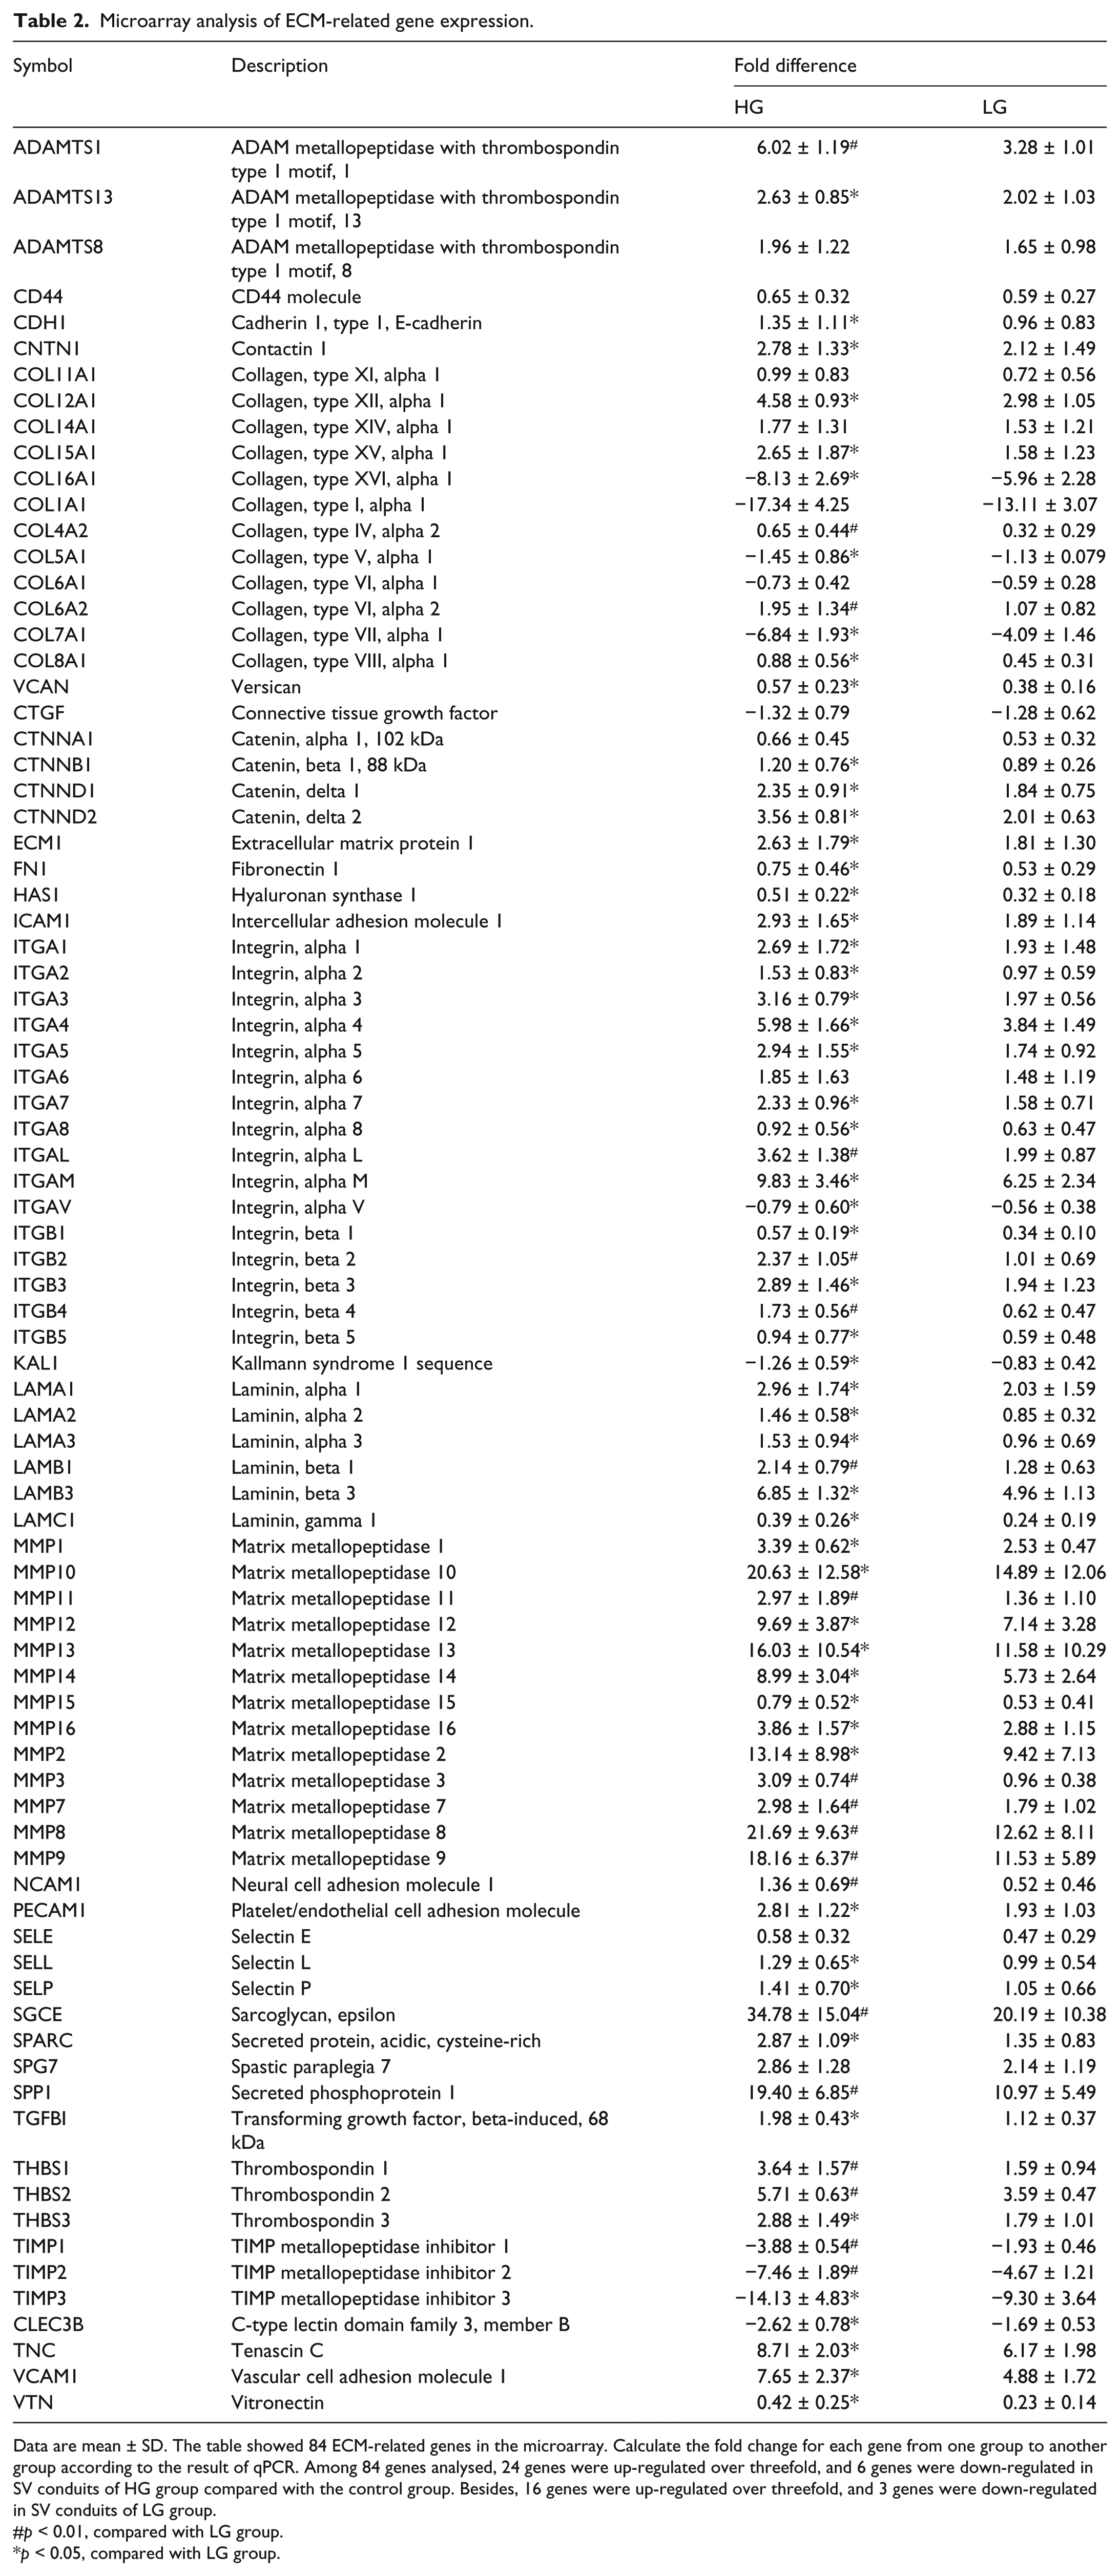
Data are mean ± SD. The table showed 84 ECM-related genes in the microarray. Calculate the fold change for each gene from one group to another group according to the result of qPCR. Among 84 genes analysed, 24 genes were up-regulated over threefold, and 6 genes were down-regulated in SV conduits of HG group compared with the control group. Besides, 16 genes were up-regulated over threefold, and 3 genes were down-regulated in SV conduits of LG group.
p < 0.01, compared with LG group.
p < 0.05, compared with LG group.
Immunohistochemistry evaluation of MMP-2, MMP-9, TIMP-2 and TIMP-3 expression
Matrix metallopeptidase 2 (MMP-2) and matrix metallopeptidase 9 (MMP-9) expression levels were positively correlated with the blood glucose level. Compared with the control group, MMP-2 and MMP-9 expression levels were significantly increased in HG and LG groups (p < 0.05). However, MMP-2 and MMP-9 expression levels were decreased in LG group when compared with HG group. In contrast, tissue inhibitor of metalloproteinase 2 (TIMP-2) and tissue inhibitor of metalloproteinase 3 (TIMP-3) expression levels were inversely correlated with the blood glucose level. Expression level of TIMP protein was the lowest in HG group, increased in LG group and the highest in the control group (p < 0.05) (Table 3, Figure 1).
Immunohistochemistry evaluation of MMP-2, MMP-9, TIMP-2 and TIMP-3 expression.
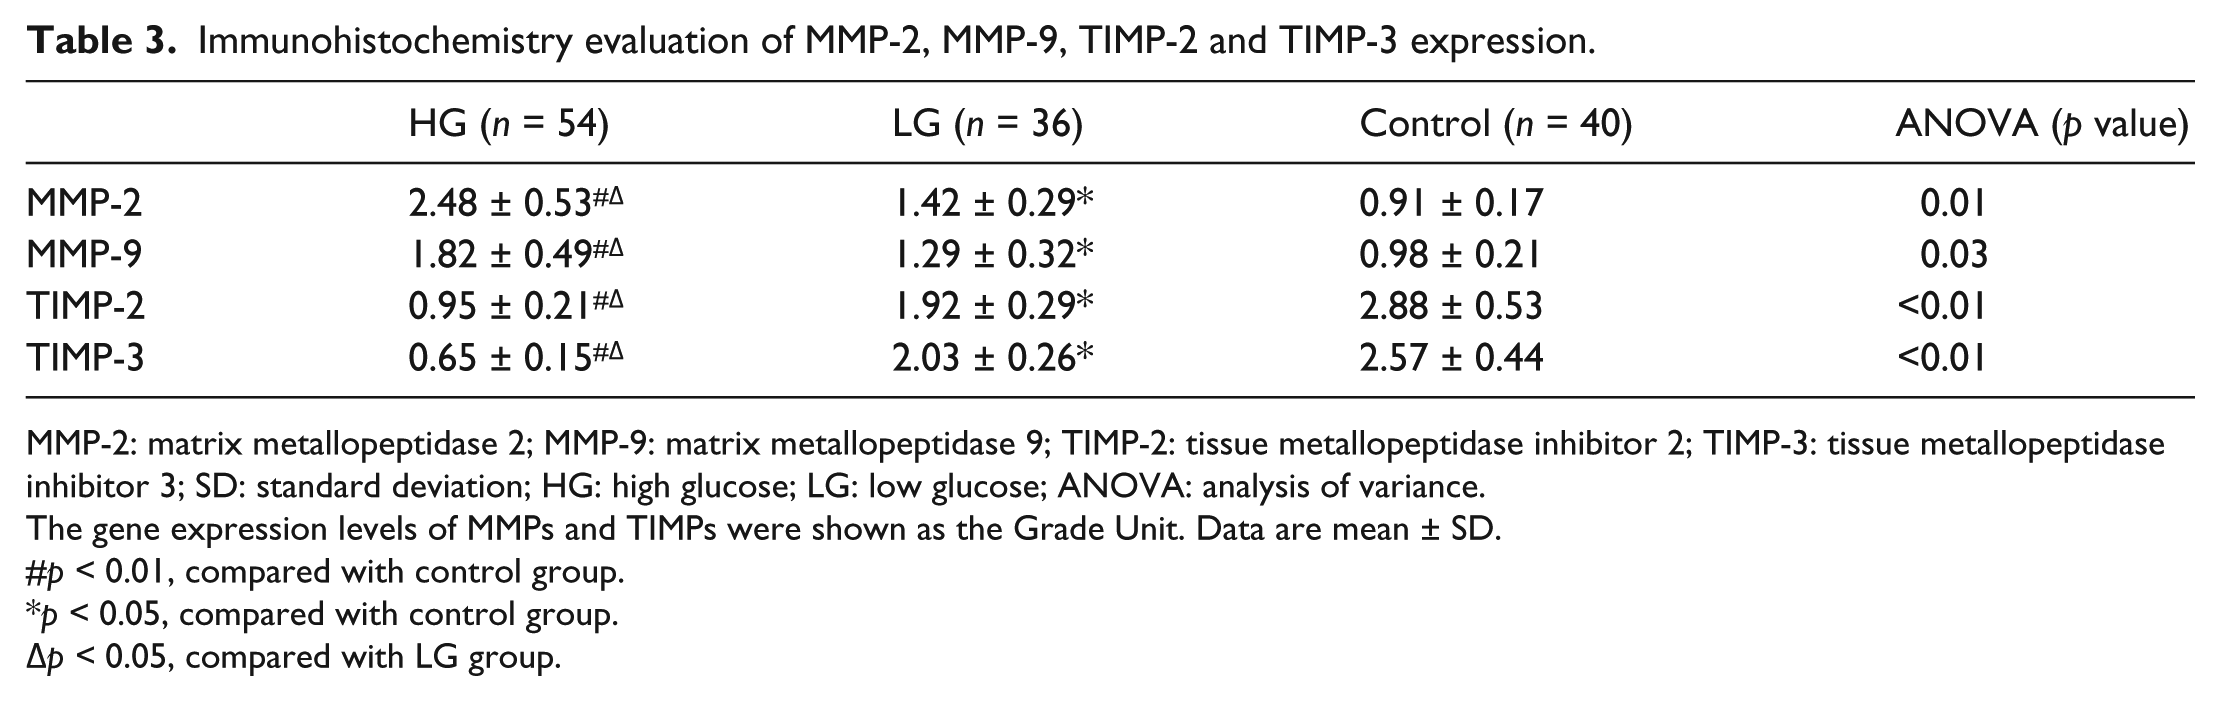
MMP-2: matrix metallopeptidase 2; MMP-9: matrix metallopeptidase 9; TIMP-2: tissue metallopeptidase inhibitor 2; TIMP-3: tissue metallopeptidase inhibitor 3; SD: standard deviation; HG: high glucose; LG: low glucose; ANOVA: analysis of variance.
The gene expression levels of MMPs and TIMPs were shown as the Grade Unit. Data are mean ± SD.
p < 0.01, compared with control group.
p < 0.05, compared with control group.
p < 0.05, compared with LG group.
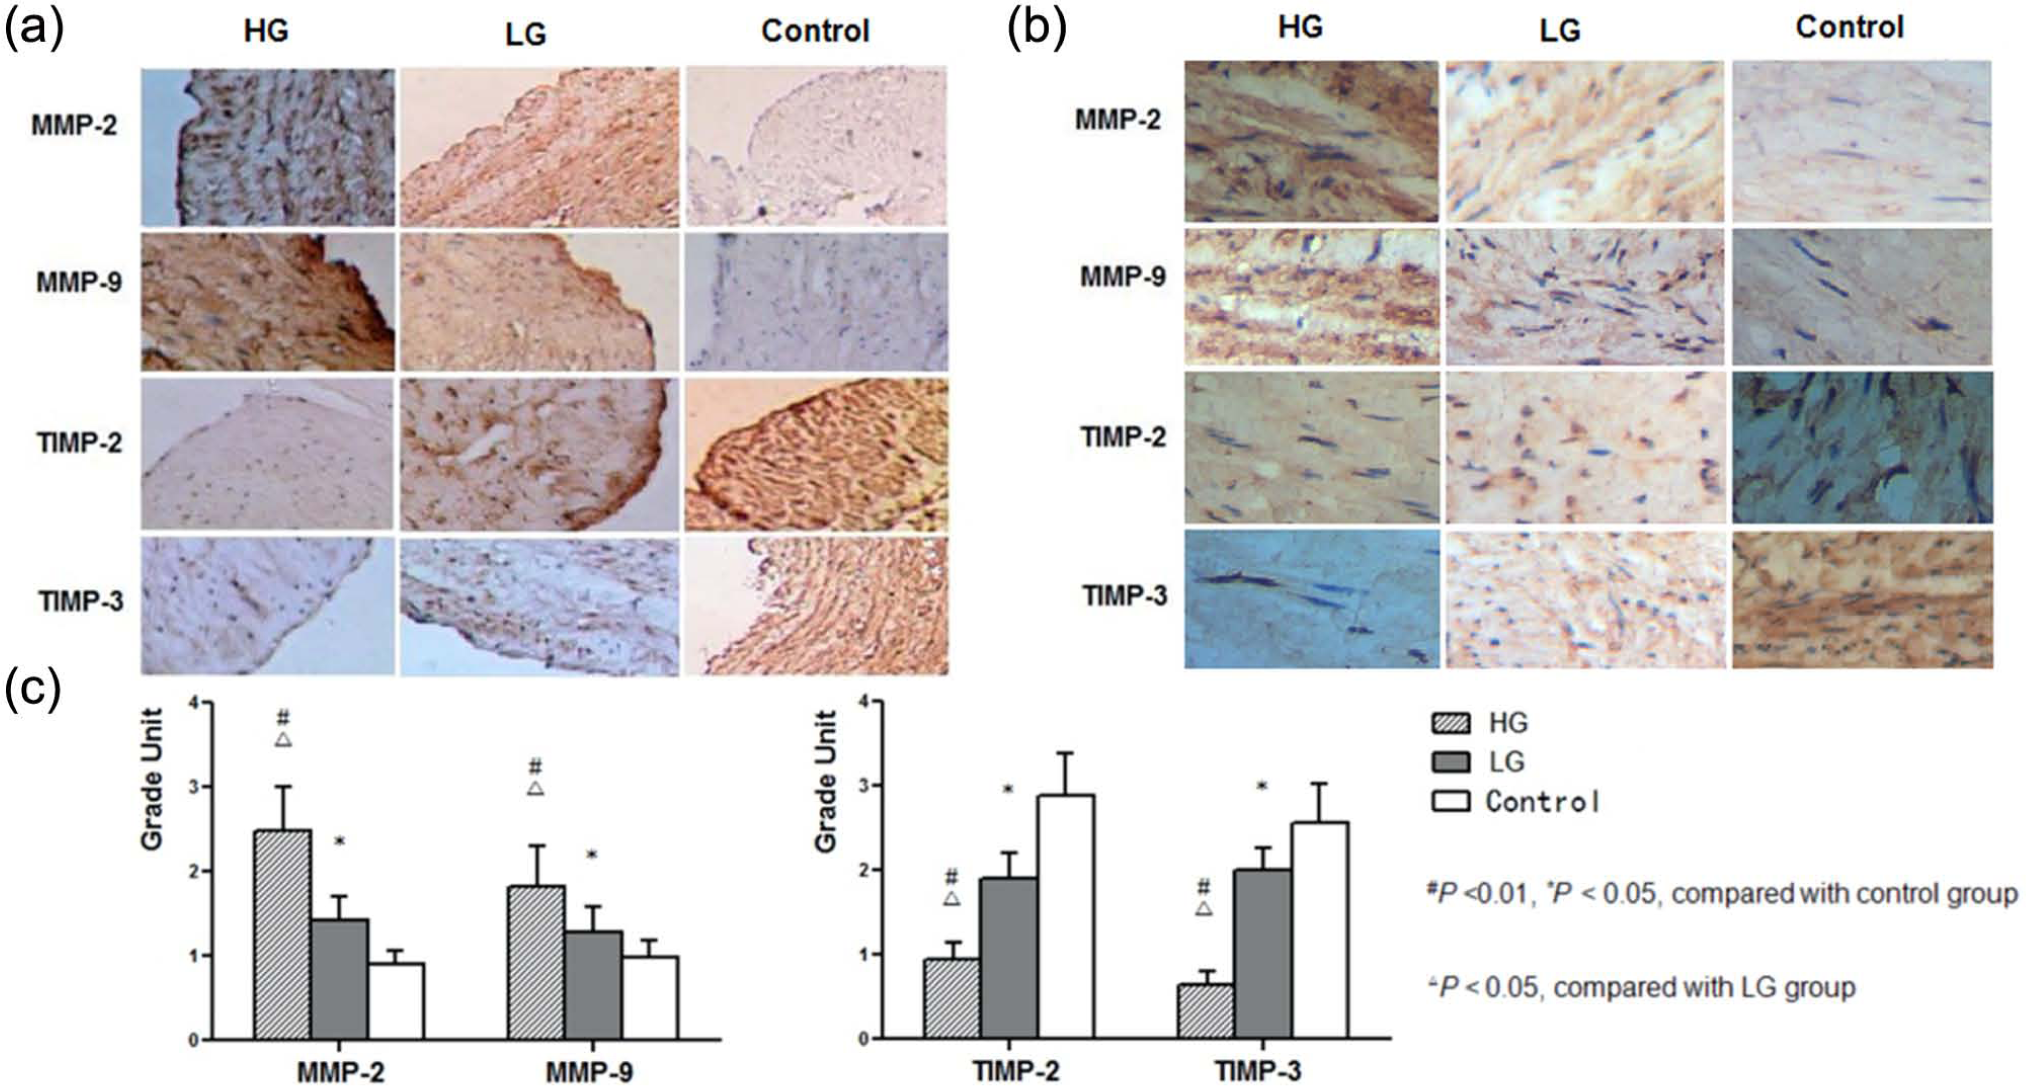
Immunostaining of MMPs/TIMPs in SV conduits of patients with different preoperative blood glucose levels. The representative immunohistochemistry shows MMP-2, MMP-9, TIMP-2 and TIMP-3 immunostaining in SV conduits of patients in different groups. 3,3′-Diaminobenzidine (DAB) staining, original magnification: (a) 100× and (b) 400×; (c) quantitative analysis.
Western-blot analysis of tissue MMP-2, MMP-9, TIMP-2 and TIMP-3 levels
In accordance with the immunohistochemical staining results, MMP-2 and MMP-9 protein levels in SV tissue were positively correlated with blood glucose level, highest in HG group, low in LG group and lowest in control group (p < 0.05). In contrast, TIMP-2 and TIMP-3 protein levels were inversely correlated with blood glucose level (p < 0.05) (Table 4, Figure 2).
Western-blot analysis of tissue MMP-2, MMP-9, TIMP-2 and TIMP-3 protein levels.
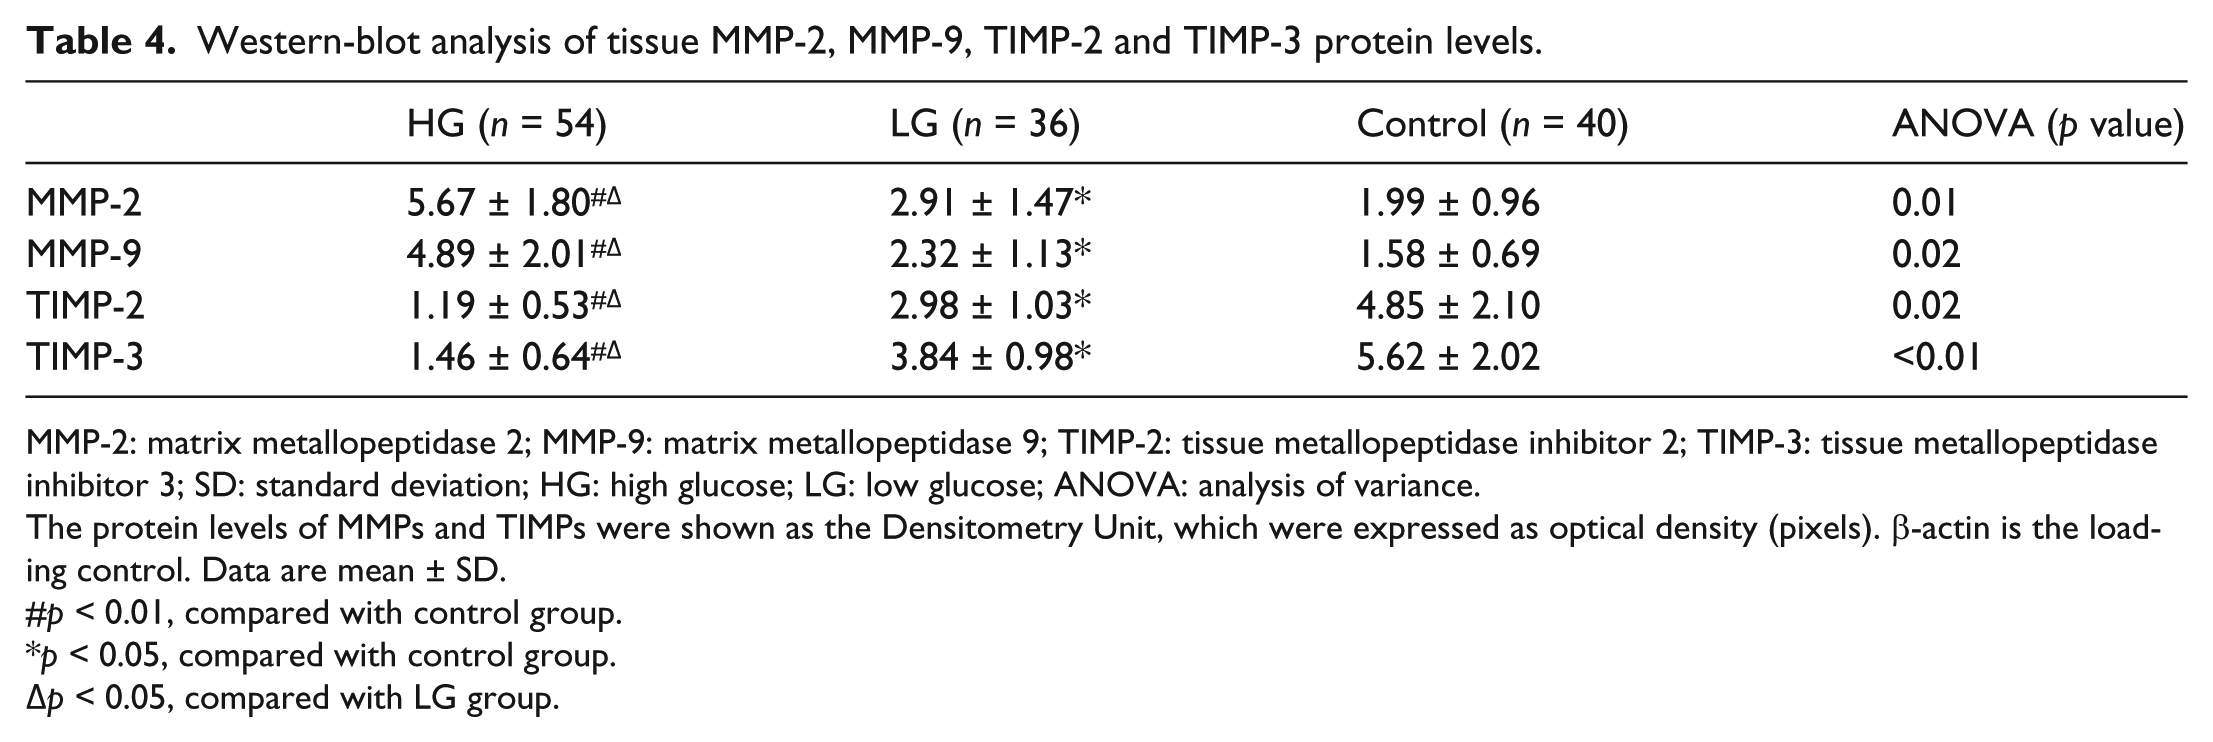
MMP-2: matrix metallopeptidase 2; MMP-9: matrix metallopeptidase 9; TIMP-2: tissue metallopeptidase inhibitor 2; TIMP-3: tissue metallopeptidase inhibitor 3; SD: standard deviation; HG: high glucose; LG: low glucose; ANOVA: analysis of variance.
The protein levels of MMPs and TIMPs were shown as the Densitometry Unit, which were expressed as optical density (pixels). β-actin is the loading control. Data are mean ± SD.
p < 0.01, compared with control group.
p < 0.05, compared with control group.
p < 0.05, compared with LG group.
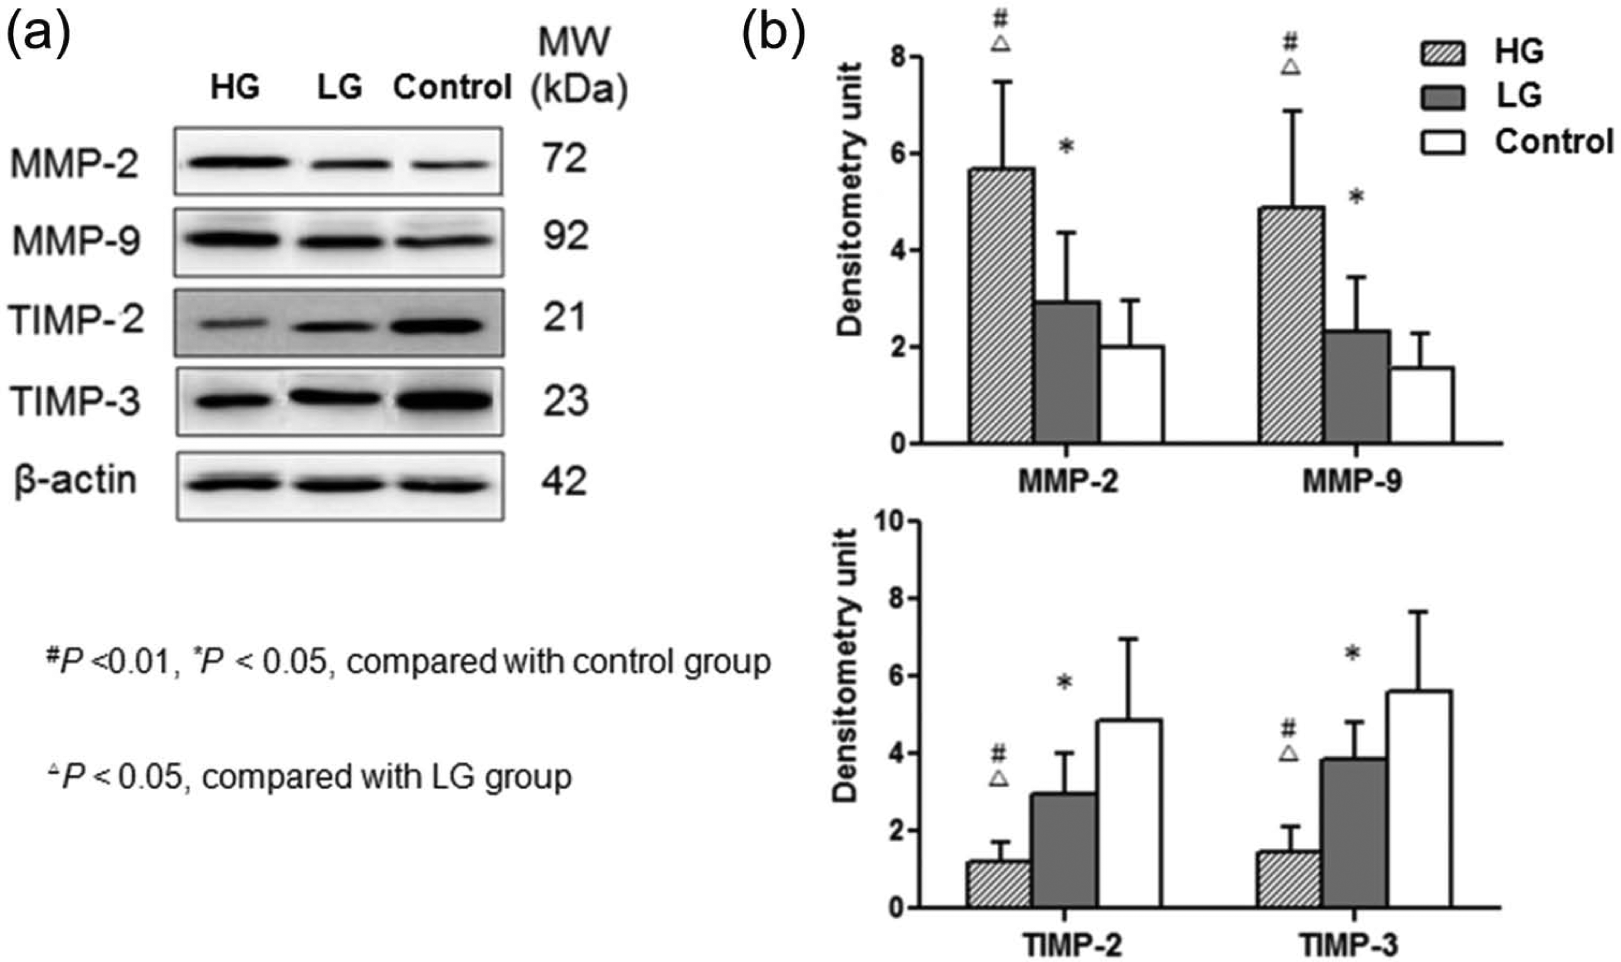
Tissue MMPs/TIMPs protein levels in SV conduits of patients with different preoperative glucose profiles. Western blot was performed to determine the expression of MMP-2, MMP-9, TIMP-2 and TIMP-3 protein levels in SV of different groups. β-actin was used as a loading control. (a) Representative western-blot image and (b) quantitative analysis.
Discussion
This study provides two main findings: First, before exposed to increased blood flow and pressure in the arterial system, the pathological remodelling of SV characterized by imbalanced ECM-related gene expression in diabetic patients has begun; second, the characteristics of endogenous ECM-related genes in SV conduits of diabetic patients with different preoperative FBG levels were also not the same. Expression of ECM-related genes was more dramatically changed in diabetic patients with uncontrolled FBG than diabetic patients with well-controlled FBG.
The ultimate goal of CABG is to achieve complete revascularization with conduits that will remain patent for the duration of patient’s lifetime. Unfortunately, the long-term results of CABG are limited by stenosis and subsequent occlusion of SV grafts. Progressive intima hyperplasia characterized by smooth muscle cell (SMC) proliferation and deposition of ECM is the culprit for the majority of the occlusive lesions. 17 This pathologic process requires ECM breakdown induced by the MMPs. The MMPs are a family of zinc-dependent enzymes, which participate in the constant synthesis and degradation of the ECM. The MMP family consists of at least 23 proteases, 14 of which can be detected in blood vessels.18,19 The precise identity of the MMPs involved in vein graft neointima formation is not known. Breakdown of the basement membrane by MMP-2 and MMP-9 allows SMC migration leading to the formation of foam cells and atherosclerotic plaques, which contribute to late vein graft failure.20,21 In addition to transcriptional regulation and activation of pro-forms, MMPs’ activity is strictly controlled by binding to endogenous TIMPs.
Type 2 DM causes a variety of changes in vessels. The vascular changes involve both cellular and extracellular components. 22 In order to determine how the activity of ECM and adhesion molecules is altered in SV of diabetic patients, gene expression profile was investigated by microarray. Our data indicated that DM did deeply affect the biological properties of ECM activity. Gene expression profile of ECM and adhesion molecules in SV conduits in diabetic patients showed signs of the ‘vein graft disease process’ before coronary surgery. Some important ECM and adhesion molecules, including MMPs, TIMPs and collagen, showed significantly different expression levels.
Some studies focused on animal models with high FBG level or typically diabetic patients. These observations raise the question of whether the conditions of SV conduits in diabetic patients with long-term well-controlled FBG could be as good as those of non-diabetic patients. To answer this question, we studied expression profile of ECM-related genes in SV conduits of diabetic patients with different preoperative FBG levels. In conclusion, ECM-related gene expression was significantly dysregulated in SV conduits of diabetic patients with uncontrolled level of FBG. However, compared with non-diabetic patients, significant changes of ECM-related gene expression were still observed in LG patients even though FBG level was well controlled for a long time before surgery. It was interesting to note that in our study, we did not observe the difference in serum high-sensitive C-reactive protein (hsCRP) concentration between well-controlled and uncontrolled diabetic patients. Type 2 DM is a strong risk factor for CAD, which in turn is the leading cause of mortality and morbidity in diabetic patients. Although this increasing risk has been attributed primarily to hyperglycaemia, dyslipidemia and a prothrombotic state, recent observations focused on low-grade inflammation in the pathogenesis of type 2 DM and its complications.23,24 Our study also provided a possible explanation for the apparent paradox that diabetic patients with well-controlled FBG had the similar ECM-related gene expression in SV conduits as uncontrolled diabetic patients. Our data are not with the pathophysiological mechanisms which may be responsible for the different endogenous ECM gene expression levels in diabetic and non-diabetic patients. However, inflammation associated with DM is likely to play a key role in the early initiation and aggressive progression of vein graft disease. Therefore, before pathophysiological mechanisms for impaired SV conduit are fully understood, we still emphasize the importance of preoperative blood glucose control for ameliorating SV conduit function.
Conclusion
This study indicated that ECM-related gene expression in SV was closely associated with preoperative diabetic status. ECM-related gene expression was more significantly imbalanced in diabetic patients with uncontrolled preoperative blood glucose. Although ECM-related gene expression of well-controlled diabetic patients seems not so satisfactory, we still emphasize the importance of preoperative blood glucose control for ameliorating SV conduit function which is critically important for the prognosis of surgical revascularization.
Footnotes
Acknowledgements
Yongxin Sun and Zibo Lin contributed equally to the study. Zibo Lin, Yongxin Sun and Chunsheng Wang designed the study. Wenjun Ding is responsible for the analysis of data. Qiang Wei and Yunqing Shi drafted the manuscript based on the protocol, and all other authors revised the article for important intellectual content. All authors have finally approved the version to be published.
Declaration of conflicting interests
The authors declare that they have no competing interests.
Funding
Grant sponsorship was received from Shanghai Medical Development Research Fund (grant no. 2000I-2D002).