
Abstract
We investigated the prevalence of peripheral vascular disease (PVD) and its association with preclinical atherosclerotic markers [intima-media thickness (IMT)] and arterial stiffness among 1755 urban south Indian type 2 diabetic subjects recruited from the Chennai Urban Rural Epidemiology Study (CURES). Doppler studies were performed, and PVD was defined as ankle–brachial index (ABI) of ≤0.9. IMT of the common carotid artery was determined using high-resolution B-mode ultrasonography, and augmentation index (AGI) was measured using the Sphygmocor apparatus. The overall prevalence of PVD was 8.3% (age-standardized 6.5%). The prevalence of PVD was higher among known diabetic subjects (n = 1401) compared to newly detected diabetic subjects (n = 354) (8.6% vs 6.8%, p = 0.250). The mean IMT and AGI in subjects with PVD were significantly higher compared to subjects without PVD (IMT: 0.99 ± 0.26 mm vs 0.83 ± 0.19 mm; AGI: 28.1 ± 9.6% vs 25.7 ± 9.8%, respectively). IMT was independently associated with PVD even after adjusting for age [odds ratio (OR) = 2.9 (1.2−6.7), p = 0.016 for second tertile and OR = 3.9 (1.7−9.3), p = 0.002 for third tertile compared to first tertile]. AGI was also associated with PVD in the unadjusted model [OR = 1.8 (1.1−3.1), p = 0.027 for second tertile compared to first tertile]. However, when adjusted for age, the significance was lost. In conclusion, among urban south Indian type 2 diabetic subjects, the prevalence of PVD is 8.3% and IMT is more strongly associated with PVD than AGI.
Keywords
Introduction
Peripheral vascular disease (PVD) is characterized by a gradual reduction in the blood flow to one or more limbs secondary to atherosclerosis. 1 While PVD is a major risk factor for lower extremity amputation, it often coexists with cerebrovascular disease (CVD) and/or coronary artery disease (CAD), and therefore, it is associated with poor prognosis and increased risk of morbidity and mortality. 2 PVD is commonly seen in individuals with type 2 diabetes and occurs almost 3 times more frequently in individuals with diabetes compared to age- and sex-matched nondiabetic individuals. 3 Risk factors for PVD include age, male gender, hypertension, hypercholes-terolaemia, hyperglycaemia and cigarette smoking. 4 Macrovascular disease is one of the clinical end points of atherosclerosis, which, in its earlier stages, involves both structural and functional changes in the arteries. 5 Functional changes (arterial stiffness and flow-mediated dilation) occur first in the arteries, leading to the loss of elasticity, while structural changes like fatty degeneration and foam cell formation occur later leading to intima-medial thickening, plaque formation and finally to clogging of the artery interfering with blood flow. The plaque eventually ruptures with consequent intraluminal thrombosis, which results in the end points like CAD, PVD and CVD. 6
There is very little epidemiological data on PVD and its risk factors from developing countries like India, which currently has 62.4 million people with diabetes. 7 This figure is further expected to increase to 101 million by the year 2030. 8 Earlier clinic-based reports reported that PVD is less common among the Indian type 2 diabetes patients.9,10 Reports on risk factors for PVD are mostly derived from studies in Western populations.11,12 Similarly, studies done in Western countries among general population have demonstrated a relationship between carotid IMT and PVD.13–15 Several studies have been published in the West on the association of IMT, augmentation index (AGI) and other micro- and macrovascular complications in the diabetic population,16–19 but very few studies exist on PVD.20–22 Hence, the aim of this study was to determine the prevalence of PVD and assess its association with IMT and AGI among south Indian type 2 diabetic subjects. To our knowledge, this study is the first to assess association of two preclinical atherosclerotic markers with PVD among type 2 diabetic subjects.
Methods
Study population
Study subjects were recruited from the Chennai Urban Rural Epidemiological Study (CURES), an ongoing epidemiological study conducted on a representative population (aged ≥20 years) of Chennai (formerly Madras), the fourth largest city in India. The methodology of the study has been published elsewhere. 23 Details of the sampling are described on our website (http://www.mdrf.in/misc/CURES.pdf). In Phase 1 of the urban component of CURES, a total of 26,001 individuals were recruited based on a systematic random sampling technique. Self-reported diabetic subjects identified in Phase 1 (n = 1529) were classified as ‘known diabetic’ (KD) subjects. Fasting capillary blood glucose was determined using a OneTouch Basic glucometer (LifeScan, a Johnson & Johnson Company, Milpitas, CA, USA) in all subjects. In Phase 2 of CURES, all KD subjects (n = 1529) were invited to our centre for detailed studies on vascular complications. In addition, 15% of the subjects (n = 817) with impaired fasting glucose (IFG) and 10% of subjects (n = 1560) with normal fasting glucose in Phase 1 underwent an oral glucose tolerance test (OGTT). In all, 37 of the former group and 14 of the latter group, who on OGTT were found to have diabetes according to World Health Organization (WHO) consulting group criteria [2 h plasma glucose ≥200 mg/dL (≥11.1 mmol/L)], 24 were added to the 320 randomly chosen ‘newly detected diabetic’ (NDD) subjects. Institutional ethical committee approval was obtained from the Madras Diabetes Research Foundation Ethical Committee, and written informed consent was obtained from all study subjects.
Clinical and biochemical studies
Anthropometric measurements, including height, weight and waist, were obtained using standardized techniques.23,25 The body mass index (BMI) was calculated using the formula: weight (kg)/height (m2). Blood pressure (BP) was recorded in the right arm in the sitting position to the nearest 2 mm Hg with a mercury sphygmomanometer (Diamond Deluxe BP apparatus, Industrial Electronic and Allied Products, Pune, India). Two readings were taken 5 min apart, and the mean of the two was taken as the BP.
A fasting blood sample was taken for estimation of plasma glucose and serum lipids after an overnight fast of 8 h. Fasting plasma glucose (glucose oxidase-peroxidase method), serum cholesterol (cholesterol oxidase–peroxidaseamidopyrine method), serum triglycerides (glycerol phosphate oxidase–peroxidase–amidopyrine method) and high-density lipoprotein (HDL) cholesterol (direct method – polyethylene glycolpretreated enzymes) were measured using the Hitachi-912 Autoanalyzer (Roche Diagnostics/Hitachi, Mannheim, Germany). The intra- and inter-assay coefficients of variation for the biochemical assays ranged between 3.1% and 7.6%. Low-density lipoprotein (LDL) cholesterol was calculated using the Friedewald formula. Glycated haemoglobin was estimated by high-pressure liquid chromatography using a Variant® chromatograph (Bio-Rad, Hercules, CA, USA). The intra- and inter-assay coefficients of variation of glycated haemoglobin were less than 10%. Urine samples were collected after an overnight fast. Microalbumin concentration was measured using an immunoturbidometric assay (Hitachi 902 autoanalyser, Roche Diagnostics, Mannheim, Germany).
Screening for complications
Doppler studies
Doppler studies were performed to screen for PVD by a single observer, which included recording of pressure tracings while in the supine position by doppler probe using the KODY Vaslab Machine (Kody Labs, Chennai, India). BP recordings were made of the brachial pulses in the upper limb. Similar recordings were made of the dorsalis pedis and posterior tibial pulses in the lower limb by inflating the cuff proximal to the ankle, and the mean of these two readings was taken as the ankle pressure. For each leg, the highest pressure of the dorsalis pedis and posterior tibial arteries was used as the numerator, while the higher of the brachial pressures was used as the denominator. The ankle–brachial index (ABI) ratio was calculated in every subject. The lower ABI of the two legs was defined as the ABI of the subject.
Retinal photography
Screening for retinopathy was done using four-field stereo colour retinal photography (Zeiss FF 450 plus camera) by trained and certified photographers. Photographs were graded by an ophthalmologist using the Early Treatment Diabetic Retinopathy Study (ETDRS) grading system. 26
Biothesiometry studies
To screen for neuropathy, a biothesiometer (Biomedical Instrument Co., Newbury, OH, USA) was used to assess vibratory perception threshold (VPT) of the great toes in a standardized fashion.
Electrocardiogram
To assess CAD, a resting 12-lead electrocardiogram (ECG) was performed using Myocard R electrocardiograph (Marks Electronics, Chennai, India).
Carotid IMT measurements
Carotid IMT was measured as described previously 27 but will be briefly outlined here. The intima plus medial thickness of the right common carotid artery was determined using a high-resolution B-mode ultrasonography system (Logic 400; GE, Milwaukee, WI, USA) with an electrical linear transducer midfrequency of 7.5 MHz. The axial resolution of the system was 0.3 mm. The images were recorded, in addition to being photographed. The scanning was performed for a mean of 20 min. IMT was measured as the distance from the leading edge of the first echogenic line to the second echogenic line during the diastolic phase of the cardiac cycle. Six well-defined arterial wall segments were measured in the right carotid system: the near wall and far wall of the proximal 10 mm of the internal carotid artery, the carotid bifurcation beginning at the tip of the flow divider and extending 10 mm below this point and the arterial segment extending 10 mm below the bifurcation in the common carotid artery. Essential in defining these segments is the identification of a reliable longitudinal marker, which is the carotid flow divider as performed in the Study to Evaluate Carotid Ultrasound Changes in Patients Treated with Ramipril and Vitamin E (SECURE) study. 28
Images were captured using a special grabber card, and the measurements were performed offline, manually. This method was standardized at our centre and, for quality check, the videotapes were sent to Hamilton, Canada, the central laboratory for the SECURE and Graniteville Recovery And Chlorine Epidemiology (GRACE) studies. All scanning was conducted by a trained ultrasonologist (R.R.) who was unaware of the clinical status of the study subjects. The reproducibility of the IMT measurement was studied by conducting another scan by the same sonographer on 20 subjects a week later. The mean difference in IMT between the first and second measurements was 0.02 mm, the standard deviation (SD), 0.06 mm and the mean difference ranged between −0.09 and +0.09 mm.
Arterial stiffness measurement
Arterial stiffness was measured using the Sphygmocor apparatus (Sphygmocor BPAS-1; PWV Medical, Sydney, Australia). In brief, a high-fidelity micromanometer (SPC-301; Millar Instruments, Houston, TX, USA) was used to flatten but not occlude the right radial artery, using gentle pressure. When the two surfaces are flattened, circumferential pressures are equalized and an accurate pressure waveform can be recorded. Data were collected directly into a portable microcomputer. The system software allowed online recording of the peripheral waveform, which was assessed visually to ensure that the best possible recording was obtained and that artefacts from movement were minimized. After 20 sequential waveforms had been acquired, the integral software was used to generate an averaged peripheral and corresponding central waveform that was used for the determination of the AGI. AGI was defined as the difference between the first and second peaks of the central arterial waveform, expressed as a percentage of the pulse pressure. 29 AGI is a measure of the contribution that the wave reflection makes to the arterial pressure waveform. The amplitude and timing of the reflected wave ultimately depend on the stiffness of the small vessels and large arteries, and thus, AGI provides a measure of systemic arterial stiffness. 30 To check for the reproducibility of AGI, two measurements were performed on 20 subjects on consecutive days by the same observer. The mean difference in AGI between the first and second measurements was 1.58, and the SD was 2.54.
Definitions
Hypertension. It was diagnosed in subjects who were on antihypertensive medication or had systolic BP ≥ 140 mmHg or diastolic BP ≥ 90 mmHg. 31
PVD. An ABI of ≤0.9 was the criterion used for the diagnosis of PVD. Severity of PVD was defined as according to American College of Cardiology Foundation/American Heart Association Task Force (ACCF/AHA) 2011 Guidelines, based on ABI values – ABI ≤0.4 as severe PVD, 0.41–0.7 as moderate PVD, 0.71–0.9 as mild PVD, 0.91–1.4 as normal and >1.4 as noncompressible arteries. 32 The severity of the symptoms was classified according to Rutherford categories. 33
CAD. This was diagnosed based on a past history of documented myocardial infarction and/or drug treatment for CAD (aspirin or nitrates) and/or electrocardiographic changes suggestive of ST segment depression and/or Q-wave changes and/or T-wave changes using appropriate Minnesota codes. 34
Diabetic retinopathy (DR). The minimum criteria for diagnosis of DR were the presence of at least one definite microaneurysm in any field photographed. Briefly, level 10 represents no retinopathy, level ≥20 nonproliferative DR (NPDR) and level ≥60 proliferative DR (PDR). 26
Neuropathy. Diagnosed if VPT of the great toe exceeded mean + 2 SD of a healthy nondiabetic population aged 20–45 years (cut point ≥20 V). 35
Nephropathy. Microalbuminuria was diagnosed if the albumin excretion was between 30 and 299 µg/mg of creatinine and macroalbuminuria/overt nephropathy was diagnosed if albumin excretion was ≥300 µg/mg of creatinine. 36
Smoking. Individuals were classified as nonsmokers and current smokers.
Statistical analysis
Statistical analysis was done using Statistical Analysis System (SAS) statistical package (version 9.0; SAS Institute, Inc., Cary, NC, USA). Data are expressed as mean ± SD. Chi square test for trend was used to compare proportions among groups. The prevalence rate obtained in this study was age standardized to the 2001 Census of India using direct method. Logistic regression analysis was performed to identify risk factors using PVD as the dependent variable and those factors which had a significant association with PVD on univariate analysis as independent variables. The prediction ability of IMT and AGI to predict PVD was examined by receiver-operating characteristic (ROC) curve analyses. p-values <0.05 were considered significant.
Results
This study included 1755 type 2 diabetic subjects, of which 1401 were KD subjects (1401/1529, response rate: 91.6%) and 354 were NDD subjects (354/371, response rate = 95.4%), who had doppler studies done in Phase 2 of CURES. The overall crude prevalence of PVD was 8.3% [95% confidence interval (CI): 7.0–9.6], the prevalence of PVD was significantly higher among female (10.2%, 95% CI: 8.3–12.1) compared to male subjects (5.7%, 95% CI: 4.1–7.3, p = 0.001). Compared with the NDD subjects, KD subjects had higher crude prevalence of PVD (8.6% vs 6.8%, p = 0.250). Figure 1 shows the age-standardized prevalence of PVD by diabetes group and gender, adjusted to the 2001 population of Chennai. The overall age-standardized prevalence was 6.5% (95% CI: 5.4–7.7), while among the KD and NDD group, it was 7.1% (95% CI: 5.8–8.5) and 5.8% (95% CI: 3.4–8.2), respectively. Of the 145 subjects with PVD, mild PVD was present in 84.1% (n = 122), moderate PVD in 7.6% (n = 11), severe PVD in 2.1% (n = 3) and noncompressible arteries in 6.2% (n = 9).
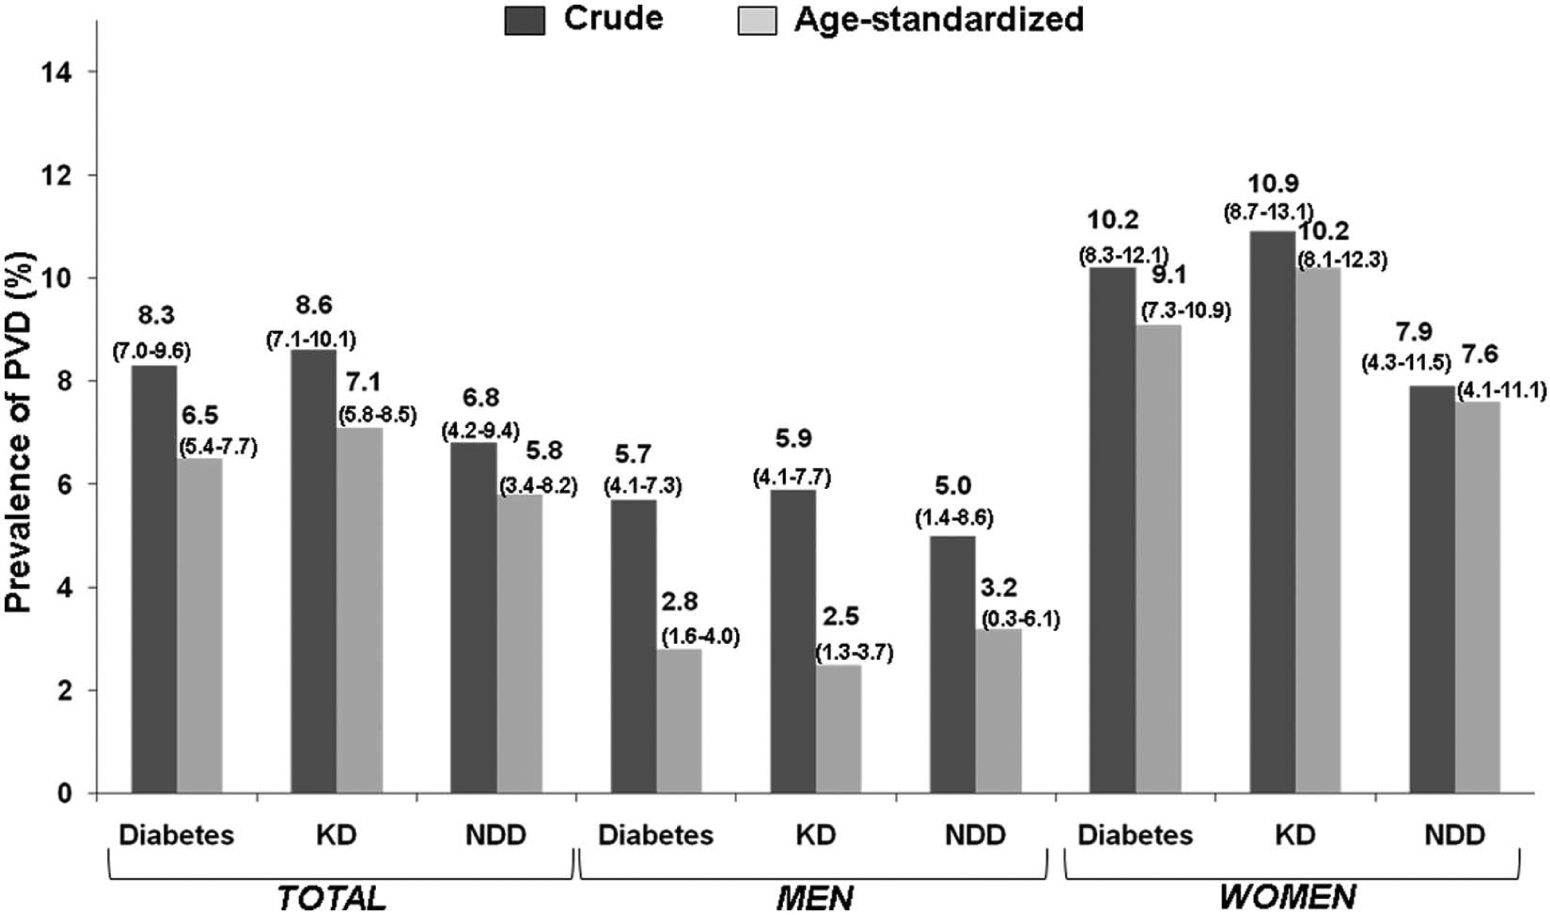
Age-standardized prevalence of peripheral vascular disease by diabetes group and gender. Diabetes – KD + NDD; figures in parenthesis − 95% confidence interval.
The clinical and biochemical characteristics of the study groups with (n = 145) and without PVD (n = 1610) are shown in Table 1. Diabetic subjects with PVD were older (p < 0.001), had longer duration of diabetes (p < 0.001), higher HbA1c (p = 0.003) and higher serum LDL cholesterol (p = 0.037). The prevalence of CAD (14.5% vs 7.4%, p = 0.009) and neuropathy (29.0% vs 10.3%, p < 0.001) was higher in those with PVD compared with those without, while the difference in prevalence of DR and microalbuminuria did not reach statistical significance. The smoking rate was significantly higher in men with PVD compared with those without. The prevalence of PVD was 6.3% among male subjects aged >50 years and who did not smoke, while it was 11.6% among male subjects aged >50 years and who smoked (p = 0.048).
Clinical and biochemical characteristics in type 2 diabetic subjects with and without peripheral vascular disease.
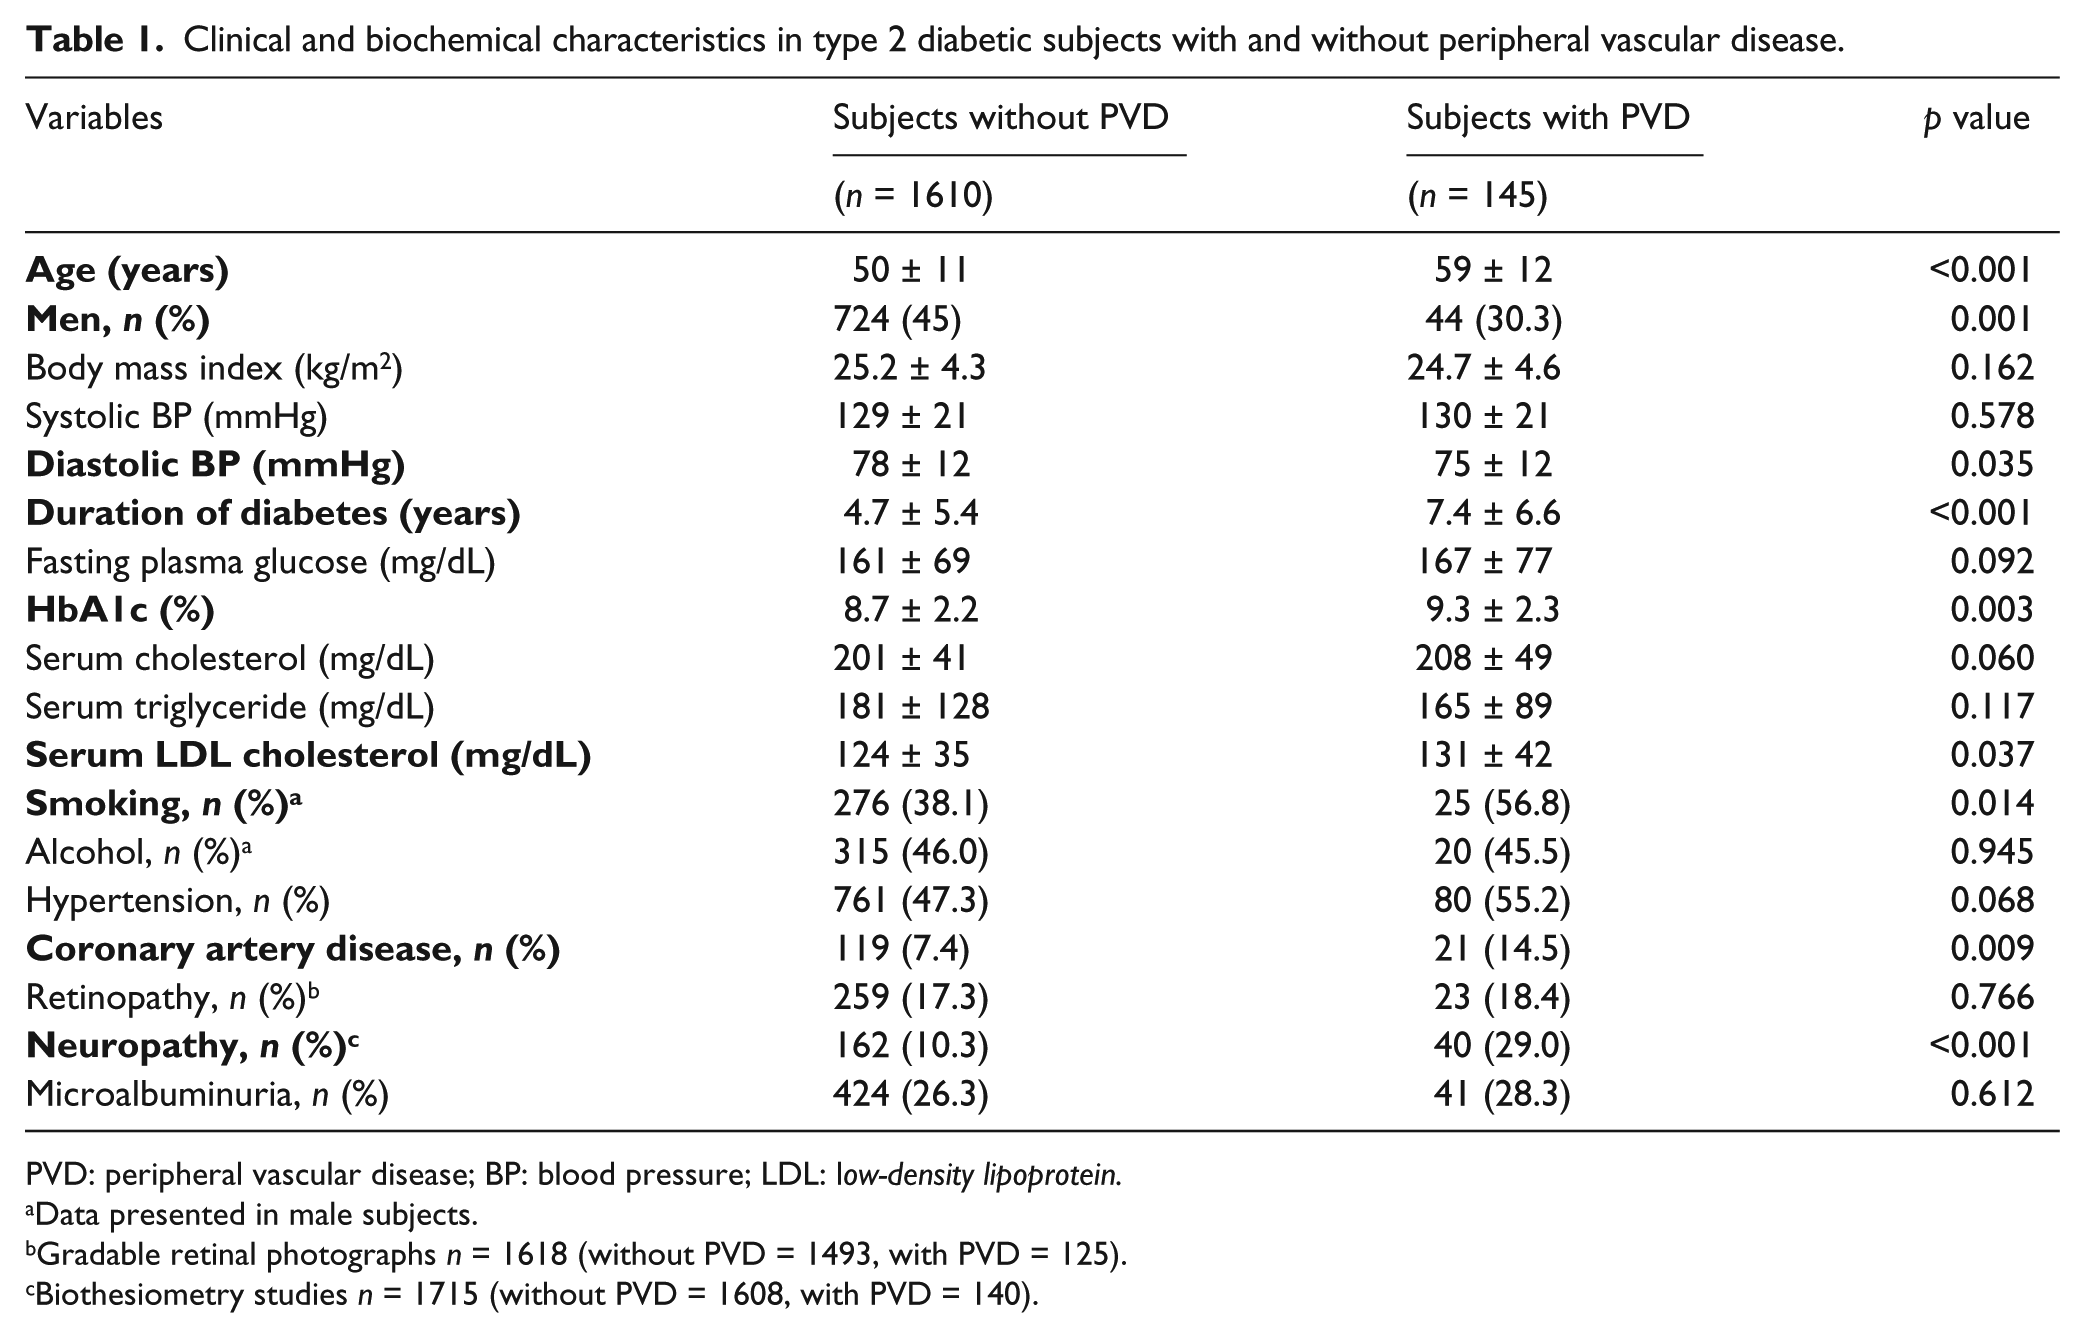
PVD: peripheral vascular disease; BP: blood pressure; LDL: low-density lipoprotein.
Data presented in male subjects.
Gradable retinal photographs n = 1618 (without PVD = 1493, with PVD = 125).
Biothesiometry studies n = 1715 (without PVD = 1608, with PVD = 140).
Table 2 presents the classification of subjects with PVD according to Rutherford categorization. In our subjects, 65.5% were asymptomatic, while 34.5% had symptoms ranging from mild claudication to major tissue loss.
Categorization of subjects of peripheral vascular disease according to Rutherford classification (n = 145).
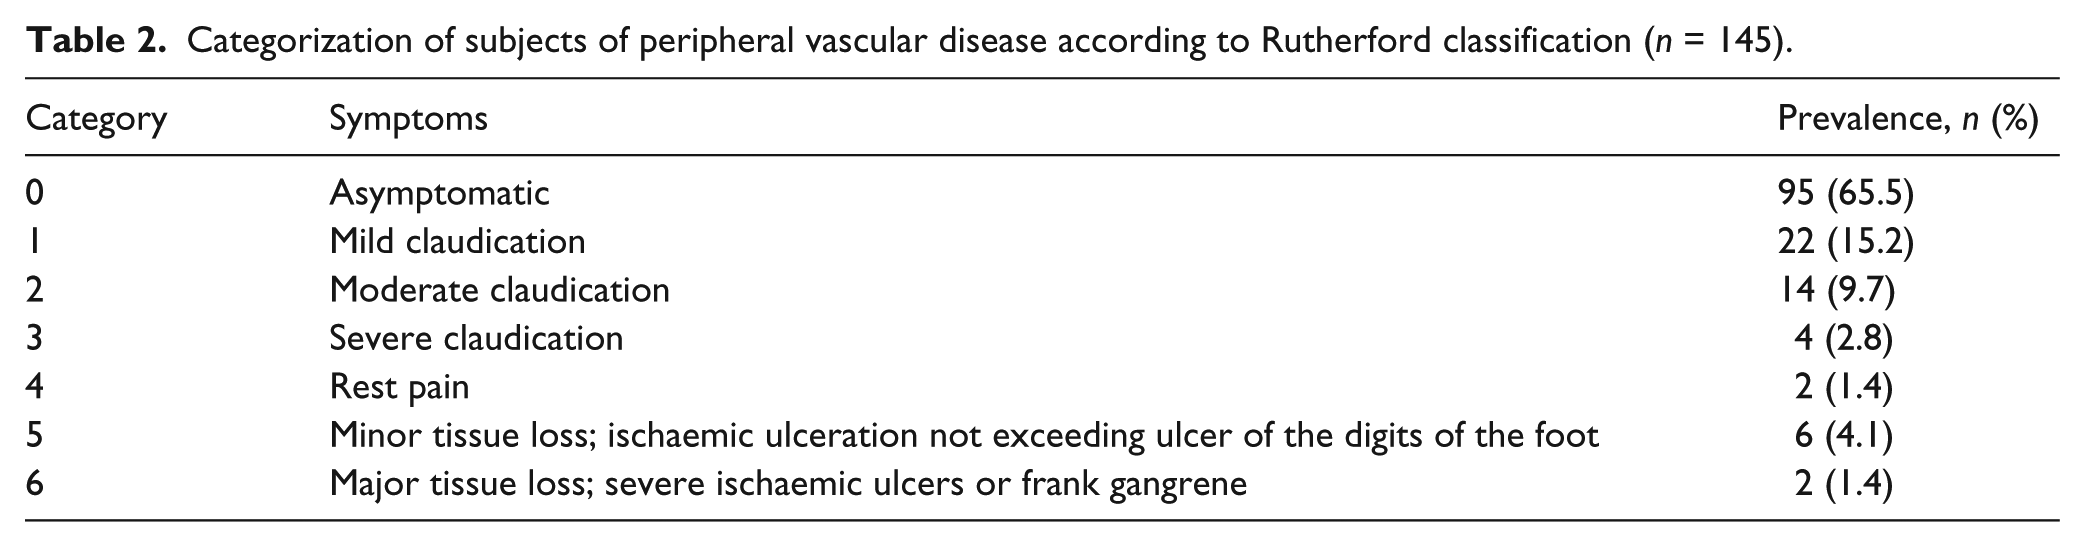
Figure 2 presents the age- and gender-specific prevalence of PVD. The take-off point in prevalence of PVD was in the age group 50–59 years for both female and male subjects. At every age interval, the prevalence of PVD among female subjects was higher compared to their counterparts (female vs male: 20–29 years − 4.8% vs 0%, p = 0.42; 30–39 years − 5.2% vs 0%, p = 0.02; 40–49 years − 5.1% vs 1.4%, p = 0.03; 50–59 years − 8.4% vs 5.9%, p = 0.27; 60–69 years − 18.6% vs 12.5%, p = 0.12; and > 69 years − 34.0% vs 17%, p = 0.05).
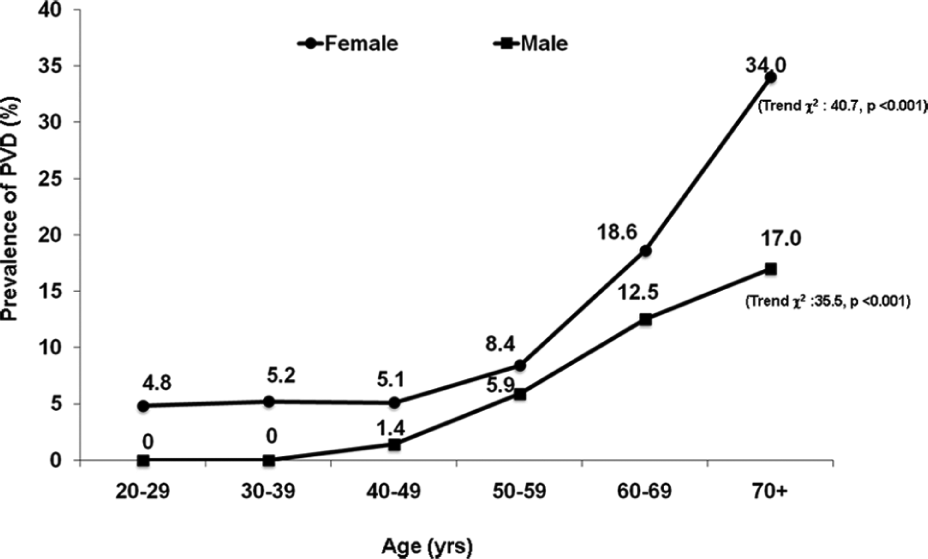
Age- and gender-specific prevalence of PVD in the study group.
An increase in the prevalence of PVD was observed with increasing tertiles of duration (duration of diabetes <1 year: 6.1%; 1–4.9 years: 6.1%; ≥5 years: 12%, trend χ2 = 16.4, p < 0.001). Regression analysis revealed that the odds ratio (OR) for developing PVD in subjects having duration of diabetes more than 5 years was 2.2 (95% CI: 1.5–3.4, p < 0.001) compared with those with duration less than 1 year.
Multiple logistic regression analysis was done using PVD as the dependent variable, and the risk factors which were significantly associated with PVD in the unadjusted model were included in the multivariate model as independent variables. This analysis showed that the significant independent risk factors for PVD after adjustment for hypertension and serum cholesterol were age (OR = 1.07, 95% CI: 1.05–1.09, p < 0.001), female gender (OR = 2.23, 95% CI: 1.44–3.14, p< 0.001), duration of diabetes (OR = 1.03, 95% CI: 1.01–1.06, p = 0.037) and HbA1c (OR = 1.1, 95% CI: 1.03–1.20, p = 0.007).
For assessing the association of PVD and preclinical atherosclerotic markers, subjects who had ABI, IMT and AGI measurements and with no other manifestation of cardiovascular disease were included in the analysis (n = 1261). The mean IMT in subjects with PVD (n = 93) was 0.99 ± 0.26 mm, and in subjects without PVD (n = 1168), it was 0.83 ± 0.19 mm (p < 0.001). The mean AGI in subjects with PVD was significantly different compared to subjects without PVD (28.1% ± 9.6% vs 25.7% ± 9.8%, respectively, p = 0.011).
Figure 3 shows an increase in the age-adjusted prevalence of PVD with increase in tertiles of IMT (IMT < 0.73 mm: 3.0%; 0.73–0.88 mm: 8.7%; >0.88 mm: 16.0%). Regression analysis was done using PVD as the dependent variable and tertiles of IMT as independent variable with the first tertile as reference. In the unadjusted model, the risk for developing PVD in subjects with IMT ranging between 0.73 and 0.88 mm was 4.6 times higher (95% CI: 2.0–10.5, p < 0.001) than those in the reference category (<0.73 mm), which increased to 8.5 in subjects with IMT levels ≥0.88 mm compared to reference group (95% CI: 3.8–19.0, p < 0.001). The significance was retained even after adjusting for age. Similarly, Figure 4 shows an increase in the age-adjusted prevalence of PVD with increasing tertiles of AGI. Regression analysis revealed that in the unadjusted model, the risk for developing PVD in subjects with AGI ≥30% was 1.8 times higher (95% CI: 1.1–3.1, p = 0.027) than those in the reference category (<0.22%). However, this significance was lost after adjusting for age.
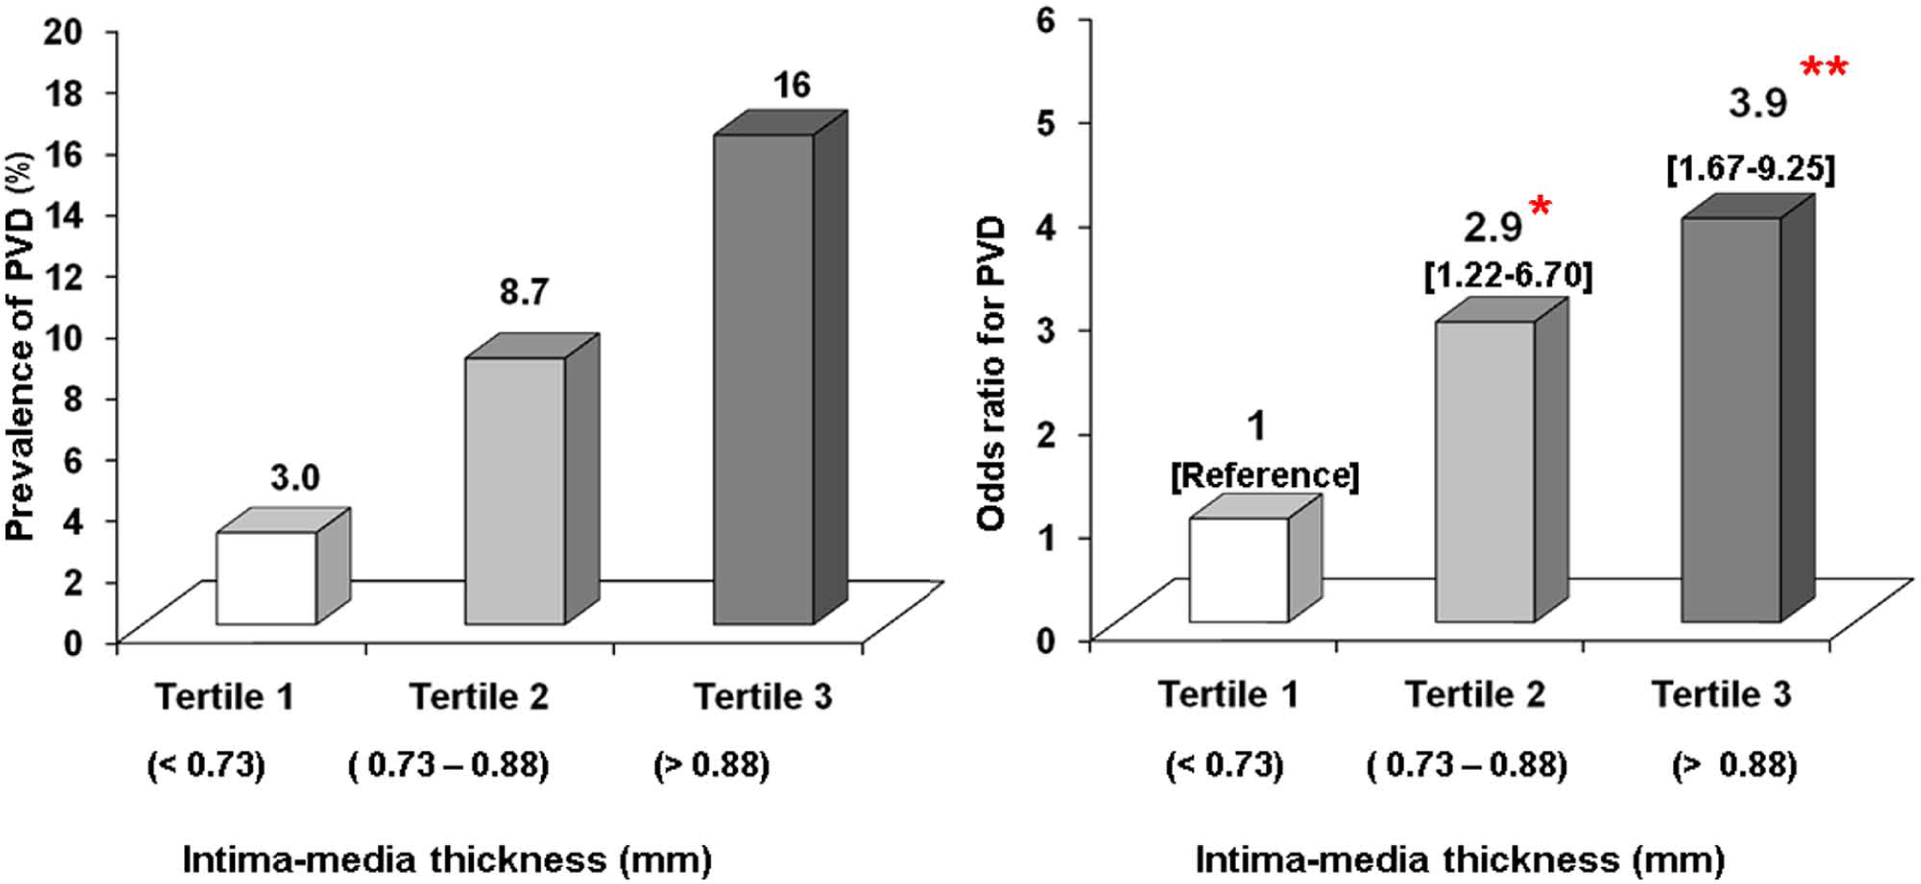
Age-adjusted prevalence and risk for PVD in relation to tertiles of intima-media thickness among diabetic subjects. Figures in parenthesis are 95% confidence intervals; unadjusted trend χ2 = 37.98, p < 0.001; *p = 0.016 and **p = 0.002 compared to reference.
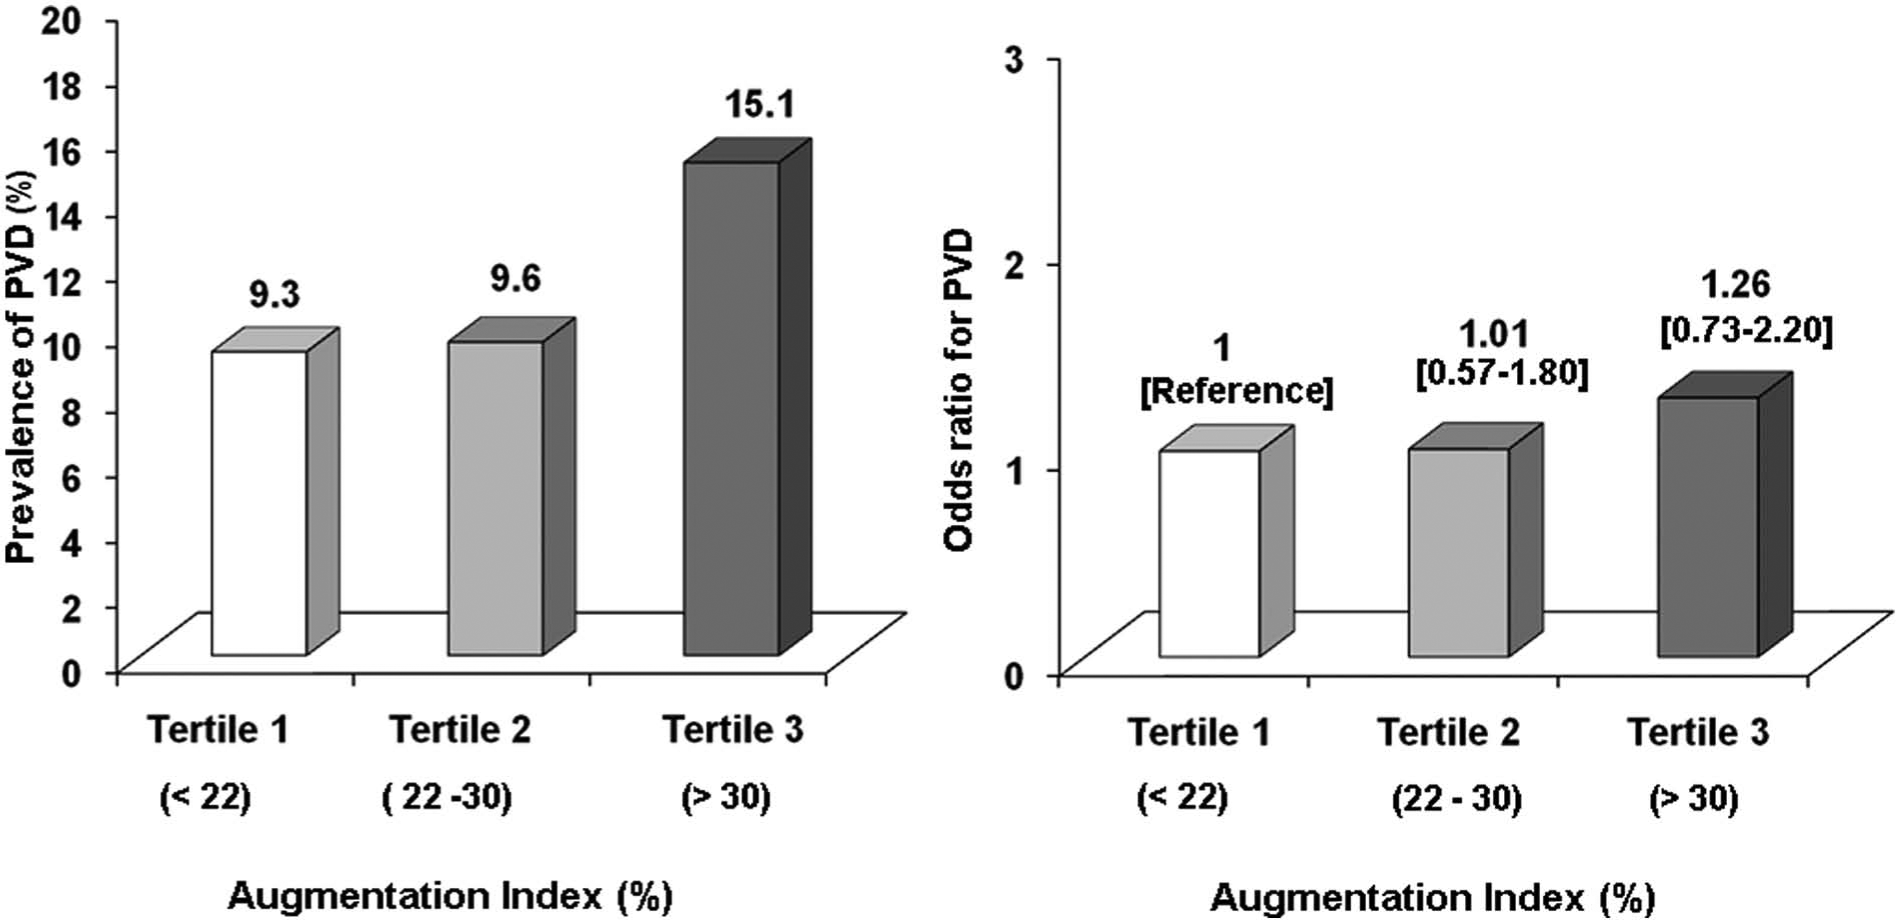
Age-adjusted prevalence and risk for PVD in relation to tertiles of augmentation index among diabetic subjects. Figures in parenthesis are 95% confidence intervals; unadjusted trend χ2 = 5.01, p = 0.025.
The area under the curve (AUC) for the association of PVD with IMT and AGI measures and the optimal cut-off point for IMT and AGI defined by maximizing the sensitivity and specificity (i.e. point of convergence of sensitivity and specificity) to predict PVD is presented in Figure 5. The area under the ROC curve for IMT was 0.71 (p < 0.001), and a cut-off of 0.85 mm was the optimum cut-off with sensitivity of 68.8% and specificity of 61.3% for PVD. A similar AUC and a cut-off of AGI (26.5%) was observed for predicting PVD (AUC: 0.58, p = 0.010), with sensitivity of 63.4% and specificity of 53.0%.
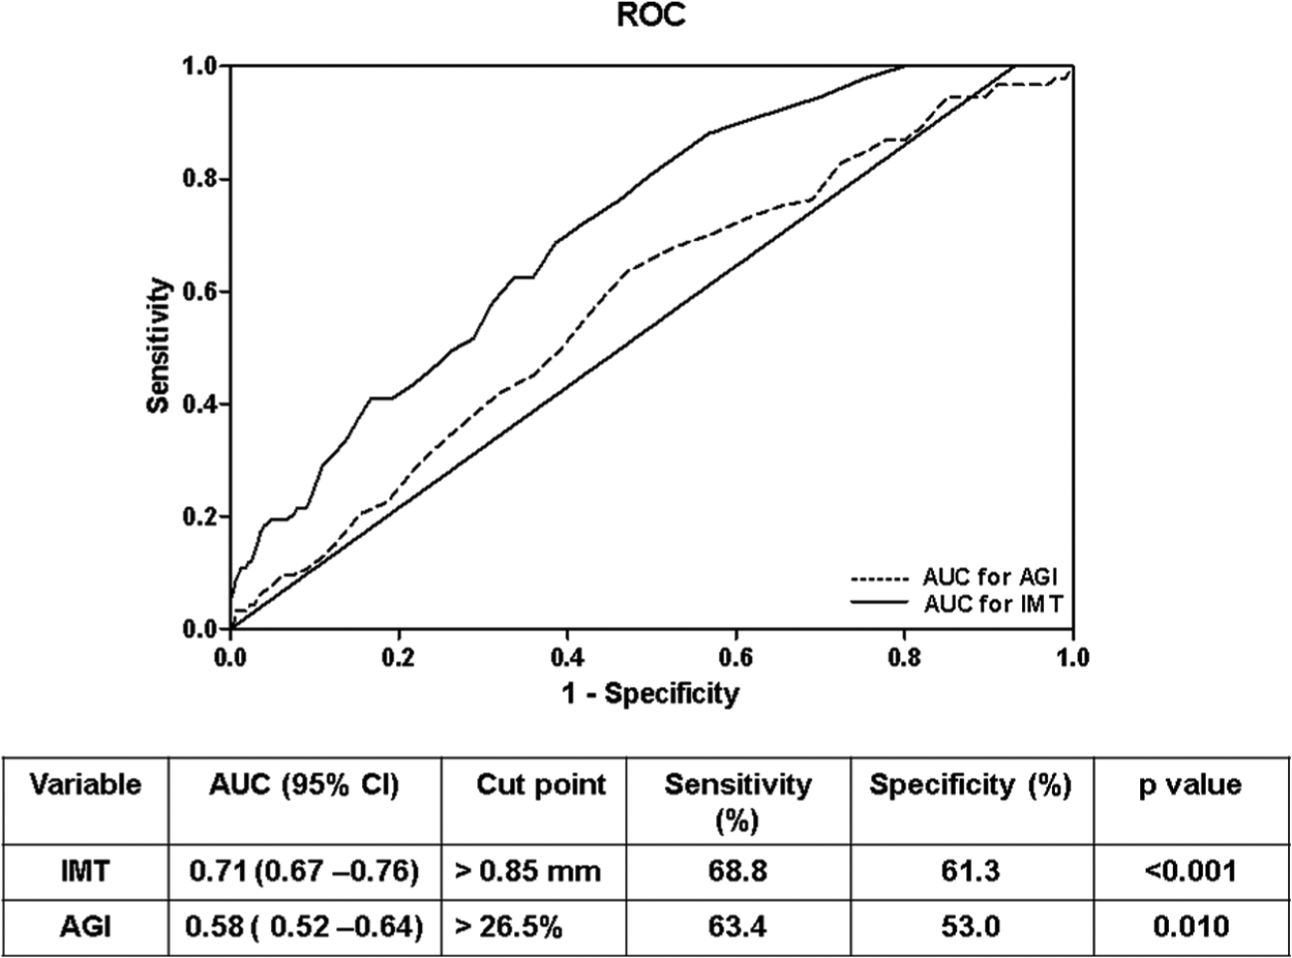
ROC curve of IMT and AGI for predicting PVD.
Discussion
This is one of the largest population-based study to our knowledge, to report not only on the prevalence of PVD in type 2 diabetes but also on the association of preclinical atherosclerotic markers with PVD. We report that the crude prevalence of PVD among diabetic subjects to be 8.3%, while the age-standardized prevalence was 6.5%. The majority of the subjects in this study had only mildto moderate PVD, and severe PVD was uncommon. Prevalence of PVD among newly diagnosed diabetic subjects was 6.8% in our study. Furthermore, our study showed that PVD is more common in age group ≥50 years with female predominance and that age, female gender and HbA1c are associated with PVD. Among the two preclinical atherosclerotic markers studied, IMT is strongly associated with PVD than AGI.
This is the first study to our knowledge on prevalence of PVD carried out on a representative sample of a whole city from a developing country. Indeed, this is the second population-based study on PVD from India. The earlier study was also carried only in Chennai – the Chennai Urban Population Study (CUPS). 27 However, that study was done in two selected residential colonies of Chennai and the number of subjects with diabetes was very small (n = 152). Thus, this study is the first one to be done on a representative population of an urban metropolitan city and also on a much larger sample size (n = 1724). Moreover, the association with preclinical markers was not tested in that study.
The prevalence of PVD is higher in diabetic subjects rather than nondiabetic subjects in population-based and clinic-based studies.37,38 Because of referral bias, the prevalence of PVD in subjects seen at secondary and tertiary medical centres would generally be higher in clinics than in diabetic patients in the general community. Previous prevalence estimates for PVD among diabetic subjects from the United States and Europe have ranged from 9.5% to 42%.39 –41 In contrast, the prevalence of PVD in Asian diabetic populations has been reported to be lower than that in Western populations.42,43 However, the peripheral artery disease (PAD)-SEARCH study, 44 which was carried out on 6625 diabetic patients from 72 hospitals in seven major Asian countries – Korea, China, Taiwan, Hong Kong, Indonesia, Thailand and the Philippines – reported the prevalence to be 17.7%.
This study confirms the findings of an earlier study 37 that the prevalence of PVD in Indian diabetic subjects is lower than that compared with Western countries. The reason for the lower rates of PVD in the Indian type 2 diabetic population is probably related to the younger age at onset of type 2 diabetes in our population. At older ages, the prevalence of PVD risk increases sharply.
The prevalence of PVD is quite high even at the time of diagnosis of type 2 diabetes (6.8%) in this study. This prevalence rate is higher than that reported in an earlier small study from Chennai (3.5%), 37 but is lower than that reported in Minnesota (8%) 45 and the Caucasian population (15.1%). 38 The high prevalence in NDD subjects may be attributed to the insidious onset of diabetes and long duration of asymptomatic disease before symptoms develop. Thus, our findings emphasize screening for PVD at the time of diagnosis of diabetes not only for early detection but also to prevent the progression to end-stage disease, which is in line with the recommendations of international guidelines to screen for PVD in patients with diabetes. 32 In our study, female subjects were more likely to have PVD. In addition, our finding is consistent with the results of previous studies in which female gender was a risk factor for low ABI. 44
PVD is known to be correlated with other complications of type 2 diabetes. There is an association between retinopathy and impaired peripheral arterial circulation of the legs independent of major cardiovascular risk factors. 46 Other studies have reported that there was no statistically significant correlation of PVD with DR. 47 A study conducted to assess the correlation of peripheral arterial disease with DR and diabetic nephropathy in type 2 diabetic patients reported that the presence of both retinopathy and albuminuria in the same patient increases the risk of cardiovascular disease 8.9 times. 48 Because neuropathy also has a microvascular component, structural damage to the microvasculature can ultimately lead to nerve dysfunction, which is central to the pathogenesis of peripheral nerve injury. There is growing appreciation that smaller vessels may become similarly damaged, giving rise to poor circulation in the extremities and ultimately to peripheral neuropathy. 49
PVD is a strong marker of cardiovascular disease and has significant association with other atherosclerotic disorders such as CAD and CVD. 39 We looked at the association of arterial thickening and arterial stiffness with PVD. IMT, which reflects arterial thickness, is considered equivalent to arterial biopsy and an important surrogate marker for cardiovascular diseases. 50 As PVD is also a disease of plaque deposition, the possible association of PVD with IMT has been investigated in many studies.51,52 The Rotterdam study showed that subjects with a carotid IMT of 0.89 mm have an increased risk of developing PVD. 51 The Edinburgh Artery Study (EAS) has also demonstrated a significant association of IMT with PVD. 52 Our results are in agreement with these studies, as we found increasing prevalence of PVD with increasing tertiles of IMT.
As the pressure in the arteries increases, there occurs reversible stiffening in the artery without inducing any structural changes. 53 Hence, arterial stiffness causes a pressure-induced damage on coronary and cerebral arteries and thereby increases the susceptibility to myocardial ischemia. 54 An increase in aortic stiffness has been observed in peripheral arterial disease in some studies.55–57 In contrast, there are also reports where association between PVD and arterial stiffness has not been observed. 58 In our study, we observed an increasing prevalence of PVD with increasing tertiles of arterial stiffness measured by AGI, which are consistent with the findings of Van Popele et al., 55 who showed an increased aortic stiffness in UK patients with PVD.
The results of ROC curve analysis showed that the area under curve for IMT was 0.71, whereas in case of AGI, AUC was 0.58. The diagnostic sensitivity and specificity were also higher for IMT compared to AGI. Hence, our results show that IMT may be a better predictor of PAD in diabetic subjects compared to AGI. The results of logistic regression analysis also corroborated the same. Significantly increased odds for the development of PVD were seen even in the second tertile of IMT compared to the reference group. To the best of our knowledge, this is the first study to show an association of functional and structural atherosclerotic markers with PVD in an Indian population. The mechanistic links connecting these atherosclerotic markers with PVD are unclear. But it is possible that impairment in arterial blood flow induced by mechanisms like increased oxidative stress, 59 polyol pathway and so on might play a role. 60
What is the possible health significance of this study? According to the recent Indian Council of Medical Research-INdia DIABetes (ICMR-INDIAB) study conducted in 4 whole states of India covering a population of over 200 million people, there are 62.4 million people with diabetes in India. 7 A recent population-based study conducted in rural areas 61 called as the Chunampet Rural Diabetes Prevention Project (CRDPP) reported a prevalence of PVD to be 7.3%, which is similar to the prevalence reported in this urban area. 61 Thus, if we extrapolated the prevalence of PVD (8.3%) to India’s diabetes population, it translates to a possible 5.2 million people with PVD due to diabetes in India. This is a very significant number and calls for urgent policy measures to tackle the problem of PVD in India, as the government of India National Control Program for Diabetes CVD and stroke is rolled out. 62
The Atherosclerosis Risk in Communities (ARIC) Study has proved that the addition of IMT to the Framingham risk equation led to improved prediction of risk in case of men, 63 and there are also other cross-sectional studies to suggest that around 20%−60% of patients who are at intermediate risk showed increased IMT values and should be considered as patients at high risk.64,65 Hence, it is clear that in a clinical setting, additional measurement of IMT along with the traditional risk factor ABI might improve vascular risk stratification.
The cross-sectional nature of this study limits conclusions about the direction or causality of associations observed in our study. The study, however, has several strengths. First, the sample is representative of the urban adult population of Chennai and hence the results can be extrapolated to urban India. Second, the sample included both KD and NDD subjects.
In conclusion, this study reports that among urban south Indian type 2 diabetic subjects, the prevalence of PVD is 8.3% and age, female gender and HbA1c are the significant risk factors. Finally, it is shown that IMT is more strongly associated with PVD than AGI.
Footnotes
Acknowledgements
The authors thank the epidemiology team members for conducting the CURES field studies, technicians for performing studies for complications and, most importantly, the study subjects for their participation. This is the 111th publication from CURES (CURES-111).
Declaration of conflicting interests
The authors declare that they have no conflicts of interest.
Funding
J.S. and K.I. were supported by CSIR-SRF. This research was supported by Chennai Willingdon Corporate Foundation, Chennai.