
Abstract
Background:
Epicardial fat is recognized as active endocrine organ and as emerging risk factor for cardio-metabolic diseases. The aim of this study was to explore the relationship between epicardial fat and carotid intima–media thickness in type 2 diabetes patients.
Methods:
Epicardial fat thickness was measured in 76 type 2 diabetes patients without clinical atherosclerotic cardiovascular disease and 30 age- and sex-matched controls. In addition to laboratory tests, all patients underwent transthoracic echocardiography for epicardial fat thickness and ultrasonographic examination of carotid intima–media thickness.
Results:
Patients with diabetes had higher epicardial fat thickness and carotid intima–media thickness than those of the controls (6.23 ± 1.27 mm vs 4.6 ± 1.03 mm, p < 0.001 and 0.77 ± 0.150 mm vs 0.58 ± 0.08 mm, p < 0.001, respectively). Epicardial fat thickness was correlated significantly with age, duration of type 2 diabetes, body mass index, waist circumference, HbA1c, carotid intima–media thickness, Homeostasis Model Assessment Index for insulin resistance and lipid profile in the type 2 diabetic patients. Stepwise regression analysis showed that carotid intima–media thickness, duration of diabetes, triglyceride and body mass index were the independent predictors of epicardial fat thickness, with carotid intima–media thickness the most important predictor (β = 3.078, t = 4.058, p < 0.001). Receiver operating characteristic curve analysis was done and cut-off high-risk epicardial fat thickness value of 6.1 mm was determined with a sensitivity and specificity of 71.4% and 72%, respectively.
Conclusion:
Patients with type 2 diabetes have higher carotid intima–media thickness and epicardial fat thickness. Epicardial fat thickness was found to be a strong predictor of subclinical atherosclerosis.
Keywords
Introduction
The prevalence of diabetes mellitus is increasing significantly worldwide. Patients with diabetes are at higher risk of microvascular and macrovascular complications leading to a significant burden for the individual and for the community. Cardiovascular diseases (CVDs) are the most prevalent cause of mortality and morbidity in diabetes 1 with twofold to fourfold increase in the risk of myocardial infarction, stroke and peripheral artery diseases. 2 Diabetes is considered a coronary heart disease risk equivalent where patients with type 2 diabetes (T2DM) without a previous history of myocardial infarction have similar risk for subsequent coronary artery disease (CAD) as nondiabetic patients with a history of myocardial infarction.3,4
Atherosclerosis is a chronic, progressive, systematic multifactorial inflammatory disease of the medium- to large-sized arteries with long asymptomatic stage. Atherosclerosis develops gradually as a subclinical condition over the life course and eventually becomes clinically apparent as ischaemic heart disease, cerebrovascular disease or peripheral arterial disease. 5 The carotid intima–media thickness (CIMT) reflects the diffuse thickening of the intimal layer seen in atherosclerosis and has been validated as a surrogate measure of subclinical atherosclerotic disease. 6
Epicardial fat (EF) is a metabolically active adipose tissue with small adipocytes and has been proposed as an emerging cardiovascular risk factor. 7 It is the fat situated between the visceral pericardium and the myocardium, without a structure or fascia separating it from the myocardium and the epicardial vessels. 8 EF is morphologically similar to the pericardial fat – fat located on the outer surface of the fibrous pericardium; however, the two fat depots are embryologically, anatomically and functionally different despite their anatomical proximity. 9
Epicardial fat thickness (EFT) can be measured by echocardiography, as was proposed and validated by Iacobellis et al. 10 Although radiologic techniques can provide a volumetric and more accurate measurement, echocardiographic assessment of EF is inexpensive, noninvasive and readily available but still accurate and reproducible. 11 The aim of this study was to measure EF and compare it with CIMT and other parameters in diabetic and nondiabetic Egyptian patients.
Methods
Study design
This was a cross-sectional observational study conducted between February and October 2017. We enrolled 106 patients; of them, 30 patients are nondiabetic and 76 are diabetic. We exclude patients with overt CVD or patients with a history of revascularization or clinical evidence of peripheral arterial diseases including claudication, absent peripheral pulses or ischaemic leg ulcers. Endocrinal or metabolic diseases, type 1 diabetes, gestational diabetes, patients with renal or hepatic impairment were also excluded.
A complete history and physical examination were obtained. Body mass index (BMI) defined as weight (in kilogram) divided by the square of height (in metres). Waist circumference (WC) in centimetres was measured at midway between iliac crest and lower rib margin. Systolic and diastolic blood pressure (BP) values of the study population were measured using a mercury sphygmomanometer after more than 5 min of rest.
Venous blood samples were collected from all patients after 12 h of fasting. The levels of total cholesterol, low-density lipoprotein cholesterol (LDL), high-density lipoprotein cholesterol (HDL), triglycerides (TG), glucose, HbA1c and serum creatinine were measured by suitable laboratory techniques including high-performance liquid chromatographic (HPLC) for HbA1c. Plasma concentration of fasting insulin was measured, and the Homeostasis Model Assessment Index for insulin resistance (HOMA-IR) was calculated as fasting plasma insulin (mu/L) × fasting glucose (mg/dL)/405. All patients gave informed consent before enrolment, and the study protocol was approved by the institutional ethics committee.
CIMT
Carotid artery ultrasonography was performed by an experienced radiologist on both sides of the neck using a standardized Doppler ultrasonic device (ARIETTA S70; Hitachi, Tarrytown, NY, USA) with 7.5 MHz probe. Patients were examined in the supine position, and measurement of CIMT was made at a point on the far wall of the common carotid artery, 2 cm proximal to the bifurcation, from a longitudinal scan plane that showed the intima–media boundaries most clearly.12,13 Measurements on both sides were performed for each patient and the mean values of three measures were used for statistical analysis.
EFT measurement
Each subject underwent comprehensive transthoracic echocardiography by experienced cardiologist blinded to the clinical data, using an HD11 XE ultrasound unit (Philips Medical Systems, Bothell, WA, USA) with 3.6 MHz transducer. According to the guidelines of American Society of Echocardiography, 11 echocardiographic examinations were performed in left lateral decubitus position. EF was defined as an echo-free space between the outer wall of the myocardium and the visceral layer of the pericardium. The largest diameter of EF located on the right ventricular free wall was determined. EFT was measured in the parasternal long-axis view during end-systole in three cardiac cycles. The average of three cardiac cycles was used for statistical analysis.
Statistical analysis
Statistical analyses were performed by using SPSS 23 system for Windows (SPSS Inc., Chicago, IL, USA). Continuous variables were expressed as mean values ± standard deviation, whereas categorical variables were expressed as percentages. The Kolmogorov–Smirnov test was used to test the normality of distribution of continuous variables. Student’s t-test or the Mann–Whitney U test were used as appropriate in comparing group means of continuous variables. Correlation analysis was used for evaluating correlations between EFT, CIMT and other variables. To determine the predictors of EFT, variables were selected for stepwise multiple linear regression analysis. Receiver operating characteristic (ROC) analysis was quantified by computing the area under the curve (AUC) and 95% confidence interval (CI). Two-tailed p < 0.05 indicated statistical significance.
Results
Baseline characteristics
The baseline demographics, anthropometric and biochemical findings of our study groups are summarized in Table 1. In total, this study population consisted of 106 participants (mean age: 50.4 ± 8.4 years, 57.55% female). Patients with diabetes (76 patients) were compared to control group (30 patients) in demographic data, clinical features, biochemical parameters, HOMA-IR, EFT and CIMT. There were 45 (42.45%) males and 61 (57.55%) females in the total group. Males and females were equally distributed in the study and control groups (p = 0.063) Smoking, age and some biochemical parameters including insulin, total cholesterol, alanine transaminase (ALT) and creatinine levels were similar between the groups.
Baseline characteristics of the study population (n = 107).
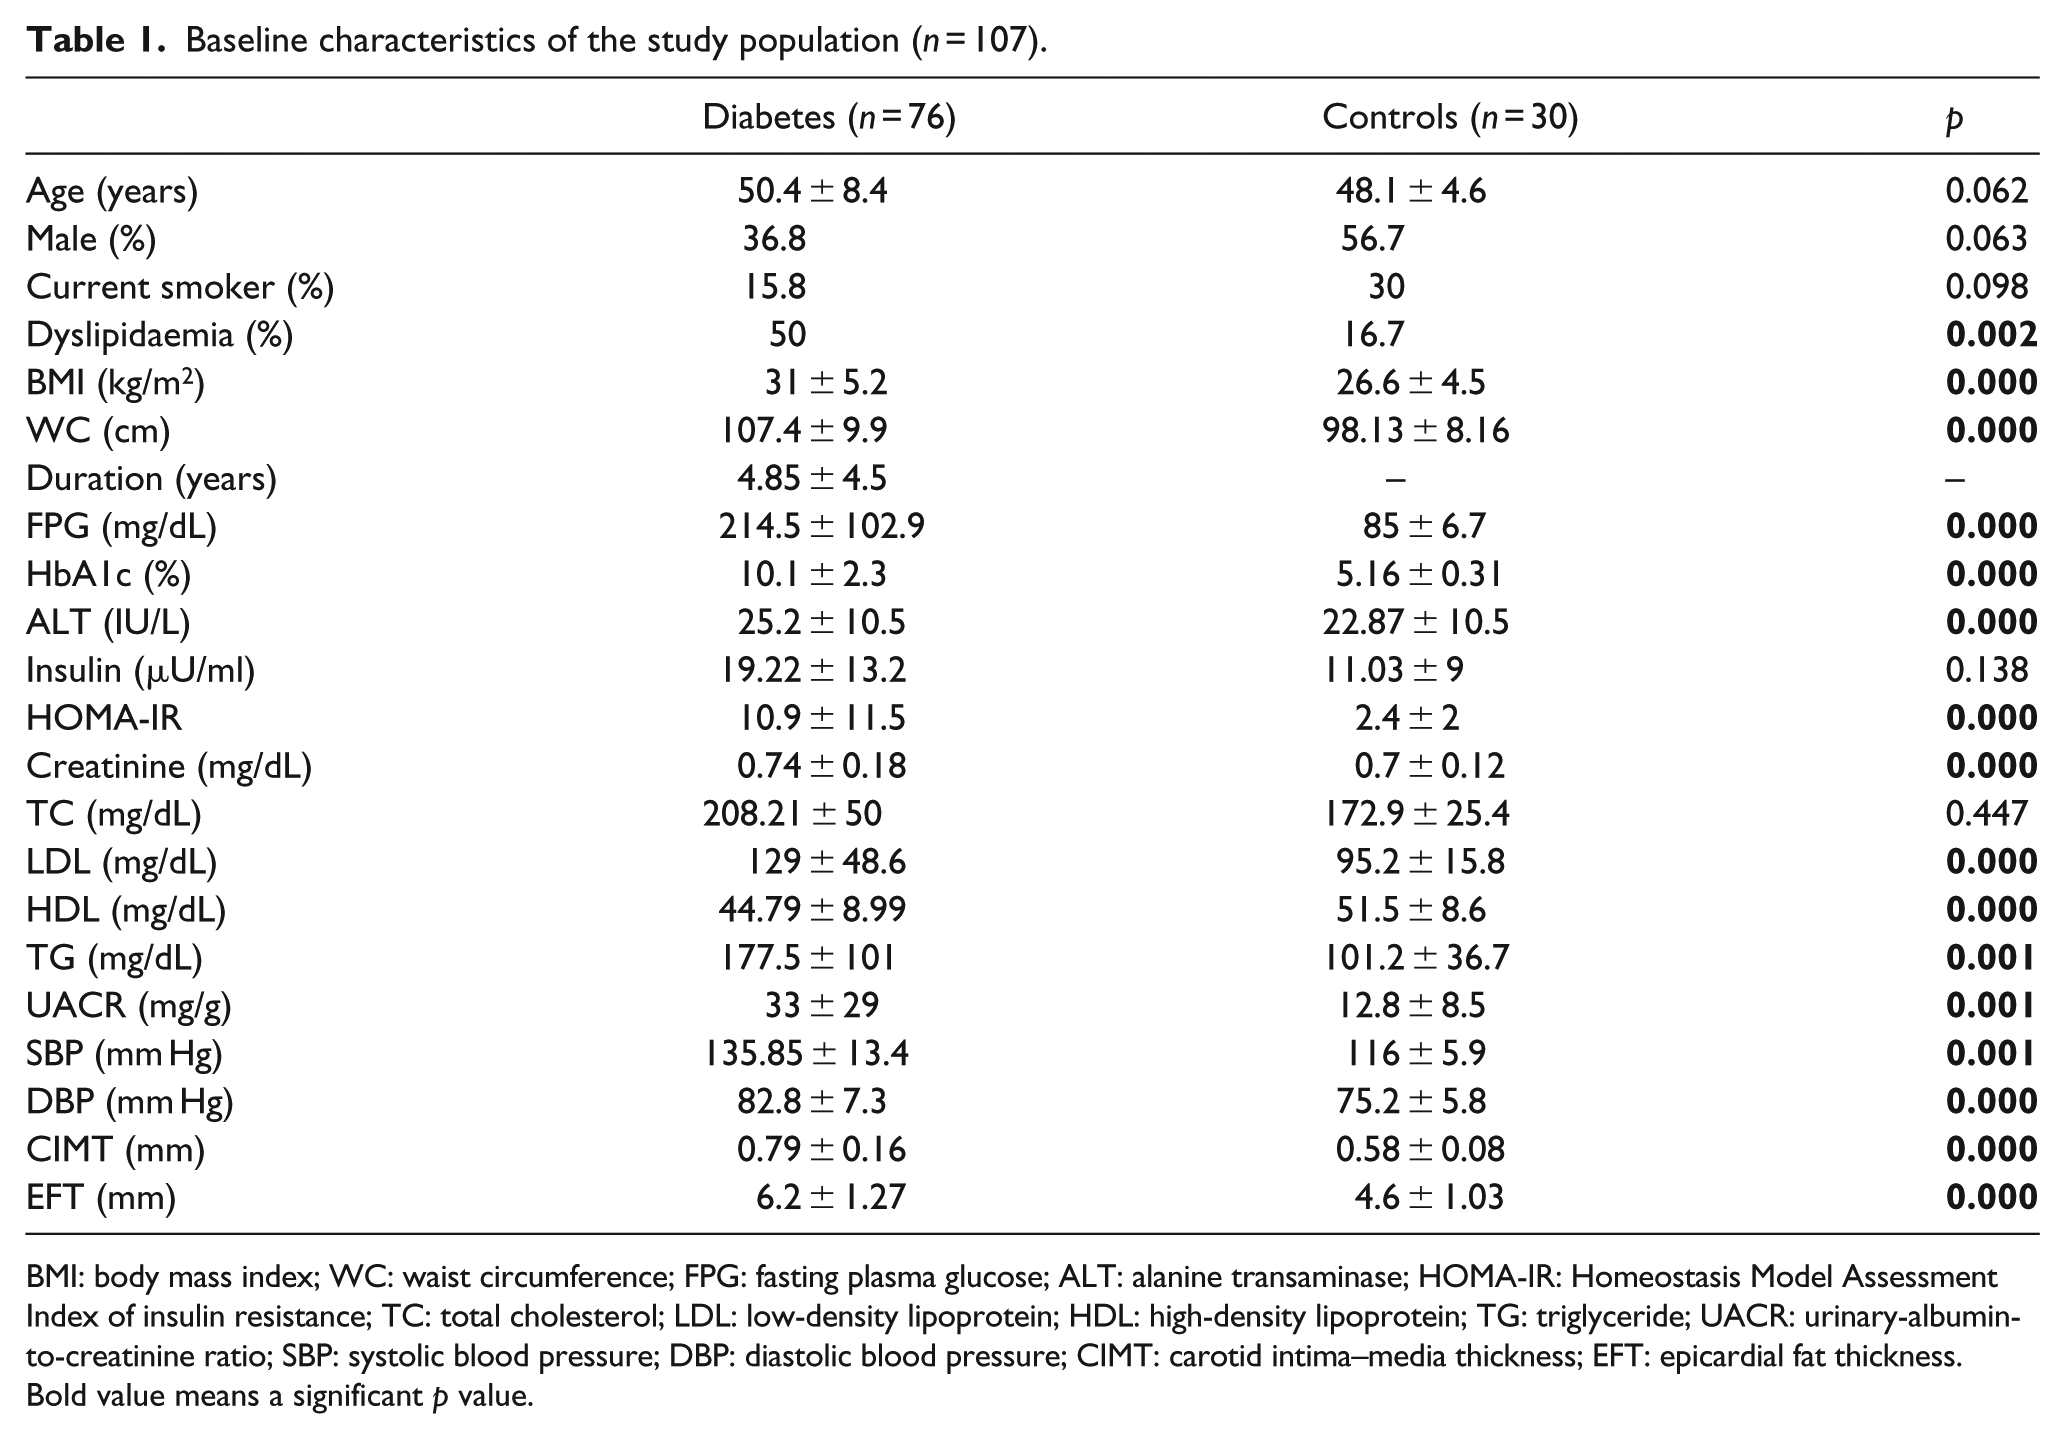
BMI: body mass index; WC: waist circumference; FPG: fasting plasma glucose; ALT: alanine transaminase; HOMA-IR: Homeostasis Model Assessment Index of insulin resistance; TC: total cholesterol; LDL: low-density lipoprotein; HDL: high-density lipoprotein; TG: triglyceride; UACR: urinary-albumin-to-creatinine ratio; SBP: systolic blood pressure; DBP: diastolic blood pressure; CIMT: carotid intima–media thickness; EFT: epicardial fat thickness.
Bold value means a significant p value.
Serum HDL levels were significantly lower in patients with diabetes (44.8 ± 9 mg/dL vs 51.5 ± 8.6 mg/dL; p < 0.001). Systolic and diastolic BP, TG and LDL were significantly higher in patients with diabetes. HOMA-IR and urinary-albumin-to-creatinine ratio (UACR) were also significantly higher in diabetic patients (HOMA-IR: 10.9431 ± 11.5 vs 2.4 ± 2, p < 0.001; UACR: 33.2 ± 29 mg/g vs 12.8 ± 8.5 mg/g, p = 0.001, respectively).
EFT and CIMT measurements
Both CIMT and EFT were significantly higher in diabetic patients compared to controls (0.79 ± 0.16 mm vs 0.58 ± 0.08 mm, p < 0.001 and 6.2 ± 1.27 mm vs 4.6 ± 1.03 mm, p < 0.001, respectively). In the bivariate correlation analysis (Table 2), EFT was positively and significantly correlated with CIMT in our study group (r = 0. 572, p < 0.001). In addition, there was significant correlation between EFT and BMI, WC, duration of diabetes, FPG, HbA1c, HOMA-IR, systolic BP, total cholesterol, LDL, total glucose disposal (TGD) and UACR. There was no significant correlation between EFT and age, insulin, diastolic BP or HDL. Moreover, CIMT was significantly and positively correlated with BMI, WC, duration of diabetes, FPG, HbA1c, HOMA-IR, systolic BP, TGD and insulin (r = 0.238, p = 0.014) (Table 2).
Bivariate correlation analysis of epicardial fat and carotid intima–media thickness with clinical variables.
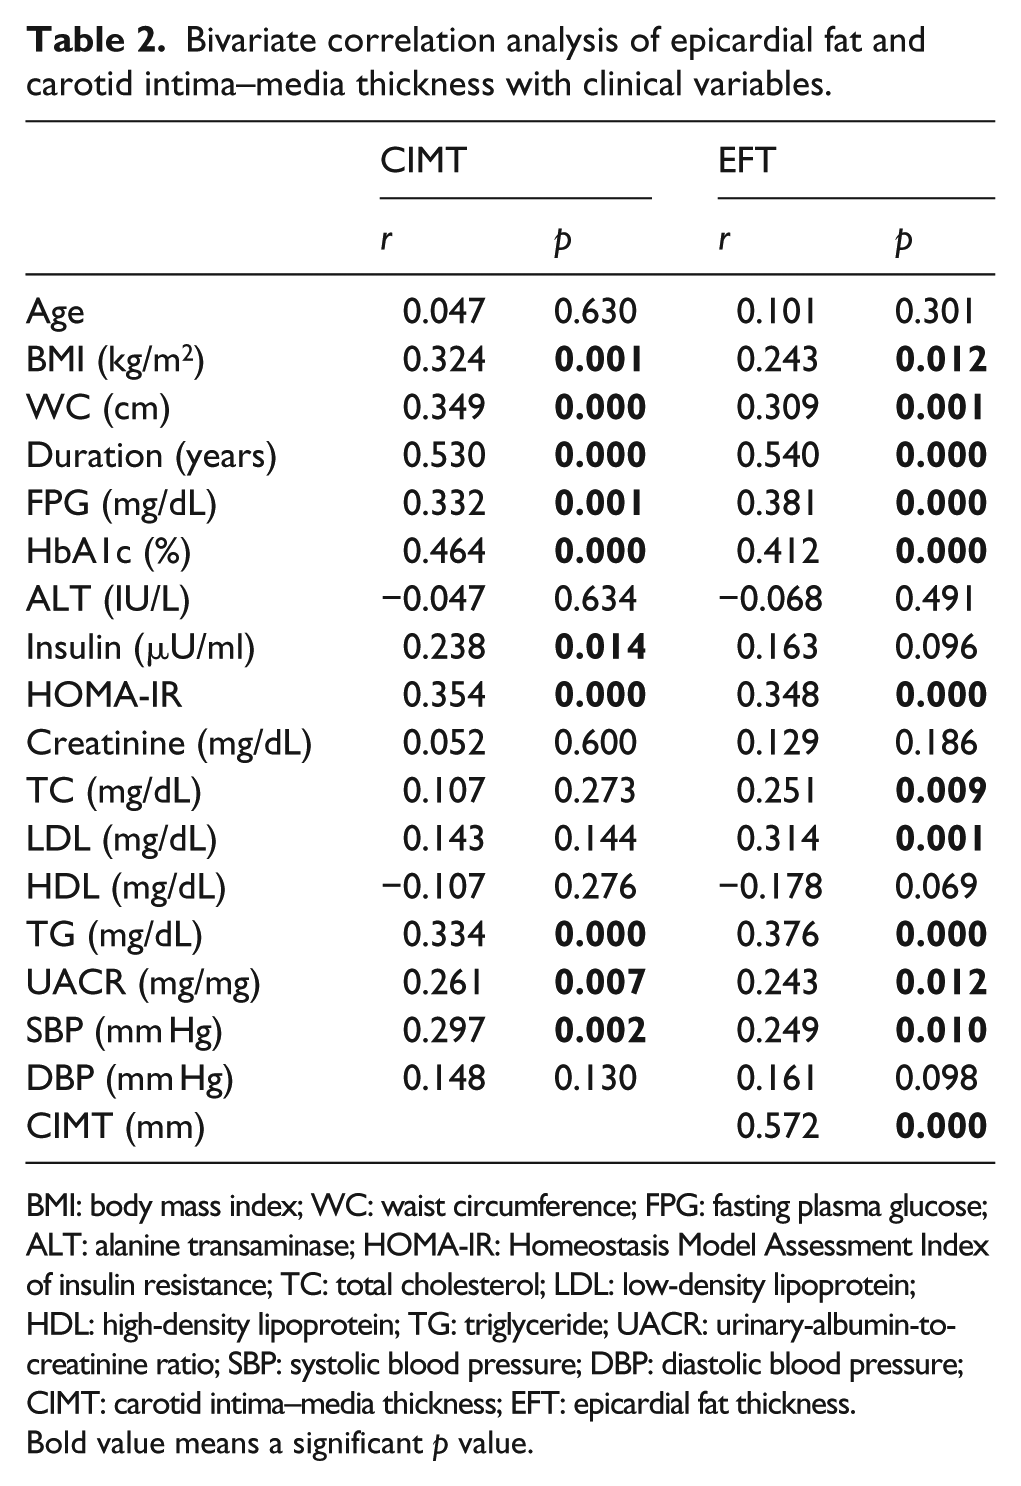
BMI: body mass index; WC: waist circumference; FPG: fasting plasma glucose; ALT: alanine transaminase; HOMA-IR: Homeostasis Model Assessment Index of insulin resistance; TC: total cholesterol; LDL: low-density lipoprotein; HDL: high-density lipoprotein; TG: triglyceride; UACR: urinary-albumin-to-creatinine ratio; SBP: systolic blood pressure; DBP: diastolic blood pressure; CIMT: carotid intima–media thickness; EFT: epicardial fat thickness.
Bold value means a significant p value.
Regression analysis and ROC curve
Stepwise linear regression analysis showed that CIMT, duration of diabetes, TG and BMI were the significant independent predictors of EFT, with CIMT the most important predictor (β = 3.078, t = 4.058, p < 0.001) (Table 3).
Stepwise linear regression analysis for independent predictors of epicardial fat thickness.
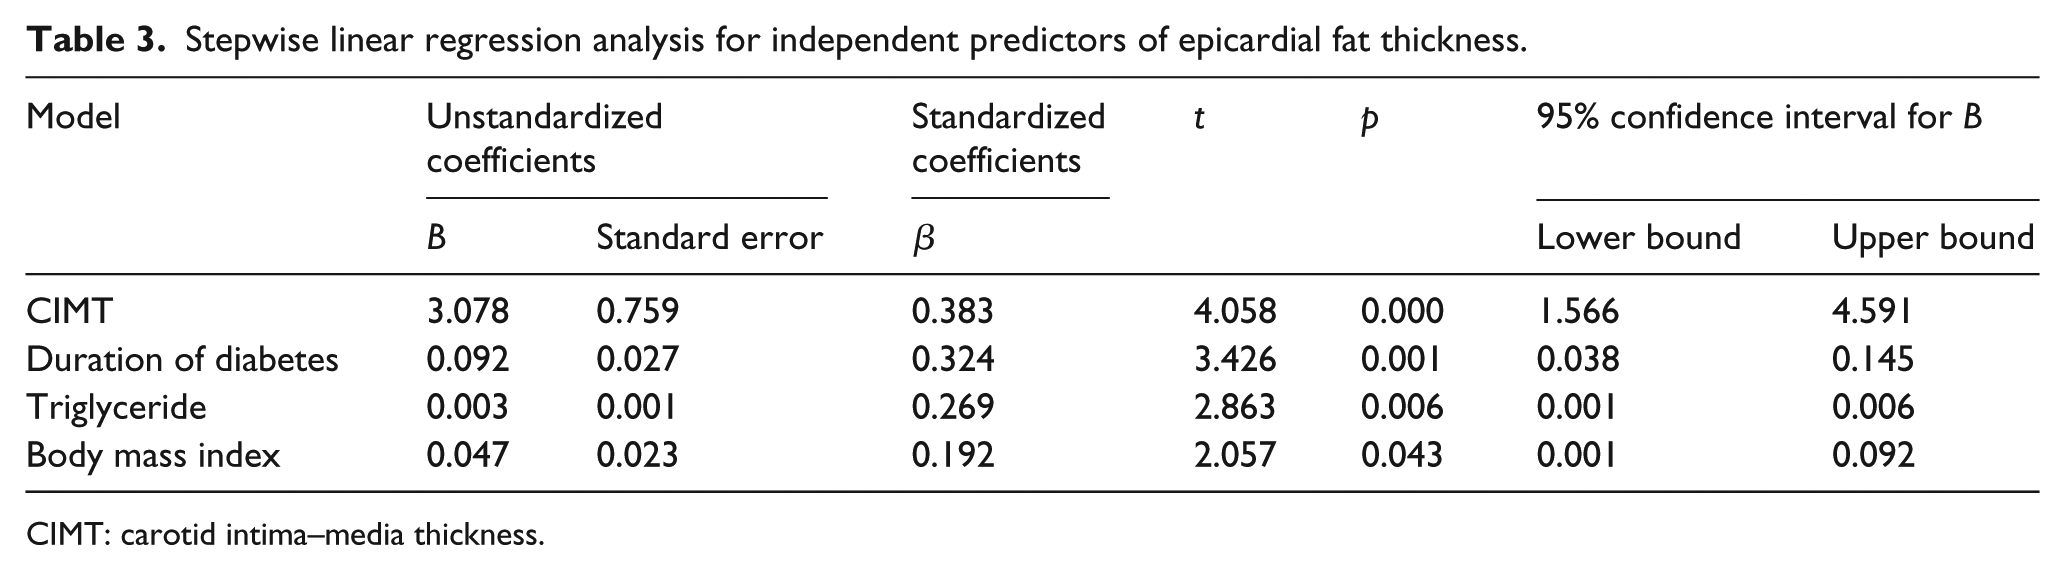
CIMT: carotid intima–media thickness.
According to ESC hypertension guidelines in 2007, 14 which consider CIMT ⩾ 0.9 mm as a surrogate marker of subclinical atherosclerosis, we divide the T2DM group into two groups depending on their CIMT. Patients with CIMT ⩾ 0.9 mm were considered at high risk of atherosclerosis. Then, the cut-off value for EFT was calculated and analysed by ROC curve analysis. In this study, the AUC was found to be statistically significant (AUC = 0.684, 95% CI: 0.535–0.834, p < 0.05) (Figure 1). As an optimal cut-off point, high-risk EFT value of 6.1 mm was determined with a 71.4% sensitivity and a 72% specificity.
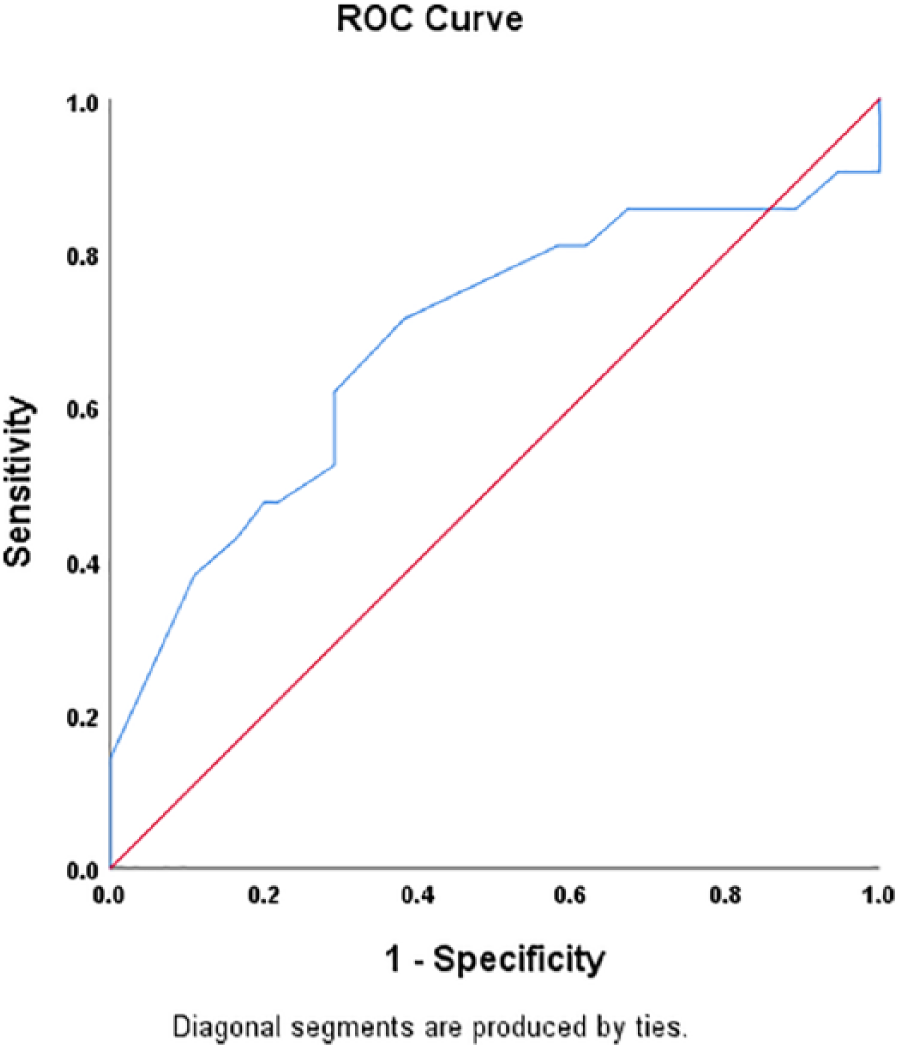
ROC curve analysis for cut-off high-risk EFT value. The area under the ROC curve of 0.684 indicates a good accuracy of the test.
Discussion
In this study, which included 106 patients, 76 of them with T2DM without evidence of clinical atherosclerotic CVD and 30 age- and sex-matched nondiabetic controls. We measured the thickness of EF by two-dimensional (2D) echocardiography in the free wall of the right ventricle at the end-systole and found that patients with T2DM had a significantly higher EFT compared to the nondiabetic group, with mean of 6.2 ± 1.27 mm vs 4.6 ± 1.03 mm, p < 0.001. We also found that increased EFT associated significantly and positively with CIMT in T2DM. Although this study was the first in Egypt which correlates EFT with CIMT in diabetes patients, our findings confirm what was reported by other studies.15,16
Corresponding to other studies,15,16 EFT was correlated significantly with age, WC, duration of diabetes, HbA1c, fasting glucose, HOMA-IR and lipid profile in the study group. Previous study showed that echocardiographic EFT correlation with CIMT was more peculiar than the other risk factors including WC in metabolic syndrome. 17 Other studies reported that echocardiographic EFT reflects the presence and severity of atherosclerosis of carotid or coronary arteries.15,18,19
The positive significant linear correlation between EFT, duration of diabetes and CIMT in this study support the findings of Sengul et al., 17 and support the reliability and usefulness of EFT as a measure of subclinical atherosclerosis in T2DM. Different studies used magnetic resonance imaging (MRI) or computed tomography (CT) for assessment of EF and found that EFT was an independent risk factor for significant CAD in asymptomatic T2DM.20,21 The results of our study support these findings and indicated that EFT could be used as a predictor or a marker of subclinical atherosclerosis of the carotid arteries and CAD.
Regarding its proximity to the myocardium, epicardial adipose tissue has special metabolic, thermogenic and mechanical functions. EF is a main source of different cytokines and hormones, acting as a localized endocrine gland. 10 Furthermore, EF regulates heart and blood vessel physiologically, via paracrine and vasocrine mechanisms. It has also been reported that EF acts as an important energy reservoir for cardiomyocytes, which depend on fatty acid oxidation as energy source. 22 EF is rich in saturated fatty acids with greatest capacity for free fatty acid (FFA) release and uptake compared with other visceral adipose tissues. 23 Despite the proposed bidirectional diffusion of FFA through the interstitial fluid, the myocardium is protected from exposure to extremely high levels of FFAs by the EF. 24
Similar to other adipose tissues, EF is a major source of anti-inflammatory and proinflammatory adipocytokines with abundant inflammatory cells including lymphocytes, macrophages and mast cells. 25 Adiponectin is expressed in epicardial tissue with anti-diabetic, anti-atherogenic, anti-oxidative and anti-inflammatory properties and increased insulin sensitivity.26,27 Proinflammatory cytokines produced by the EF inflammatory cells include interleukin 1 (IL-1), interleukin 8 (IL-8), interleukin 6 (IL-6) and tumour necrosis factor alpha (TNF-α). 28 IL-6 induces vascular smooth muscle proliferation and subsequently atherosclerotic plaques. It also inhibits gene expression of adiponectin. TNF-α is proinflammatory cytokine secreted by EF, which is also elevated in obesity and actually causes vasoconstriction and worsens insulin resistance.29,30 Iacobellis 8 proposed that EF can affect the coronary and systemic arteries and may be responsible for the development and progression of CAD through the imbalance between these cardioprotective and harmful adipokines.
Generally, EF is considered an important marker for visceral adipose tissue depot and could be used as a prediction tool for the metabolic syndrome risk.31,32 Due to ethnic variations and verities of the methods used in its quantification, there were some difficulties in establishment a standard cut-off points for EFT.18,33 Different studies reported that EF correlates significantly with the degree and severity of CAD, regardless of the presence or absence of traditional risk factors of CVD in general population or in patients with high cardiovascular risk.19,34 Actually, higher EF is associated with the presence of unstable noncalcified coronary artery plaques, which are the most dangerous type of plaque. 35
In addition to its association with CIMT, EFT has been associated with other markers of subclinical atherosclerosis, including apoB:apoA-1 ratio and total cholesterol/HDL ratio in symptomatic and asymptomatic adults with high risk of atherosclerosis, in obese children and in nonobese adults.18,36–38 The association between EFT and T2DM has been also investigated in a large study and reported that increased EFT is independently associated with the prevalence of diabetes in Korean men. 39 EFT was also increased in patients with prediabetes 40 or T2DM with subclinical atherosclerosis. 16 In addition, the relationship between EF and metabolic syndrome indices was evaluated in a meta-analysis and reported a significant relationship between EF and metabolic syndrome independent of BMI. 41
Limitations
Our study had some limitations. It is a cross-sectional study with limited number of patients, and other prospective studies are necessary for more confirmation. All data were based on a single measurement. So as to confirm the usefulness of EFT as a high-risk marker of atherosclerosis in T2DM, further studies are required with large population.
Conclusion
In conclusion, our data show that EFT measured by echocardiography was increased in patients with T2DM. EFT was also strongly and positively correlated with duration of diabetes, WC and CIMT. Our results could suggest that echocardiographic EFT is another reliable marker for assessment of cardiovascular risk in patients with T2DM. Further larger and longitudinal studies are needed to illuminate the clinical implications of EF in diabetes patients.
Footnotes
Declaration of conflicting interests
The author(s) declared no potential conflicts of interest with respect to the research, authorship and/or publication of this article.
Funding
The author(s) received no financial support for the research, authorship and/or publication of this article.