
Abstract
Background:
The use of ratios for analyzing physiologic variables often creates spurious associations.
Methods:
Results of a euglycaemic clamp, a graded exercise test to measure maximal oxygen uptake (VO2max) and underwater weighing in 358 nondiabetic adults (166 women and 192 men) were used to compare the effects of weight standardization by division or by partial Spearman correlations on the association between VO2max and insulin sensitivity.
Results:
VO2max and insulin sensitivity were negatively correlated when VO2max was divided by weight. When partial Spearman correlations were used to adjust VO2max for body composition, the correlation between VO2max and insulin sensitivity was greatly diminished.
Conclusions:
Division of VO2max by weight does not adjust for weight, but it creates spurious associations between VO2max and insulin sensitivity.
Introduction
Maximal oxygen uptake (VO2max) is a commonly used estimate of cardiorespiratory fitness. VO2max has been associated with insulin sensitivity in many studies.1–4 An issue when evaluating the relationship between VO2max and insulin sensitivity is confounding by body weight or other measures of body size and composition. An approach often employed with the intention of creating a VO2max variable that is independent of weight is to divide VO2max by weight resulting in VO2max that is expressed as millilitres of O2 per kilogram of body weight per minute (mL/kg/min). However, division by weight does not remove the confounding effect of weight and may in fact make it worse.
The use of a ratio in an attempt to standardize for body size (i.e. dividing VO2max by weight, or VO2max/WT) is common both in research and in clinical practice.5–11 The purpose of such division is presumably to create a new variable that is independent of weight. Division by weight, however, generally fails to accomplish this. Instead it creates a variable that is usually strongly negatively correlated with weight. Use of the weight ratio method to standardize for body size overestimates the VO2max for lighter individuals and underestimates it for heavier individuals.6,7,9–11 As a result, the division creates a spurious association with other variables, such as insulin sensitivity, as illustrated in a study of overweight Hispanic youth. 12
The primary aim of our analysis is to demonstrate the differences that arise when ratios, rather than partial correlation coefficients, are used to standardize VO2max in determining its correlation with insulin sensitivity. Our secondary aim is to show the relationship between VO2max and insulin sensitivity when appropriate adjustment methods are used.
Methods
Participants and methods
The participants were 166 women and 192 men aged 18 to 47 years. Their race/ethnicity distribution was 249 American Indians, 25 African Americans, 83 non-Hispanic Whites and 1 Hispanic. Other characteristics are shown in Table 1. The subjects were recruited for a longitudinal research study on the etiology of obesity and metabolism at the National Institutes of Health clinical research centre in Phoenix, Arizona. 13 The subjects were healthy as assessed by medical history. Participants with diabetes by criteria of the American Diabetes Association 14 or taking medicine for diabetes were excluded. This study was approved by the institutional review boards of the National Institute of Diabetes and Digestive and Kidney Diseases and the Indian Health Service, and by the Council of the Gila River Indian Community. Participants provided written informed consent.
Subject characteristics.
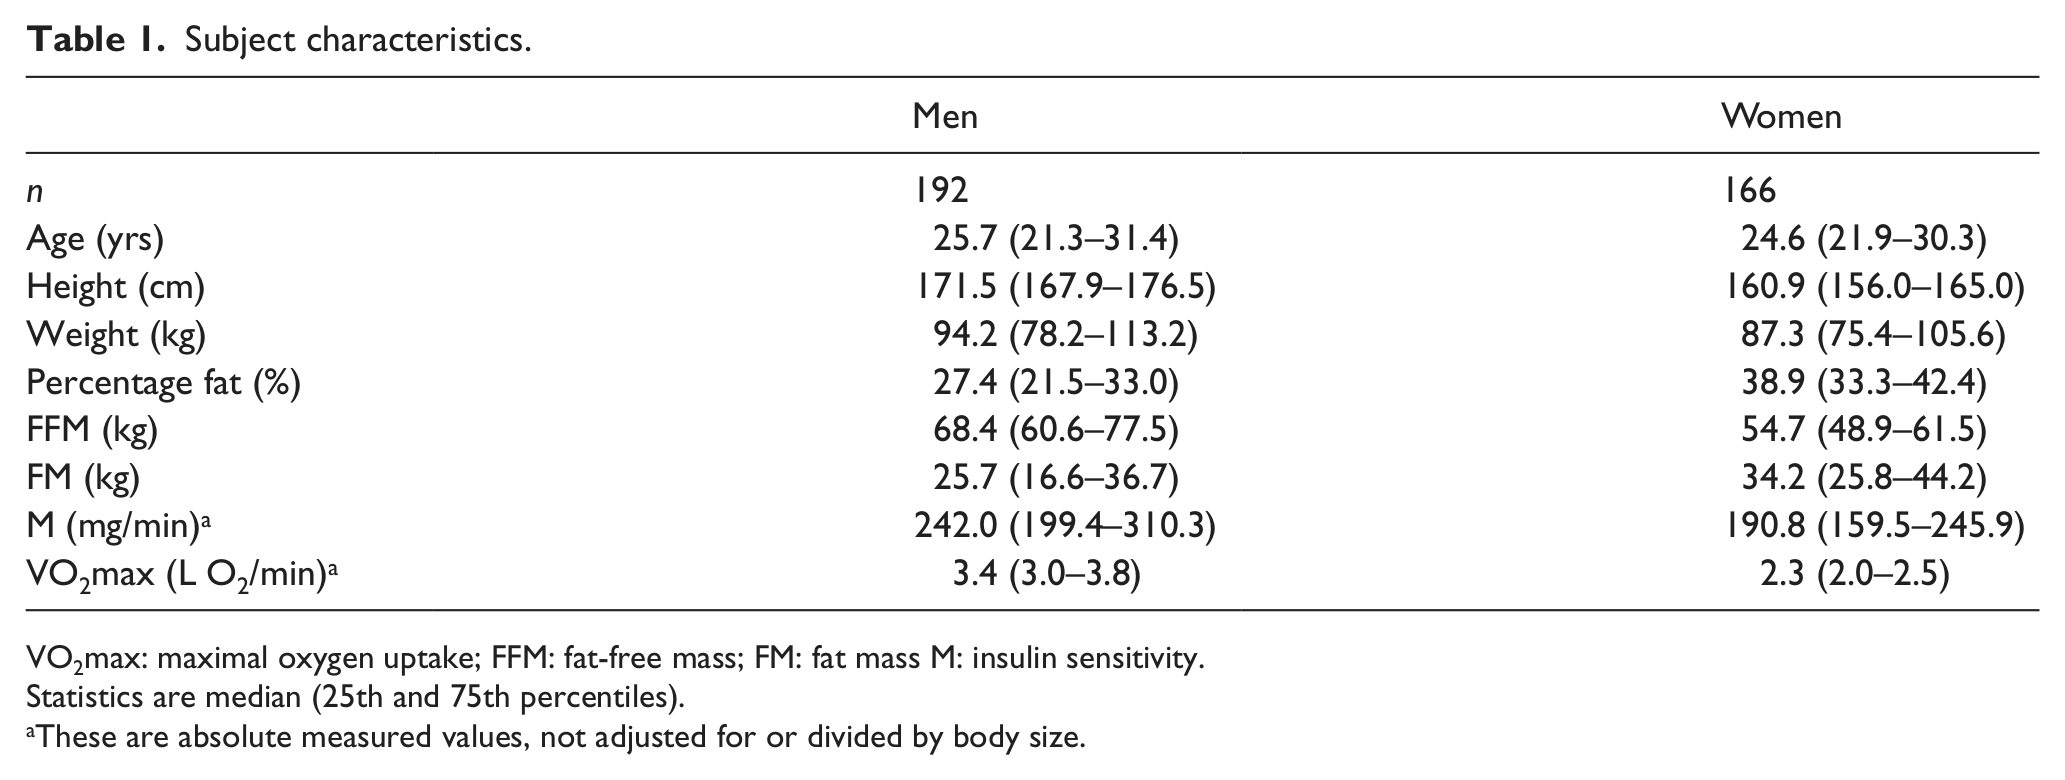
VO2max: maximal oxygen uptake; FFM: fat-free mass; FM: fat mass M: insulin sensitivity.
Statistics are median (25th and 75th percentiles).
These are absolute measured values, not adjusted for or divided by body size.
Assessment of body composition, glucose and insulin
Oral glucose tolerance test
After an overnight fast, each participant had a 75 g oral glucose tolerance test. Venous plasma glucose was measured in fasting and 30, 60, 120 and 180 min post-load samples. Normal glucose tolerance was defined as a fasting plasma glucose <5.6 mmol/L and a 2-h plasma glucose <7.8 mmol/L. Impaired glucose regulation was defined as a fasting plasma glucose concentration ≥5.6 mmol/L or 2-h plasma glucose ≥7.8 mmol/L in the absence of diabetes, defined as a fasting plasma glucose ≥7.0 mmol/L or 2-h plasma glucose ≥11.1 mmol/L. None of the participants had diabetes.
Hyperinsulinaemic–euglycaemic glucose clamp
Insulin sensitivity (M) was measured as the rate of total insulin-stimulated glucose disposal during the last 40 min of insulin infusion in a standard hyperinsulinaemic–euglycaemic glucose clamp. 13 M was adjusted for steady-state insulin and steady-state glucose using regression. It was not adjusted for body size except as described below.
Maximal oxygen uptake
The morning after the hyperinsulinaemic–euglycaemic clamp, participants underwent a graded exercise test using a standardized treadmill protocol. 13 Each participant started walking at 0° gradient and a speed of 1.5 miles/h. Elevation and speed were gradually increased. At 4 min intervals, the participant would rest while seated until his or her heart rate fell to below 120 beats/min. The test continued until the heart rate reached 200 beats/min, there was no increase in oxygen uptake or the participant requested to stop. VO2max was determined from the last 30 s to 1 min of the test. VO2max was defined as the highest VO2 recorded during the exercise test. 13
Body composition
Body composition was assessed by hydrodensitometry with correction for simultaneously measured residual lung volume as described by Bogardus et al. 13 and Goldman and Buskirk. 15 The Siri equation, corrected for residual lung volume, was used to calculate percentage body fat from body density. 15 Fat mass (FM) was calculated from percentage fat and weight (WT). Fat-free mass (FFM) was calculated by subtracting FM from WT.
Statistical analysis
Associations between M, body composition and VO2max were assessed with simple Spearman correlation coefficients with 95% confidence limits. Sex-specific partial (for age and height) Spearman correlations were calculated between M and VO2max, and standardized for body size. Standardization was done either as ratios (dividing by WT, FM or FFM) or by including WT, FM or FFM in the partial Spearman correlations. Statistical analyses were done using SAS version 9.1 (SAS Institute, Cary, NC). All figures were adjusted for age and height. Adjustments were calculated using residuals from regression. The age- and height-adjusted residuals were added to the mean of the corresponding variable to scale the figure to standard units.
Results
Spearman correlation coefficients partialled for age and height are shown in Table 2 for body size and composition measurements, VO2max and M for men and women. The top two sections of the table show correlations of several variables with VO2max and with VO2max divided by WT, FM or FFM. The bottom two sections show the analogous analyses for M. The first row shows that, in men, WT and VO2max have a positive Spearman correlation of 0.27, but the correlation of WT with VO2max divided by WT, FM or FFM is negative and much greater in absolute value (e.g. −0.83 for WT and VO2max/WT). Similarly in women, row six shows the correlation of WT with VO2max is positive, but becomes negative with greater absolute value when VO2max is divided by each of the body size measurements. These effects of division by WT are illustrated in Figure 1, which shows scatterplots of VO2max (Figure 1(a)) and VO2max/WT (Figure 1(b)) with WT.
Spearman correlation coefficients (95% confidence limits) between VO2max, VO2max divided by weight or FFM and measures of body composition, in men and women.
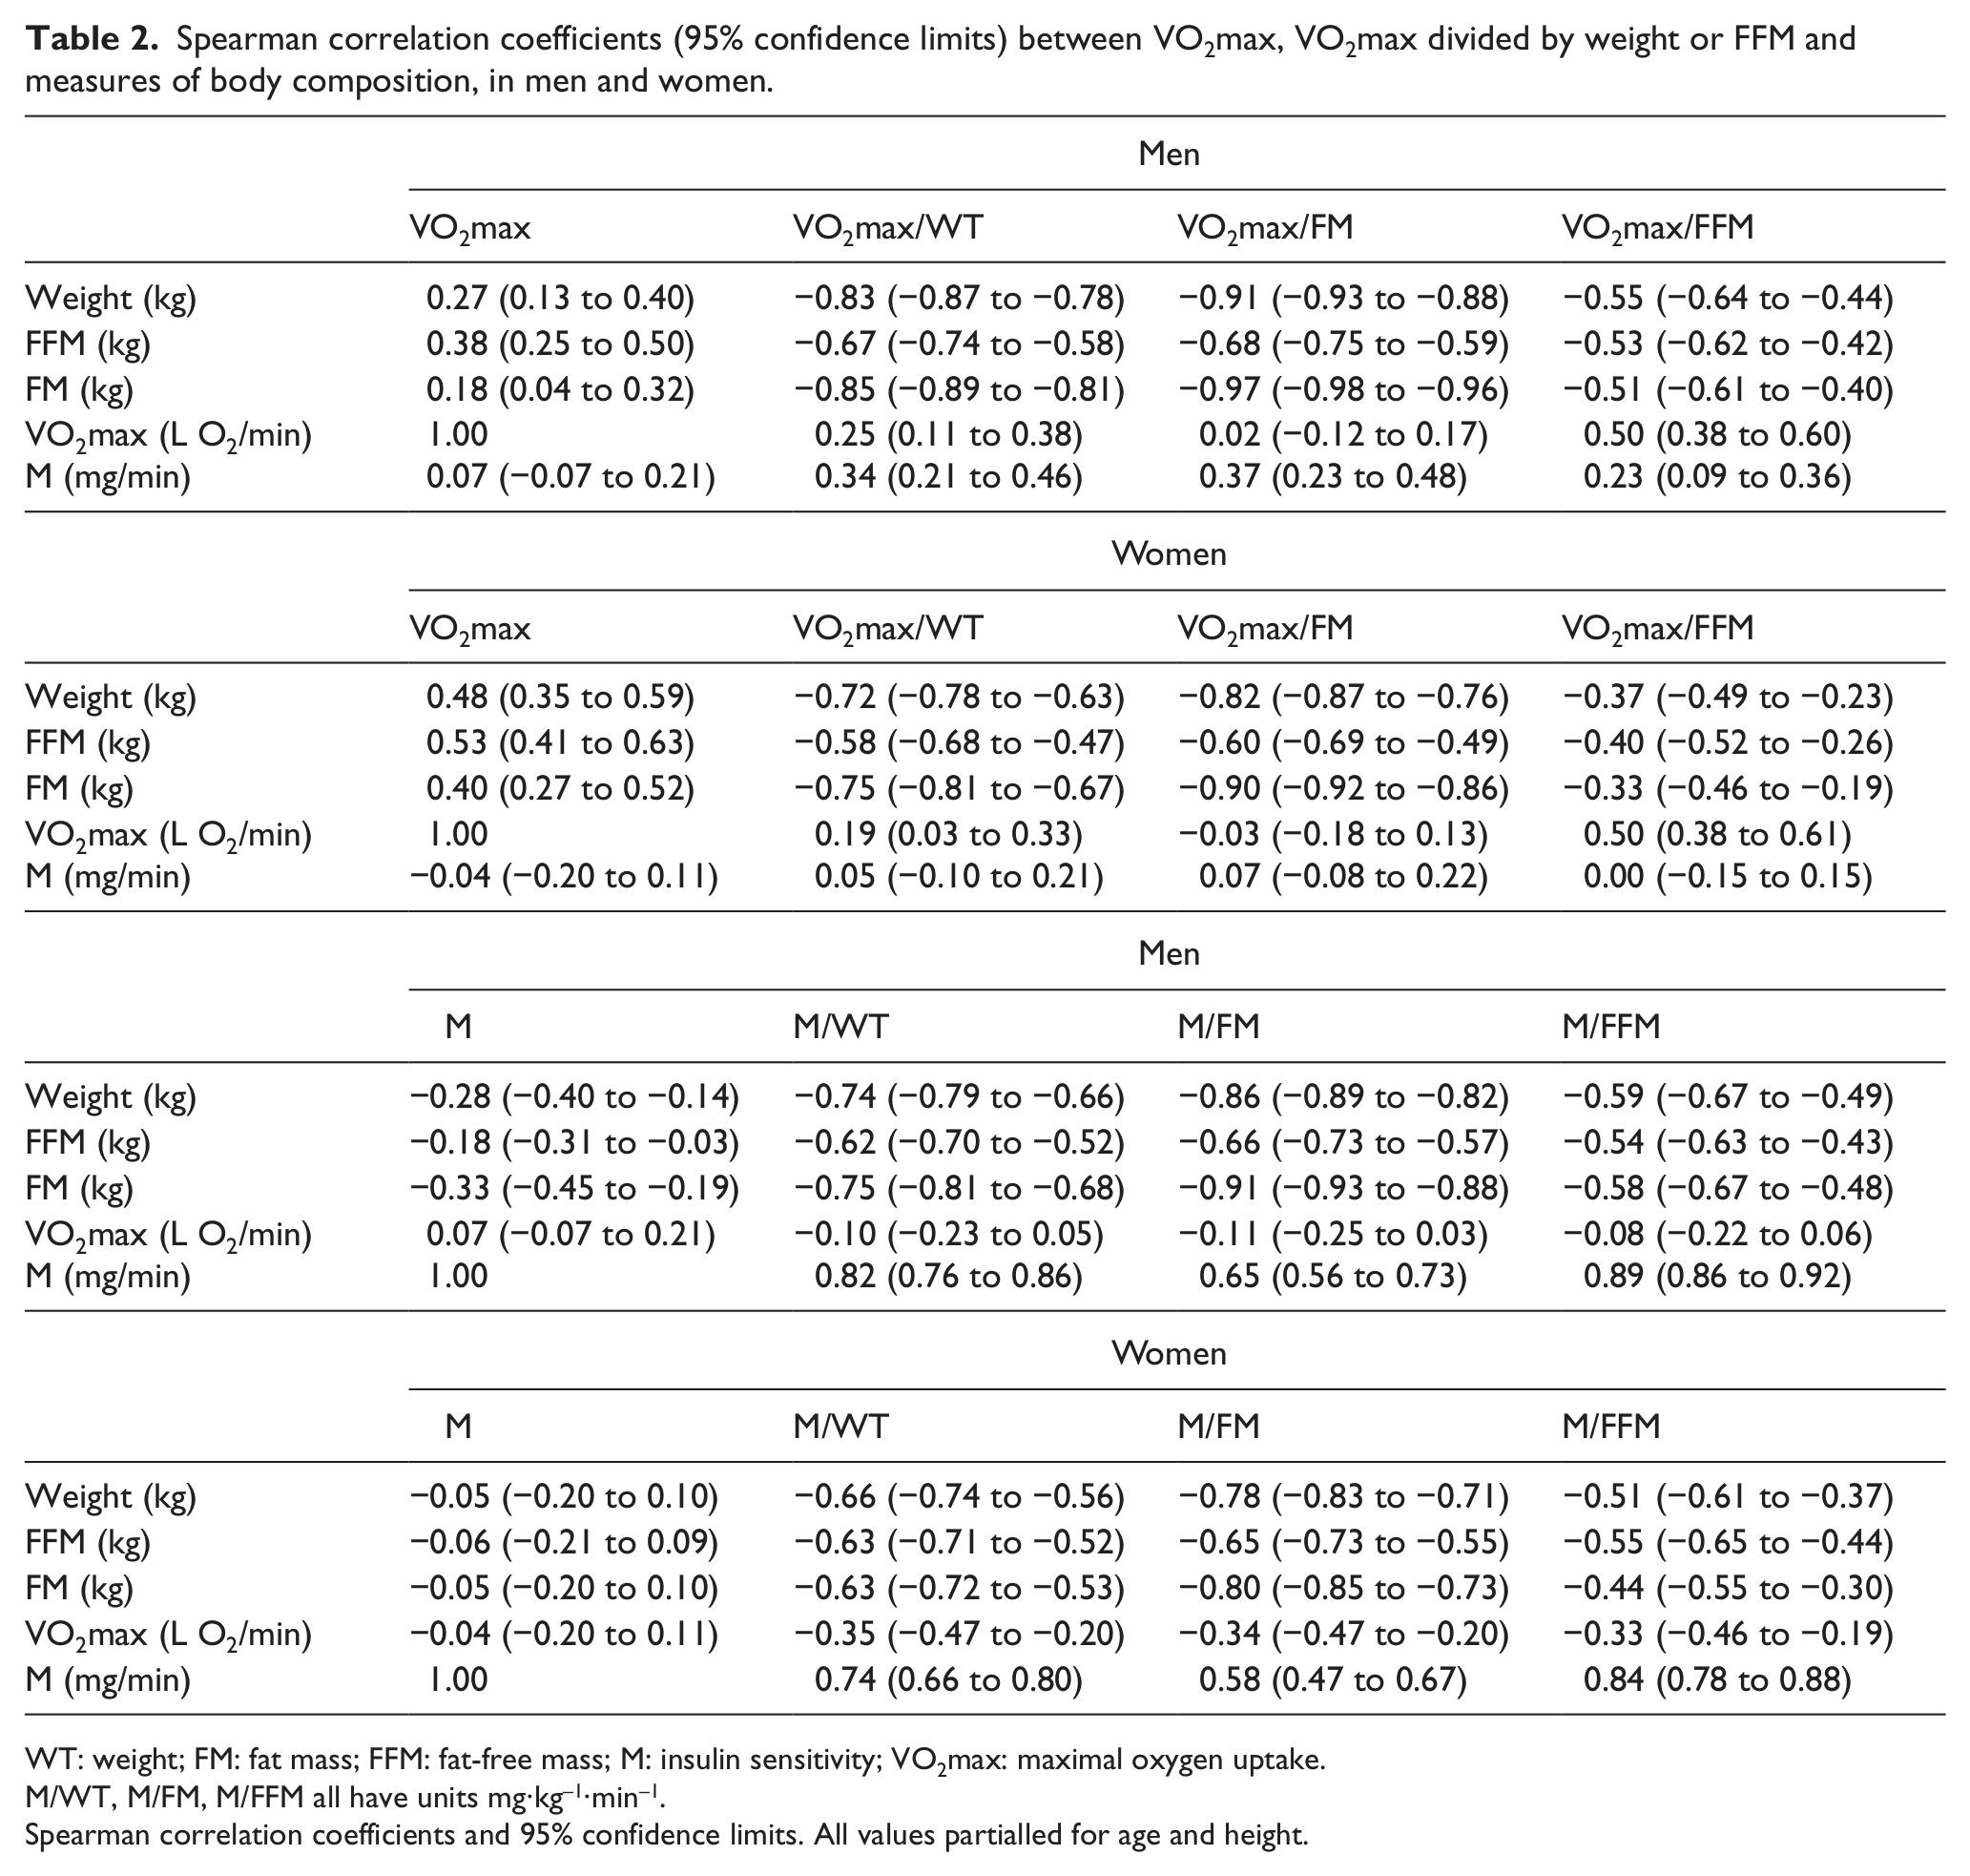
WT: weight; FM: fat mass; FFM: fat-free mass; M: insulin sensitivity; VO2max: maximal oxygen uptake.
M/WT, M/FM, M/FFM all have units mg·kg–1·min–1.
Spearman correlation coefficients and 95% confidence limits. All values partialled for age and height.
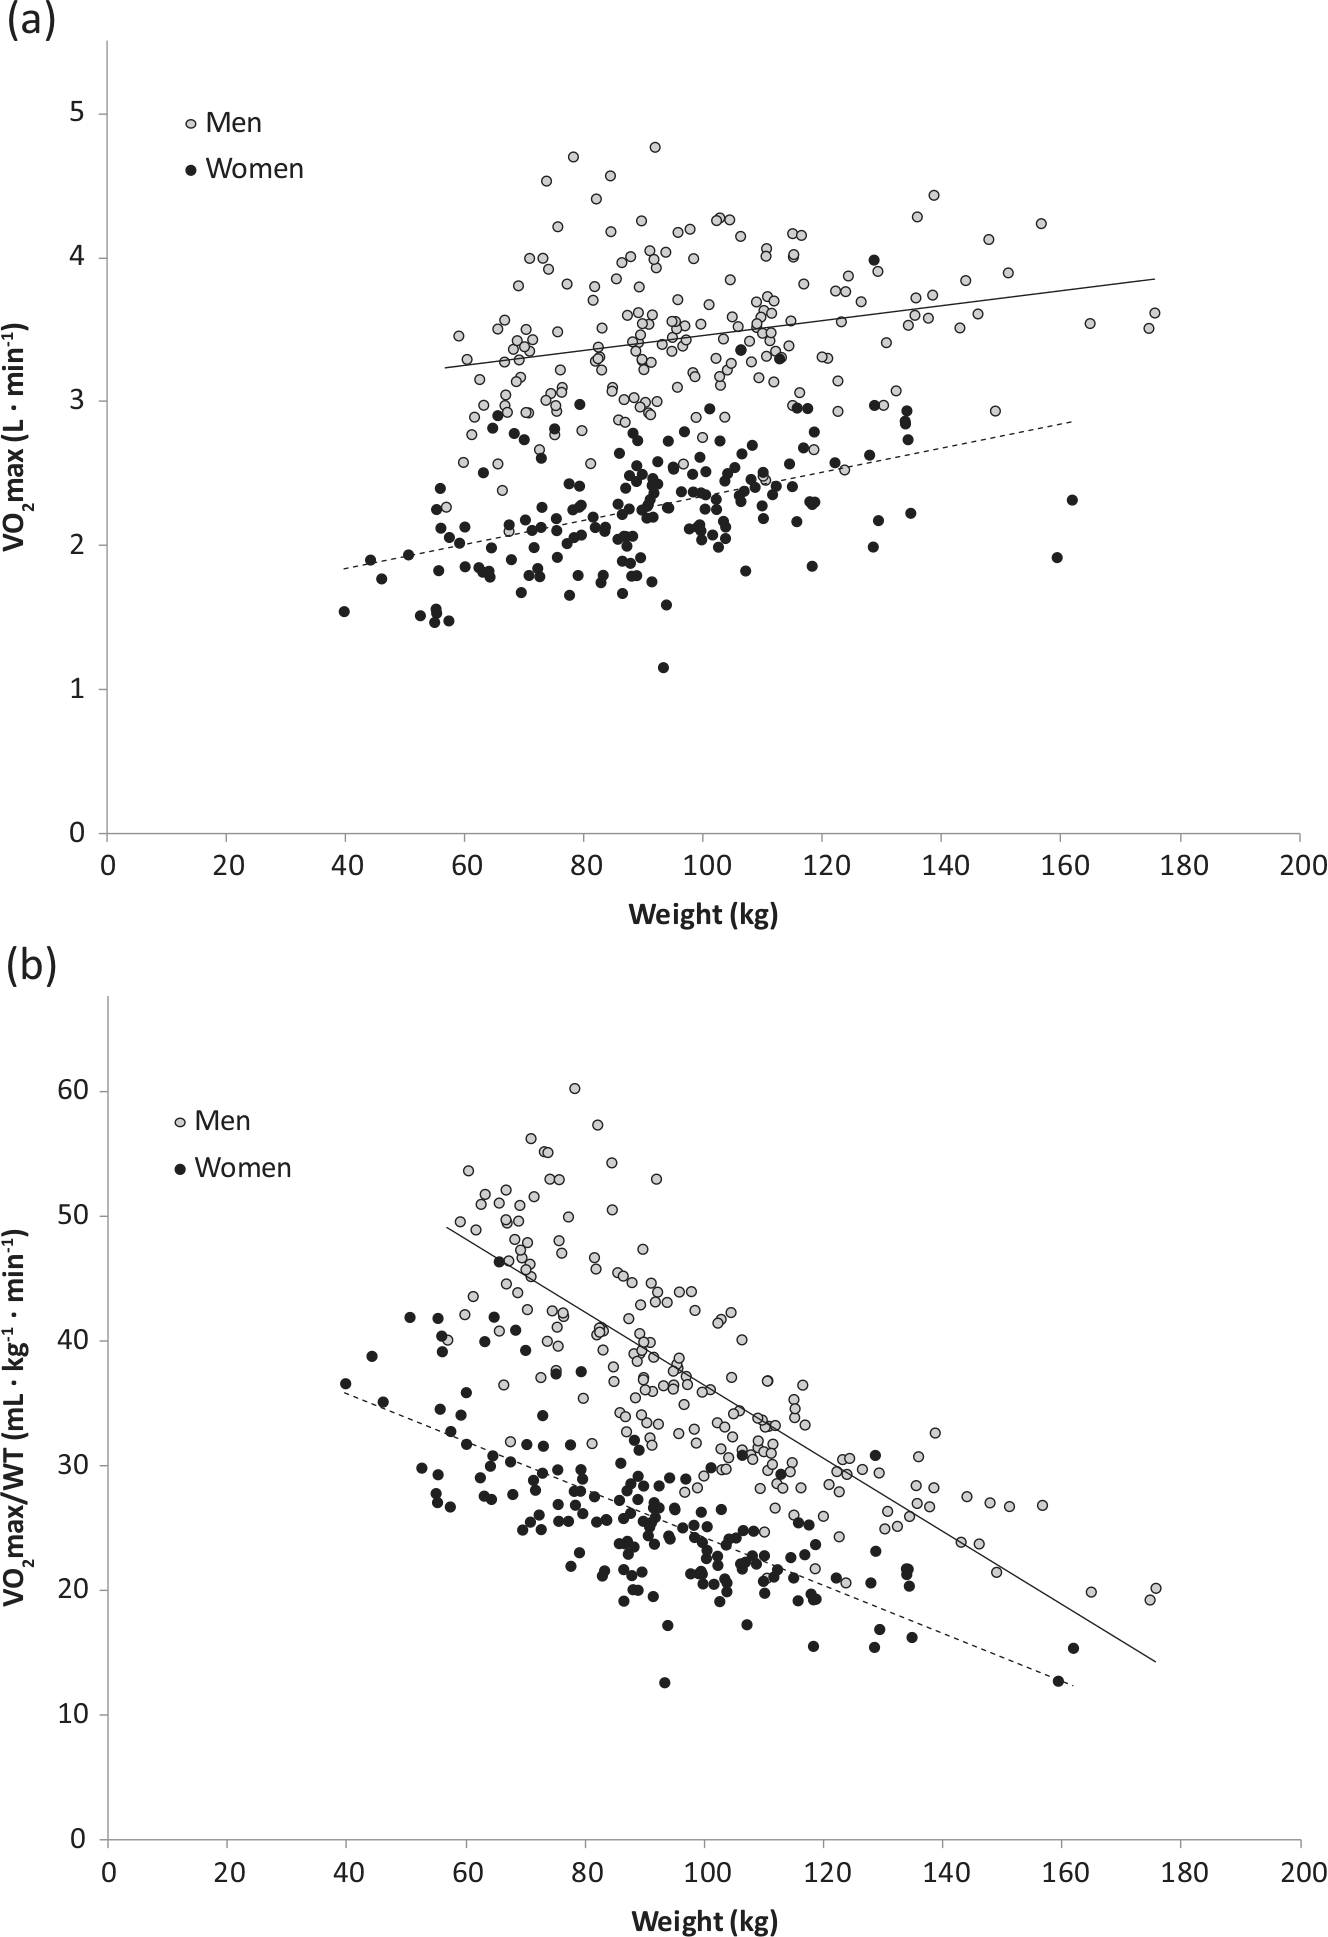
(a) VO2max and (b) VO2max/WT, by weight in men and women. Data were adjusted for age and height.
Table 2, fifth row, also shows that when adjusted only for age and height, the Spearman correlations of M and VO2max were small (0.07 in men and −0.04 in women) and not significantly different from 0. The lack of association between VO2max and M (when each was adjusted only for age and height) is illustrated as a scatterplot in Figure 2. When VO2max was divided by WT, FM or FFM, these correlations became significantly positive in men (but not in women), as shown in the top half of Table 2. When M was divided by WT, FM or FFM, the correlations with VO2max became significantly negative in women (but not in men), as shown in the bottom half of Table 2.
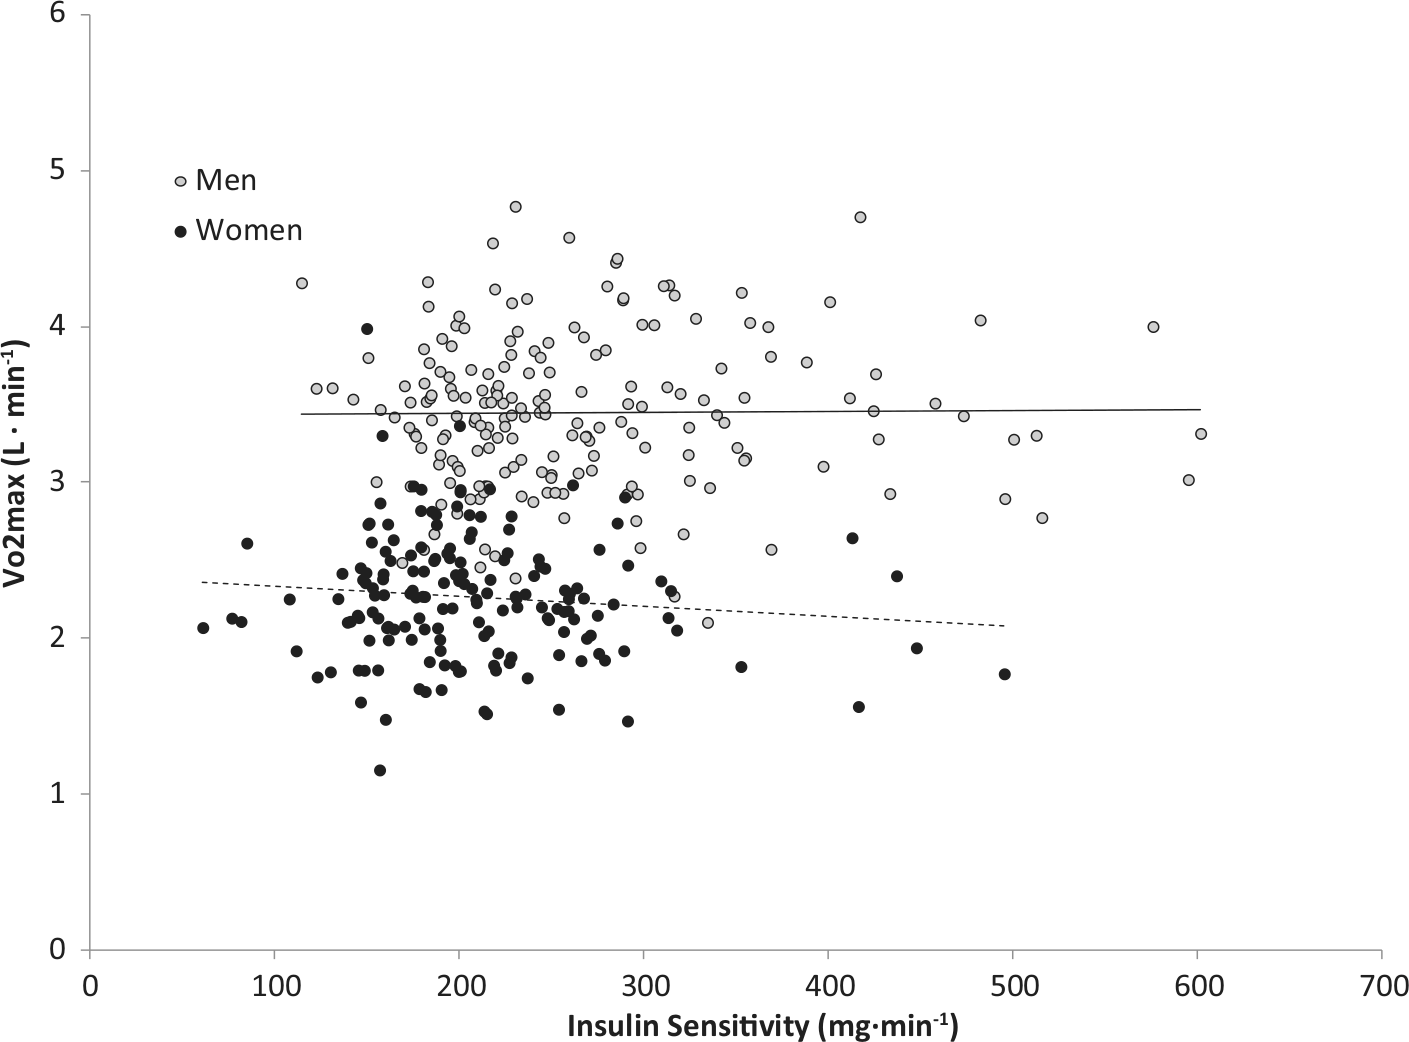
VO2max by insulin sensitivity in men and women. Data were adjusted for age and height.
Table 3 shows correlations between VO2max and M (directly, and when each was divided by WT, FM or FFM). The correlation coefficients were partialled only for age and height, or also for one of the body size measurements. With no division by body size, VO2max and M were uncorrelated, as described above (Table 2). When partialled for WT or FFM, these correlations became significantly positive but modest in men (r = 0.15 or 0.16). When each variable was divided by WT, FM or FFM, however, the partial correlations were significantly positive, and usually much greater, in each sex.
Spearman correlation coefficients (95% confidence limits) between VO2max and insulin sensitivity.
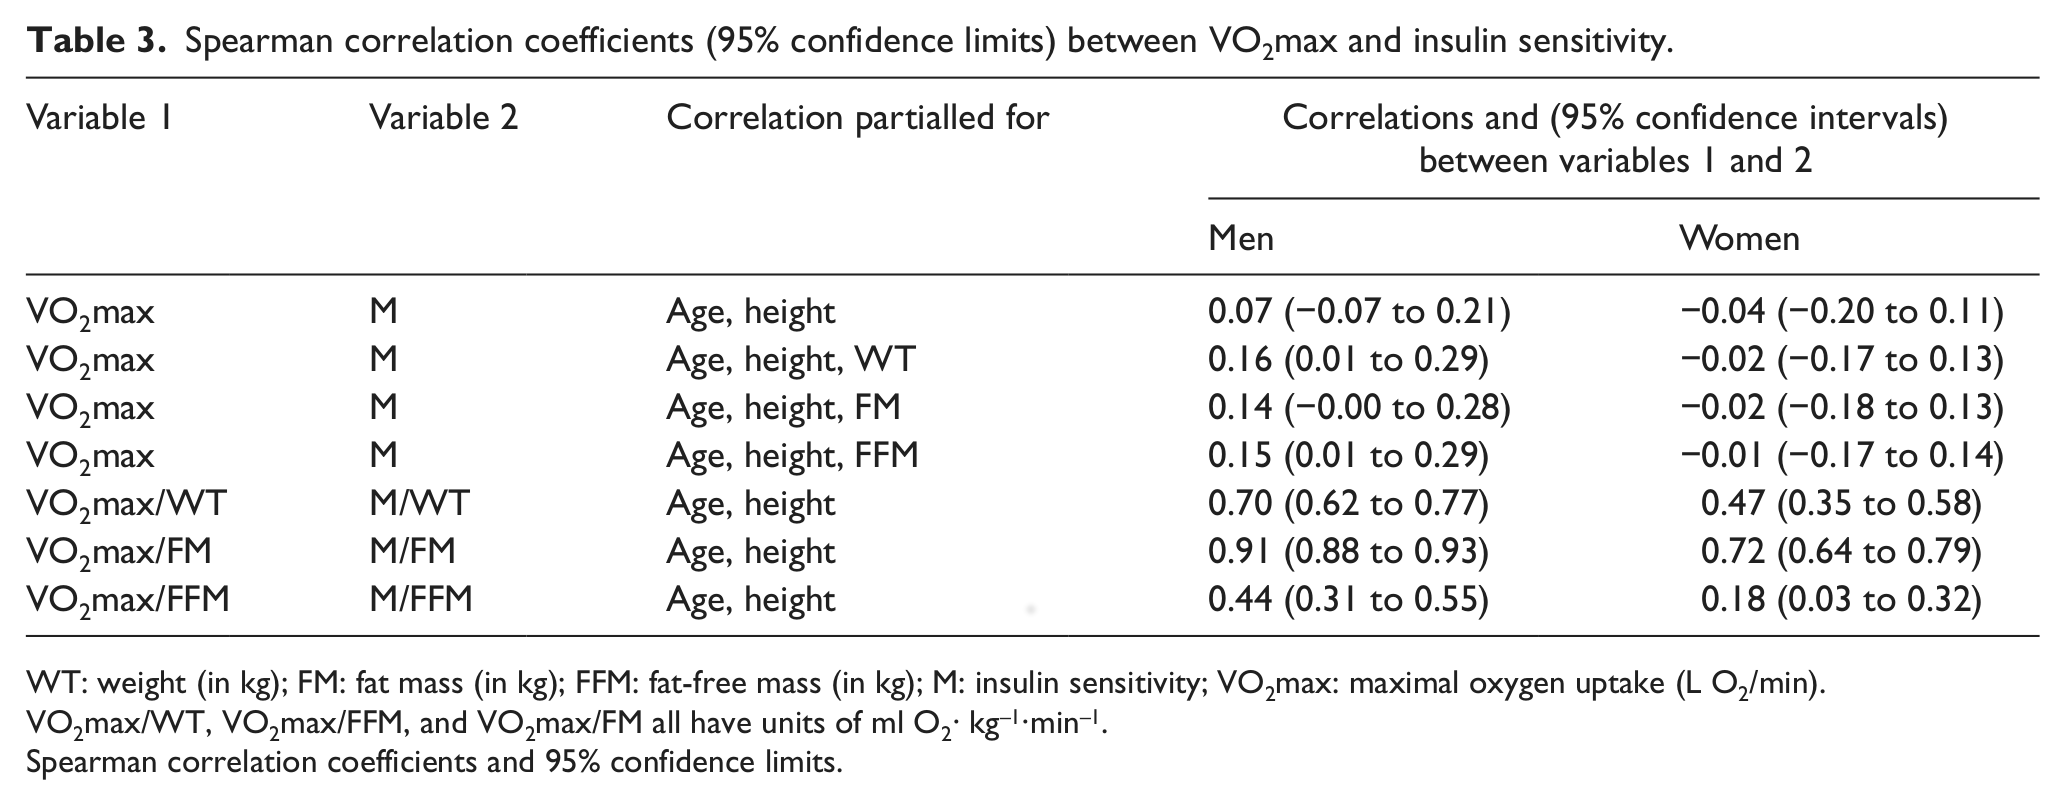
WT: weight (in kg); FM: fat mass (in kg); FFM: fat-free mass (in kg); M: insulin sensitivity; VO2max: maximal oxygen uptake (L O2/min).
VO2max/WT, VO2max/FFM, and VO2max/FM all have units of ml O2· kg–1·min–1.
Spearman correlation coefficients and 95% confidence limits.
Results were similar when 1/(fasting insulin concentration) was used as an estimate of insulin sensitivity instead of M (details not shown).
Discussion
Division by weight or FFM worsens the problem of weight confounding rather than correcting it. The absolute values of the age- and height-adjusted, sex-specific correlations of WT with VO2max/WT, FM with VO2max/FM and FFM with VO2max/FFM were greater than the absolute values of the correlations of WT, FM and FFM with age- and height-adjusted VO2max. Since our aim was to determine the relationship between M and VO2max, independent of body composition, the use of partial correlations was the appropriate statistical approach to adjust VO2max for body composition.7,9–12
In this adult population, the apparent relationship between VO2max and M is strongly dependent upon the method used to standardize for body composition, similar to the findings in a previous study in overweight Hispanic youth. 12 We show that body composition affects the relationship between VO2max and M and that the weight ratio method of standardization does not properly adjust for body size. Rather, the weight ratio method creates spurious associations between VO2max and M.7,9–12 When VO2max was analyzed accounting for body size and composition, using partial correlation, its association with M was greatly diminished. This suggests that prior correlations based on dividing VO2max by weight are spurious owing to this division.
The strength of our study was the use of the hyperinsulinaemic–euglycaemic clamp to measure M. We were also able to separate weight into components of FM and FFM and compare the results between body-composition-adjusted models and weight-adjusted models. A limitation was the inability to define VO2max by time on the treadmill, a measure used by other investigators, 16 because our protocol included periodic rests between 4-min bouts of exercise. Future studies should examine the relationship between VO2max and diabetes using appropriate standardization methods that account for body composition partial correlation or regression rather than traditional ratio methods, which can create spurious correlations.7,9–11
This study illustrates that the use of a ratio does not properly adjust VO2max for body size, as the ratio is strongly correlated with body size. The use of ratios for standardization has been shown to introduce the same confounding in correlations of other variables as well, and is more generally an inappropriate standardization technique for physiological variables.7,9–11 In 1896, Pearson showed how ‘spurious correlation’ results from standardization by ratios. 17 This analysis provides a further example, using data on VO2max and insulin sensitivity, of such spurious correlations.
Footnotes
Acknowledgements
We would like to thank the volunteers for participating in the research study, Jill Loebel, and the staff at the Obesity and Diabetes Clinical Research Section in Phoenix for the clinical studies. This research was supported by the Intramural Research Program of the National Institute of Diabetes and Digestive and Kidney Diseases.
Authors’ contributions
B.A.G. planned analysis, researched data, contributed to discussion, wrote manuscript, and reviewed/edited manuscript. C.C.M. planned analysis, contributed to discussion and reviewed/edited manuscript. E.J.W contributed to discussion, wrote manuscript and reviewed/edited manuscript. W.C.K. planned analysis, contributed to discussion, wrote manuscript and reviewed/edited manuscript. J.P. planned analysis, contributed to discussion, wrote manuscript and reviewed/edited manuscript.
Declaration of conflicting interests
The authors have no conflicts of interest to disclose.
Funding
This research was supported by the NIDDK Intramural Research Program.