
Abstract
Systemic microvascular complications are related to the presence of diabetic neuropathy. This study investigated the associations of blood flow oscillations with peripheral neuropathy in 25 controls and 3 diabetic groups including clinical (24), subclinical (27) and without neuropathy (26). Laser Doppler skin perfusion was transformed into three low-frequency subintervals corresponding to endothelial, neurogenic and myogenic vasomotor controls. The average vasomotion was significantly reduced in clinical neuropathy group and characterized by endothelial and neural but not smooth muscle–related changes. The normalized spectrums revealed a relative increase of myogenic and decrease of neurogenic activity in subclinical neuropathy group. The myogenic component showed a statistically inverse correlation with postural fall in systolic blood pressure (r = −0.32, p < 0.01). The diabetic patients with decreased low-frequency vasomotor responses were associated with increased odds ratio of peripheral neuropathy [odds ratio = 3.51 (95% confidence interval = 1.19–10.31), p = 0.02]. This study elucidated possible interaction between impaired microvascular flow motion and diabetic peripheral neuropathy. The vasomotor changes of skin microcirculation could be detected even in the absence of overt cardiovascular dysfunction.
Introduction
Peripheral neuropathy and impaired blood supply can result in the development of diabetic foot ulcerations. 1 Subsequent limb-threatening complications lead to increased medical costs and hospital stays for people with diabetes. Deranged microcirculatory function is found early in the diabetes process, even in the absence of overt foot diseases. 2 Early identification of potential risk factors should consider the impact of large vessel diseases and clinical neuropathy on the at-risk feet as well as additional roles for intrinsic dysfunction in diabetic microvasculature.
Flow motion is the rhythmic oscillations in blood flow, which can be detected using laser Doppler flowmetry. The assessment of blood flow variability may contribute to the understanding of extrinsic and intrinsic regulation of peripheral vascular tone. 3 Spectral analysis of skin vasomotion can reveal variations in the amplitudes within characteristic frequency ranges. Higher frequency oscillations are referred to the transmission of the respiratory and cardiac rhythms to the skin microcirculation. 4 The focus of some previous data was on the 3–12 cycles/min in skin blood flow oscillations. The low-frequency (0.02–0.14 Hz) range of cutaneous vasomotion has been shown to be lowered as a result of impaired sympathetic control.5,6 The microcirculatory changes are particularly prominent in patients with diabetes.
Some studies have reported associations of diabetic neuropathy with systemic microangiopathy manifestations.7,8 The possible links between dysregulated blood flow and severity level of peripheral neuropathy have yet to be determined. This study chose to analyse flow motion in the low-frequency components in order to concentrate on the intrinsic microvascular control of patients with diabetes. As described by Stefanovska and colleagues,9,10 we are particularly interested in the frequency intervals of 0.0095–0.021, 0.021–0.052 and 0.052–0.145 Hz in order to test the relative contributions of endothelial, neural and myogenic activities on the microcirculatory regulation, respectively. Our aim was to investigate whether the vasomotor changes were related to the presence of peripheral neuropathy in patients with diabetes.
Methods
A total of 77 patients with type 2 diabetes were chosen from the outpatient clinics of a veteran affair medical centre. A control group of 25 age-matched volunteers without diabetes was recruited from the same hospital-based population. All the participants gave informed consent to this study, which had been approved by our local ethics committee. None of the subjects had a history of skin ulcer, active inflammation or abnormal ankle brachial pressure index (<0.9 or >1.3) in their feet. The patients using α-adrenergic blocker and β-adrenergic blocker or calcium antagonists were also excluded from this study. They had no peripheral neuropathy of non-diabetic origin.
The diabetic patients were evaluated and categorized according to the neuropathy symptom score (NSS) and neuropathy disability score (NDS). The diagnosis for peripheral neuropathy was based on the previous criteria. 11 The subjects with moderate signs or mild signs with moderate symptoms were assigned to the neuropathy group. Mild signs alone or with mild symptoms were taken to imply subclinical neuropathy. The participants were considered free from neuropathy if both their NSS and NDS were equal to zero. The characteristics of the studied groups were shown in Table 1.
Clinical characteristics.
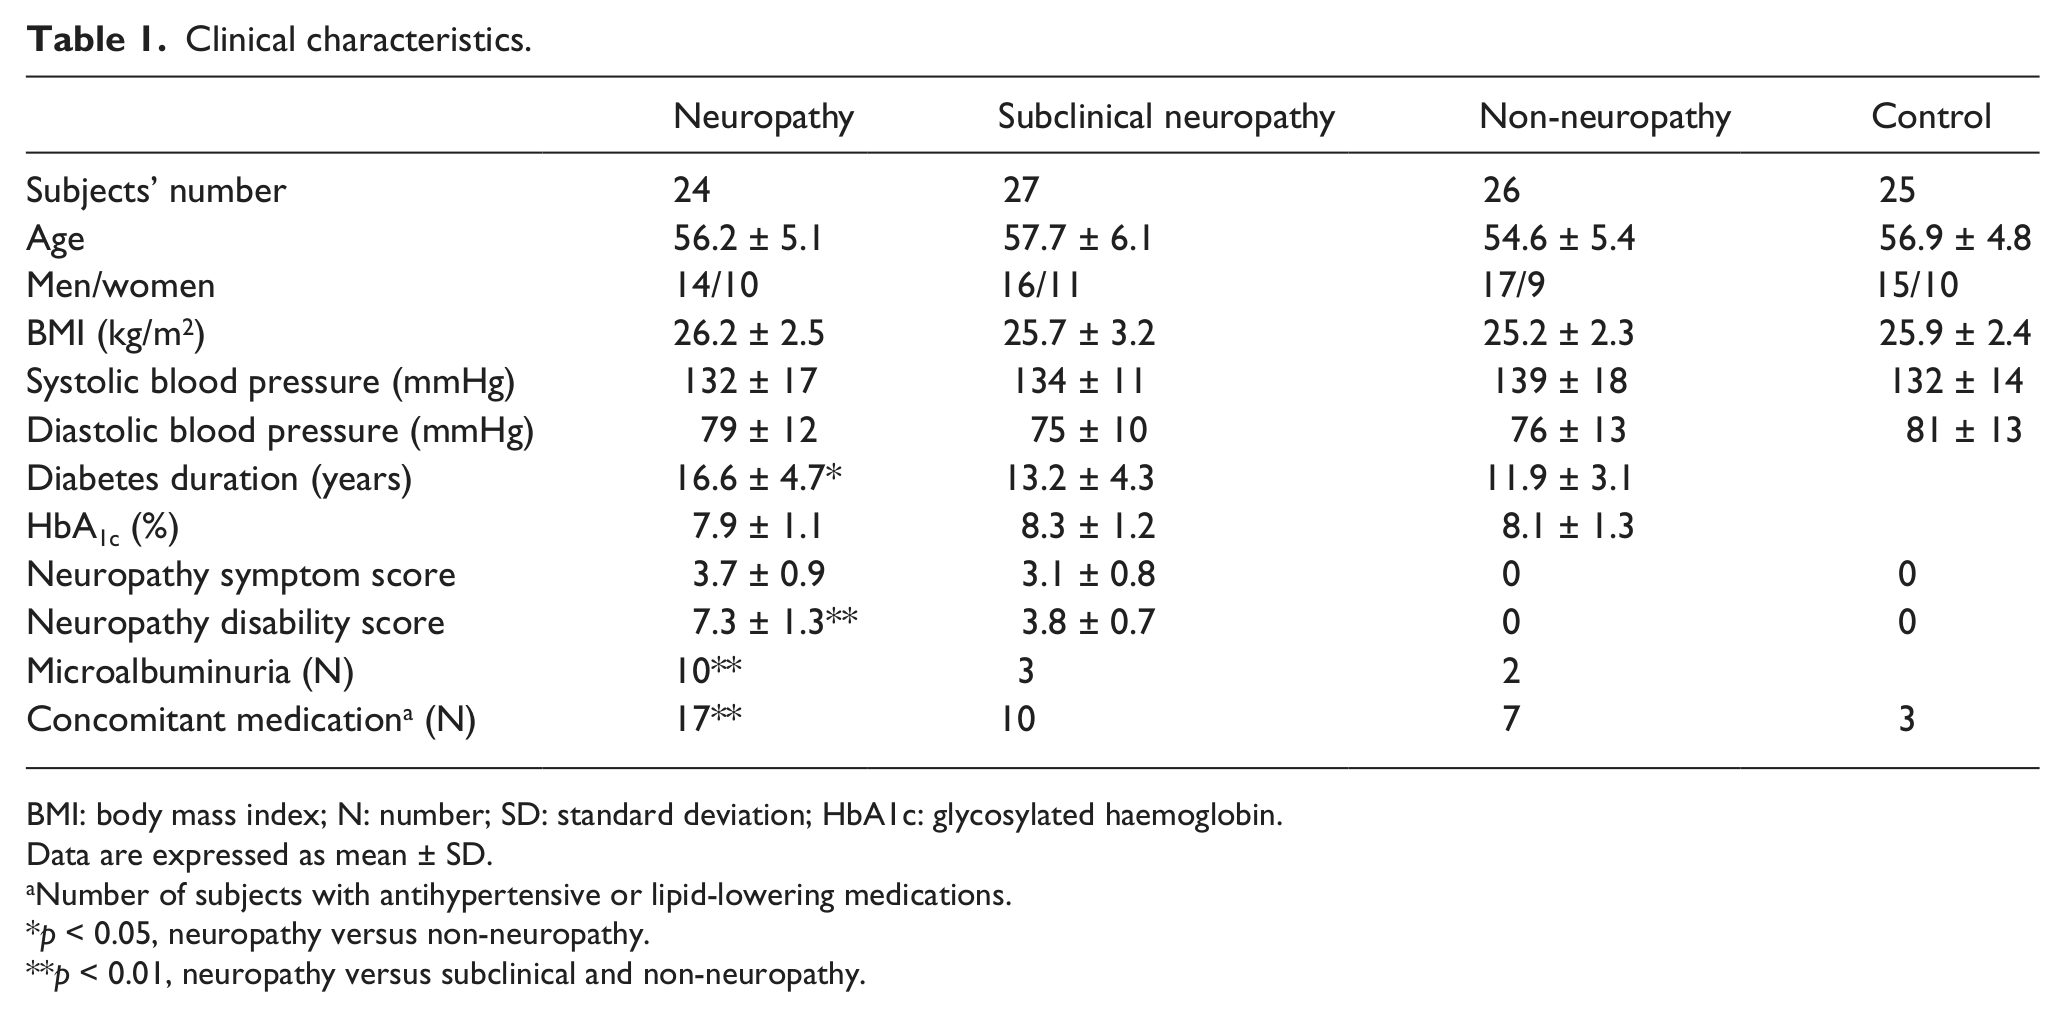
BMI: body mass index; N: number; SD: standard deviation; HbA1c: glycosylated haemoglobin.
Data are expressed as mean ± SD.
Number of subjects with antihypertensive or lipid-lowering medications.
p < 0.05, neuropathy versus non-neuropathy.
p < 0.01, neuropathy versus subclinical and non-neuropathy.
Other aspects of somatic and autonomic nerve functions were studied using nerve conduction and cardiovascular reflex tests. Velocity was determined for the sural sensory and peroneal motor nerve on the non-dominant side. Response amplitude was measured only for the peroneal motor nerve. The systolic blood pressure was recorded at the baseline and then recorded immediately after standing up in the orthostatic test. Heart rate variation was obtained in the patients with 6 deep breaths/ min. The maximum-to-minimum heart rate difference within each respiratory cycle was averaged (beats/min). The tests were standardized and interpreted according to the described methods. 12
The participants were acclimatized for at least 10 min to a constant ambient temperature (25°C ± 1°C) in a supine position. Microvascular skin perfusion was measured at the dorsum of right big toe for 20 min at a sampling rate of 100 Hz using a laser Doppler flowmetry (MSP310XP; Oxford Optronix, Oxford, UK). The laser Doppler flux (LDF) signals were expressed as arbitrary units (AUs) and transformed for subsequent analysis with validated custom-written computer programs. 13 The wavelet transformations of skin perfusion signals yielded a three-dimensional (3D) plot (Figure 1(a)), which connected representation of vasomotor outputs in time and frequency domain. The 3D plot was then projected in two dimensions as averaged over time (Figure 1(b)). The low-frequency interval was divided into three subintervals of 0.0095–0.021, 0.021–0.052 and 0.052–0.145 Hz corresponding to endothelial, neurogenic-related and myogenic-related activities. The absolute spectral amplitudes were averaged within each frequency subinterval. To obtain the relative contribution of a particular spectral subinterval within the full frequency range, the normalized or relative amplitude was defined as the ratio between the sum of spectral amplitudes at a given subinterval and the total spectral amplitudes of the all sampled frequency contents based on the published method. 10
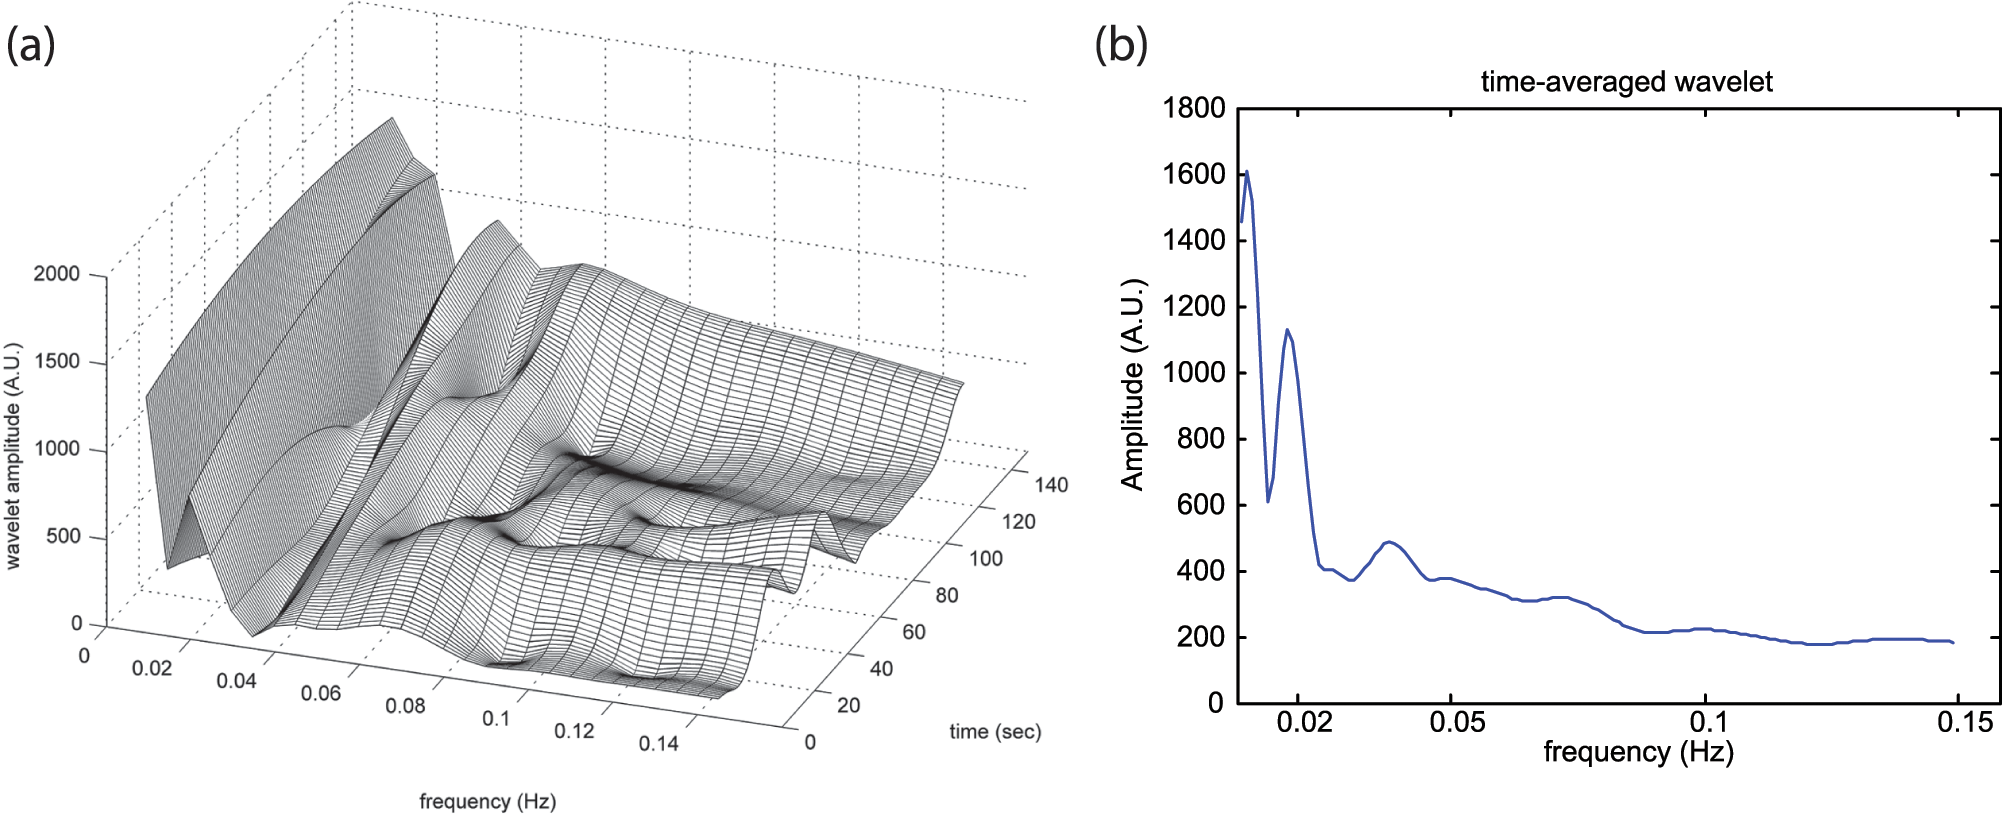
(a) Corresponding vasomotor amplitude as a function of time and frequency and (b) time-averaged wavelet transformation during study period.
SPSS 14.0 for Windows (SPSS, Inc., Chicago, IL) was used for data analysis. The laser Doppler vasomotor outputs were not normally distributed and presented as graphical box plots. The median value was presented as a line inside the box. The upper and lower lines of the box were at the 25th and 75th percentile, while the line extending from each end of the box showed the extent of the rest data. The differences in clinical and nerve function variables were analysed among groups using the one-way analysis of variance (ANOVA) and Scheffe post hoc test. The Kruskal–Wallis test was performed to compare the absolute and normalized amplitudes among four groups. If overall difference was noted, the Mann–Whitney U test with the Bonferroni correction was then used for two groups’ comparison.
Apart from the aforementioned calculations, the three diabetic groups were taken as a whole, and their non-normalized vasomotions were used for subsequent correlation and regression analysis. Linear correlation test was performed to determine the possible relationships between subdivided vasomotor outputs and the somatic and autonomic neuropathy variables. The independent contribution of total and subdivided vasomotor variables was evaluated using multiple logistic regressions after adjusting for duration of diabetes, glycosylated haemoglobin (HbA1c) value and uses of antihypertensive and lipid-lowering medication. The odds ratios (OR) and 95% confidence intervals (CI) were estimated for the presence of peripheral neuropathy according to whether the absolute amplitudes skin vasomotion were above or below the median value of that in the control group. The difference was considered statistically significant when a two-sided p value was less than 0.05.
Results
There were no significant differences in gender composition and body mass index (BMI) among the four groups (Table 1). The clinical neuropathy group had longer duration of diabetes than the other two patients’ groups (p < 0.05). As expected, the neuropathy group had higher NDS than the other groups. Although the groups with diabetes had similar HbA1c and blood pressure control, a higher proportion of neuropathy patients used concomitant antihypertensive or lipid-lowering medications. The prevalence of microalbuminuria (urine albumin-to-creatinine ratio between 30 and 300 mg/g Cr) was elevated in neuropathy group (p < 0.01).
The cardiovascular autonomic and nerve conduction test values were averaged for each group, as shown in Table 2. The heart rate variability during deep breathing did not differ significantly among the three groups with diabetes. The neuropathy group had more fall in systolic blood pressure with posture change than the subclinical and non-neuropathy groups (p < 0.05), but the mean values were all within the normality of the threshold (<25 mmHg). The sensory conduction velocity was clearly reduced in the neuropathy groups, whereas the motor conduction velocity and amplitude were not different from the other groups.
Comparison of cardiovascular autonomic and peripheral nerve functions between groups with diabetes.
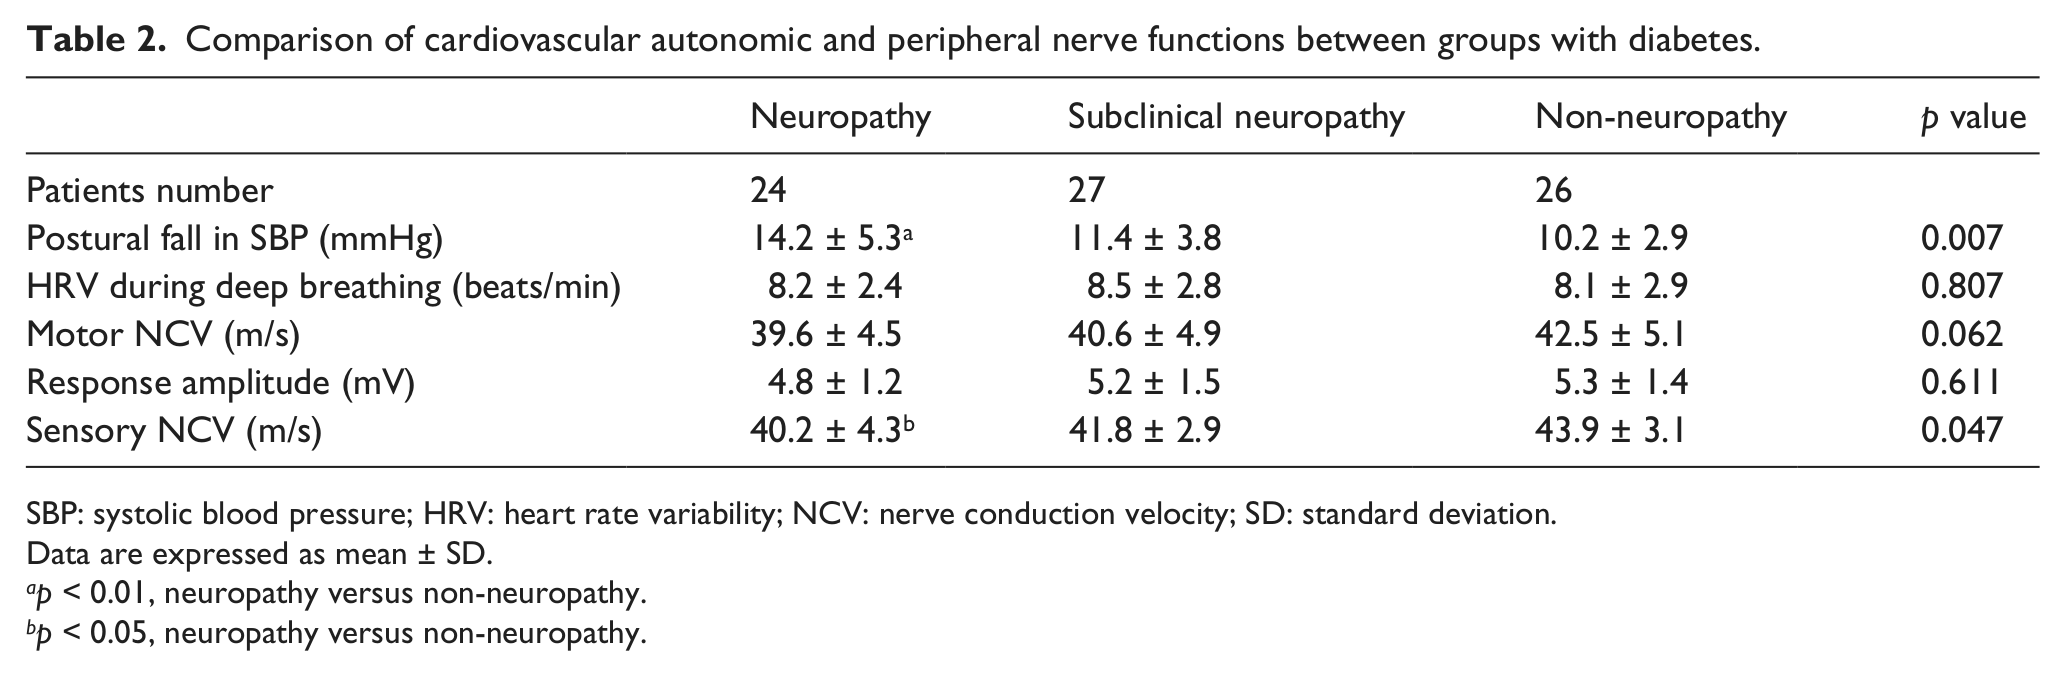
SBP: systolic blood pressure; HRV: heart rate variability; NCV: nerve conduction velocity; SD: standard deviation.
Data are expressed as mean ± SD.
p < 0.01, neuropathy versus non-neuropathy.
p < 0.05, neuropathy versus non-neuropathy.
The average spectral amplitudes of the entire range of 0.0095–0.145 Hz were presented as box plots for each group in Figure 2. The low-frequency flow motion was significantly decreased in clinical neuropathy patients but it did not differ between any other groups. The average spectral amplitudes for the three divided subintervals were presented as clustered box plots for each group in Figure 3. The mean amplitude of the frequency band of 0.0095–0.021 and 0.021–0.052 Hz was considerably lower in the clinical neuropathy group as compared with the other groups (p < 0.01). The corresponding endothelial and neurogenic activities did not differ markedly among the other groups. In terms of the myogenic band (0.052–0.145 Hz), no statistical difference was noted between any studied groups.
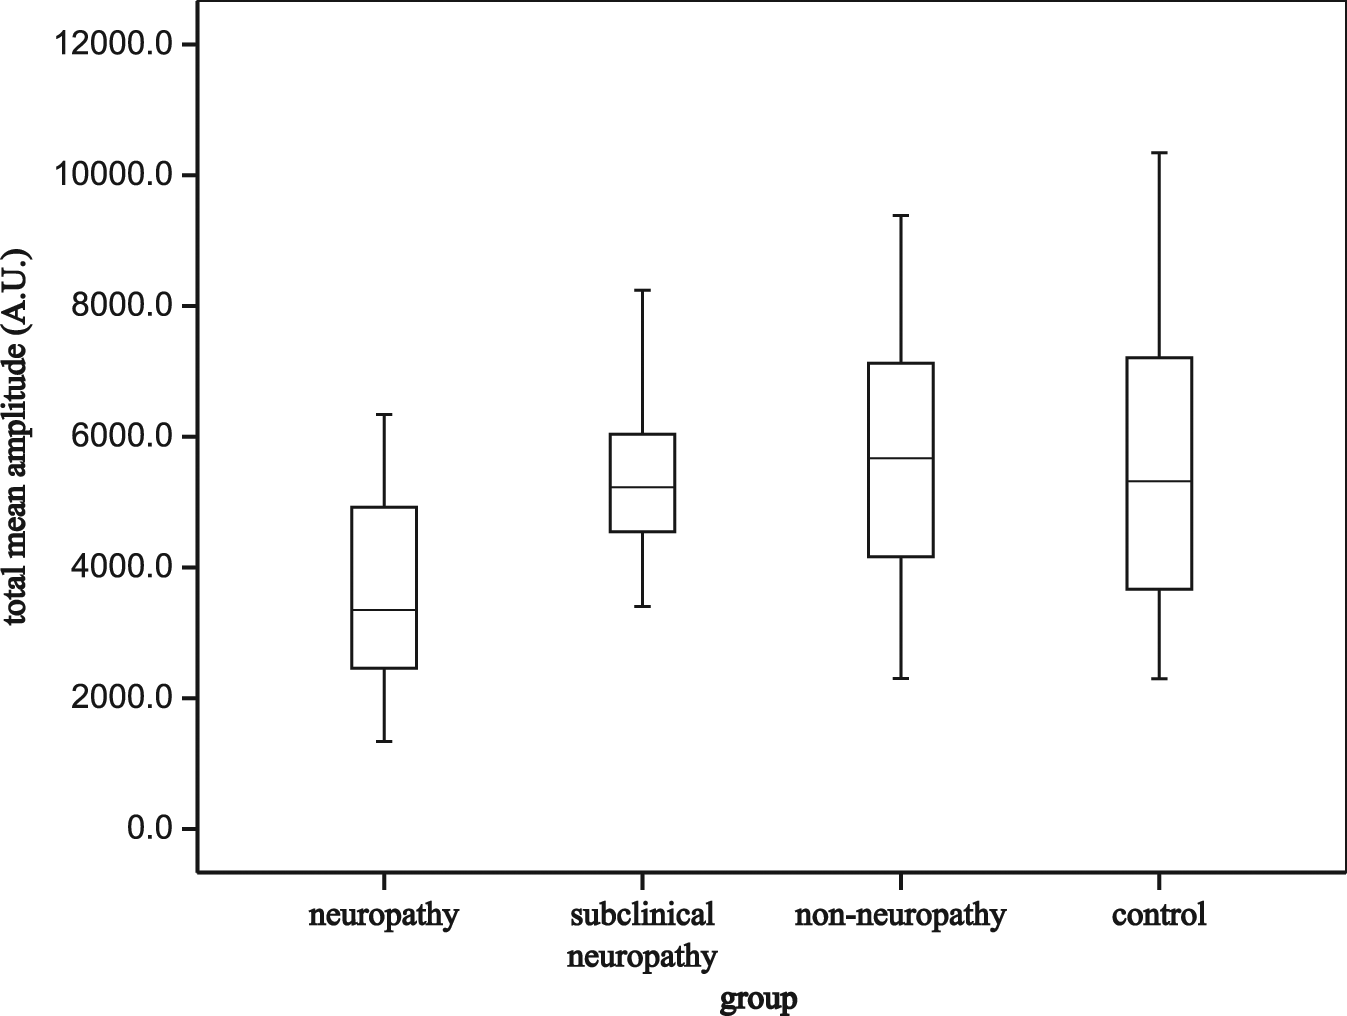
Average spectral amplitudes of the entire frequency range from 0.0095 to 0.145 Hz in each group.
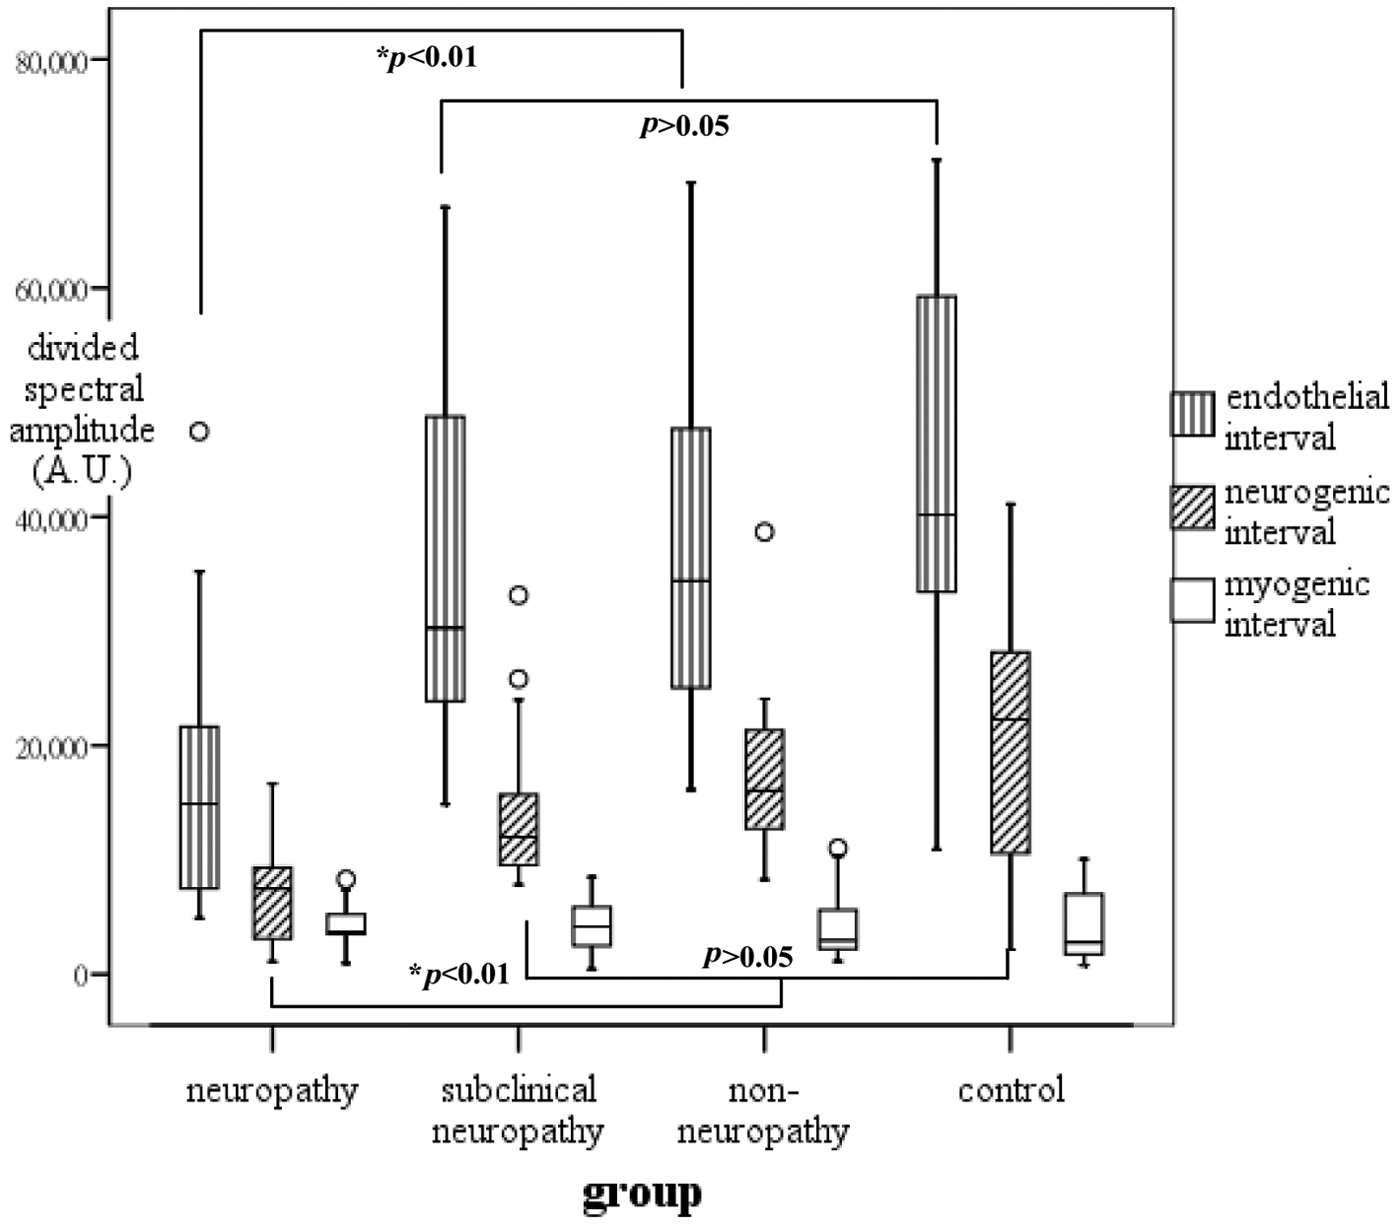
Mean spectral amplitudes of the three divided subintervals in each group.
For further comparison among the frequency subintervals, the spectral amplitude of a subinterval was normalized by the spectral amplitude of the full frequency range. The normalized amplitudes for the three subintervals were shown as clustered box plots for each group in Figure 4. The normalized endothelial activity was significantly decreased in the clinical neuropathy group when compared with the non-neuropathy and control groups (p < 0.05). The subclinical neuropathy group showed a lower neurogenic activity but higher myogenic activity as comparable to the non-neuropathy group (p < 0.05). It should be noted that the significant difference was not present when looking at the absolute frequency spectrum.
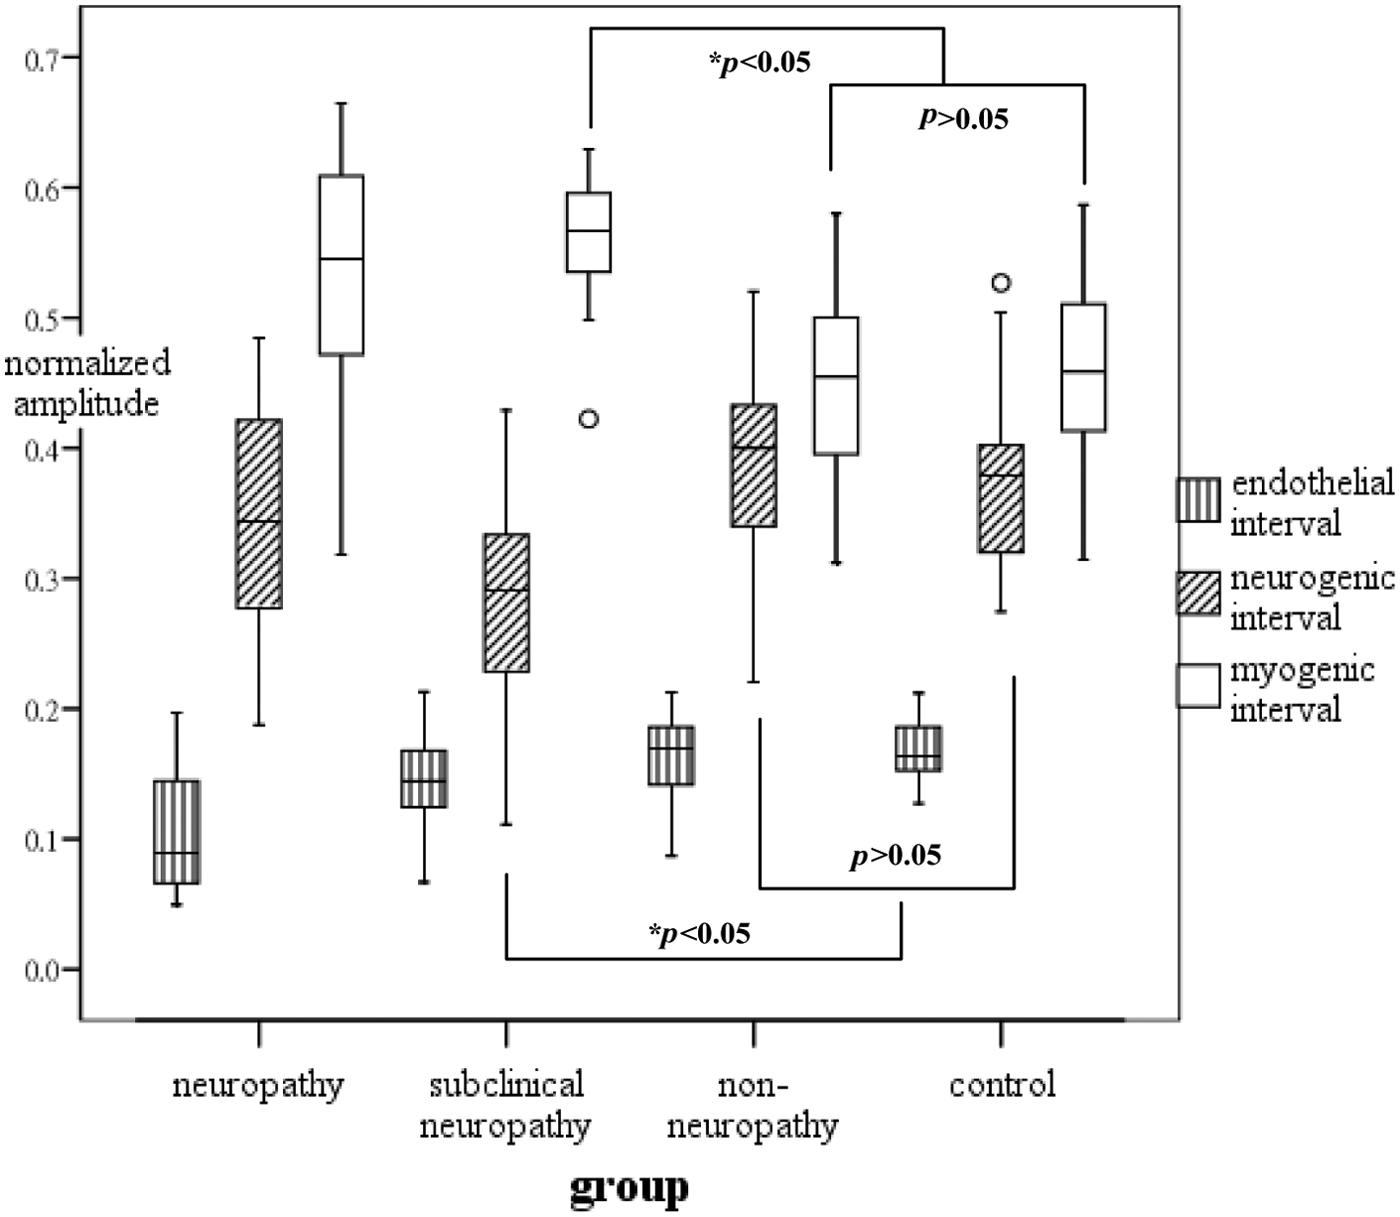
Normalized amplitudes of the three subintervals in each group.
After multivariate adjustment, the subjects with lower half vasomotor responses were more likely to have diabetic neuropathy with an OR = 3.51 (95% CI = 1.19–10.31), p = 0.02. Reduced spectral amplitude in divided subintervals was associated with increased odds of diabetic neuropathy for endothelial [OR = 3.73 (95% CI = 1.02–13.65), p = 0.04] and neurogenic bands [OR = 3.17 (95% CI = 0.99–10.16), p = 0.05]. The myogenic flow motion did not have a significant regression coefficient, but it showed a statistically negative correlation with postural fall in systolic blood pressure (r = −0.32, p < 0.01).
Discussion
Microangiopathy plays a prominent role in the development of diabetes-associated complications in the peripheral nerve, retina and kidney. The skin offers an alternative approach to the microcirculatory changes in patients with diabetes. 14 Previous studies using spectral analysis on laser Doppler skin perfusion documented that the impairment of flow motion was associated with the presence of peripheral neuropathy.6,15 Diabetes affecting the autonomic fibres carried in peripheral nerves could reduce the magnitude of the locally driven vessel diameter changes. This viewpoint may possibly account for impaired vasomotion in clinical neuropathy patients, as shown in this study. In light of such findings, it has been suggested that altered vascular tone leading to insufficient basal tissue perfusion should be noted in neuropathic feet.
This study extended prior observations by dividing the low-frequency spectrum into more refined range of interest. The corresponding smooth muscle responsiveness, perivascular nerve and endothelial activities could be impaired together or separately in diabetes. Our research gave additional insights into the extent of the possible mechanisms involved in disordered microcirculation. The main findings indicated that the changes were characterized by endothelial and neural but not smooth muscle dysfunction. These results were consistent with the human and animal models16,17 that the vascular smooth muscle was relatively resistant to change in the course of diabetic neuropathy.
Skin vasomotor responses, mainly regulated by peripheral sympathetic neurons, may undergo early alteration in patient with diabetes even when they have no obvious sensorimotor neuropathy.18,19 The normalized spectrum indicated that the neurogenic vasomotion was impaired rather than the endothelium-related changes in subclinical neuropathy. The subtle changes in microvascular components could not be discriminated using absolute frequency spectrum. The subclinical neuropathy patients showed a relative decrease of neurogenic activity but increase of myogenic activity than non-neuropathic patients. It was possible that myogenic regulation remained in microvasculature such that the impaired neurogenic reactivity would be compensated in the subclinical feet. That might account for no obvious change in the entire low-frequency oscillation in the early neuropathic stage. These data suggested that there was functional and possibly reversible spectral redistribution that preceded structural skin perfusion changes.
Some previous investigations focused on the neuropathic patients with clinically detectable symptoms and signs.15,20 The current study echoed the earlier reports that the measurements of sensory and motor nerves were not significantly related to cardiovagal functions.21,22 Concomitant autonomic neuropathy should be noted in peripheral microvasculature. It was well known that the microvascular complications of neuropathy, retinopathy and nephropathy were correlated with each other.7,23 Our results notified that selective changes occurred in skin perfusion before overt neurological deficits emerged in patients with diabetes. The microangiopathy manifestations implied a likely more functional than pure structure abnormalities in subclinical neuropathy.
These results revealed that individuals with diabetic peripheral neuropathy had reduced low-frequency vasomotion of both endothelial and neurogenic components. The patients with lower mean spectral activity were three times more likely to have diabetic neuropathy. Disturbed regulation of microvascular blood flow seemed to be implicated in the development of peripheral neuropathy.24,25 Our observations elucidated the possible interaction between the occurrence of diabetic neuropathy and microcirculatory flow motion changes. These associations were independent of other systemic risk factors for diabetes. This study might provide further information about the role of microvascular dysfunction in the development of diabetic neuropathy.
The myogenic responses are capable of modulating vascular tone in response to changes in perfusion pressure. 26 Our observations supported the assumption that vascular smooth muscle could serve to attenuate systemic pressure changes in patients with diabetes. The endothelial and neural activities were impaired in neuropathic feet, yet left myogenic autoregulation intact in cutaneous microcirculation. Insufficient vascular reactivity was likely to develop in overt autonomic neuropathy, leading to symptomatic postural hypotension.13,27 This study found the orthostatic pressure drop to be inversely correlated with myogenic vasomotor activity. The number of subjects in our study was rather limited; thus, it was not sufficiently powered to predict increased risk of severe cardiovascular dysfunction. This might explain the inconsistent findings of regression and correlation analyses in this study.
The limitation of this study was that the analysis of various levels of diabetic neuropathy might not be feasible enough owing to a small sample size in each subgroup. The regression model could not be used to estimate the hazard ratio of severe cardiovascular events. Moreover, our findings demonstrated a less robust but still significant relationship between peripheral neuropathy and subdivided low-frequency vasomotion. The skin perfusion could only be expressed as AUs, and it was difficult to define the threshold level for the normality and to be compared with other relevant reports. This cross-sectional study could not propose the temporal information of the reported associations. Further evaluations are needed to clarify whether these vasomotor changes are also present in organ tissues other than the foot skin.
In conclusion, our research provided some insights into the development of diabetic neuropathy from a microcirculatory viewpoint. This study reported the mutual associations between the presence of diabetic neuropathy and skin vasomotion changes. The endothelial and neurogenic components were impaired, yet left myogenic activity intact in neuropathic feet. There was possibly functional redistribution in the frequency spectrum that preceded structural skin perfusion insufficiency in subclinical neuropathy. The vascular smooth muscle could serve to autoregulate blood pressure changes such that orthostatic hypotension would develop in advanced autonomic neuropathy. Cutaneous microangiopathy could be detected in patients with diabetes even in the absence of systemic cardiovascular dysfunction.
Footnotes
Author’s contributions
Study concept and design: Drs Sun and Wei.
Recruitment of patients and acquisition of data: Drs Sun and Lin.
Analysis and interpretation of data: Drs Sun and Wei.
Draft of the article: Drs Sun and Wei.
Statistical analysis: Dr Chi.
Administrative, technical, or material support: Drs Kuo and Chen.
Conflict of interest
The authors declare that they have no conflicts of interest.
Funding
This research received no specific grant from any funding agency in the public, commercial or not-for-profit sectors.