
Abstract
The rate of adjustment of endothelium-dependent vasorelaxation was examined in the aorta, iliac and femoral arteries of eight control and eight diabetic rats with and without supplementation with vitamin C. Vessels were constricted using 10−5 M phenylephrine (PE) and relaxed with 10−4 M acetylcholine (ACh condition) or 10−4 M ACh plus 10−4 M vitamin C (ACh + vitamin C condition) in a myography system. Vasorelaxation was modelled as a mono-exponential function using a non-linear regression analysis. The adjustment (τ) of vasorelaxation was faster in control (6.6 ± 3.2 s) compared to diabetic rats (8.4 ± 3.4 s) (p < 0.05). The time-to-steady-state tended to be shorter in control (32.0 ± 13.9 s) compared to diabetic rats (38.0 ± 15.0 s) (p = 0.1). ACh + vitamin C did not speed the vasorelaxation response. The τ for vasorelaxation was shorter in the femoral (6.5 ± 2.7 s) and iliac (6.8 ± 2.5 s) compared to the aorta (9.2 ± 4.2 s) (p < 0.05). The rate of vasorelaxation was greater in the femoral (3.2 ± 1.4%·s−1) compared to the iliac (2.0 ± 1.0%·s−1) and aorta (1.1 ± 0.4%·s−1) in both groups and in the iliac compared to the aorta (p < 0.05) in the control group. In conclusion, the vasorelaxation response was vessel specific with a slower rate of adjustment in diabetic compared to control animals.
Keywords
Introduction
Diabetes mellitus is associated with vascular complications and premature microvascular disease.1–3 By synthesizing and releasing vasoactive substances, the endothelium plays a critical role in maintaining vascular tone and function.4–6 Nitric oxide (NO), the main endothelium-derived relaxing factor, is produced in the endothelial cells through the activation of endothelial NO synthase (eNOS) and freely diffuses into the vascular smooth muscle resulting in vasorelaxation. Type 1 diabetes is associated with chronic hyperglycaemia, 7 which, through different mechanisms, results in increased oxidative stress7–10 and has been related to endothelial dysfunction and reduced NO bioavailability. As such, diabetic populations are likely to have impaired vascular responsiveness and thus reduced or inadequate distribution of blood flow to the tissues.
Typically, the differences in vascular responsiveness between conditions are measured as dose-response changes in absolute and percent vasorelaxation.3,11–13 Although this approach permits examination of the amplitude of the response to different concentrations of a given substance, the dynamic component of the adjustment is neglected. While great advancements in the determination of mechanisms affecting vasomotor function in diabetic populations have been made, the effects of diabetes on the dynamic adjustment of arteries supplying blood to the organs remain to be studied. Additionally, although some investigations have isolated the responses in different types of vessels, 14 there has been a prevalent use of the thoracic aorta in the literature using in vitro experimental set-ups. However, the smaller arteries and arterioles generally have greater vasorelaxation ability than larger ones and, in fact, the aorta does not vasodilate significantly in vivo 15 and may indeed have a slower rate of adjustment compared to more distal arteries.
Hence, the main goals of this study were (1) to determine the rate of adjustment of the endothelium-dependent vasorelaxation response in diabetic and control animals and (2) to compare the endothelium-dependent rate of adjustment in different arteries throughout the vascular tree: aorta, iliac and femoral. A secondary goal of the study was to determine the effects of adding antioxidants (vitamin C) to the experimental preparation on the responsiveness of the vessels. We hypothesized that (1) diabetic rats would display a slower rate of vasorelaxation in response to the endothelium-dependent vasodilator acetylcholine (ACh) compared to control rats and (2) the aorta would show a slower responsiveness compared to the iliac and femoral arteries.
Methods
Animal characteristics
This study was approved by the University of Western Ontario Council on Animal Care and was performed in accordance with the guidelines of the Canadian Council on Animal Care. Sixteen male 8-week-old Sprague Dawley rats were obtained from Charles River Laboratories (St. Constant, QC, Canada) and housed in standard rat cages with a 12:12-h light–dark cycle at a constant temperature (20°C ± 1°C) and relative humidity (50%). Food and water were provided ad libitum.
Experimental protocol
Rats were randomly assigned to a control (n = 8) or diabetic (n = 8) group. Type 1 diabetes mellitus was induced by administering 20 mg·kg−1 of streptozotocin (STZ) via intraperitoneal (IP) injection on five consecutive days. This method was used because it more closely mimics the development of type 1 diabetes mellitus than a single-dose injection of STZ. 16 Diabetes was confirmed by measuring two blood glucose concentrations on consecutive days of greater than 18 mmol·L−1. If diabetes confirmation was not obtained following five injections, the animals were given subsequent 20 mg·kg−1 STZ-IP injections until two readings of 18 mmol·L−1 were obtained. Following the confirmation of diabetes, one insulin pellet (LinShin, LinPlant; LinShin Canada Inc., Toronto, ON, Canada) was implanted subcutaneously above the abdomen. Insulin pellet dosages were then monitored for 1 week and adjusted to obtain daily non-fasting blood glucose concentrations in the range of 9–15 mmol·L−1 in order to mimic poorly controlled type 1 diabetic patients using a constant dose of insulin and to alleviate the dramatic weight loss and considerable organ damage observed in STZ alone animals.16,17 Animals were maintained for an additional 6 weeks prior to killing.
Vessels collection
Rats were anaesthetized via an IP injection of 65 mg·kg−1 pentobarbital sodium and were killed via heart excision. The aorta, iliac and femoral arteries were rapidly excised and placed into ice-cold modified Krebs–Henseleit buffer (118.1 mM NaCl, 4.7 mM KCl, 1.5 mM CaCl2, 1.2 mM KH2PO4, 1.2 mM MgSO4, 11.1 mM
In vitro isometric tension analysis
Each vessel ring was mounted onto a GlobalTown Microtech EZ-bath system (GlobalTown Microtech Inc., Sarasota, FL, USA) and placed in 5 mL of modified Krebs–Henseleit buffer (37°C) continuously aerated with 95% O2 and 5% CO2. Initial ring tension was manually adjusted to approximately 2 g in the aorta, 1.5 g in the iliac and 1.0 g in the femoral artery. These values were derived from pilot testing in our laboratory to determine optimal baseline tensions for each vessel section. The rings were allowed to equilibrate at these tensions for approximately 40 min. Fresh buffer (5 mL) was added to organ baths at the end of the equilibration period. Isometric contractions and relaxations were continuously measured using PowerLab (ML856 26T; ADInstruments, Colorado Springs, CO, USA). Data were recorded using LabChart v7.0 (ADInstruments) at a sampling rate of 1000 Hz. The vessels were pre-constricted with 10−5 M phenylephrine (PE). Once a steady-state level of constriction was observed, vasorelaxation of the vessels were examined using a single dose of 10−4 M ACh (ACh condition) or 10−4 M ACh plus 10−4 M vitamin C (ACh + vitamin C condition). For the ACh + vitamin C condition, vitamin C was added to the organ bath simultaneously with ACh. The order of vasorelaxation responses to each condition was randomly assigned. Following these experiments, the vessels were exposed to a single dose of 10−5 M of the NOS inhibitor NG-nitro-
Data analysis
The on-transient vasorelaxation responses were modelled using the following equation

where Y(t) represents the tension (g) at any given time (t); Ybsln is the steady-state baseline value of Y before a decrease in the tension as a consequence of the vasorelaxation; A is the amplitude of the decrease in Y below Ybsln; τ (time constant of the response) represents the time required to attain 63% of the steady-state amplitude and TD represents the mathematically generated time delay through which the exponential model is predicted to intersect Ybsln. Vasorelaxation responses were modelled to ~2 min because the relaxant effects of ACh are known to be transient in nature due to the chemical instability of endothelium-derived relaxing factors. 18 The model parameters were estimated by the least squares non-linear regression analysis (Origin; OriginLab Corporation, Northampton, MA, USA) in which the best fit was defined by minimization of the residual sum of squares and minimal variation of residuals around the y-axis (Y = 0). The 95% confidence interval (CI95) for the estimated time constant was determined after preliminary fit of the data with Ybsln, A and TD constrained to the best-fit values and the τ allowed to vary. The calculated time delay (CTD) for the vasorelaxation response was determined using second-by-second data and corresponded to the time, after ACh infusion, at which the signal began to systematically decrease from its steady-state constriction value. While the effective time of the vasorelaxation response (τ′) was represented by the CTD + τ, the time-to-steady-state represented the CTD + 4τ (with 4τ being ~98% of the total adjustment). Baseline constriction values were computed as the mean value in the 30 s prior to a transition.
Statistics
Data are presented as means ± standard deviation (SD). A three-way repeated-measures analysis of variance (ANOVA) was used to determine statistical significance for the dependent variables. The ANOVA model was described as G2 × C2 × V3, such that groups (G; diabetic and control) are crossed with condition (C; ACh and ACh + vitamin C) and vessels (V; aorta, iliac and femoral). A Tukey post hoc analysis was used when significant differences were found for the main effects of each dependent variable. The ANOVA was analysed by SPSS Version 15.0 (SPSS Inc., Chicago, IL, USA). Statistical significance was declared when p < 0.05.
Results
Kinetics parameters for the vasorelaxation response for each vessel in diabetic and control rats are presented in Table 1 and Figure 1(a) to (c). Figure 2(a) to (c) displays a representative fit for each vessel. The overall rate of adjustment (τ) of the vasorelaxation response was significantly faster in control (6.6 ± 3.2 s) compared to diabetic rats (8.4 ± 3.4 s) (p < 0.05). There was a trend towards a group by vessel interaction (p = 0.1), suggesting similar τ values for the femoral in the control and diabetic condition. The CTD (control, 5.5 ± 1.9 s; diabetic, 4.5 ± 2.4 s) and the τ′ (control, 12.1 ± 4.5 s; diabetic, 12.9 ± 5.0 s) for the vasorelaxation response remained the same in both groups. The time-to-steady-state tended to be shorter in control (32.0 ± 13.9 s) compared to diabetic (38.0 ± 15.0 s) but did not reach statistical significance (p = 0.1). ACh + vitamin C did not produce any different vasorelaxation response compared to ACh alone (p > 0.05).
Vasorelaxation kinetics parameters and rate of vasorelaxation in the femoral, iliac and aorta in diabetic and control animals.
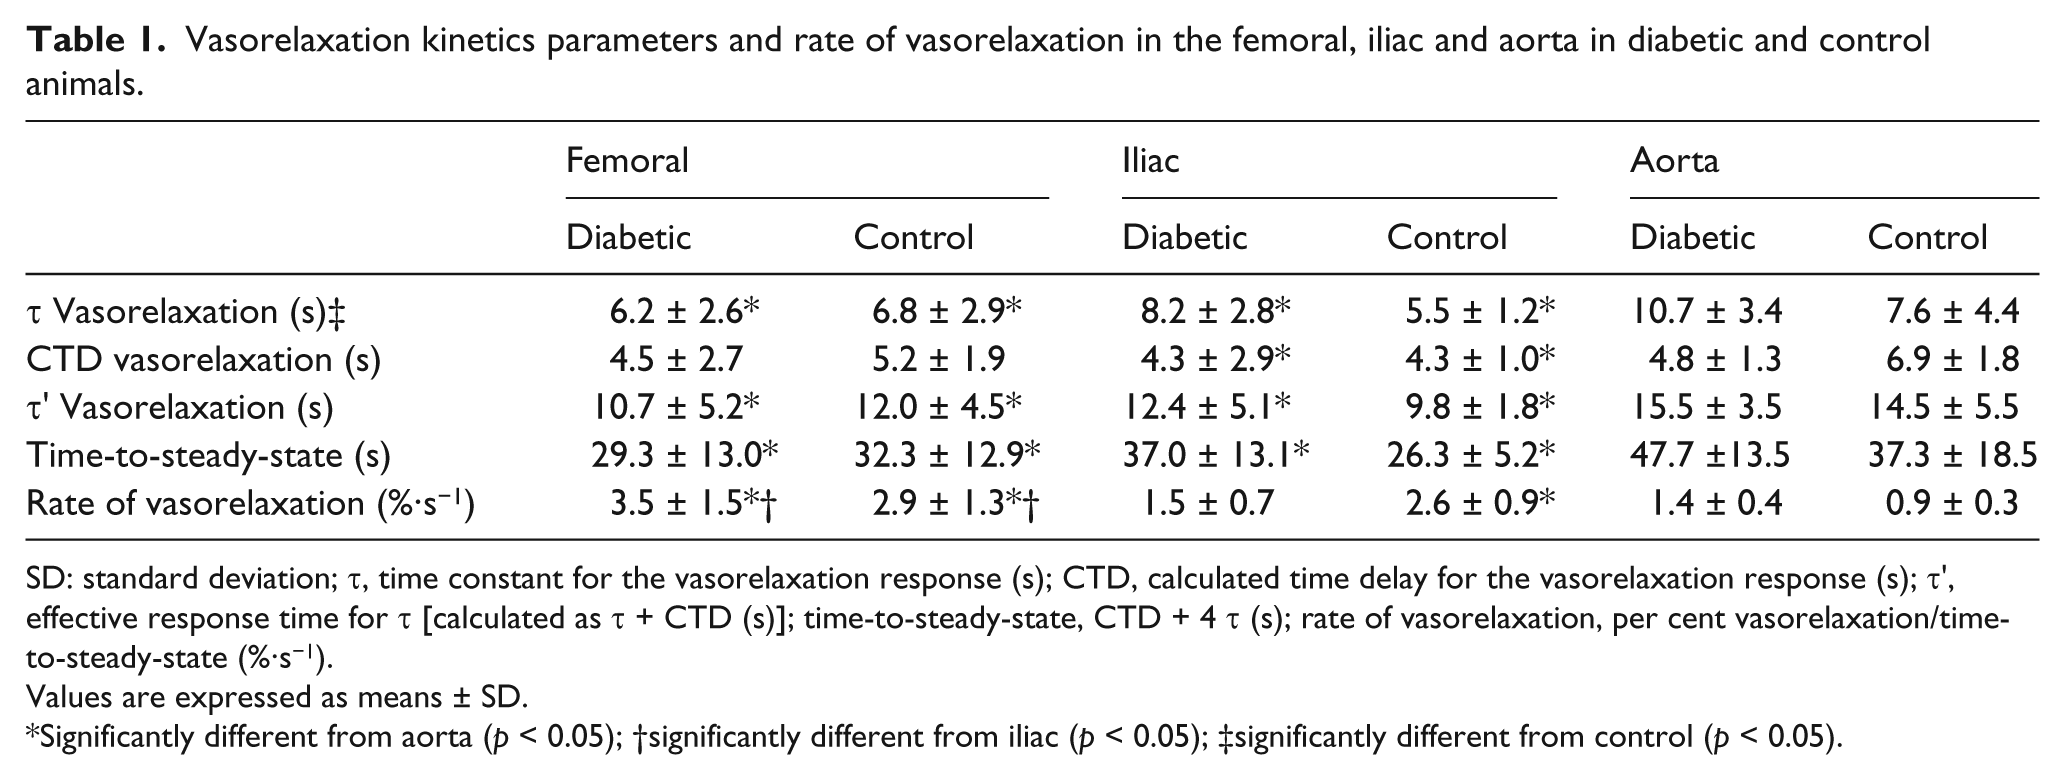
SD: standard deviation; τ, time constant for the vasorelaxation response (s); CTD, calculated time delay for the vasorelaxation response (s); τ′, effective response time for τ [calculated as t + CTD (s)]; time-to-steady-state, CTD + 4 τ (s); rate of vasorelaxation, per cent vasorelaxation/time-to-steady-state (%·s−1).
Values are expressed as means ± SD.
Significantly different from aorta (p < 0.05); †significantly different from iliac (p < 0.05); ‡significantly different from control (p < 0.05).
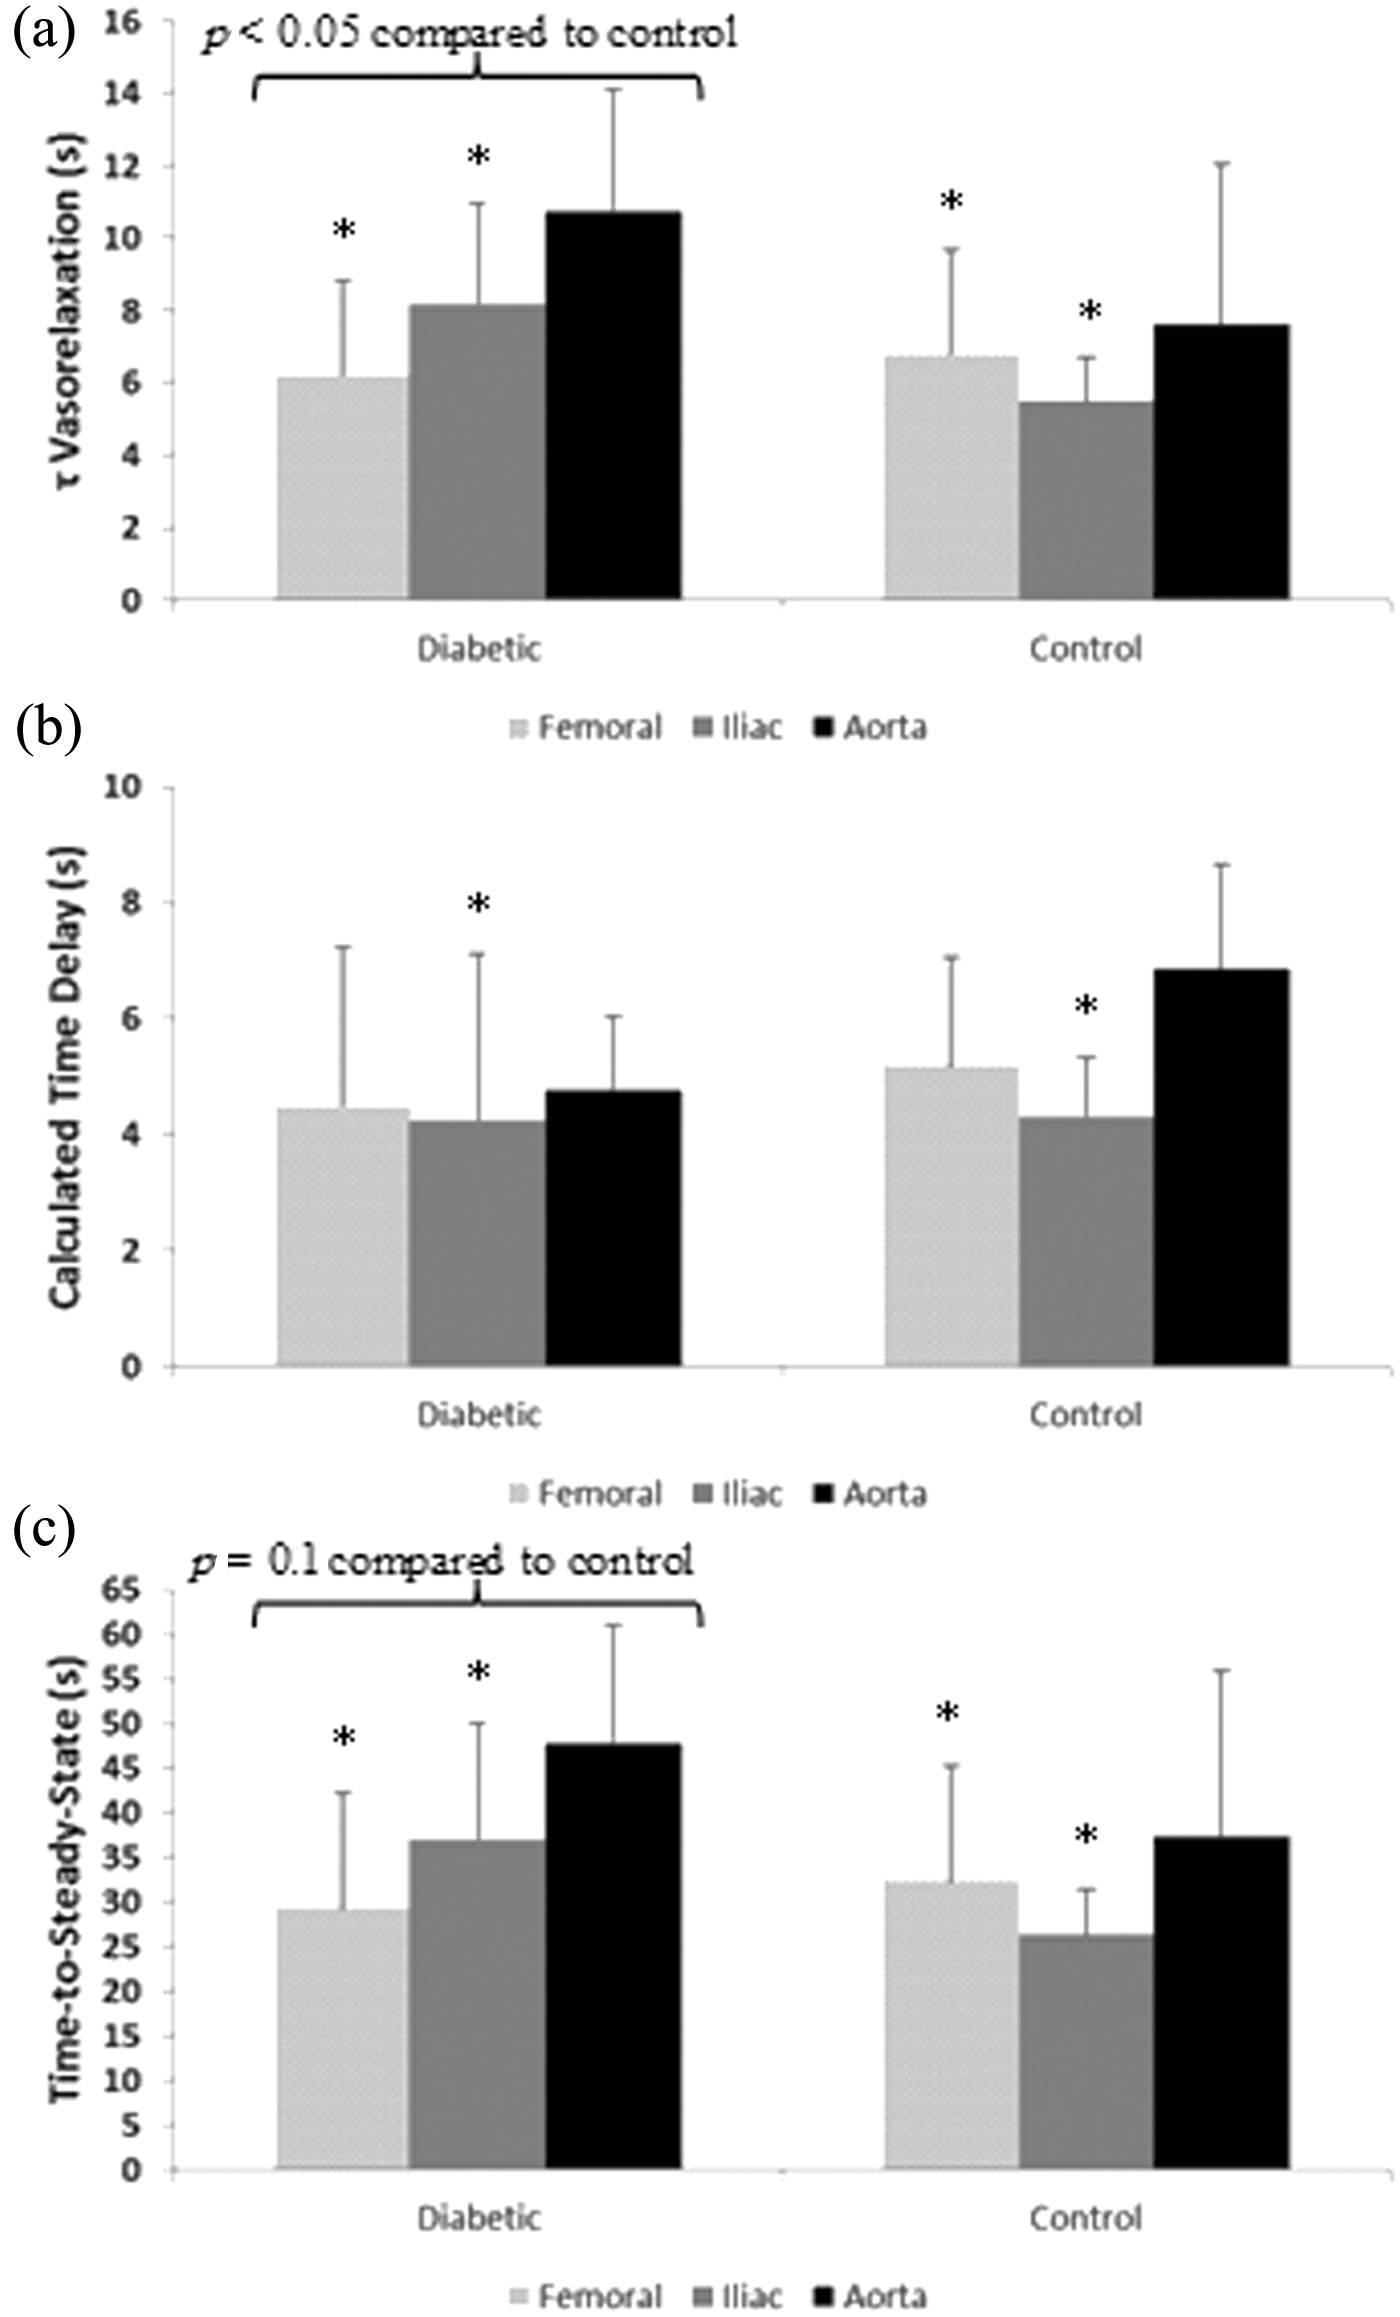
(a) Time constant, (b) calculated time delay and (c) time-to-steady-state of the response for each vessel in diabetic and control animals.
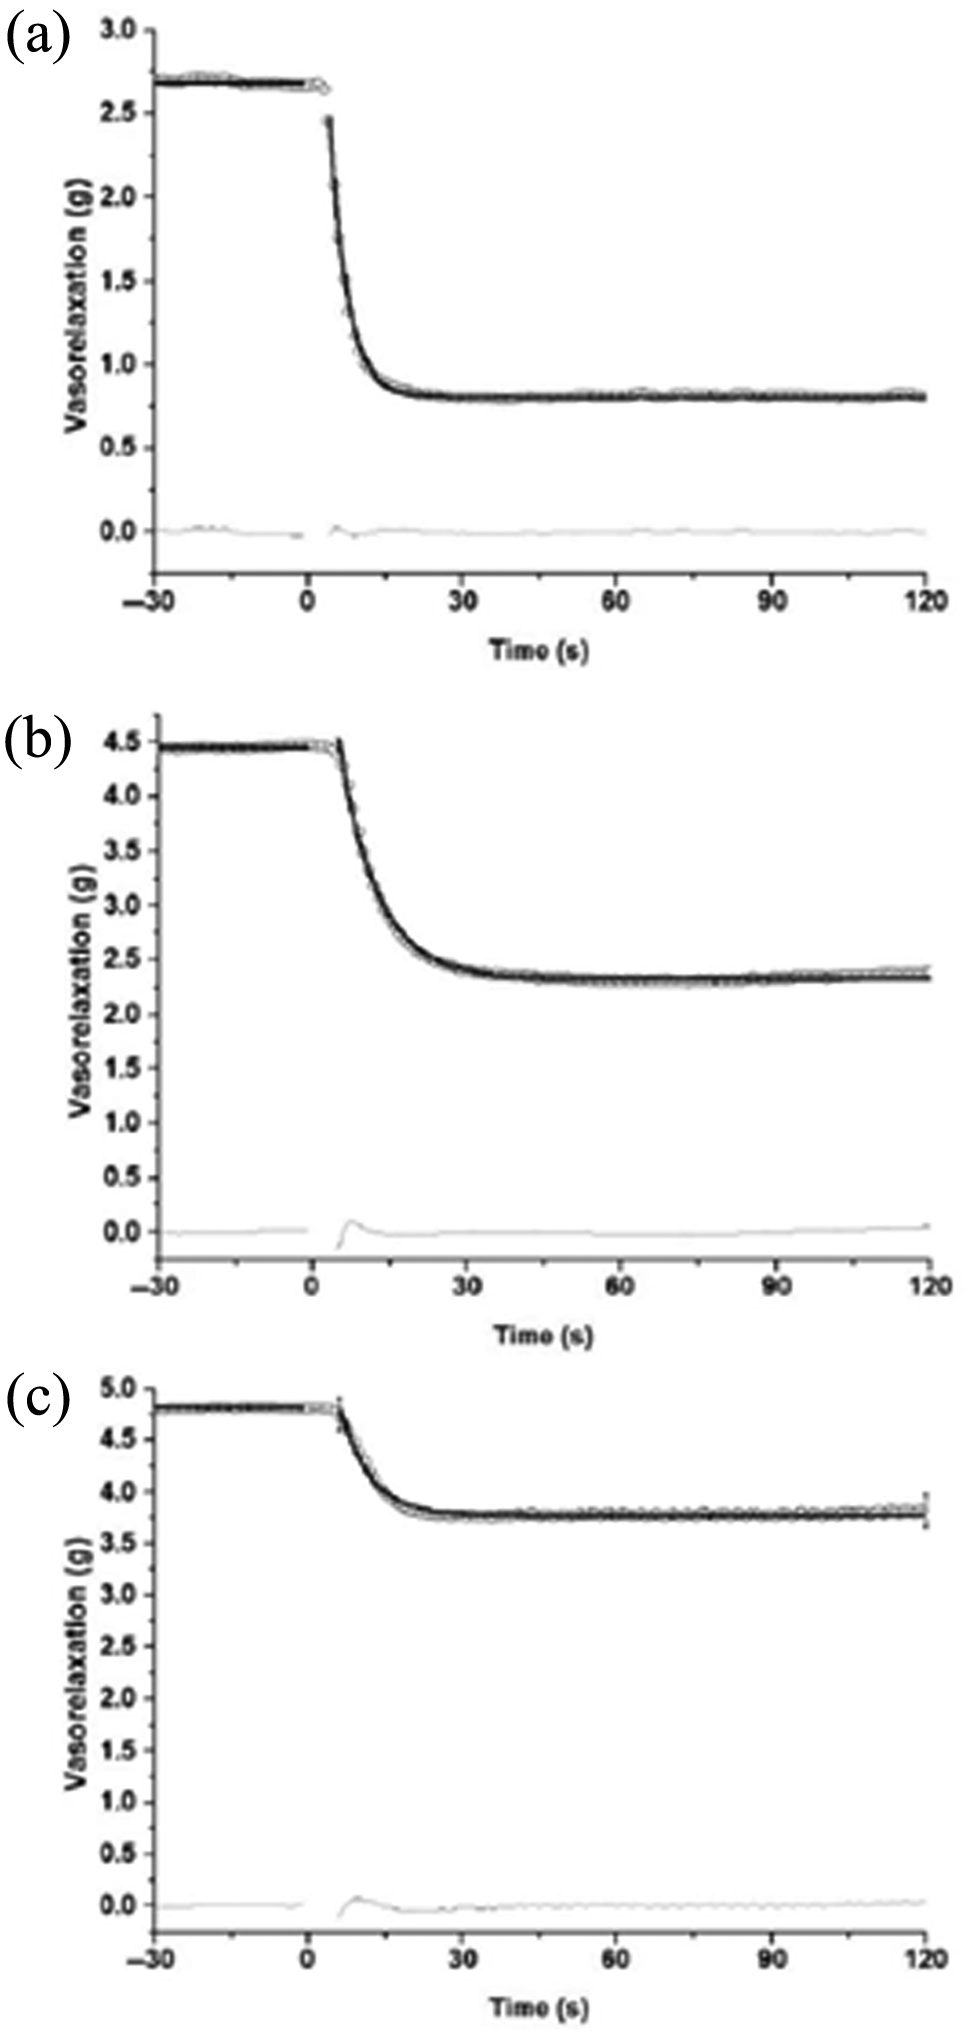
Representative model fits for (a) femoral, (b) iliac and (c) aorta.
Kinetics analysis by vessel type revealed a smaller τ and τ′ and a shorter time-to-steady-state for vasorelaxation responses in the femoral and iliac compared to the aorta (Table 1; Figure 1(a) and (c)) (p < 0.05). The CTD of the response was only shorter in the iliac compared to the aorta (Table 1; Figure 1(b)) (p < 0.05). There was no vessel type by group interactions indicating that the responses observed were consistent in both groups (control and diabetic).
The rate of vasorelaxation [calculated as the per cent change in vasorelaxation divided by the time-to-steady-state (%·s−1)] was significantly greater in the femoral compared to the iliac and aorta and in the iliac compared to the aorta in the control group, and it was significantly greater in the femoral compared to the iliac and aorta but not in the iliac compared to the aorta (vessel type by group interaction) in the diabetic group (Table 1; Figure 3) (p < 0.05).
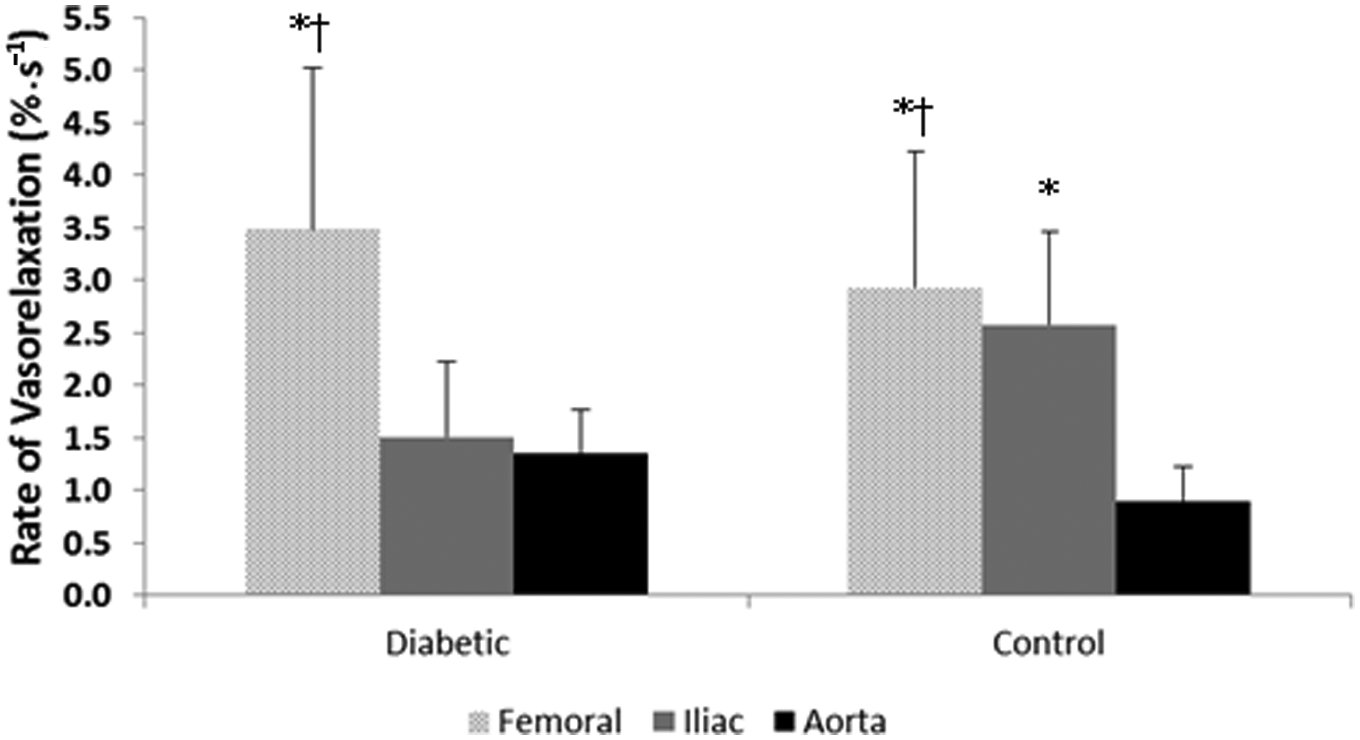
Rate of vasorelaxation for each vessel in diabetic and control animals.
Vasorelaxation response to ACh was abolished in the presence of
Discussion
This study examined the rate of adjustment of the endothelium-dependent vasorelaxation responses in different arteries throughout the vascular tree in diabetic and control animals. The main findings were that (1) the rate of vasorelaxation (as represented by a smaller τ and a trend towards a shorter time-to-steady-state plus a group by vessel interaction in the iliac artery) was slower in diabetic compared to control animals and (2) the vasorelaxation response was vessel specific with the aorta displaying the slowest adjustment and the femoral showing the fastest rate of vasorelaxation.
The most important outcome from this study was that the vasorelaxation response to the same concentration of ACh was faster in the femoral and iliac arteries compared to the aorta artery and that the rate of vasorelaxation was progressively slower from the femoral to the aorta in the control group, and it was slower in the iliac and the aorta compared to the femoral in the diabetic group. This is an important finding because the majority of studies employing similar vessel myography techniques have used the aorta in their preparations, probably because of its ease to use. However, it has been proposed that the aorta may relax only marginally compared to more distal arteries. 15 Indeed, not only do our data support the contention that more distal vessels behave distinctively compared to larger conduit arteries but also complements a previous study from Behnke and Delp 19 looking at the rate of responsiveness in arterioles from old and young rats. In that study, they found τ values for vasodilation in response to ACh ranging from ~1.5 s (young rats) to ~4 s (old rats). More specifically, Roseguini et al. 20 showed that proximal arterioles (1As) responded at a slower rate compared to the more distal ones (3As), such that τ values of ~6 and ~4 s for the vasodilatory response to ACh were observed for the 1A and 3A arterioles, respectively. In this study, overall τ values of ~6, ~7 and ~9 s were observed for the vasorelaxation response of femoral, iliac and aorta, respectively. Although the arterioles are primarily responsible for controlling and distributing blood flow within the organs and thus a faster vascular responsiveness is to be expected in these vessels, it is interesting that more distal conduit arteries (in this case, the femoral feeding the hindlimb muscles and the iliac diverting blood flow to the lower limbs) are significantly more responsive than the aorta.
The lack of a vasorelaxation response to ACh in the presence of
In regard to the variations in vascular responsiveness observed in conduit arteries located in different segments of the vascular tree, a novel aspect of this study is the kinetics analysis employed for examining the rate of adjustment of each vessel in response to a given dose of ACh. Previous studies have measured vascular responsiveness as dose-response changes in absolute and percent vasorelaxation.11–13 While this approach offers valuable information for quantifying changes in the amplitude of the vascular response to different concentrations of a given substance, the dynamic component of the adjustment is disregarded. Although one previous study focussed on the dynamic adjustments of arterioles, 19 to our understanding, we are the first to calculate the vasodilatory rate of adjustment of different vessels using this myography technique. This approach provides important information in the time domain of the response without neglecting the amplitude component of the adjustment.
Previous studies have demonstrated that vasorelaxation responses are impaired in diabetic populations.3,22,23 Although different mechanisms might affect vascular responsiveness in this group, increased oxidative stress has been postulated to have potential detrimental effects7,24 that could be reversed with treatment with the antioxidant vitamin C.8–10 In this study, vitamin C had no significant effects in the rate of adjustment of the vasorelaxation response. However, these data should be interpreted with caution. First, it could be argued that in order for vitamin C to have a scavenger effect on free radicals in the present in vitro conditions, this antioxidant should be added to the organ bath before and not simultaneously with ACh as proposed elsewhere.12,13 Even so, based on our preliminary tests, concern was present in regard to the effects of adding vitamin C alone on the ‘stability’ of the pre-constriction tension and its effects on the kinetics analysis of vasorelaxation. Considering this limitation, a more comprehensive experiment should include a group of diabetic rats treated with vitamin C prior to isolation of the vessels for the in vitro experimentation. Additionally, since some data suggest that rats are naturally able to convert glucose to vitamin C, 25 then its bioavailability may have been already high in the diabetic group making the addition of this antioxidant superfluous under the present conditions. Finally, the use of exogenous insulin supplementation to mimic a ‘poorly controlled’ diabetic condition in addition to the short length of hyperglycaemia may have prevented a dramatic increase in oxidative stress from occurring.
Another important finding is that the diabetic group exhibited an overall slower rate of vasorelaxation compared to their control counterpart. Although no direct data from the present study can further our mechanistic interpretations for a somewhat slower rate of vasorelaxation in the diabetic animals, some potential mechanisms could be speculated. As suggested by Johnstone et al., 3 defective signal transduction could be explained by decreased expression of G proteins 26 or increased activation of protein kinase C. 27 Additionally, factors like advanced glycation end products could quench NO bioavailability and result in reduced endothelium-dependent vasodilation. 28 Also, greater vasoconstrictor responsiveness has been shown in the diabetic condition. It has been indicated that endothelial generation and release of vasoconstrictor prostanoids in the diabetic condition likely attenuates endothelium-dependent relaxation. 29 Nevertheless, independent of what mechanism actually explains this reduced responsiveness in the diabetic rats, what is important is that the diabetic group in this study showed a slower rate of vasorelaxation. This depressed responsiveness in the dynamic adjustment of the vessels in conjunction with the observed vessel-specific rate of vasorelaxation and the reduced amplitude in vasorelaxation reported by others30,31 may negatively affect blood flow distribution to the tissues and thus have detrimental consequences from a clinical point of view. For instance, it has been proposed that insulin and contraction may have similar biological effects in skeletal muscle, as both can act to increase (albeit through different signalling pathways) glucose uptake and glycogen synthesis. 32 In such a scenario, impaired blood flow distribution (as shown by a slower responsiveness and the decreased rate of vasorelaxation in the diabetic condition) could result in insufficient provision of nutrients such as glucose and oxygen to active tissues and thus metabolic disturbance in diabetic patients. As a consequence, the ability to perform exercise or even activities of daily living could be compromised in diabetic populations.
Finally, it is worth noting that, albeit not significant, there was a trend towards a group by vessel interaction that would suggest that the femoral vessels were less likely to be affected by diabetes in the present model. These data in conjunction with the improved rate of vasorelaxation observed in the femoral and iliac vessels in the control group but only in the femoral in the diabetic group could indicate that the progression of the diabetes-related constraint in vasorelaxation responses observed in the vessels starts more centrally and then it progresses towards the periphery. In this regard, Edgell et al. 33 showed that in patients with metabolic syndrome (including type 2 diabetic patients), the functional detriments associated with the disease followed a central-to-periphery vascular trajectory. Nevertheless, more studies are warranted to resolve this issue.
In conclusion, this study presented novel data demonstrating a vessel-type dependent rate of vasorelaxation in response to ACh. The faster responsiveness observed in the femoral and iliac compared to the aorta suggests that the dynamic properties of each vessels should be taken into consideration when examining vascular responsiveness. Additionally, this study showed that there is not only a dose-response limitation but also a dynamic response (rate of adjustment) limitation in the responsiveness of vessels in diabetic rats compared to control rats.
Footnotes
Acknowledgements
We would like to express our gratitude to Kenneth N. Grise for his contribution with animal care and data collection.
Funding
This study was supported by the Canadian Institutes of Health Research (CIHR – #CCT – 83029). Juan M. Murias was supported by a post-doctoral fellowship from the Ontario Ministry of Research and Innovation.
Conflict of interest
The authors declare that there is no conflict of interest.