
Abstract
Weight loss after bariatric surgery reduces cardiac risk and morbidity. We examined weight loss effects on arterial stiffness in morbidly obese subjects, in relation to cytokines, circulating and subcutaneous adipose tissue (SAT) and visceral adipose tissue (VAT)-based immune cells and gene expression. Obese subjects with type 2 diabetes mellitus (T2D) or impaired glucose tolerance (n = 14, mean ± SEM body mass index 42.9 kg/m2) underwent 24 weeks’ caloric restriction, with gastric banding at 12 weeks. Measures were: arterial augmentation index (AIx), insulin resistance, circulating cytokines, immune cell activation markers, and SAT and VAT cytokine gene expression. Weight loss reduced AIx by 20% (p = 0.007), with falls in s-selectin (p = 0.001) and inter-cellular adhesion molecule (p = 0.04). Improved AIx related to reduced surface expression of the interleukin (IL)-2 receptor on T-lymphocytes (TL-IL2R) and granulocyte adhesion markers (r = 0.59, 0.64, respectively, p < 0.04). Higher VAT expression of interferon-γ and monocyte chemoattractant protein-1 associated with a blunted AIx response. A model of TL-IL2R expression, waist, weight and insulin resistance explained 73% of the variance in AIx reduction (p = 0.005). In morbidly obese dysglycaemic subjects, modest weight loss reduces arterial stiffness, the magnitude of which relates to improved markers of inflammation.
Introduction
Diabetes mellitus affects 285 million people worldwide, with numbers predicted to rise by 54% over the next 20 years. 1 The prodromal impaired glucose tolerance (IGT) affects 25% of adult Americans. 2 Obesity affects 32% of adult Americans 3 and is arguably the dominant preventable factor promoting glucose disorders. Cardiovascular disease is the primary cause of death in people with diabetes, 4 accounting for 68% of overall mortality. 5 IGT and impaired fasting glucose both predict cardiovascular events. 6 Expert guidelines for primary prevention of cardiovascular disease in diabetes mandate weight loss as an important part of risk reduction. 7
Bariatric surgery consistently induces long term weight loss and reduces cardiovascular morbidity and overall mortality.8,9 The Swedish Obesity Study reported a 25% mortality reduction after 10 years’ follow-up; myocardial infarction rates were 20% lower in bariatric subjects. 8 A retrospective, controlled study found a 40% reduction in all-cause mortality after seven years, with a 56% reduction in coronary artery disease mortality. 9 Bariatric surgery also ameliorates type 2 diabetes mellitus (T2D) at 10 years. 10
The mechanisms by which long term weight loss improves cardiovascular outcomes in the obese after bariatric surgery are not well-defined: weight loss improves conventional and novel cardiovascular risk factors, including blood pressure, lipids, glucose, insulin resistance and inflammatory markers. Arterial stiffness predicts cardiovascular mortality and morbidity11,12 independently of conventional risk factors. Arterial stiffness, as a consequence or ageing or arterial disease, increases pulse wave velocity, which prematurely reflects systolic pressure waves back to the heart. Rather than reflected pressure waves being centrally received in diastole, they are received in late systole, thereby ‘augmenting’ central systolic arterial pressure. This can result in reduced diastolic coronary perfusion and increased cardiac workload. The degree of augmentation is expressed as the ‘augmentation index’, which predicts cardiovascular morbidity and cardiac mortality in T2D.11,12 Studies of arterial stiffness show improvement after diet-induced weight loss and bariatric surgery.13-16
Obesity, T2D and atherosclerosis share a low-grade, pro-inflammatory state. Our current understanding of atherosclerosis pathogenesis indicates that immune cells such as monocytes, macrophages and T-lymphocytes contribute to tissue-based inflammation. Circulating pro-inflammatory cytokines, adipokines and adhesion molecules, some derived from adipose tissue, are also implicated. We recently showed that weight loss substantially reduces the cell surface expression of proinflammatory activation markers and receptors on monocytes, granulocytes and T-lymphocytes, along with an 80% fall in T-helper-1 cells. 17 The relationships between weight loss-induced changes in arterial stiffness in diabetes and the immunology of adipose tissue are investigated in the current study.
We hypothesised that improved arterial function following weight loss may be explained by changes in circulating inflammation, such as circulating immune cell activation and cytokines. We also postulated a link between arterial stiffness and measures of adipose tissue inflammation.
Methods
Subjects
Subjects were obese patients with either T2D or IGT attending an inner city tertiary hospital referred for bariatric surgery. Inclusion criteria were age >18 years, T2D or IGT 18 and body mass index (BMI) >35 kg/m2. Subjects gave written, informed consent; the study protocol was approved by the local Research and Ethics Committee and registered at www.clinicaltrials.gov (NCT00592735).
Study design
Seventeen subjects were recruited; two subjects withdrew: one moved overseas, another did not wish to undertake caloric restriction. One subject missed arterial studies at baseline, due to instrument non-availability. Data are presented for the 14 subjects who had arterial measures at every study visit.
Ten subjects had T2D based on history, confirmed by 75g oral glucose tolerance test. 18 Medications in the 10 T2D subjects: metformin (n = 3); metformin + sulphonylurea (n = 5); statins (n = 4); antihypertensives (n = 7). Four subjects had IGT and took no medications.
Subjects were studied at baseline, after 12 weeks of pre-operative caloric restriction and 12 weeks after gastric banding (24 weeks).
Intervention
Caloric restriction was for 24 weeks using a modified very low energy diet. Energy intake was limited to 3.6–6.0 MJ/day, depending on baseline weight (which varied between 100 and 170 kg). Individualised counselling was carried out every four weeks. Subjects replaced 1–2 meals/day with a commercial meal-replacement shake (0.56 MJ/serve (18 g protein, 2 g fat, 14 g carbohydrate)). Subjects were given individualised, written instructions for the composition of the remaining 1–2 daily meals (fat <20 g, carbohydrate <80 g and protein <200 g, dependent on subject weight).
Laparoscopic gastric band placement was performed at 12 weeks on fasted subjects by a single surgeon (RL); subcutaneous adipose tissue (SAT) and visceral adipose tissue (VAT) were collected at surgery into a 37°C bath and liquid nitrogen: SAT from the anterior abdominal wall, VAT from the perigastric fat.
After surgery caloric restriction continued, confirmed by food records. Subjects were offered a single band inflation at 4–10 weeks postoperatively, dependent on assessment of weight loss and reported satiety. Band inflation range was 3–6 ml (12 ml capacity) in 12/14 subjects.
Studies were conducted after a 10-hour overnight fast; medications were omitted on study days. Anthropometry was performed with the subject in a hospital gown by a single investigator (KS): weight to the nearest 0.1 kg; barefoot height by stadiometer; waist at the narrowest point between the ribcage and anterior superior iliac crest; hip at the widest point between the anterior superior iliac crest and greater trochanter. BMI (weight × height-2 (kg.m-2)) was calculated.
Venesection was performed between 08:00 and 09:00. A 75g oral glucose tolerance test was performed (Carbotest 75g per 300 ml, Lomb Scientific, Sydney, Australia) at each study. Samples were collected at 0, 30, 60, 90 and 120 minutes.
Arterial augmentation index (AIx)
Brachial blood pressure was measured twice by sphygmomanometer in rested, semi-recumbent subjects. AIx was measured by applanation tonometry at the radial artery (SyphgomoCor, AtCor Medical, Sydney, Australia), as described. 19 This technique provides intra-arterial pressure measurements similar to those obtained invasively. A central aortic waveform was derived from the peripheral waveform using a validated transfer function. AIx was calculated as the ratio of the difference between the second systolic peak and the diastolic pressure and the difference between the first systolic peak and the diastolic pressure × 100. AIx was corrected for heart rate at 75 beats/min, as is standard. Coefficient of variation (CV) for repeated measures <5%.
Biochemistry and adipokines
Plasma glucose was determined on fresh blood by the glucose oxidase method (YSI glucose analyser, model 2300 STAT PLUS 230V, YSI, Inc., Yellow Springs, OH, USA). HbA1c was quantified by high performance liquid chromatography (Pharmacia). Serum was stored (−80°C). Insulin was measured by commercial radioimmunoassay (Linco, St Charles, MO, USA). Insulin resistance was estimated by homeostasis model assessment (insulin × glucose/22.5). 20 Serum total cholesterol, high density lipoprotein (HDL)-cholesterol and triglycerides were measured spectrophotometrically at 490 nm by enzymatic colorimetry (Roche, Basel, Switzerland). Low density lipoprotein (LDL)-cholesterol was estimated using the Friedewald equation (LDL = total cholesterol – HDL – triglycerides/2.2).
High-sensitivity CRP by immunoturbidimetry (Olympus reagents, Olympus AU2700 analyser, Integrated Sciences, Sydney, Australia). Adiponectin was measured by radioimmunoassay (Linco Research, St Charles, USA); interleukin (IL)-1β, IL-6, tumour necrosis factor alpha (TNFα), s-E-selectin, inter-cellular adhesion molecule (ICAM) and vascular cell adhesion molecule (VCAM) measured by ELISA (R&D Systems, Minneapolis, MN, USA). All subject samples were included in the same assay run; the interassay CVs were <5%.
Immune cell preparation and flow cytometry analysis
Fresh whole blood was stained with fluorochrome- conjugated antibodies to various cell surface markers (BD Biosciences, San Diego, CA, USA) and analysed on a BD FACSCaliburTM (BD Biosciences, San Diego, CA, USA) with an excitation laser line Argon (488nm) and Red diode (635nm) and CellQuest software (V3.3 from BD Biosciences), as described. 17 Data were analysed using FlowJo software (V7, TreeStar Inc.). Mean fluorescence intensity (MFI) of marker expression was divided by MFI of the unstained control, to give the relative MFI, which was used in analyses.
T helper (Th)-1 and Th-2 lymphocytes were quantified by intracellular cytokine staining for interferon-γ and IL-4, respectively (BD Bioscience Pharmingen, San Diego, CA, USA), as described. 17
Subcutaneous and visceral fat macrophage activation status
Fresh SAT and VAT (100–200 mg) was placed in a modified Krebs-Ringer-phosphate buffer at 37°C (10 mM CaCl2, 6 mM Na2HPO4,125 mM HEPES, 12 mM MgSO4, 4 mM NaH2PO4, 1.2 M NaCl, 60 mM KCl, 3 g BSA and 0.09 g D-glucose in 100 ml H2O, pH 7.4). Samples were digested to separate the stromavascular fraction (SVF) from adipocytes. Finely cut tissue was incubated with collagenase IV (0.75 mg/ml) (30 min, 37°C), then filtered. SVF was separated from mature adipocytes by slow centrifugation (300 g) and washed in ice cold PBS. The SVF was analysed by flow cytometry, using a validated staining protocol to quantify distinct cell subsets and activation markers. Macrophages were stained for CD14, a co-receptor of the Toll-like receptor-4 and an accepted monocyte/macrophage antigen. Results are expressed as a percentage of all viable cells and CD11b macrophage expression by relative mean fluorescence intensity (rMFI).
Adipose tissue gene expression
Adipose samples were stored (−80°C) until RNA extraction, using a QIAGEN RNeasy Mini Kit (QIAGEN, Valencia, CA, USA). DNA digest was performed by standard methods using Amplification Grade DNAse I (Invitrogen, Carlsbad, CA, USA).
Gene expression was measured by a two-step multiplexed tandem PCR (MT-PCR) method, as described.21,22 Primer sequences were designed using Primer 3 software, with NONO (‘non-POU domain containing, octamer binding’; NM_007363) as the reference gene.21,22 Our a priori hypothesis was that molecules regulating macrophages and lymphocytes may relate to arterial responses to weight loss. Molecules regulating macrophages: macrophage chemoattractant protein-1 (MCP-1 or CCL2), macrophage inflammatory protein-1 (MIP-1 or CCL3), macrophage inhibitory cytokine-1. Molecules regulating lymphocytes: MCP-1 (lymphocyte migration), interferon-γ (a marker of T-helper-1 lymphocyte infiltration), CCL5 (RANTES (regulated on activation, normal T cell expressed and secreted)) and CCL20 (lymphocyte chemoattractant).
First round multiplexed amplification and second round quantification amplification were performed as previously described.21,22
Statistical analysis
Data are presented as mean ± SEM for comparisons between groups. Analyses were performed using PASW Statistics 18.0 (SPSS Inc., Chicago, IL, USA). Comparisons between results were performed using paired t-tests (for normally distributed data) or Mann–Whitney U tests and Wilcoxon signed rank tests (for skewed data). The primary outcome AIx@75 was adjusted for systolic blood pressure; standardised residuals were then examined for the effect of weight loss, independent of blood pressure. Non-normally distributed data were transformed logarithmically. Regression analysis was used to determine the relationships between variables and the AIx response. Correlations between variables were expressed as Pearson’s or Spearman’s correlation coefficients. p < 0.05 was considered significant.
Results
The eight males and six females had a mean age of 50.3 ± 2.7 years, a mean initial weight 127.5 ± 5.7 kg (range: 92.1–172.0 kg) and BMI 43.3 ± 1.3 kg/m2 (range: 35.1–50.8). All subjects were dysglycaemic: 10 had T2D and four had IGT. Clinical characteristics are shown in Table 1. Arterial pulse wave velocity at baseline was related to total cholesterol (r = 0.67, p = 0.009) and LDL cholesterol (r = 0.63, p = 0.01), but not weight, waist, insulin resistance or adipokines (data not shown).
The effect of caloric restriction before and after gastric banding surgery on weight, metabolic characteristics and inflammation.
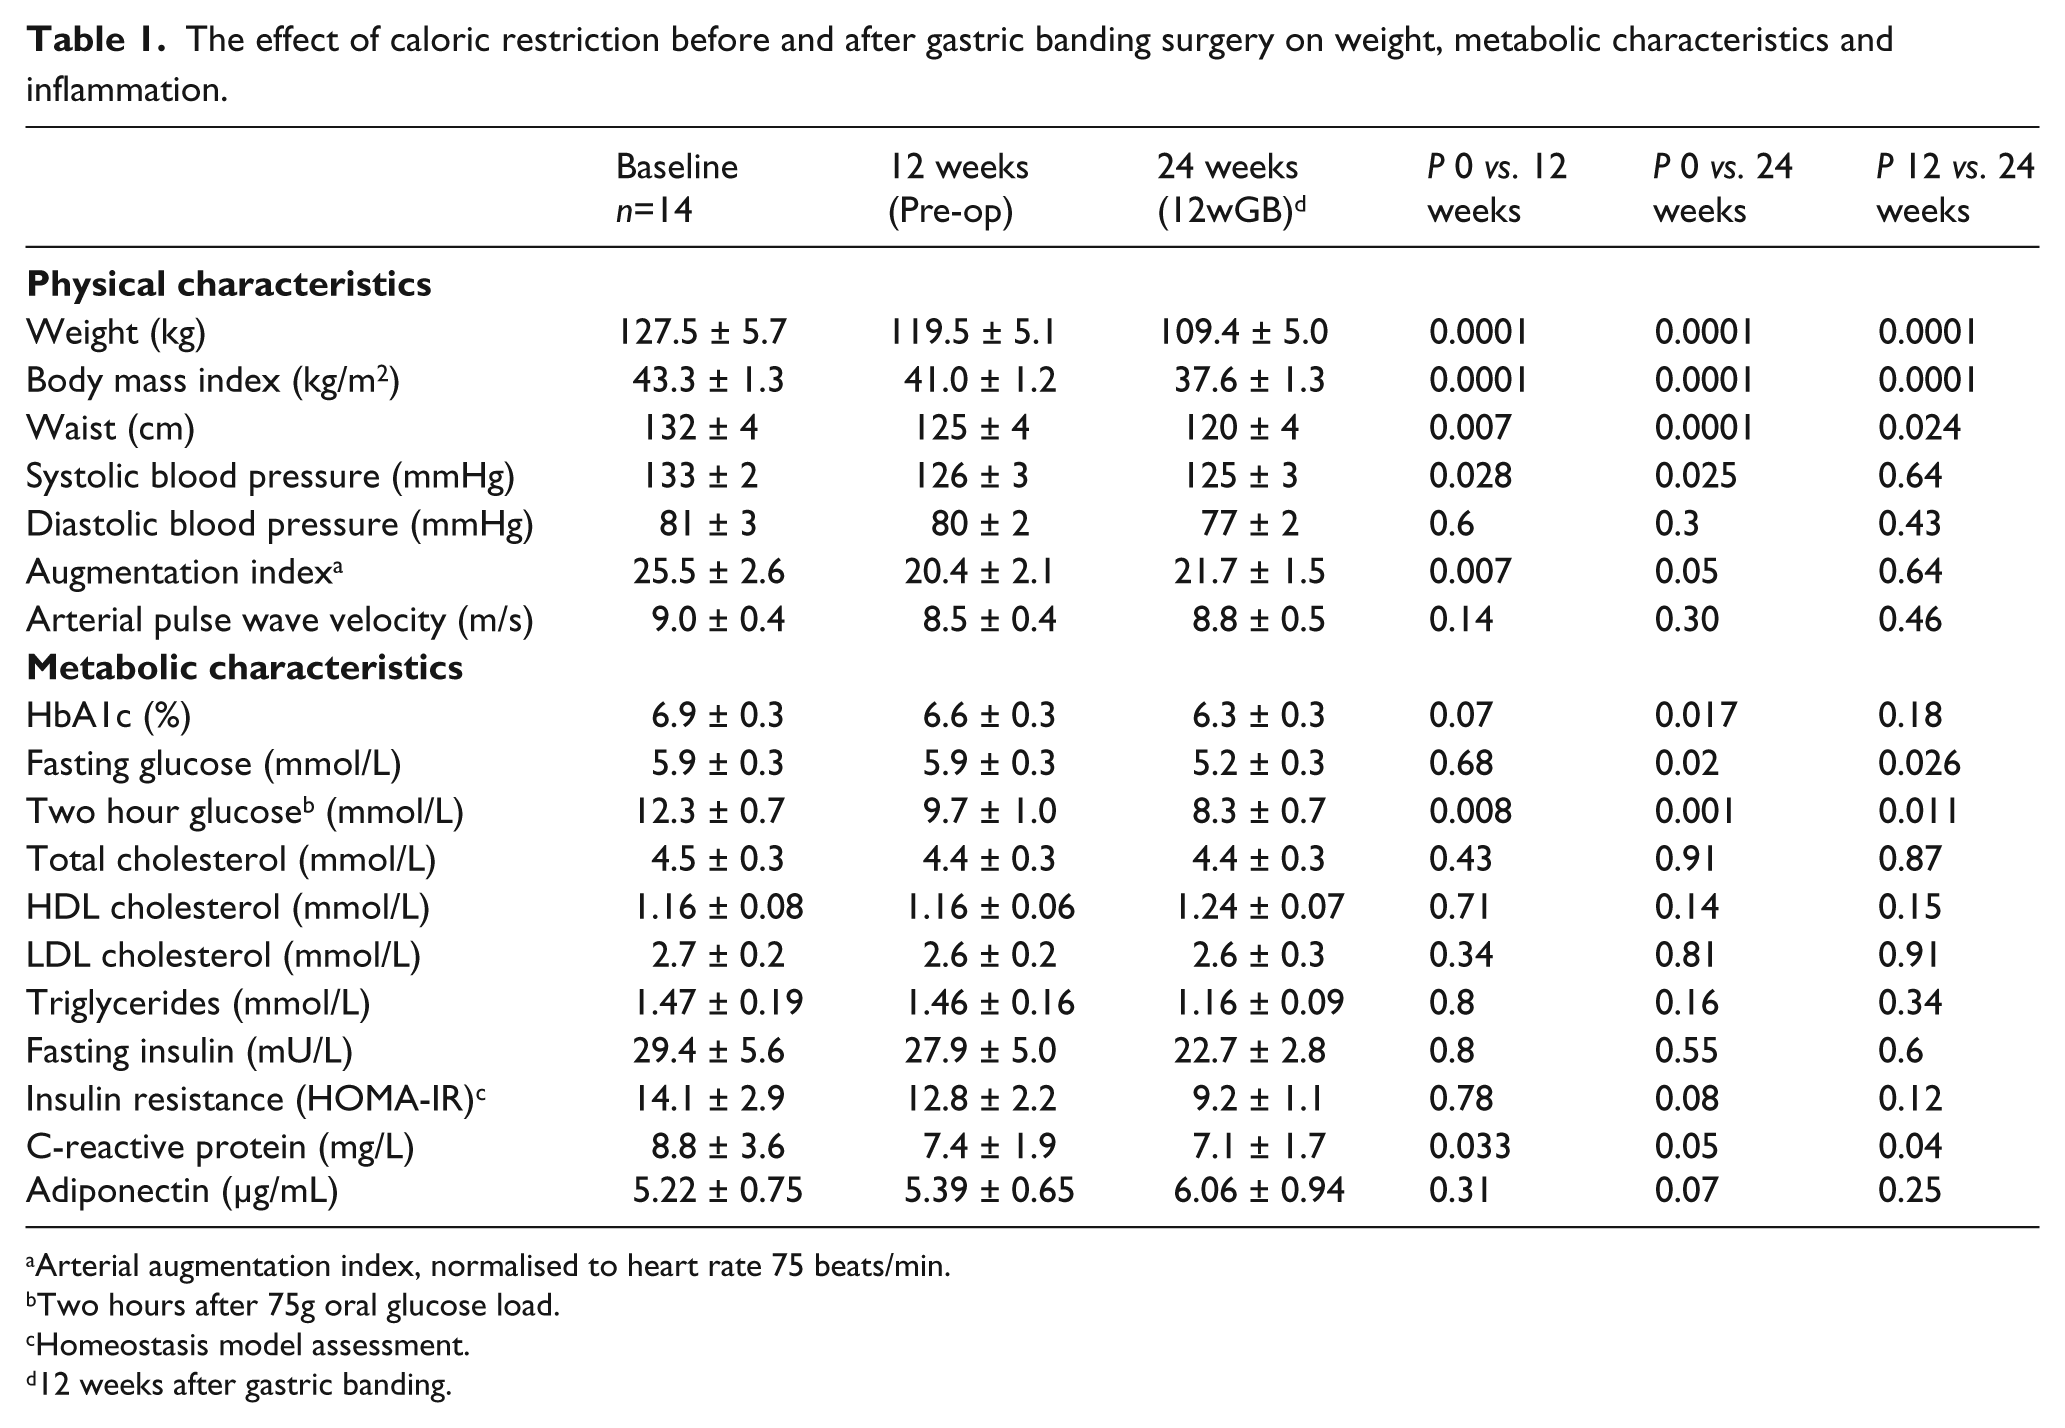
Arterial augmentation index, normalised to heart rate 75 beats/min.
Two hours after 75g oral glucose load.
Homeostasis model assessment.
12 weeks after gastric banding.
At 12 and 24 weeks’ caloric restriction the mean weight loss was 6.0 ± 1.3 kg and 16.0 ± 2.4 kg (range: 0.2–30.0 kg), respectively. Metformin treatment was continuous for the eight subjects receiving it. Of five sulphonylurea- recipients, four ceased after gastric banding at 12 weeks.
AIx fell by 20% after 12 weeks’ calorie restriction (p = 0.007), maintained at 24 weeks (p = 0.05) (Figure 1).
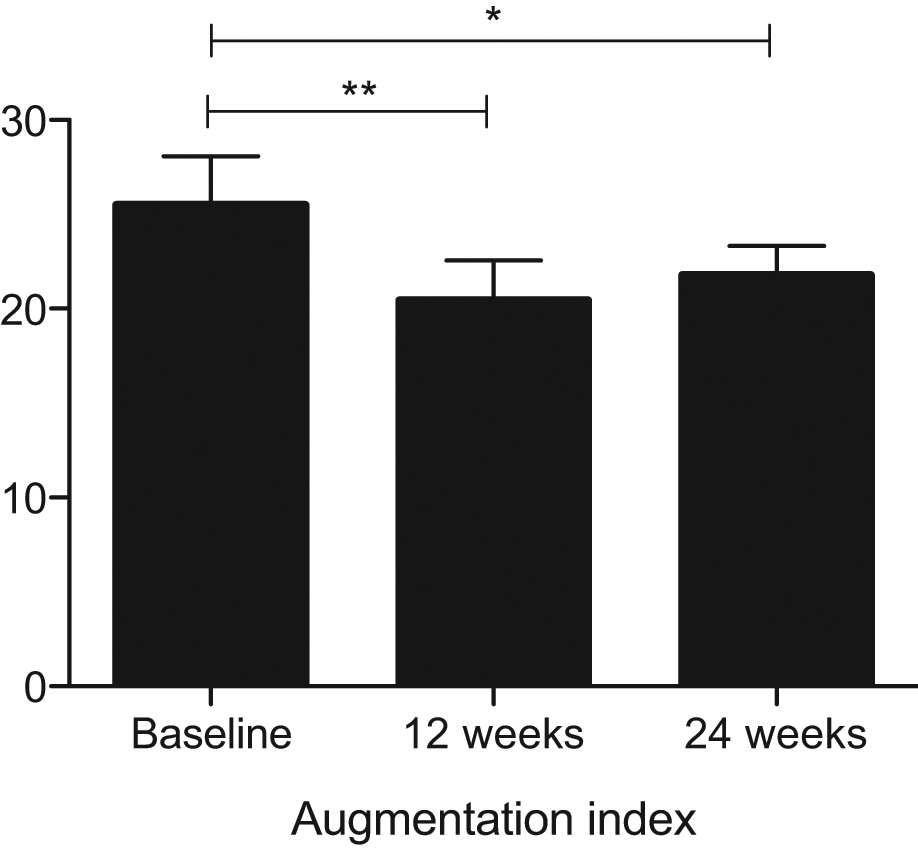
The effect of weight reduction on arterial augmentation index in dysglycaemic, morbidly obese subjects (*weeks, p = 0.05; **p = 0.007).
Systolic blood pressure fell significantly after 12 weeks’ caloric restriction, maintained at 24 weeks. Of the four subjects receiving antihypertensive therapy, medications were ceased in three subjects and reduced in one. There was no significant change in diastolic blood pressure or arterial pulse wave velocity (Table 1).
After adjustment for changes in systolic blood pressure, the weight loss-induced fall in AIx remained significant (p = 0.04).
Weight loss reduced s-E-selectin and s-ICAM at 24 weeks (p = 0.001 and 0.04, respectively), with a downward trend observed for s-ICAM at 12 weeks (p = 0.07) (Figure 2). Adiponectin tended to rise at 24 weeks (p = 0.07). C-reactive protein (CRP) fell significantly at 12 weeks (p = 0.033), sustained at 24 weeks (Table 1). There were no significant changes in IL-1β, IL-6, TNF-α or sVCAM-1 (Figure 2).
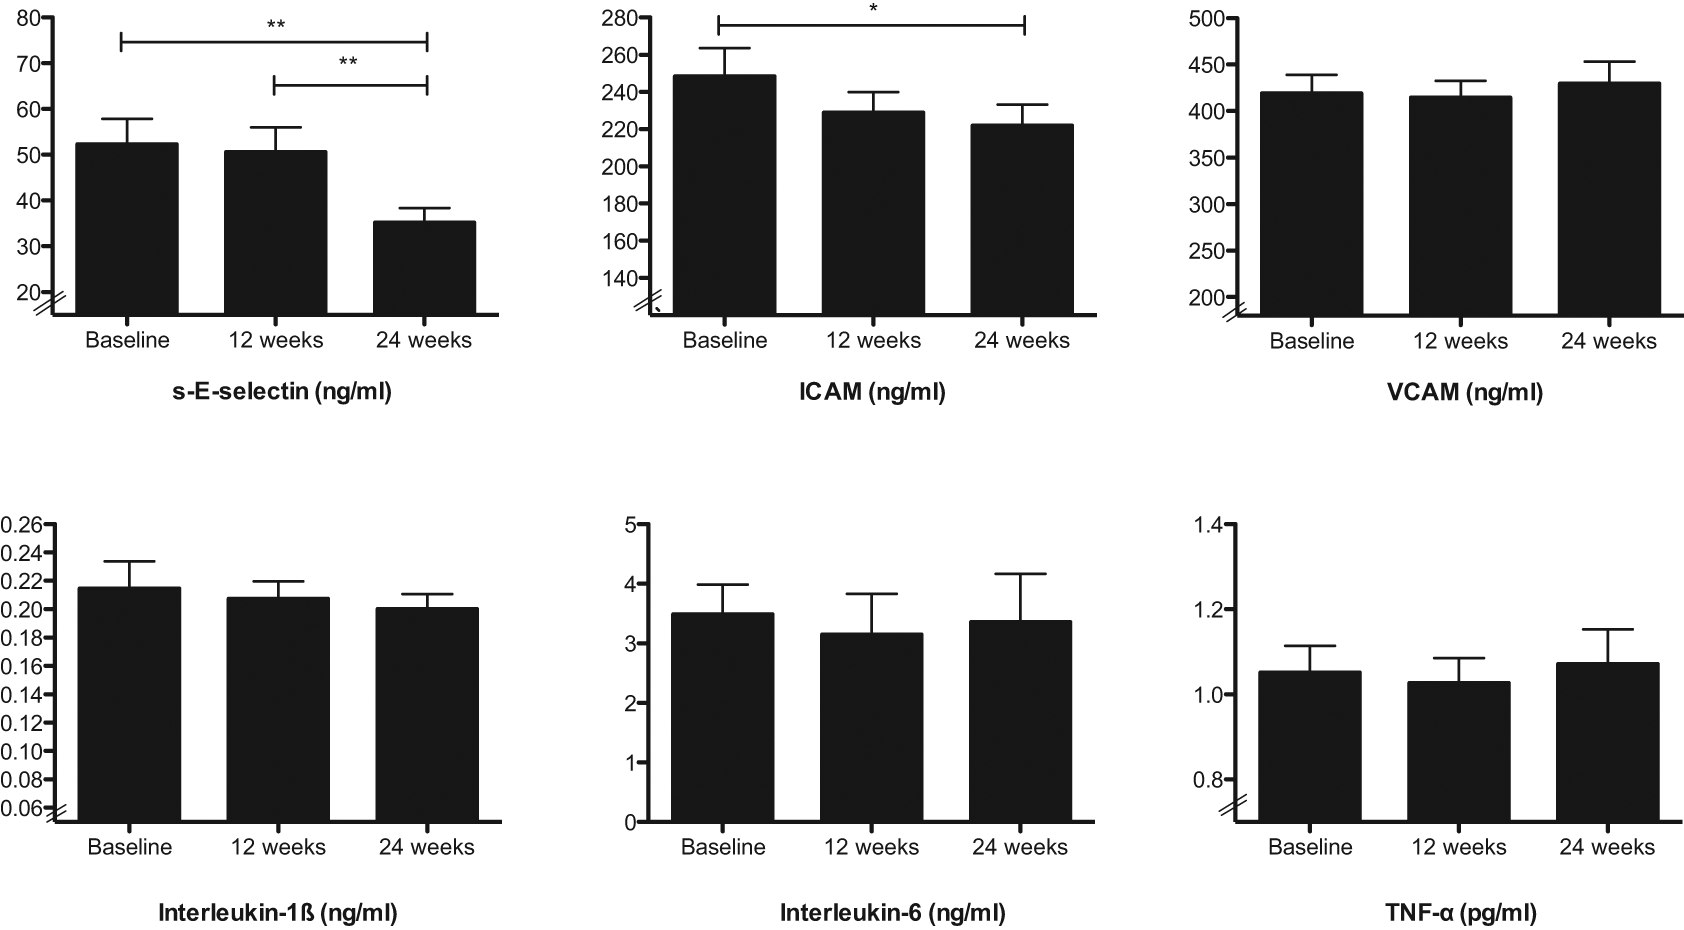
The effect of weight reduction on serum cytokine levels in dysglycaemic, morbidly obese subjects (*p < 0.05, **p < 0.001).
Associations with weight loss-induced falls in AIx
Degree of weight lost
There was no relationship between the reduction in weight, waist circumference, BMI and the reduction in AIx at either 12 or 24 weeks (data not shown).
The magnitude of fall in AIx was compared between the two caloric restricted phases, before and after gastric banding. Calorie restriction for 12 weeks with a weight loss of a mean of 6kg was associated with a greater decline in AIx than that observed after gastric banding despite ongoing caloric restriction and a greater and more rapid weight loss weight reduction in the second phase (−5.0 ± 1.59 vs. 1.36 ± 1.72, p = 0.023 (interquartile ranges −9.3−0 vs. −3.3–4.75]).
To further explore whether the fall in AIx was dependent on degree of weight lost, the reduction in AIx was compared between subjects who lost more or less than 15kg over the 24 week intervention. The fall in AIx in those losing more than 15kg was no different from that in subjects who lost less weight (data not shown).
Glucose metabolism
The reduction in AIx was three-fold greater in subjects with IGT versus T2D at both 12 and 24 weeks (p = 0.006 and p = 0.02, respectively). Age and gender did not influence the reduction in AIx at 12 weeks and 24 weeks (data not shown).
Metabolic parameters
Reductions in insulin resistance were related to the fall in AIx at 24 weeks only, explaining approximately 30% of the variance in the change in AIx (r = 0.57, p = 0.04). Weight loss-induced changes in fasting total-, LDL- and HDL-cholesterol, triglycerides, CRP and glucose did not relate to the fall in AIx (data not shown).
Immune cells and adipose tissue gene expression
The reduction in AIx during the 24 week intervention was associated to changes in circulating immune cells and their activation status. At 12 weeks, the reduction in AIx was related to the fall in numbers of T-lymphocytes (r = 0.75, p = 0.01) and CD3 cells (r = 0.71, p = 0.02) (Figure 3(a)), with a trend for the fall in CD4 cells (r = 0.58, p = 0.09).
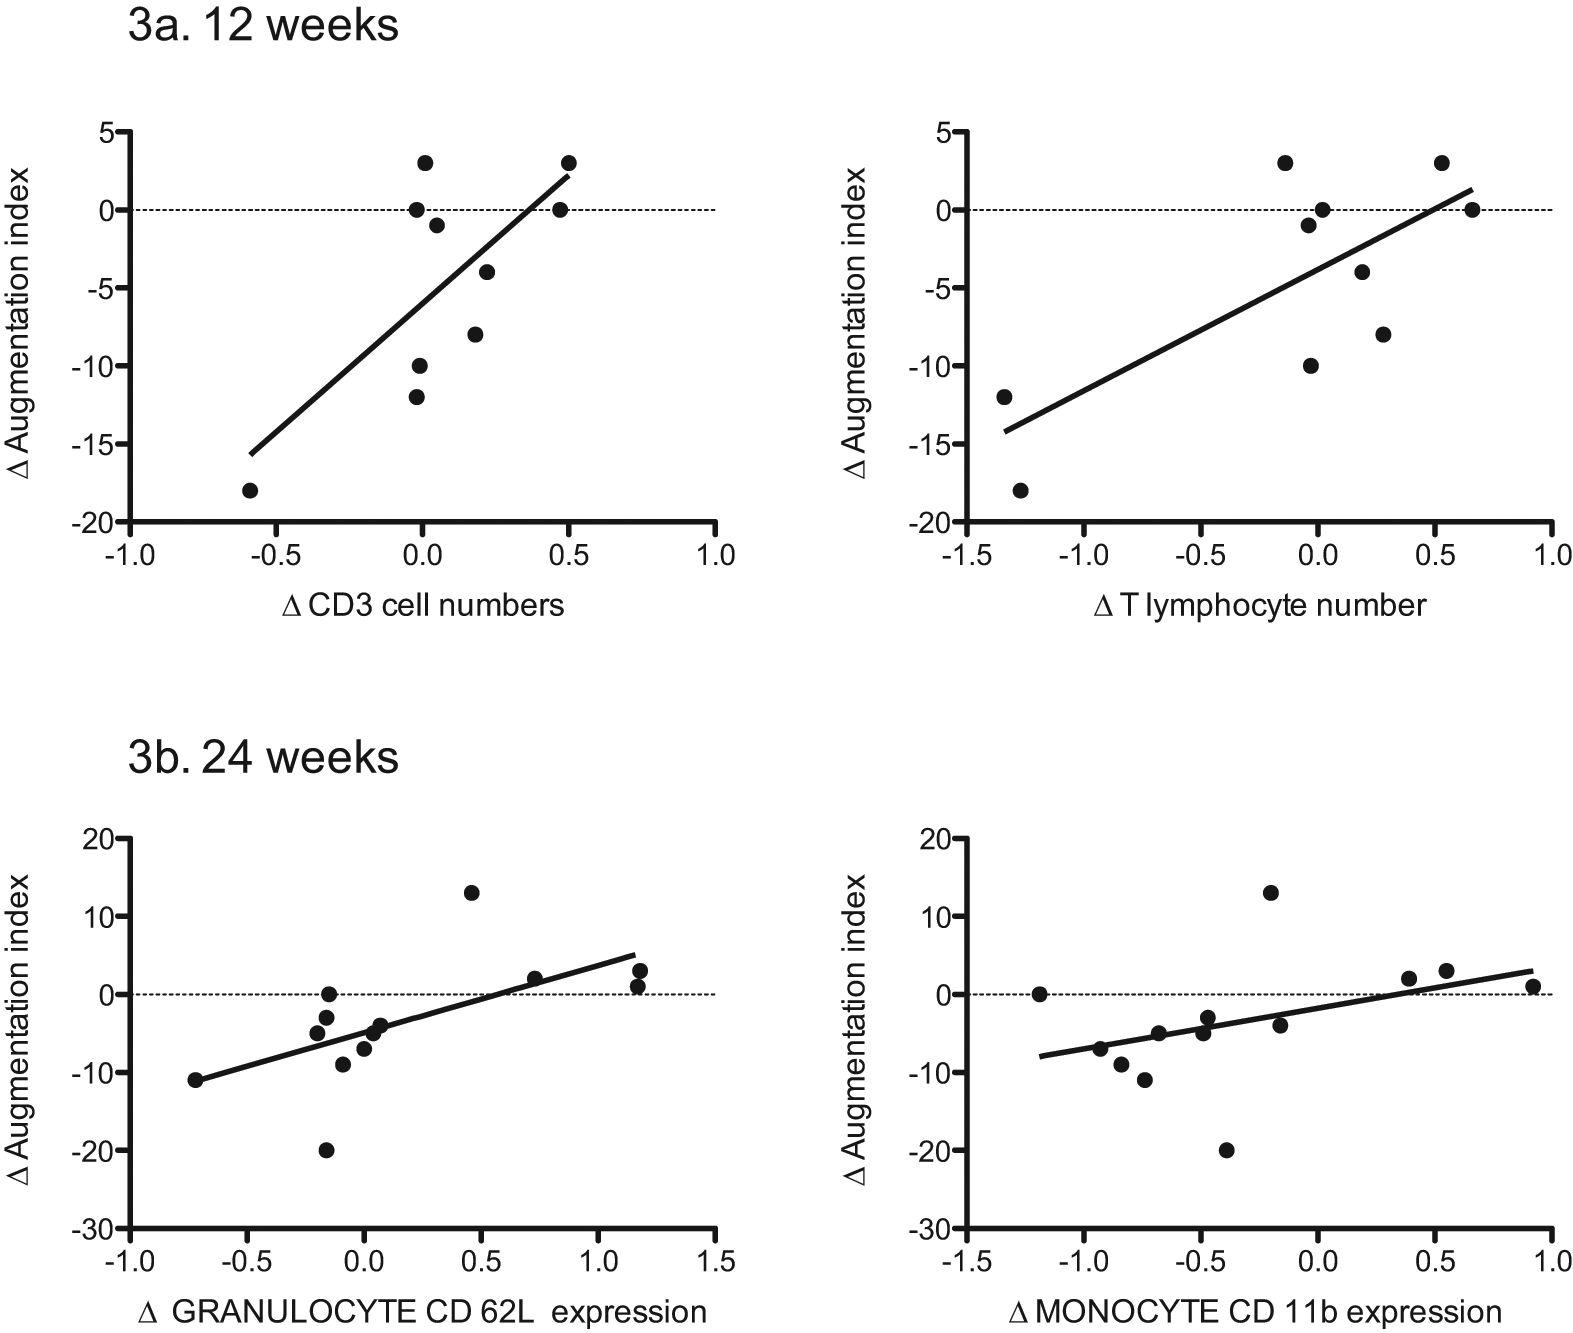
Weight loss improves arterial augmentation index: associations with immune cell numbers and cell surface expression of activation markers and adhesion molecules.
Changes in AIx were examined against changes in immune cell surface expression of activation markers and adhesion molecules. The reduction in AIx was related to falls in granulocyte expression of the surface adhesion molecule CD62L (r = 0.64, p = 0.02), monocyte expression of the surface adhesion molecule CD11b (r = 0.64, p = 0.03) (Figure 3(b)) and T-cell expression of the surface IL-2 receptor CD25 (r = 0.59, p = 0.02).
Subcutaneous and visceral adipose tissue monocyte numbers or surface expression of the activation marker CD11b (at 12 weeks) were not related to the fall in AIx (data not shown).
SAT and VAT gene expression of molecules involved in the regulation of macrophages and T-lymphocytes were examined against AIx. Baseline AIx related inversely to SAT gene expression of the lymphocyte chemoattractant CCL20 (r = −0.58, p = 0.04) and positively to VAT gene expression of the monocyte chemotactic protein-1 (CCL2) (r = 0.59, p = 0.03) (Figure 4). The fall in AIx was inversely related to VAT gene expression of monocyte chemoattractant protein-1 (CCL2)) (r = −0.54, p = 0.05) (Figure 4) and interferon-γ (r = −0.65, p = 0.02).
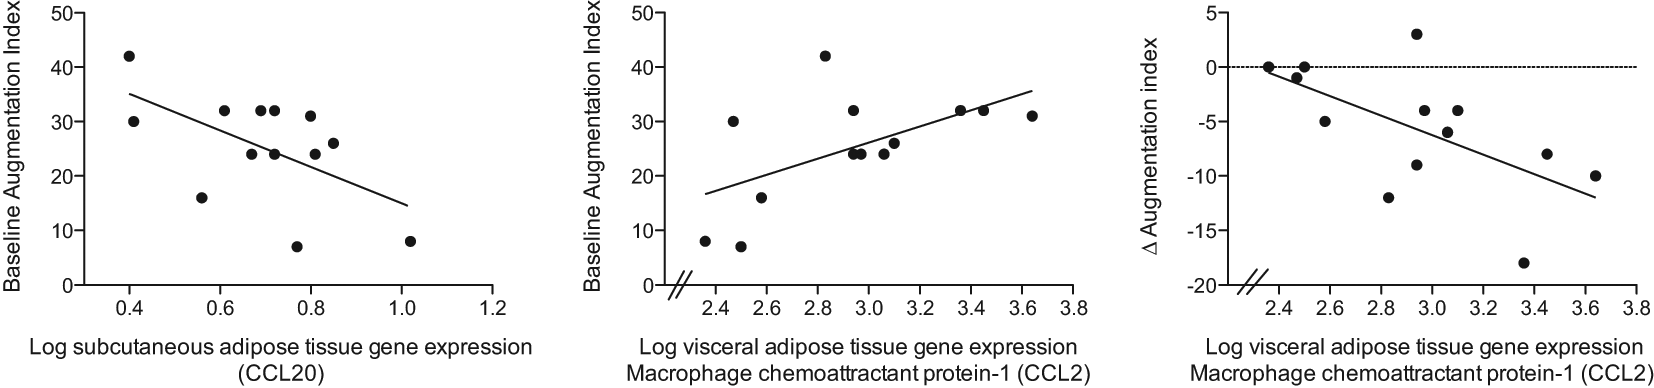
Adipose tissue gene expression in obese, dysglycaemic subjects: associations with augmentation index at baseline and after weight loss.
Multivariate models
Multivariate models for associations of the 24-week reduction in AIx found that a model containing changes in circulating T-lymphocyte CD25 (IL-2 receptor) expression, insulin resistance, weight and systolic blood pressure explained 85% of the variance (r = 0.92, p = 0.03). The most parsimonious model explaining 73% of the variance in the 24-week reduction in AIx consisted of the 24-week changes in T-lymphocyte CD25 expression and insulin resistance (p = 0.005).
Baseline predictors of the improvement in arterial AIx were examined. Baseline weight, waist, lipids, glucose, glucose AUC and blood pressure had no effect (data not shown). A higher degree of baseline insulin resistance predicted a smaller fall in AIx (r = −0.53, p = 0.05).
Lower baseline CD3 lymphocyte numbers predicted a greater fall in AIx (r = −0.64, p = 0.01). Baseline granulocyte cell surface expression of the activation marker CD62 also predicted the improvement in AIx (r = 0.77, p = 0.002). A trend was found for higher T-lymphocytes predicting a lesser fall in AIx (r = −0.52, p = 0.07).
Discussion
Our study findings show that modest weight reduction in morbidly obese, dysglycaemic subjects reduces arterial stiffness by 20% in as short a time as 12 weeks, associated with beneficial changes in blood pressure and circulating cytokines levels. The improvement in arterial distensibility was independent of changes in blood pressure and lipids and associated with improved insulin resistance and changes in the pro-inflammatory status of circulating immune cells.
To our knowledge, this is the first study to examine the relationships between weight loss-induced improvements in arterial stiffness against measures of circulating and adipose tissue immune cells. We found the improvement in arterial distensibility related to the fall in immune cell numbers, particularly T-lymphocytes. Improvements in arterial distensibility were also associated with reductions in cell surface expression of monocyte adhesion molecules, granulocyte activation molecules and T-lymphocyte IL-2 receptors. These novel data suggest there may be links between weight loss-induced changes in immune cell biology and arterial stiffness.
Prior studies examining gene expression and arterial function have focused on structural elements in the arterial wall, the renin–angiotensin system and cell signalling pathways. 23 A novel aspect of our study was examination of SAT and VAT gene expression in the setting of weight loss and arterial stiffness. We found that greater VAT gene expression of interferon-γ and monocyte chemoattractant protein-1 were associated with a blunted arterial distensibility response, suggesting that adipose biology may influence the arterial response to weight reduction, perhaps directly or through intermediates such as immune cells. Mechanistic studies in cell culture or animal studies are required to investigate further. It is possible that caloric restriction pre-op altered adipose tissue gene expression and ideally VAT would have been sampled prior to caloric restriction. In the morbidly obese bariatric patient, however, pre-operative weight loss is standard of care, otherwise there is increased risk of intraoperative hepatic damage and perioperative complications.
Our results suggest links between immune cell and the vascular response in weight loss. It is plausible that reductions in monocyte adhesion, T-lymphocyte numbers and IL-2 expression (which promotes extravascular T-cell migration) impact on arterial wall inflammation, thence arterial distensibility. Caloric restriction studies in obese animal models with an atheroma phenotype would yield information on the primacy of caloric restriction in mediating the immune cell–arterial interaction we observed in this small human study.
Our findings concur with prior weight loss studies, showing that diet or surgery improve arterial function, with concomitant falls in inflammatory markers 13 and adhesion molecules.13,24 Weight loss improved endothelial dysfunction 25 and flow mediated dilatation. 26 In our study, we found that further weight loss did not further enhance arterial improvements at 24 weeks. Possible explanations include a degree of non-reversibility of arterial stiffness in glucose disorders, that the weight loss–arterial response curve is not linear or, perhaps, that weight normalisation is necessary. In support of the latter explanation, aortic elasticity was normalised three years after massive weight loss (40 kg) by the malabsorption-inducing biliopancreatic diversion with Roux-en-Y gastric bypass in normoglycaemic. 14
Study strengths include detailed clinical, biochemical and immunological phenotyping in humans over several time points in the weight loss process, in addition to SAT and VAT macrophage studies and gene expression. Study limitations include small numbers; however, studies of circulating and tissue-based immune cells are complex, expensive and time consuming. Further, access to visceral adipose tissue is difficult. Nevertheless, the changes observed in some immune measures were striking. We relied on calculated insulin resistance measures using HOMA-IR, since hyperinsulinaemic clamps are technically difficult in morbidly obese subjects where venous access is poor. Our study did not include a control group who did not undergo a weight loss intervention. Further, our results cannot be extrapolated to normoglycaemic morbidly obese subjects.
In conclusion, our study demonstrates that weight loss-induced benefits on arterial stiffness in dysglycaemic subjects are independently associated with reductions in insulin resistance and circulating immune cell numbers and activation status. These novel data support the need for larger studies interrogating the endocrine–immune–arterial nexus to determine how sustained weight loss reduces cardiovascular morbidity.
Footnotes
Acknowledgements
Our thanks go to the Garvan Clinical Research Facility staff and to all the study participants. Thanks are also extended to Connie Karschimkus and Kathryn Davis for assistance with adipokine assays.
Funding
This work was supported by the St Vincent’s Clinic Foundation’s Sister Bernice-Ladies Committee Award, the National Health and Medical Research Council, Australian Government (Career Development Award 2008–2009 to KS [51477]), a GSK Don Chisholm Diabetes Research Fellowship (to AV) and the Royal Australasian College of Physicians Krongold Health Fellowship (to AJ).