
Abstract
Arterial stiffness is independently related to increased cardiovascular risk in the hypertensive population. The aim of the present study was to investigate whether various stages of abnormal glucose metabolism may differently affect arterial stiffness in hypertensive patients and whether there is any difference in arterial stiffness among patients with normal glucose regulation. We studied 1375 never-treated hypertensive subjects. Participants were divided into four metabolic groups: normal glucose regulation (NG), impaired fasting glucose, impaired glucose tolerance and type-2 diabetes mellitus (DM 2). Hypertensive subjects with NG were subdivided into three groups according to glucose levels. Arterial stiffness was estimated by carotid-femoral pulse wave velocity (PWV). PWV showed a significant increase from patients with NG to DM 2 (from 7.74±1.38 to 8.40±1.30 to 8.86±1.30 to 10.09±2.07 m/s respectively, p<0.001). Among hypertensive subjects with NG there was an increase in PWV from low normal to high normal values of glucose (p<0.01). PWV was independently related to all glucose metabolic parameters (p<0.001 for all). In the present study, we demonstrated an association between arterial stiffness and glucose tolerance in hypertensive subjects. Given the prognostic significance of arterial stiffness, aims should be towards closer monitoring and intensive care of hypertensive patients with abnormal glucose metabolism.
Introduction
Abnormal glucose metabolism, especially diabetes mellitus (DM), has been associated with increased cardiovascular risk. 1,2 It is noteworthy that there is no definite plasma glucose level threshold above which increased risk for coronary heart disease is established. Indeed, plasma glucose concentration ≥7.0 mmol/L (or 126 mg/dl) as a current criterion for the diagnosis of type-2 diabetes mellitus (DM 2) is based on the high prevalence of microvascular, rather than macrovascular, complications occurring above that level. Moreover, although the relationship between glucose concentration and mortality from any cause follows a J-shaped curve, the relationship with mortality from coronary heart disease is linear, with the lowest death rates to occur at glucose concentrations well below the World Health Organisation criteria for the definition of diabetes. 3 Although the mechanisms implicated in the relationship between cardiovascular disease and abnormal glucose metabolism are very complicated and multifactorial, arterial stiffness might serve as a possible contributor to this relationship.
Arterial stiffness is a strong independent predictor of cardiovascular disease in several populations, including hypertensive patients. 4 The relationship between arterial stiffness and abnormal glucose metabolism has been the subject of many studies, most of which have concluded to a positive association between arterial stiffness and DM 2, 5–9 but to inconsistent results regarding the relationship between arterial stiffness and impaired fasting glucose (IFG) or impaired glucose tolerance (IGT). 7–9 Further blurring the picture, a recent review concluded that, although blood pressure was consistently and independently associated with arterial stiffness in almost 90% of the published, cross-sectional studies, DM was associated with arterial stiffness in only 52% of the reported studies. 10 Moreover, there are no data regarding the possible difference in pulse wave velocity (PWV) among subjects with normal glucose regulation.
Given the adverse prognostic role of arterial stiffness in subjects with hypertension, the aim of the present study was to investigate to what extent, and from what stage, abnormal glucose metabolism may unfavourably alter arterial elastic properties in this population, thus further increasing their cardiovascular risk. For this purpose, we studied patients with never-treated arterial hypertension and we evaluated arterial stiffness (assessed by carotid-femoral PWV) across groups of glucose metabolism, ranging from normal glucose regulation to IFG, IGT and DM 2. To further explore whether there is any difference in PWV among hypertensive subjects with normal glucose regulation, we subdivided this cohort into three subgroups, according to glucose levels.
Methods
Study population
The study participants were 1375 subjects with never-treated essential hypertension recruited from the Hypertension and Peripheral Vessels Units of our Department. Office blood pressure (BP) was measured by a mercury sphygmomanometer, taking at least three measurements spaced by 1 min, allowing the patients to rest for 10 min before the examination. According to the guidelines of the European Society of Hypertension, measurements of systolic BP (SBP) ≥140 mm Hg and diastolic BP (DBP) ≥90 mm Hg were considered as systolic and diastolic arterial hypertension, respectively. Pulse Pressure (PP) was calculated as SBP minus DBP and mean arterial pressure (MAP) as DBP+1/3PP.
Hypertensive patients with glucose levels above 100 mg/dl were subject to a 2-h oral glucose tolerance test (OGTT) with 75 g of glucose. IFG was defined as fasting glucose levels between 100 and 125 mg/dl with normal OGTT (2-h postload glucose <140 mg/dl). Hypertensive subjects with 2-h postload glucose between 140 and 199 mg/dl were categorised as subjects with IGT, whereas DM 2 was defined as fasting glucose level ≥126 mg/dl in two different measurements or as 2-h postload glucose ≥200 mg/dl or use of anti-diabetic drugs. Accordingly, hypertensive patients were classified into four groups based on glucose metabolic status (criteria of World Health Organisation and American Diabetes Association 2003): (1) hypertensive patients with normal glucose (NG) regulation (70–99 mg/dl); (2) hypertensive patients with IFG; (3) hypertensive patients with IGT; and (4) hypertensive patients with DM 2.
Hypertensive subjects with NG were further divided into three groups according to glucose levels: (a) glucose concentration <80 mg/dl (N=103); (b) glucose concentration between 80–89 mg/dl (N=307) and (c) glucose concentration between 90–99 mg/dl (N=412).
Participants with coronary artery disease, severe heart valvular disease, cerebrovascular disease, peripheral artery disease and systemic inflammatory diseases were excluded from the study. Use of anti-inflammatory agents, including aspirin, statins and corticosteroids, as well as anticoagulants were also exclusion criteria for the study. Diabetics on insulin therapy were excluded from the study.
Body weight and height were measured in all subjects and body mass index (BMI) was calculated. Waist (W) and hip (H) circumference were measured with a tape and W/H ratio was calculated. Smoking status was assessed by recording the habit and duration of smoking (pack-years).
All participants gave their informed consent to participate in the study, which was approved by the Local Ethics Committee. Antihypertensive treatment started immediately after the completion of the full laboratory and arterial stiffness evaluation.
Arterial stiffness evaluation
Arterial stiffness was evaluated non-invasively by the measurement of carotid-femoral PWV. Carotid-femoral PWV, an established index of aortic stiffness, 4 was obtained using a validated non-invasive device (Complior®, Artech Medical, Pantin, France), which allows online pulse wave recording and automatic calculation of PWV. Two different pressure-waveforms were obtained simultaneously at two sites: the right carotid and femoral artery. The time delay (t) between the feet of the recorded proximal and distal waves was automatically calculated. For the carotid-femoral segment, the distance (d) was estimated by subtracting the distance between carotid location and sternal notch from the distance between sternal notch and femoral site. The mean PWV of at least 10 consecutive pressure waveforms was calculated for further analysis.
All measurements were conducted in the morning between 9 and 11 am, with the individual in a supine position, in a quiet environment. Participants were requested to abstain from tobacco, coffee and food at least 5 h and from alcohol 12 h before the examination.
Laboratory measurements
Blood samples were collected between 8 and 9 am with individuals in the supine position after an overnight fast, centrifuged at 3000 g for 30 min at 3°C and stored at -70°C. High-sensitivity C-reactive protein (hsCRP) and fibrinogen were measured by immunonephelometry (Dade Behring, Marburg, Germany). The intra- and inter-assay coefficient of variation (CV) for hsCRP was <4.4% and <5.7%, respectively, and for fibrinogen was 2.7 and 2.6, respectively. Homocysteine and fasting insulin levels were also measured with enzyme immunoassay (ELISA, Abbott, Tokyo, Japan), and insulin resistance was estimated by applying the homeostasis model assessment (HOMA-IR). Glycated haemoglobin (HbA1c) was measured in all subjects by column chromatography. Biochemical variables such as plasma glucose, triglycerides, total cholesterol and high-density lipoprotein (HDL) cholesterol were measured using standard techniques.
Statistical analysis
All continuous variables are presented as mean value ± 1 standard deviation.
Difference in baseline characteristics and arterial stiffness across the four metabolic groups was studied using analysis of variance (ANOVA). The difference in PWV values between groups was further evaluated after adjustment for age, gender, smoking, BMI, total cholesterol, heart rate and MAP with post-hoc analysis. Similar analyses were performed for the subgroups of normal glucose regulation. Pearson correlation was used for the association of baseline characteristics with PWV. HsCRP was log-transformed due to its skewed distribution.
Stepwise linear regression analysis was applied to test the independent association of glucose metabolism with PWV (dependent variable) after adjustment for several confounders, including age, gender, smoking, BMI, W/H ratio, total cholesterol, hsCRP, heart rate and MAP; in order to assess the association of different descriptors of glucose metabolism with PWV, we constructed four different models where the main independent variable was glucose metabolism group (as categorical variable) or glucose concentration (as continuous variable) or insulin resistance (by HOMA) or HbA1c, respectively. Exact p values <0.05 were considered as statistically significant. Data analysis was performed with SPSS software, version 10.0 (Chicago, IL, USA).
Results
Baseline characteristics of the four groups and their differences are shown in Table 1. As the glucose metabolic profile became worse, hypertensive patients exhibited higher SBP, higher levels of lipids and increased central obesity (Table 1). Moreover, HOMA and HbA1c followed the same trend. All inflammatory markers were gradually increased from individuals with normal glucose regulation to those with DM 2 (Table 1). Differences in baseline characteristics among hypertensive subjects with normal glucose regulation are presented in Table 2.
Baseline characteristics of the four groups of hypertensive subjects (N=1375).
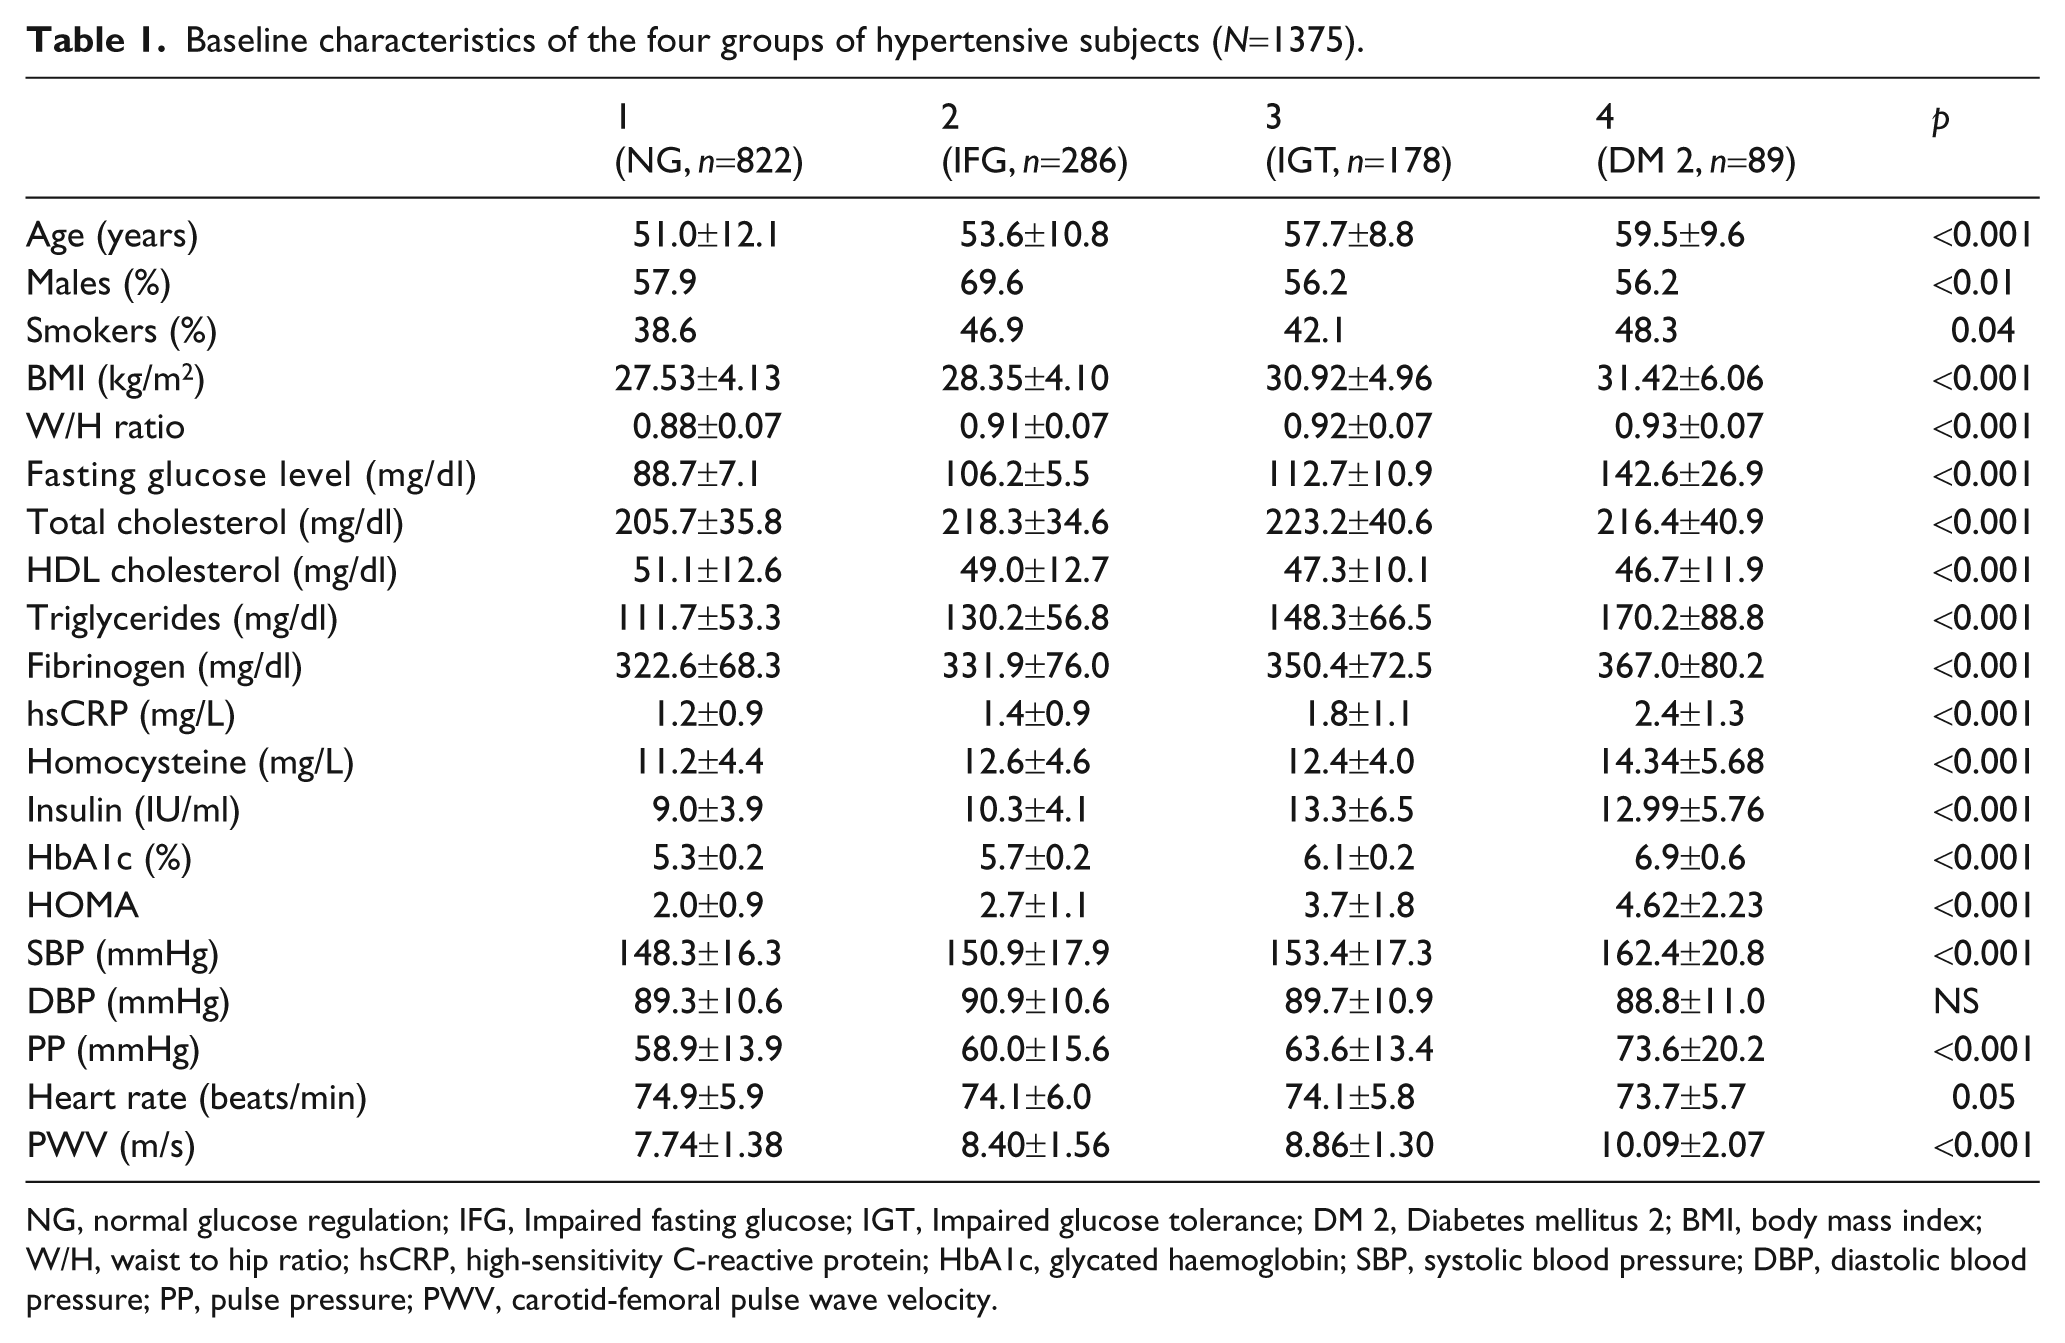
NG, normal glucose regulation; IFG, Impaired fasting glucose; IGT, Impaired glucose tolerance; DM 2, Diabetes mellitus 2; BMI, body mass index; W/H, waist to hip ratio; hsCRP, high-sensitivity C-reactive protein; HbA1c, glycated haemoglobin; SBP, systolic blood pressure; DBP, diastolic blood pressure; PP, pulse pressure; PWV, carotid-femoral pulse wave velocity.
Differences in baseline characteristics among hypertensive subjects with normal glucose regulation according to glucose levels.
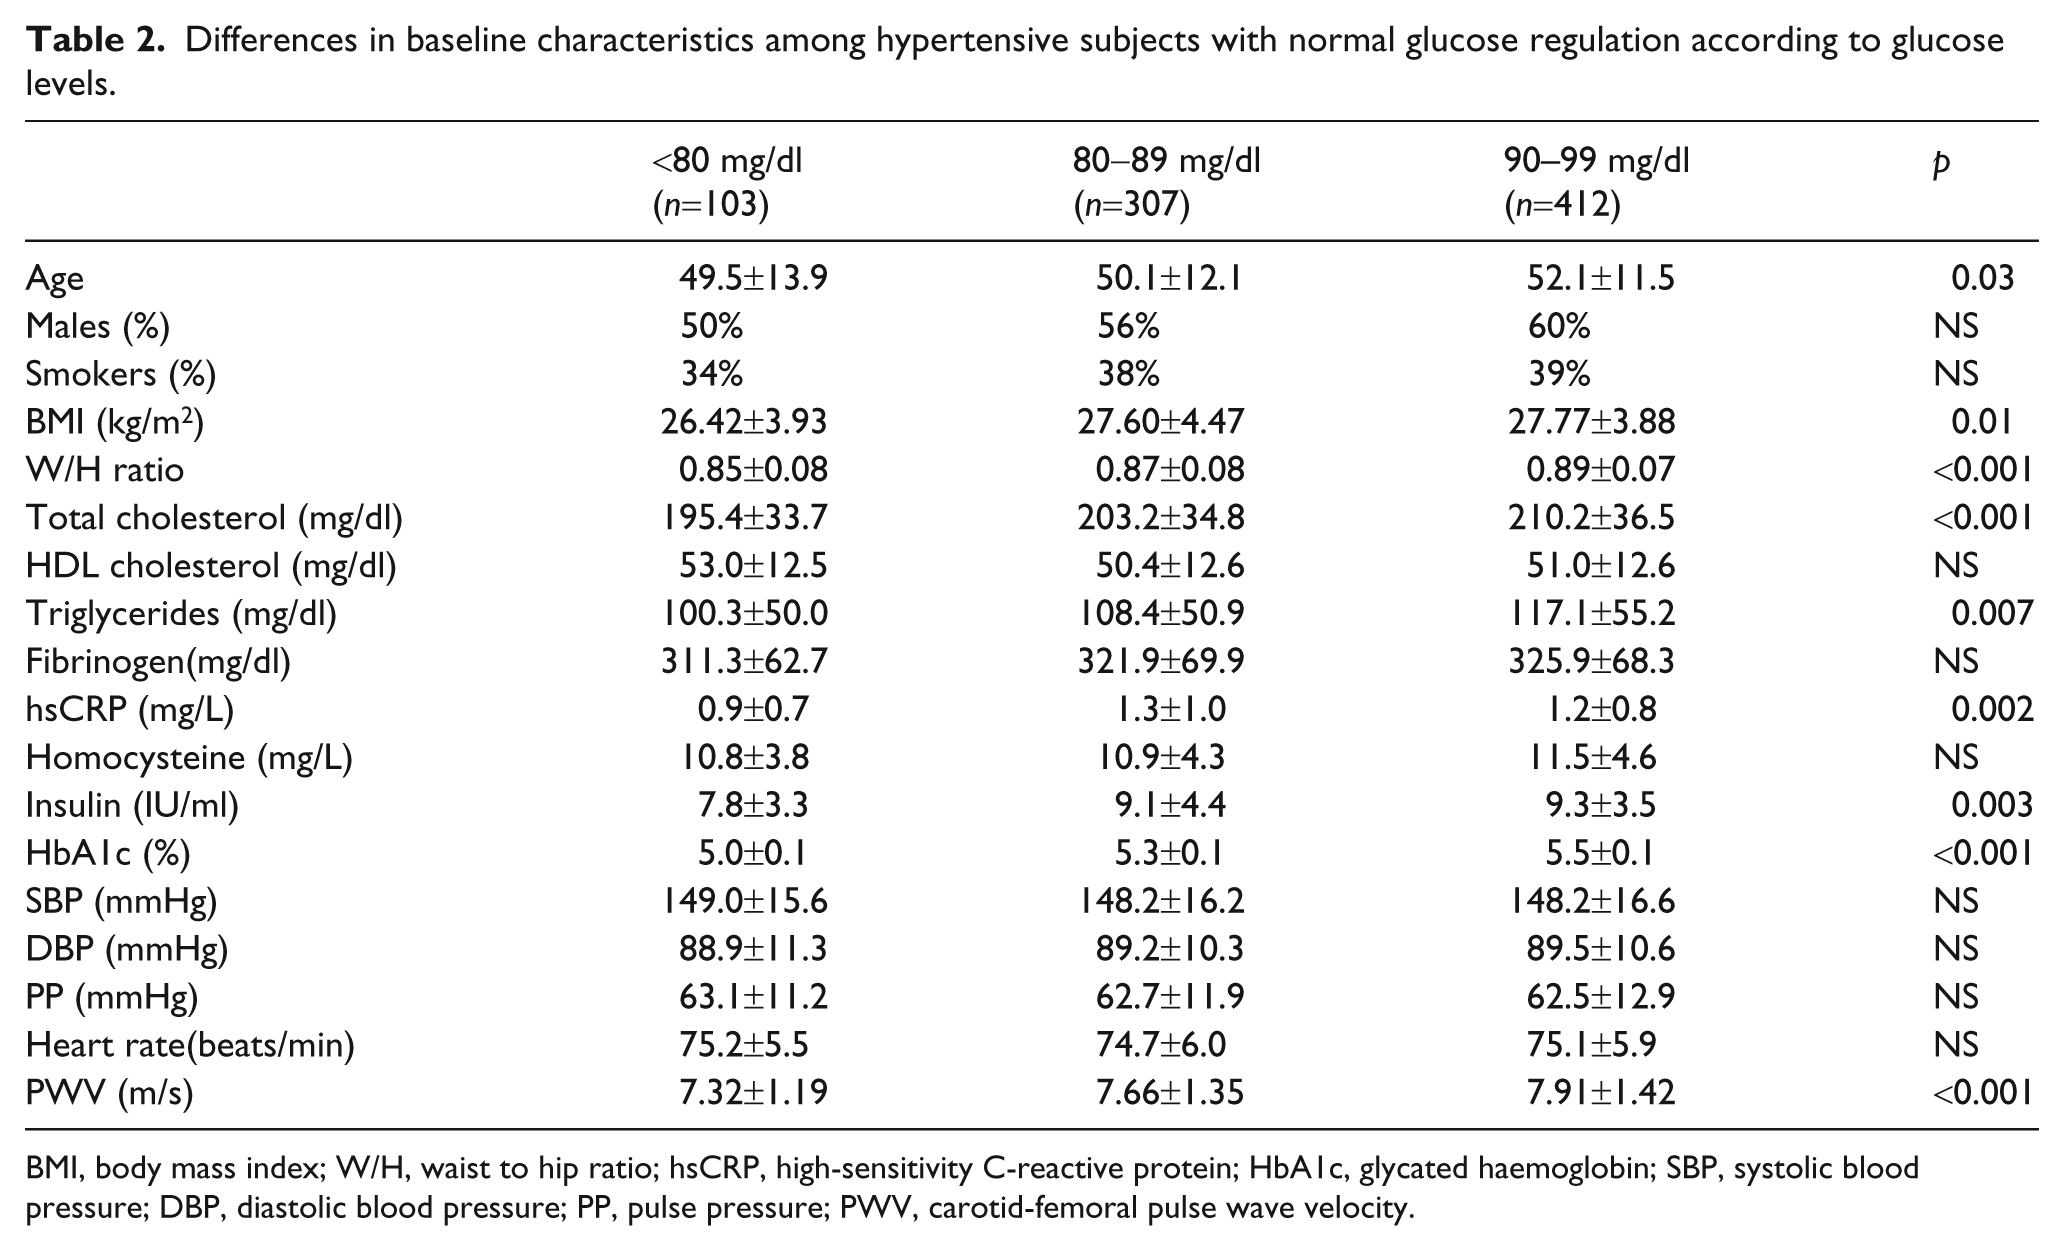
BMI, body mass index; W/H, waist to hip ratio; hsCRP, high-sensitivity C-reactive protein; HbA1c, glycated haemoglobin; SBP, systolic blood pressure; DBP, diastolic blood pressure; PP, pulse pressure; PWV, carotid-femoral pulse wave velocity.
In univariate analysis, PWV was associated with age (r=0.41, p<0.001), BMI (r=0.22, p<0.001), W/H ratio (r=0.22, p<0.001), SBP (r=0.43, p<0.001), HDL cholesterol (r=-0.11, p<0.001), triglycerides (r=0.19, p<0.001), hsCRP (r=0.39, p<0.001), homocysteine (r=0.31, p<0.001), fasting glucose level (r=0.36, p<0.001), insulin levels (r=0.29, p<0.001) and HbA1c (r=0.42, p<0.001).
After ANOVA, PWV showed a significant increase from hypertensive subjects with normal glucose regulation to those with diabetes. The difference in PWV between groups remained significant even after adjustment for age, gender, smoking, BMI, total cholesterol, MAP and heart rate. Pairwise comparisons (post hoc analysis) showed significant differences in PWV between any combination of groups (p<0.001 for all) which remained significant even after adjustment was made, except for the difference between group 2 (IFG) and group 3 (IGT), which became non-significant (Figure 1).
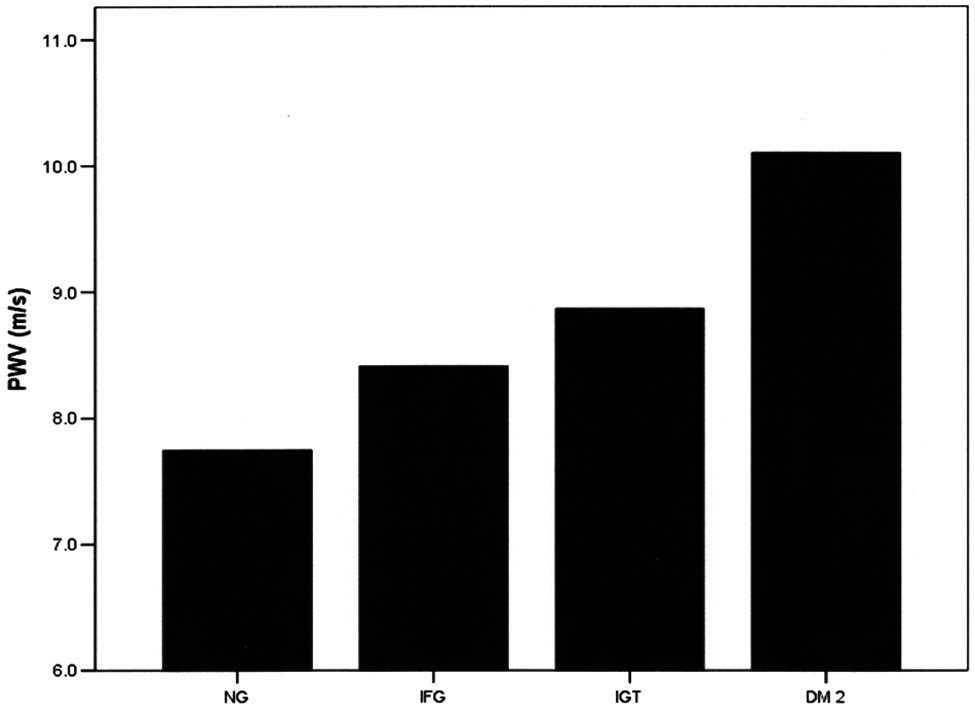
Difference in PWV values across the four groups of glucose metabolism in 1375 never-treated hypertensive patients, after adjustment for age, gender, smoking, body mass index (BMI), total cholesterol, heart rate and mean arterial pressure (MAP).
Among hypertensive patients with normal glucose regulation, there was an increase in PWV from subjects with low normal glucose levels to those with high normal levels (Table 2). In post hoc analysis, after adjustment, a significant difference in PWV observed between hypertensive subjects with glucose concentration <80 mg/dl and those with glucose levels between 80–89 mg/dl (p=0.03) and 90–99 mg/dl (p=0.002), respectively (Figure 2). No significant difference emerged between hypertensive patients with glucose levels between 80–89 mg/dl and 90–99 mg/dl (p=NS) (Figure 2).
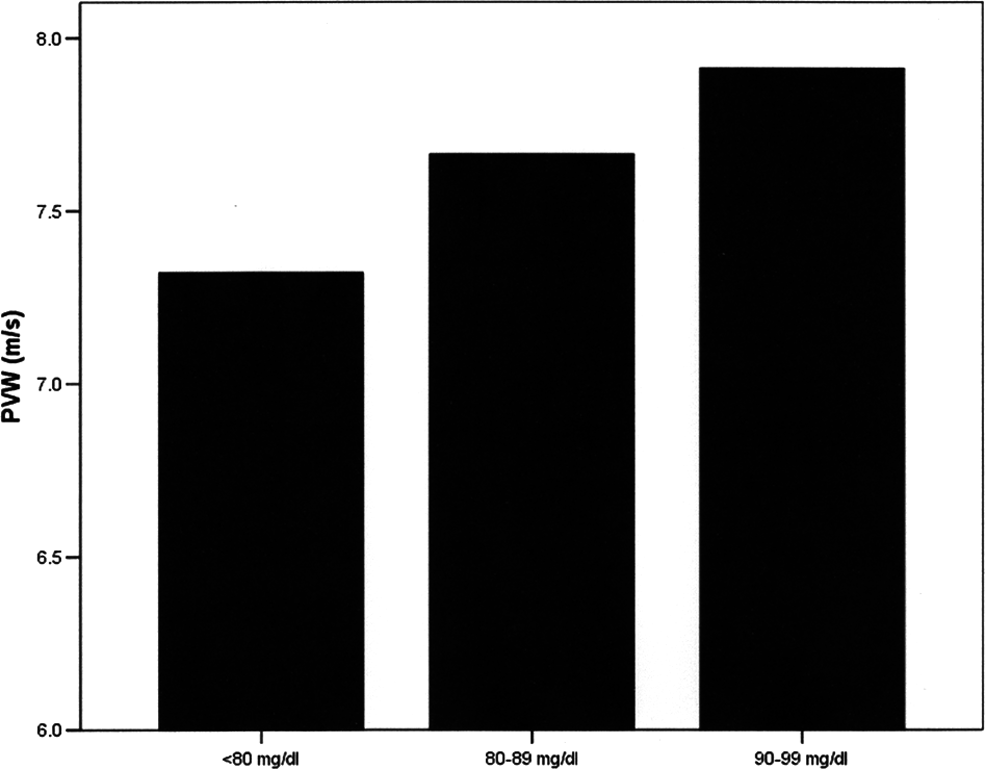
Difference in pulse wave velocity (PWV) values among hypertensive patients with normal glucose metabolism according to glucose levels, after adjustment for age, gender, smoking, body mass index, total cholesterol, heart rate and mean arterial pressure.
After stepwise linear regression analysis, in the whole population, an independent relationship established between PWV and all glucose metabolic parameters including glucose metabolism group, fasting glucose concentration, HOMA and HbA1c in four different regression models (p<0.001 for all, Table 3) after adjustment for age, gender, smoking, BMI, W/H ratio, total cholesterol, hsCRP, heart rate and MAP.
Four different models of stepwise linear regression analysis showing the association of PWV (dependent variable) with glucose metabolism group (as categorical variable) or fasting glucose concentration (as continuous variable) or HOMA or Hba1c, respectively, after adjustment for age, gender, smoking, BMI, W/H ratio, total cholesterol, hsCRP, heart rate and MAP in the whole study population. The beta coefficient with its p value, the R 2 and the R 2 change of all the independent variables entering sequentially in each model, are presented in the Table.
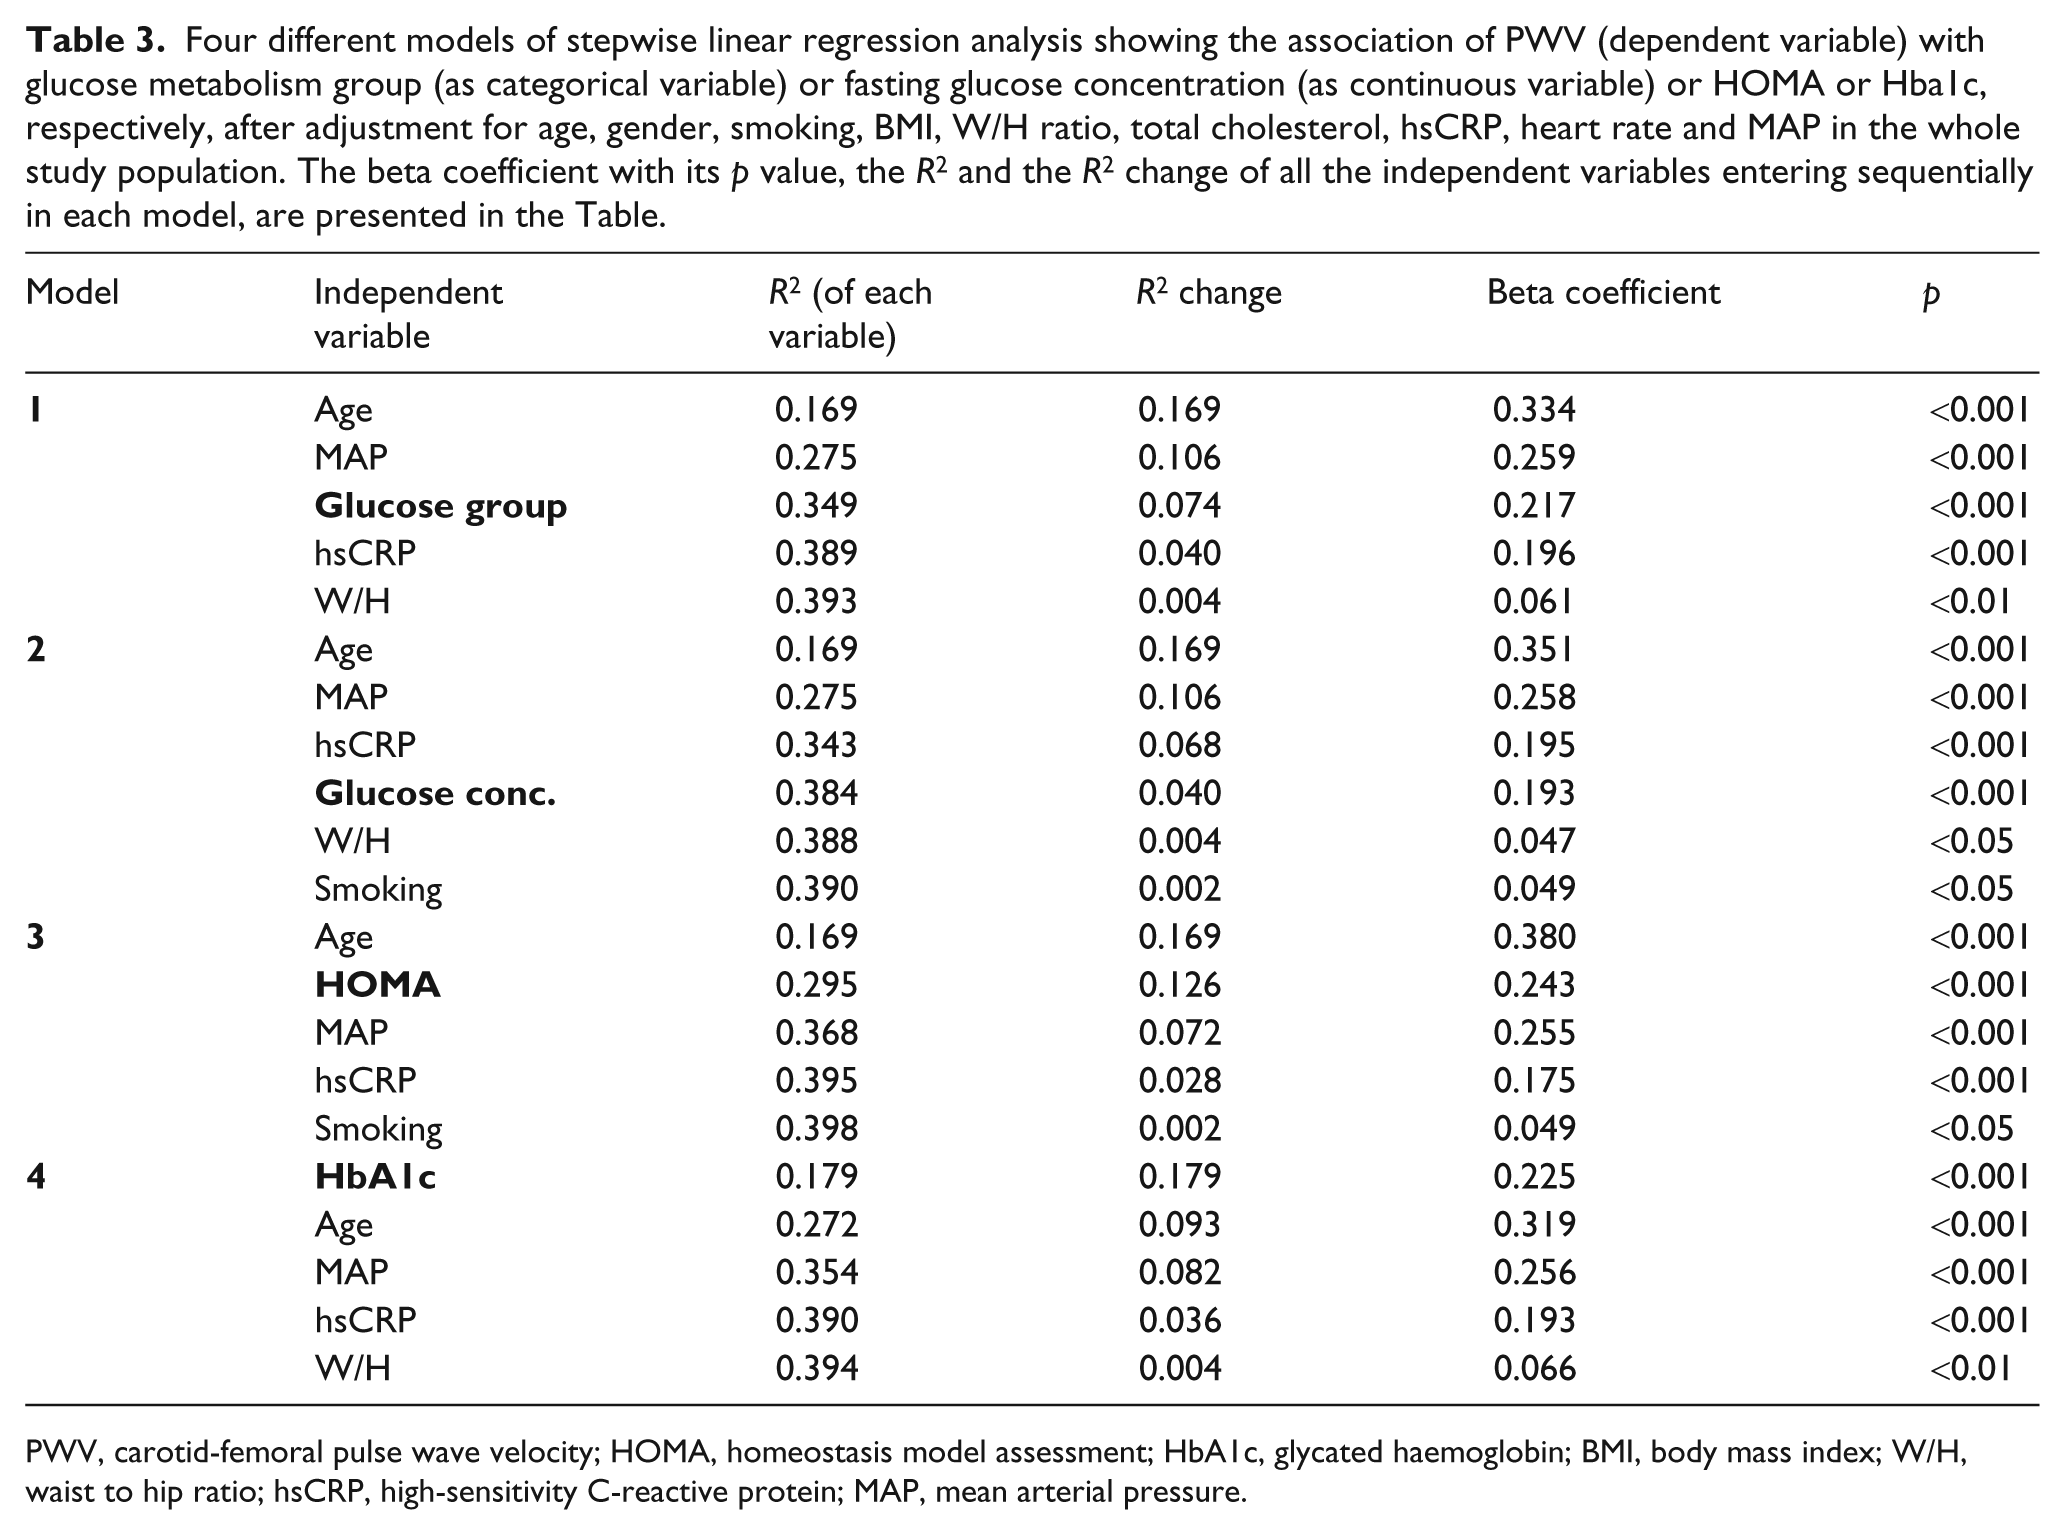
PWV, carotid-femoral pulse wave velocity; HOMA, homeostasis model assessment; HbA1c, glycated haemoglobin; BMI, body mass index; W/H, waist to hip ratio; hsCRP, high-sensitivity C-reactive protein; MAP, mean arterial pressure.
Discussion
The present study is a large-scale study in hypertensive population, showing that as the glucose metabolism deteriorates, there is a significant increase in arterial stiffness across all levels of abnormal glucose metabolism. Moreover, for the first time to our knowledge, we showed that arterial stiffness may alter even among hypertensive subjects with normal glucose regulation, given that individuals with high normal glucose concentration exhibited higher PWV values compared with those with low normal glucose concentration.
Data on the relationship between arterial stiffness and abnormal glucose metabolism are inconsistent. Although previous large studies in the general population have shown that as the glucose metabolism becomes abnormal there is an increase in arterial stiffness, 5,7,8 other studies have concluded different results. Indeed, a recent study showed no difference in mean PWV between subjects with impaired glucose metabolism (IFG/IGT) and diabetic patients. 11 Moreover, IFG and IGT have been related to increased arterial stiffness in the general population, 7,8 but not in specific populations as well; indeed, in hypertensive subjects, PWV did not differ between subjects with normal fasting glucose and those with IFG. 9 In addition, elderly people with IFG had increased arterial stiffness, comparable with that of diabetic patients, but younger individuals with IFG did not differ from those with normal fasting glucose, 12 indicating that advanced age might serve as a possible contributor to the relationship of arterial stiffness with IFG. In the present study we confirmed an increase in arterial stiffness, from hypertensive patients with normal glucose regulation to those with IFG, IGT and DM 2. Patients with hypertension and DM 2 exhibited the highest values of PWVc-f but, interestingly, after adjustment for several confounders no statistical difference emerged in arterial stiffness between hypertensive subjects with IFG and IGT.
Arterial stiffness and glucose metabolism
Many pathophysiological mechanisms might explain the results of our study. The constantly increased insulin concentration in conditions of abnormal glucose metabolism might contribute to the gradual increase in arterial stiffness. In healthy individuals, insulin amplifies endothelium-dependent vasodilation through increase in nitric oxide (NO) availability. 14 Moreover, experimental data on healthy subjects showed that insulin infusion diminishes wave reflections via arterial vasodilation. 15 However, the favourable effect of insulin on the vasculature may be abrogated in insulin resistance states, in which high circulating insulin levels are thought to enhance smooth muscle cell proliferation and endothelial dysfunction, 16,17 thus accelerating the stiffening within the arterial wall. Although insulin resistance is often associated with abnormal lipid metabolism and hypertension, and one might argue that those two traditional cardiovascular risk factors may explain the increase in arterial stiffness associated with insulin resistance, the relationship of insulin with PWV in the present study was independent of those two potential confounders.
Another possible mechanism that may partly contribute to the increased arterial stiffness as glucose metabolism deteriorates is inflammation. The increase in the levels of all inflammatory markers measured in our study, for example hsCRP, fibrinogen and homocysteine followed the same trend as that of glucose levels across the four groups. Many studies, both in healthy individuals 18 and hypertensive subjects 19 have demonstrated an independent positive association of hsCRP with PWV, and an aetiological, through a cause-and-effect, relationship between inflammation and PWV has also been proposed. 20 Pathophysiologically, hsCRP may unfavourably affect arterial function since it acts on smooth muscle cells by upregulating angiotensin type I receptor, stimulating the migration and proliferation of smooth muscle cells and enhancing the production of reactive oxygen species. 21 Nevertheless, in the present study, the relationship of glucose status with PWV was independent of hsCRP, a finding that supports the notion that inflammation may have a less pivotal role than hyperglycaemia per se on impaired arterial function. Future studies are needed to confirm this observation.
Clinical implications – limitations
The adverse prognostic role of arterial stiffness has been demonstrated by several longitudinal studies. 22 A stiff aorta increases left ventricular afterload, induces left ventricular hypertrophy and disturbs diastolic coronary perfusion, thus unbalancing coronary perfusion/myocardial demand equilibrium and enhancing cardiovascular disease. Given that the gradually deteriorating glucose metabolism results in gradual increase of arterial stiffness in hypertensive subjects, aims should be towards closer monitoring of glucose levels in this population. Whether intensive glucose treatment would benefit hypertensive patients with IFG or IGT is largely unknown. Similarly, as recent data in diabetic patients have shown, the optimum glucose level that should be achieved in order to prevent cardiovascular events is still unclear. 3,23
The present study is a cross-sectional study, and thus no causal relationships between arterial stiffness and abnormal glucose metabolism can be inferred. Moreover, the lack of healthy controls might be considered as a possible limitation of the study.
Conclusion
The present study is the first large-scale study in a never-treated hypertensive population demonstrating an unfavourable effect of gradually deteriorating glucose metabolism on arterial stiffness. Moreover, for the first time, we have shown that differences in PWV exist even among hypertensive patients with normal glucose metabolism, since hypertensive subjects with high normal glucose levels exhibited higher PWV compared with those with low normal glucose levels.
Footnotes
This research received no specific grant from any funding agency in the public, commercial, or not-for-profit sectors.
None declared.