
Abstract
Introduction
A consensus conference of the American Diabetes Association (ADA) has recently evaluated the natural history of states of prediabetes, including impaired fasting glucose (IFG), and concluded that they are ‘associated with a modest increase in the hazard ratio’ of cardiovascular disease (CVD). 1 However, the relationship between prediabetes and CVD remains a somewhat controversial issue. For example, a recent meta-analysis 2 concluded that ‘impaired fasting glucose status did not significantly improve metrics of vascular disease prediction when added to information about several conventional risk factors.’ On the other hand, a recent invited commentary in Diabetes Care stressed the importance of postprandial, versus fasting hyperglycaemia, in the genesis of CVD. 3 There is no simple solution to these contrasting points of view. However, it could be speculated that the CVD risk associated with IFG may extend beyond a modest elevation of fasting plasma glucose concentration. In addition, the oral glucose tolerance test may not provide an accurate view of daylong plasma glucose and insulin concentrations that occur in response to meals.
To address these issues, we compared insulin action and insulin response to mixed meals in individuals with normal fasting glucose (NFG) and impaired fasting glucose (IFG).The major goal of the study was to gain additional insight into the pathophysiology of IFG by comparing daylong postprandial plasma glucose and insulin responses to mixed meals in these two experimental groups under conditions which more closely mimic ‘real life’ as compared to changes seen after an acute oral glucose load.
Patients and methods
The experimental population consisted of 182 women and 107 men who had responded to newspaper advertisements describing our studies of glucose and insulin metabolism. Volunteers had a normal medical history, physical examination, and laboratory values. Stanford University’s Human Subjects committee approved the study protocols, and subjects gave written informed consent. Volunteers were divided into two groups based on their fasting plasma glucose (FPG) concentration: NFG (< 5.6 mmol/l) and IFG (≥ 5.6 and <7.0 mmol/l).
Insulin suppression test
The ability of insulin to dispose of an intravenous glucose challenge was quantified by a modified version 4 of the insulin suppression test.5,6 Following an overnight fast, an intravenous catheter was placed in one arm for a 180-min infusion of octreotide (0.27 µg/m2/min), insulin (32 mU/m2/min), and glucose (267 mg/m2/min). Plasma glucose and insulin concentrations were measured at 150, 160, 170 and 180 min, and averaged to obtain the steady-state plasma glucose (SSPG) and insulin concentrations. Since steady-state insulin concentrations were comparable in all individuals, and the glucose infusion identical, SSPG concentration provided an estimate of insulin action; the higher the SSPG concentration, the more insulin resistant the individual. Estimates of insulin action with the insulin suppression test are essentially identical to those obtained using the hyperinsulinaemic, euglycaemic clamp method. 5
Meal profile
After an overnight fast, plasma glucose and insulin concentrations were determined before and at hourly intervals after breakfast (20% of daily calories at 0800) and lunch (40% of daily calories at 1200). 7 Each meal contained 15% protein, 43% carbohydrate and 42% fat.
Statistical analyses
Demographic and metabolic characteristics of the NFG and IFG groups were compared by the independent samples t-tests. Plasma insulin and glucose concentrations were measured at multiple time points throughout the day, before and after meals. For each of these endpoints, a multivariate analysis of variance (MANOVA) model was used with group (two levels) as a between-subjects factor and time as a within-subjects factor. One-way ANOVA was then used to compare mean insulin and mean glucose values for NFG and IFG at each time point. Lastly, total integrated daylong glucose and insulin responses (area under the curve, AUC) over the fasting values were calculated and compared by t-test. When parametric assumptions for linear models were not met (e.g. heteroscedasticity), non-parametric Mann–Whitney tests were used. All analyses were repeated separately by gender. For all statistical analyses, 0.05 alpha (two-tailed) was used to determine statistical significance.
Results
Table 1 presents demographic and metabolic characteristics of the experimental groups. Individuals with IFG were somewhat older and were more likely to be men. The two groups were not different in ethnicity or BMI. By selection, FPG concentrations were higher in the IFG group, associated with higher fasting plasma insulin concentrations. Finally, SSPG concentrations were also significantly higher in those with IFG.
Demographic and metabolic characteristics
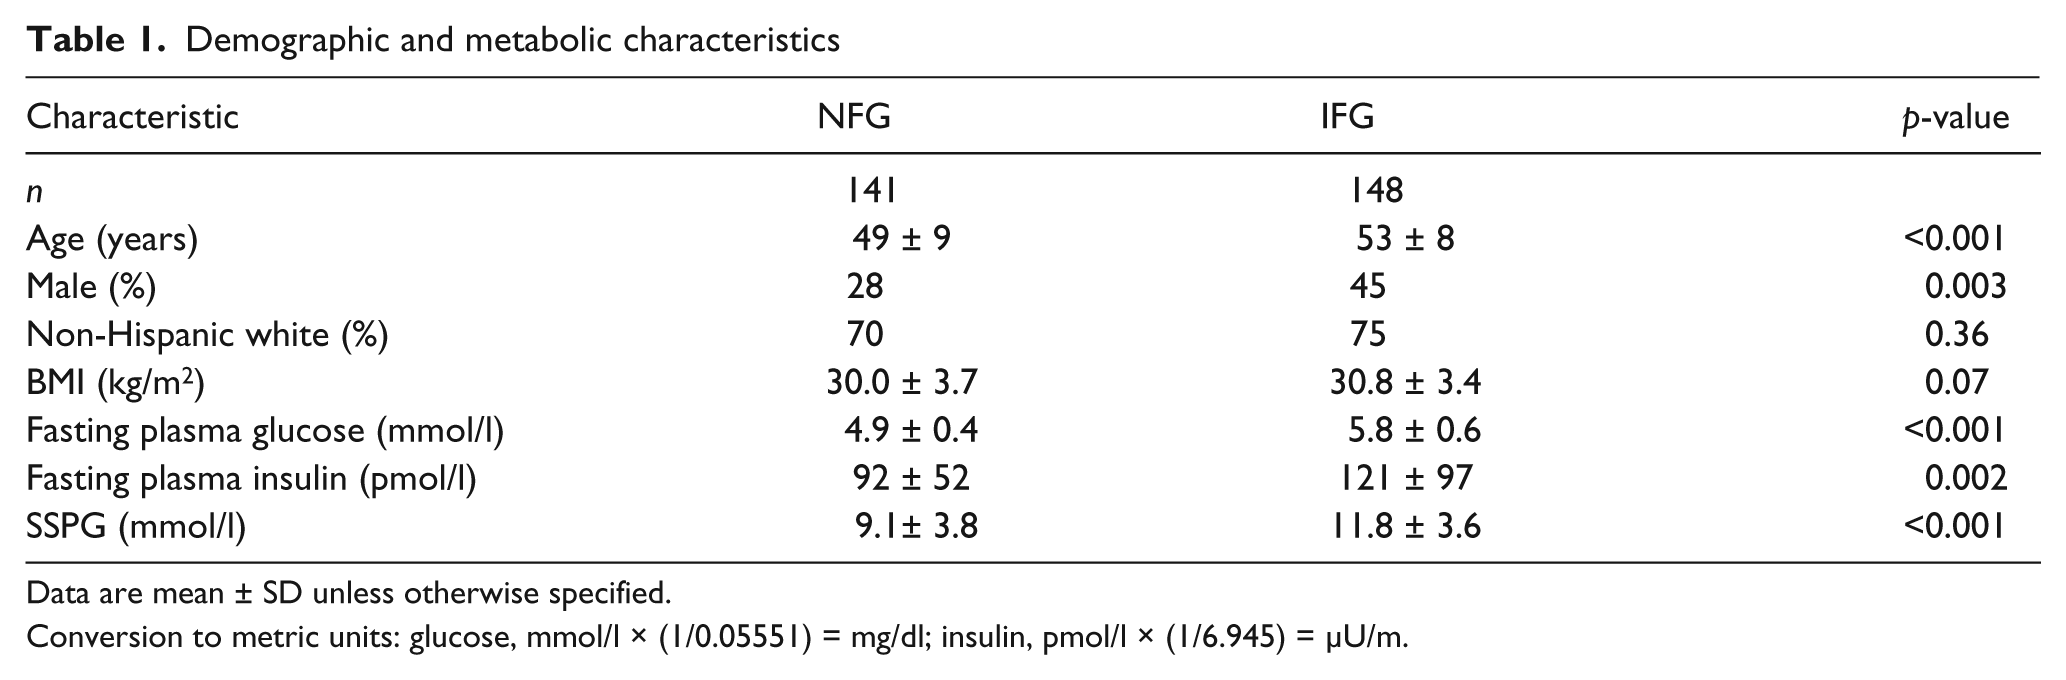
Data are mean ± SD unless otherwise specified.
Conversion to metric units: glucose, mmol/l × (1/0.05551) = mg/dl; insulin, pmol/l × (1/6.945) = µU/m.
Figure 1 depicts, by group, average plasma glucose and insulin concentrations at each hour before and after test mixed-meals from 08:00 to 16:00. The multivariate test indicated a statistically significant difference between the IFG and NFG group in mean glucose concentration over the time span of the meal profile test (Time × group interaction: Wilk’s lambda = 0.8; F-stat = 6.35; p < 0.001). Average hourly plasma glucose concentration (± SEM) was higher for the IFG group (6.4 ± 0.07 vs. 5.5 ± 0.04 mmol/l, p < 0.001). Similarly, the trajectory of mean insulin concentration over the meal profile test was different between the two groups (Wilk’s lambda value for the interaction = 0.92; F-stat = 3.02; p = 0.003). Finally, average hourly insulin concentration (± SEM) was higher (p < 0.001) for the IFG group (390 ± 20 vs. 278 ± 15 pmol/l).
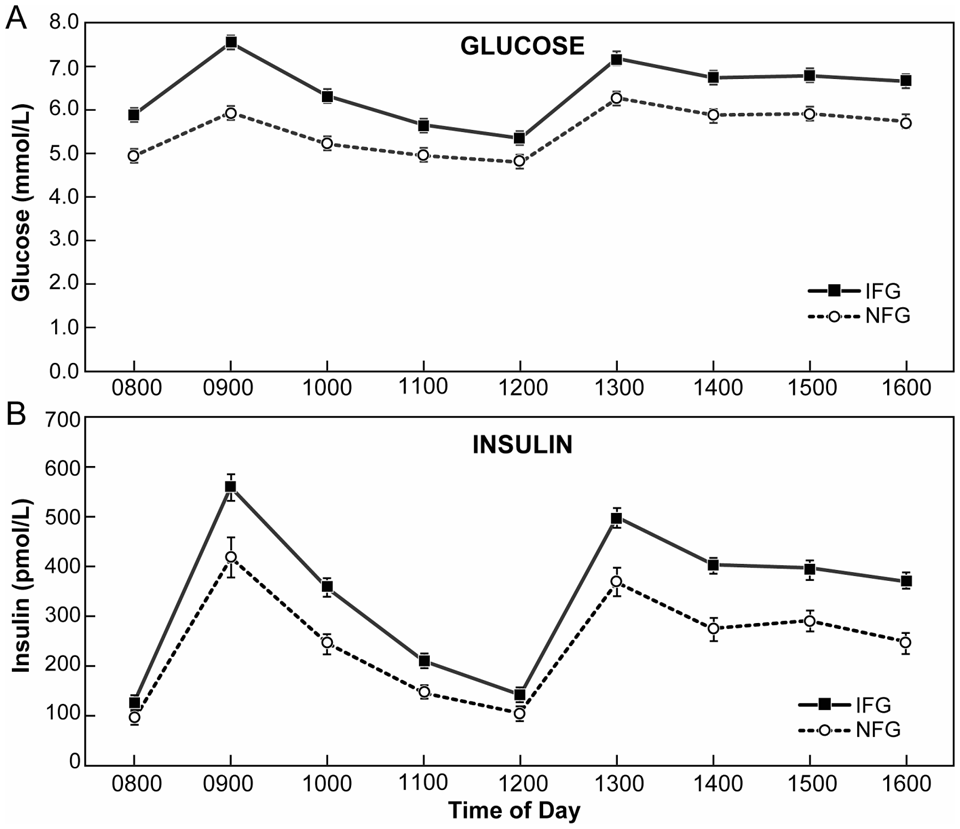
Mean (±SEM) plasma glucose (A) and insulin (B) concentrations measured at hourly intervals for 8 h before and after test mixed-meals consumed at 08:00 (20% of daily calories and 12:00 (40% of daily calories). Despite categorisation by glucose concentration, the NFG and IFG groups had similar integrated glucose response above fasting (p = 0.77). In contrast, the integrated insulin response above fasting was 44% greater (p < 0.001) in the IFG group compared with the NFG group.
Despite the difference in daylong plasma glucose concentrations in absolute terms, total daylong integrated glucose responses above fasting plasma glucose concentration in response to meals (mmol/l × 8 h) was almost identical (p = 0.77) in IFG and NFG groups, with AUC values of 4.6 ± 0.5 vs. 4.7 ± 0.3, respectively. In contrast, total daylong-integrated insulin response (AUC) above fasting was significantly greater in IFG subjects (2104 ± 125 vs.1459 ± 104 pmol/l × 8 h, p < 0.001).
When all analyses were repeated separately by gender, the results remained similar (data not shown). Therefore, although a greater proportion of men were likely to have IFG, both men and women with IFG displayed similar increases in insulin resistance and daylong insulin concentration when compared with their counterparts with NFG.
Discussion
Interpretations of the pathophysiological data regarding postprandial plasma glucose and insulin concentrations in patients with prediabetes have been based almost entirely upon measurements following an acute oral glucose challenge. We believe it was reasonable to question how closely those findings mimicked ‘real life’ conditions, and that the measurements of daylong plasma glucose and insulin concentrations to mixed meals may come closer to meeting that criterion than a pure glucose load. We are unaware of any publication in which this information has been gathered in such a large number of participants. As such, we also believe that our findings provide a somewhat different view of the metabolic abnormalities present in subjects with prediabetes, particularly as defined by IFG, than is commonly appreciated.
Perhaps the finding of greatest clinical importance is the difference in actual daylong plasma insulin concentrations in the NFG and IFG groups. It is clear from Figure 1 that plasma insulin concentrations are higher in absolute terms in subjects with IFG, both fasting and throughout the day in response to mixed meals. The discussion in the ADA Consensus Conference 1 emphasises the importance of ‘low insulin secretion’ in patients with prediabetes leading to the development of frank type 2 diabetes. Left unaddressed in this focus on the role of insulin secretion in the progression of prediabetes to diabetes is the clinical impact of the hyperinsulinaemia also found in this population. Previous studies have shown that hyperinsulinaemia is an independent risk factor for CVD.8,9 Thus, the conclusion that the insulin levels are not high enough to prevent elevations in plasma glucose concentration should not obscure the fact that hyperinsulinaemia in patients with IFG may increase their risk of CVD.
Returning to Figure 1, the general contour of daylong plasma glucose concentrations in response to mixed meals appears to be relatively similar in the two groups. The difference between them at 08:00 was 0.94 mmol/l, the greatest difference was at 09:00 (1.5 mmol/l), the least difference at 12:00 (0.56 mmol/l), and the average differences between 13:00 and 16:00 were essentially identical (~0.85 mmol/l). These findings are in contrast to data published in the ADA Consensus Conference 1 showing that plasma glucose concentrations during an oral glucose tolerance test differ dramatically between prediabetic and normal groups as a function of time after challenge. Put more simply, postprandial hyperglycaemia in IFG is quite different when viewed in the context of the response to mixed meals. No longer does it exhibit the peaks and valleys that characterise the changes following an acute 75g oral glucose challenge.
These data should be placed into context with the view that postprandial hyperglycaemia increases CVD risk in prediabetic individuals as the result of ‘oxidative stress’, which, in turn, induces endothelial dysfunction and inflammation.3,8 The inclusion of postprandial hyperglycaemia as a CVD risk factor in prediabetes is, to a large extent, based on the premise that the magnitude of the increases in plasma glucose concentration following meals approximates values observed during an oral glucose tolerance test.3,8 In contrast, data in Figure 1 demonstrate that the magnitude of postprandial hyperglycaemia is modest in IFG individuals, and essentially constant throughout the day. Furthermore, although Meier et al. 11 demonstrated in patients with impaired glucose tolerance (IGT) that plasma glucose concentrations at the 120-min interval during an OGTT and ‘during real life are correlated to some extent,’ they caution that ‘absolute levels of glycaemia greatly differ between both conditions.’ Given our data, and the findings of Meier and colleagues, 11 it seems reasonable to question the notion that dramatic increases in postprandial hyperglycaemia, per se, account for the increased CVD risk in prediabetes.
It should also be noted that patients with IFG appear to be more insulin resistant than individuals with NFG, a conclusion supported by two observations. At the simplest level, the ability of insulin to mediate disposal of an infused glucose load, as quantified by the insulin suppression test, was significantly lower (higher SSPG concentration) in the IFG group. This conclusion is consistent with the observation that the incremental glucose response to meals was not different in the two groups, whereas the incremental insulin response was significantly higher in those with IFG, suggesting that it took more insulin to dispose of the glucose load in those with IFG. Furthermore, results of a study of prediabetes, in which the designation of ‘insulin resistance’ was derived from previous outcome data, indicated that the majority of individuals with prediabetes were insulin-resistant (57% in subjects with isolated IFG, 76% with IGT, and 94% with combined IFG/IGT). 12
Finally, our finding that almost twice as many men had IFG than NFG is consistent with the greater prevalence of type 2 diabetes among men in the United Kingdom Prospective Diabetes Study. 13 Of interest in this context is evidence from rat and human studies that show that insulin-stimulated glucose uptake is decreased in adipocytes isolated from men versus women. 14 Nevertheless, while men appear more likely to develop fasting hyperglycaemia, the metabolic abnormalities once IFG has been identified appear similar between both men and women. In other words, regardless of gender, individuals with IFG were more likely to have higher degree of insulin resistance and daylong insulin concentration than individuals with NFG.
An obvious shortcoming of our study was reliance on fasting plasma glucose concentration for our definition of IFG, without performing the oral glucose tolerance tests that would permit us to have differentiated between isolated IFG, isolated IGT, and combined IFG/IGT. Although these distinctions would have provided added value to our findings, it seems unlikely that they would have changed the thrust of our findings. For example, individuals with isolated IFG and combined IFG/IGT would have maintained their classification as IFG even if we had performed an OGTT. However, the OGTT would have helped distinguish individuals with isolated IGT from the NFG population. Inclusion of individuals with IGT in the NFG group would result in higher plasma insulin response and degree of insulin resistance in the NFG group. Therefore, if anything, their inclusion in the NFG population underestimated the difference between individuals with NFG and IFG. Given these considerations, it seems unlikely that our inability to compare ‘pure’ NFG and IFG groups would substantially change the overall thrust of our findings. More to the point, it is most likely that the majority of clinicians identify patients as having prediabetes on the basis of measurement of fasting plasma glucose concentrations, and that our findings provide a reasonable ‘snap-shot’ of the clinical characteristics of this population.
Our results suggest that when studied under ‘real life’ conditions, metabolic changes in patients with IFG extend beyond a somewhat higher fasting plasma glucose concentration to include insulin resistance as well as baseline and daylong elevations of plasma glucose and insulin concentrations, without substantial peaks and valleys in postprandial glucose concentrations. The relationship between these metabolic characteristics and increased CVD risk in prediabetes requires further evaluation.
Footnotes
Acknowledgements
We would like to thank Karen Johnson, Stanford Visual Art Services for her help with figure design.
The research received no specific grant from any funding agency in the public, commercial, or not-for-profit sectors.
The authors have no conflicts of interest to declare.