
Abstract
This article complements Wlezien’s review of ‘conceptualisation, measurement and interpretation in representational research’ by considering how these operate within five predictive theories validated against comparative evidence, as recommended for cumulative research by Taagepera: and related to their wider institutional and methodological context by Budge. Methodologically, the article illustrates how predictive theories can be set up to explain political processes and validated against statistical evidence. Substantively, the theories both highlight and resolve the ‘Paradox of democracy’ – how can ideologically based political parties effectively match public policy to popular preferences with only weak guidance from citizens?
Keywords
Overview
The main mechanism linking government policies to popular preferences has traditionally been seen as purposive policy voting, to which political parties either adapt in general elections (Downs, 1957: 114–125) or provide clear choices for conferring a policy mandate (McDonald and Budge, 2005: 21). Both outcomes require voters to apply shared criteria to the same range of policy options if a clear collective preference is to emerge – assumptions analysed comparatively and found wanting (Budge et al., 2012; McDonald and Budge, 2005). They are subverted by the open-ended nature of general elections, where voters choose parties using many different criteria, not all policy-related (cf. Figure 1 below).
Recent theorising has accordingly replaced axiomatic policy-based assumptions with more realistic ones about how collective actors like parties and electorates behave. Doing so opens up the possibility of checking if the behaviours and outcomes they predict actually characterise representational processes wherever and whenever they occur. Their predictive success has therefore to be judged against comparable data from as many countries as possible. Comparative analysis factors out individual peculiarities, allowing us to generalise about representational processes as such rather than national variations on them.
Our discussion fleshes out these points by first examining voter decision making in general elections (Figure 1). The difficulties of linking private preferences to the public alternatives on offer are eased by political parties offering bundles of alternatives – ideologies, candidates, past record – only some of which relate to current policy. Policy comes into party choices and even dominates them at times, particularly with clear accountability (Wlezien, 2017a). Across countries and time however, a pure collective policy choice is not guaranteed.
This has prompted a larger claim (Achen and Bartels, 2016) that a match between popular preferences and government policy cannot be reliably secured by representational procedures. The argument here shows in contrast how party and policy alternation in government, under conditions generally produced by concurrent democratic processes, usually brings them together over time.
Alternation is the central representational theory we examine here. So it is introduced first, (Figures 2 and 3) – also as an example of how a predictive explanation can be set up and validated. The alternation model is then related to other predictive theories of processes influencing the conditions under which it can achieve representational congruence. One of them (the thermostatic model (Table 5)) describes other preference-policy interactions over time. The other three cover relevant behaviours affecting the preconditions for alternation to produce congruence over time (party factionalism: ideology: and bureaucratic incrementalism; Tables 2–4: Figure 4).
How Major Party Alternation in Government Relates Public Policy to Citizens’ Left-Right Preferences for it Over Time.
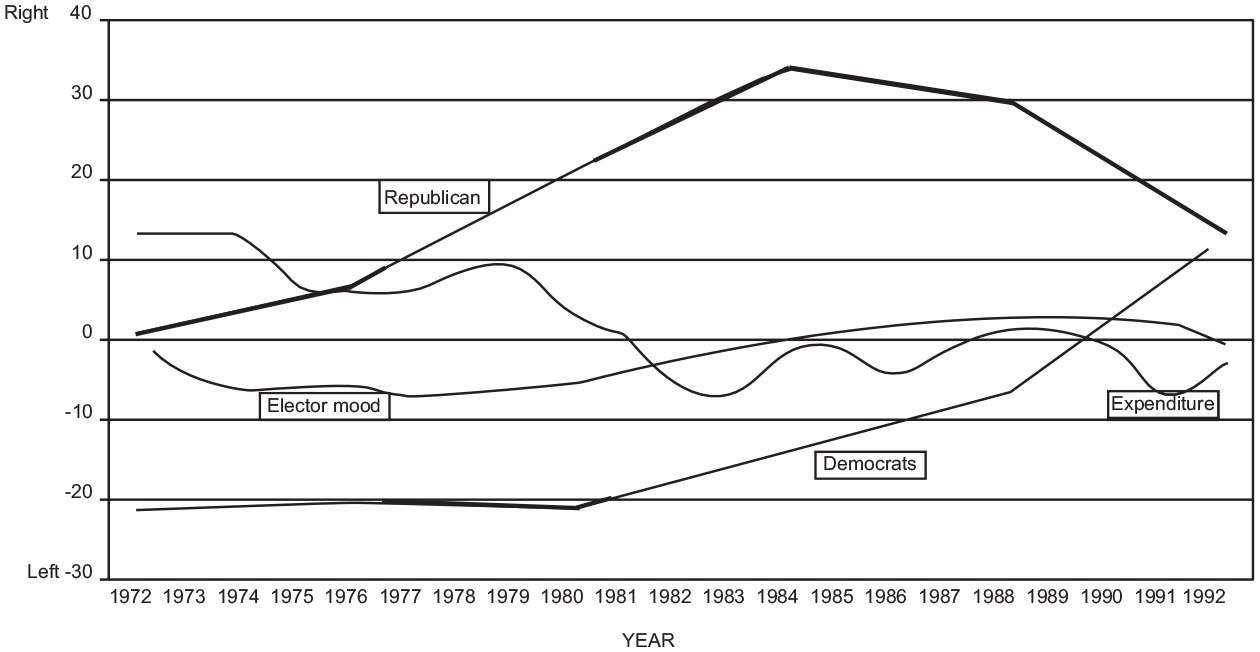
United States Relationship Between Elector Preferences, Party Policy Positions and Total Government Spending 1972–1992.
In combination with diffuse voter decision-making (Figure 1), the internal party squabbles, ideological rigidity and bureaucratic inertia these theories anticipate might seem to block governmental responsiveness to popular preferences altogether. This creates a need to show how the collective behaviours and processes specified in Tables 2–5 strengthen rather than weaken the preconditions for policy responsiveness through alternation. Relating them to each other more precisely within the general democratic context is therefore just as important as specifying them clearly in a comprehensive overview of representational processes (Figure 4).
The concurrent processes forming part of this ‘Big Picture’ are detailed in Tables 2–5, with supporting evidence for their specifications cited in the associated text. These all anticipate the overview of Figure 4 by showing in detail how the separate processes they describe affect governmental and policy alternation’s potential for producing representational congruence. Shared methodological assumptions underly all of them (Table 6). These have wider implications for political research which are briefly reviewed in conclusion.
Policy Voting and its Challenges
We start with a consideration of voter decision making. The difficulties of linking up what as an individual you really want with the public policies on offer are summarised in Figure 1. This illustrates how voters decide on their choices in a General or Presidential election. The central point the figure makes is that citizens have difficulty in making the translation between their perfectly clear private aspirations – centring on good service delivery and personal security (Box 1) – and the public alternatives on offer (Box 2). Help is provided by the political parties – directly, when they put forward general policy priorities (among other things) in general elections (Box 3), and indirectly, when the governments they form make specific proposals for policy change between elections and then implement them (Box 7). Both their election and inter-election initiatives ‘frame’ citizen preferences – that is, present electors with reasonably clear courses of action with which they can agree or disagree. 1 This enables some of the public to vote on general policies.
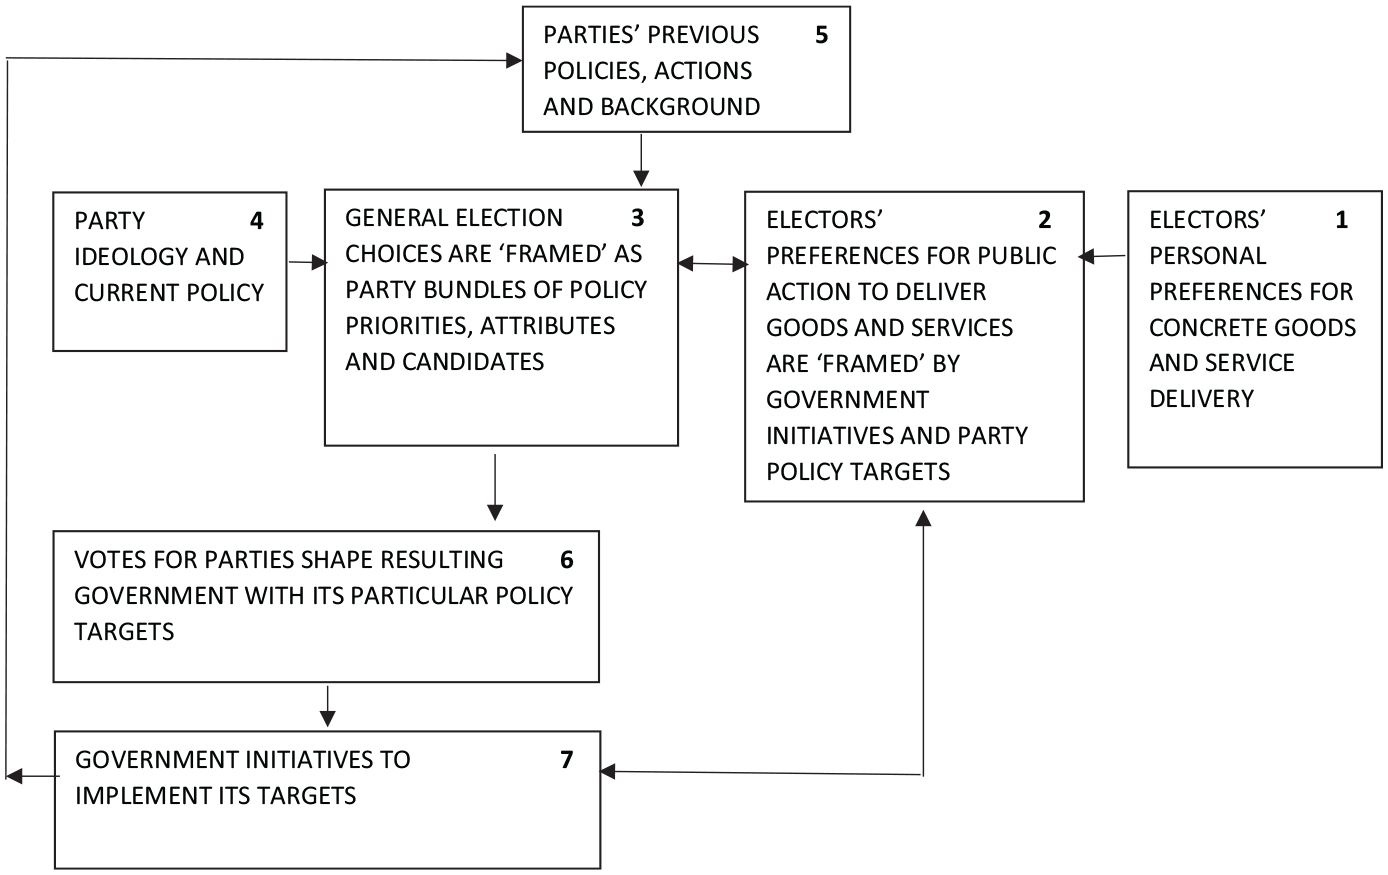
Schematic of How Electors’ Public Preferences are Formed in Elections and Between Elections.
Once governments are formed, they implement their ideological targets through specific proposals which often move back to policies in operation before the previous government started changing them. As moves are made to do this in specific policy sectors however, they lose marginal support and face opposition from beneficiaries of existing policies. Thus, a majority of the concerned electorate reacts ‘thermostatically’ against continuing government attempts to effect their targets (cf. Table 5 below).
This cycle of increasing support for the opposition and then decreasing support as it becomes the new government forms part of the ‘costs of governing’ through which government parties lose votes between elections. This vote loss then drives party and policy alternation in government.
The different party programmes, and government action to implement them, provide a concrete way for voters to express agreement or disagreement with policy priorities (Figure 1: Boxes 3, 7). In many ways therefore political parties are the major actors in elections – not just recipients of votes but defining what is to be voted on.
Besides policy options however, this extends to candidate appeals, party loyalties and situational factors such as scandals, wars and other crises, as well as perceived (often economic) competence. With all these considerations crowding in, many voters get confused between the alternatives on offer. So they give up on any detailed assessment of the issues at stake or of their consequences. Instead, they turn to ‘decision aids’ or shortcuts – means of assessing likely policy effects without going into detail about them. They may, for example, see all issues in terms of a general opposition between Left and Right and hence vote for a party and its policy programme because it has a progressive record (or alternatively a history of defending certain interests). These are among the ‘background factors’ in Box 5 of Figure 1. Major alternatives to figuring out the long-term effects of government and party proposals are to abandon policy concerns and choose a party because friends vote for it or its local candidate has more experience in areas of interest.
The factor which much research has seen as exerting a consistent policy effect on voters has been economic performance (inflation, unemployment and growth – cf. Palmer and Whitten, 1999, 2002; Stegmaier et al., 2021). However, there is considerable controversy about such effects (cf. Duch and Stevenson, 2008). The most comprehensive cross-national analysis of economic effects in 118 elections over 30 years (1960s to 1990s) shows no consistent effects on incumbent vote (McDonald and Budge, 2005: 96–105). The one clear effect was discovered in countries with single member district (SMD) voting under single party governments (and therefore clear accountability). High inflation was associated with four out of five of such incumbent parties being replaced.
Clear accountability (Powell, 2000: 175–200) probably contributes to Wlezien’s (2017a) finding of an economic effect on presidential tenure in the United States: and for some of the cumulative ‘thermostatic’ effects discussed below (Table 5) in policy areas where governments have more direct control. However, the United States is the purest example of two-party competition and single party government in the world. This limits our ability to extrapolate the finding to the majority of democracies without such clear accountability.
In general, therefore, General Elections seem to produce random results so far as policy is concerned. What they do produce is a fairly regular alternation of governments with different policy orientations (Cuzán, 2015, 2019). This opens the way for the effective long-term policy representation we consider in the next section.
Government Alternation
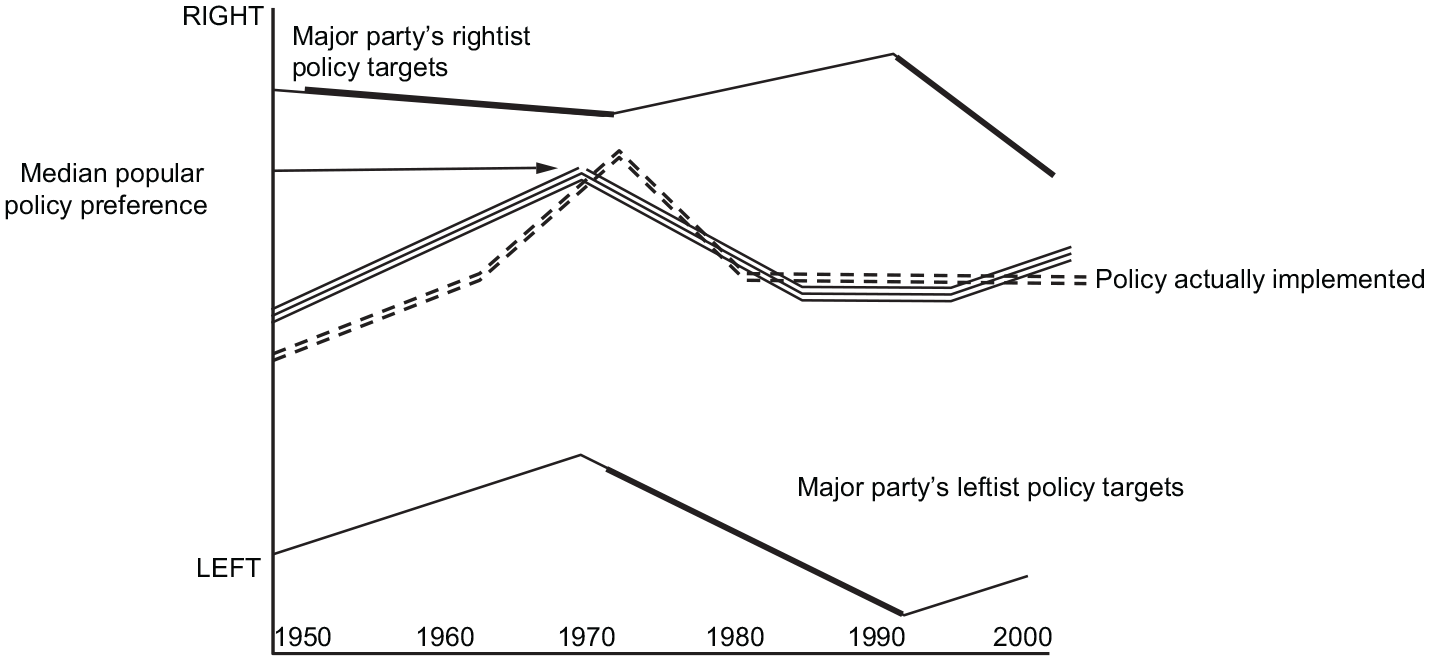
To properly understand the representational effects of government alternation, we have to distinguish between policy targets and the policies government and bureaucracy are actually implementing at any one time (Wlezien, 2017b). The two are often conflated as though a new government can change everything at a stroke. A moment’s reflection however shows that new policies can only be implemented well into an administration’s first term and then only partially put into effect. There are coalition and factional disagreements, legislative and administrative delays, contractual obligations, budgeting constraints, judicial challenges and popular hostility – all standing in the way of change (Baumgartner and Jones, 2009). In most areas, governments can only hope to move existing policy towards their targets at a slow rate of 10%–15% of the gap each year (Budge et al., 2012: 153–158). As new governments try to modify the general policy being implemented in line with their Leftist or Rightist targets, they move it across the centre where most electors locate (cf. Powell, 2000: 167–168: Figures 2 and 3 below).
Real policy changes then carry on towards the more extreme position the new government prefers. Before implemented policy moves too far from the centre however, a new election takes place which more often than not costs incumbents legislative seats, or control of the government altogether. Now a new party with opposing targets begins to reverse its predecessor’s policies. Over time, these alternating shifts leave applied policy oscillating around the centre of the policy spectrum, where the majority electoral preference generally lies.
Figure 2 illustrates this process schematically for Left-Right divisions over policy (but it could equally apply to single issues like financing Church schools). The majority or plurality parties which dominate most governments (McDonald et al., 2012; Sieberg and McDonald, 2011) have relatively extreme targets which they rarely have enough time or freedom to effect fully (periods when they are in government are shown by thicker sections of their policy lines). By trying to do so however, they keep implemented policy oscillating around the position of the median elector, the best summary measure of citizens’ collective preference (Budge et al., 2012: 212–215). Of course, oscillation over this centre will only occur if the two major parties’ policy targets fall on either side of it, thus ‘bracketing’ the median elector position. This is the case in most democracies as electors’ preferences will naturally spread out between the policy positions parties provide as part of the framework for choosing between them.
Alternation thus shifts the focus of representational theorising from congruence between preferences and (declared) government policy in each election, to how the electoral process brings about a dynamic correspondence between the public policies actually implemented and collective preferences for them. The prerequisites for doing so – illustrated in Figure 2 – are the following:
Regular alternation of the major parties in government with relatively rigid, opposing, policy targets
A slow rate of implemented policy change
Party ‘bracketing’ of the median citizen policy preference
Limited distancing between party policy targets
In combination, these preconditions prevent implemented policy moving too far from the centre at any point in time. They do not require parties to trade policy positions for votes (Downs, 1957: 115–118) – creating confusion and mistrust by doing so (as actually recognised by Downs, 1957: 109–113). Nor do they unrealistically ignore the open-ended nature of General Elections, where many factors other than policy also affect voting choices and outcomes (Achen and Bartels, 2016: cf. Figure 1 above). All that is required is that – under all the preconditions just specified – they regularly alternate parties with opposing policy positions and priorities in government. As Table 1 shows this is generally what they do.
Government Policy Alternations in 17 Post-War Democracies After General Elections 1945–2012.
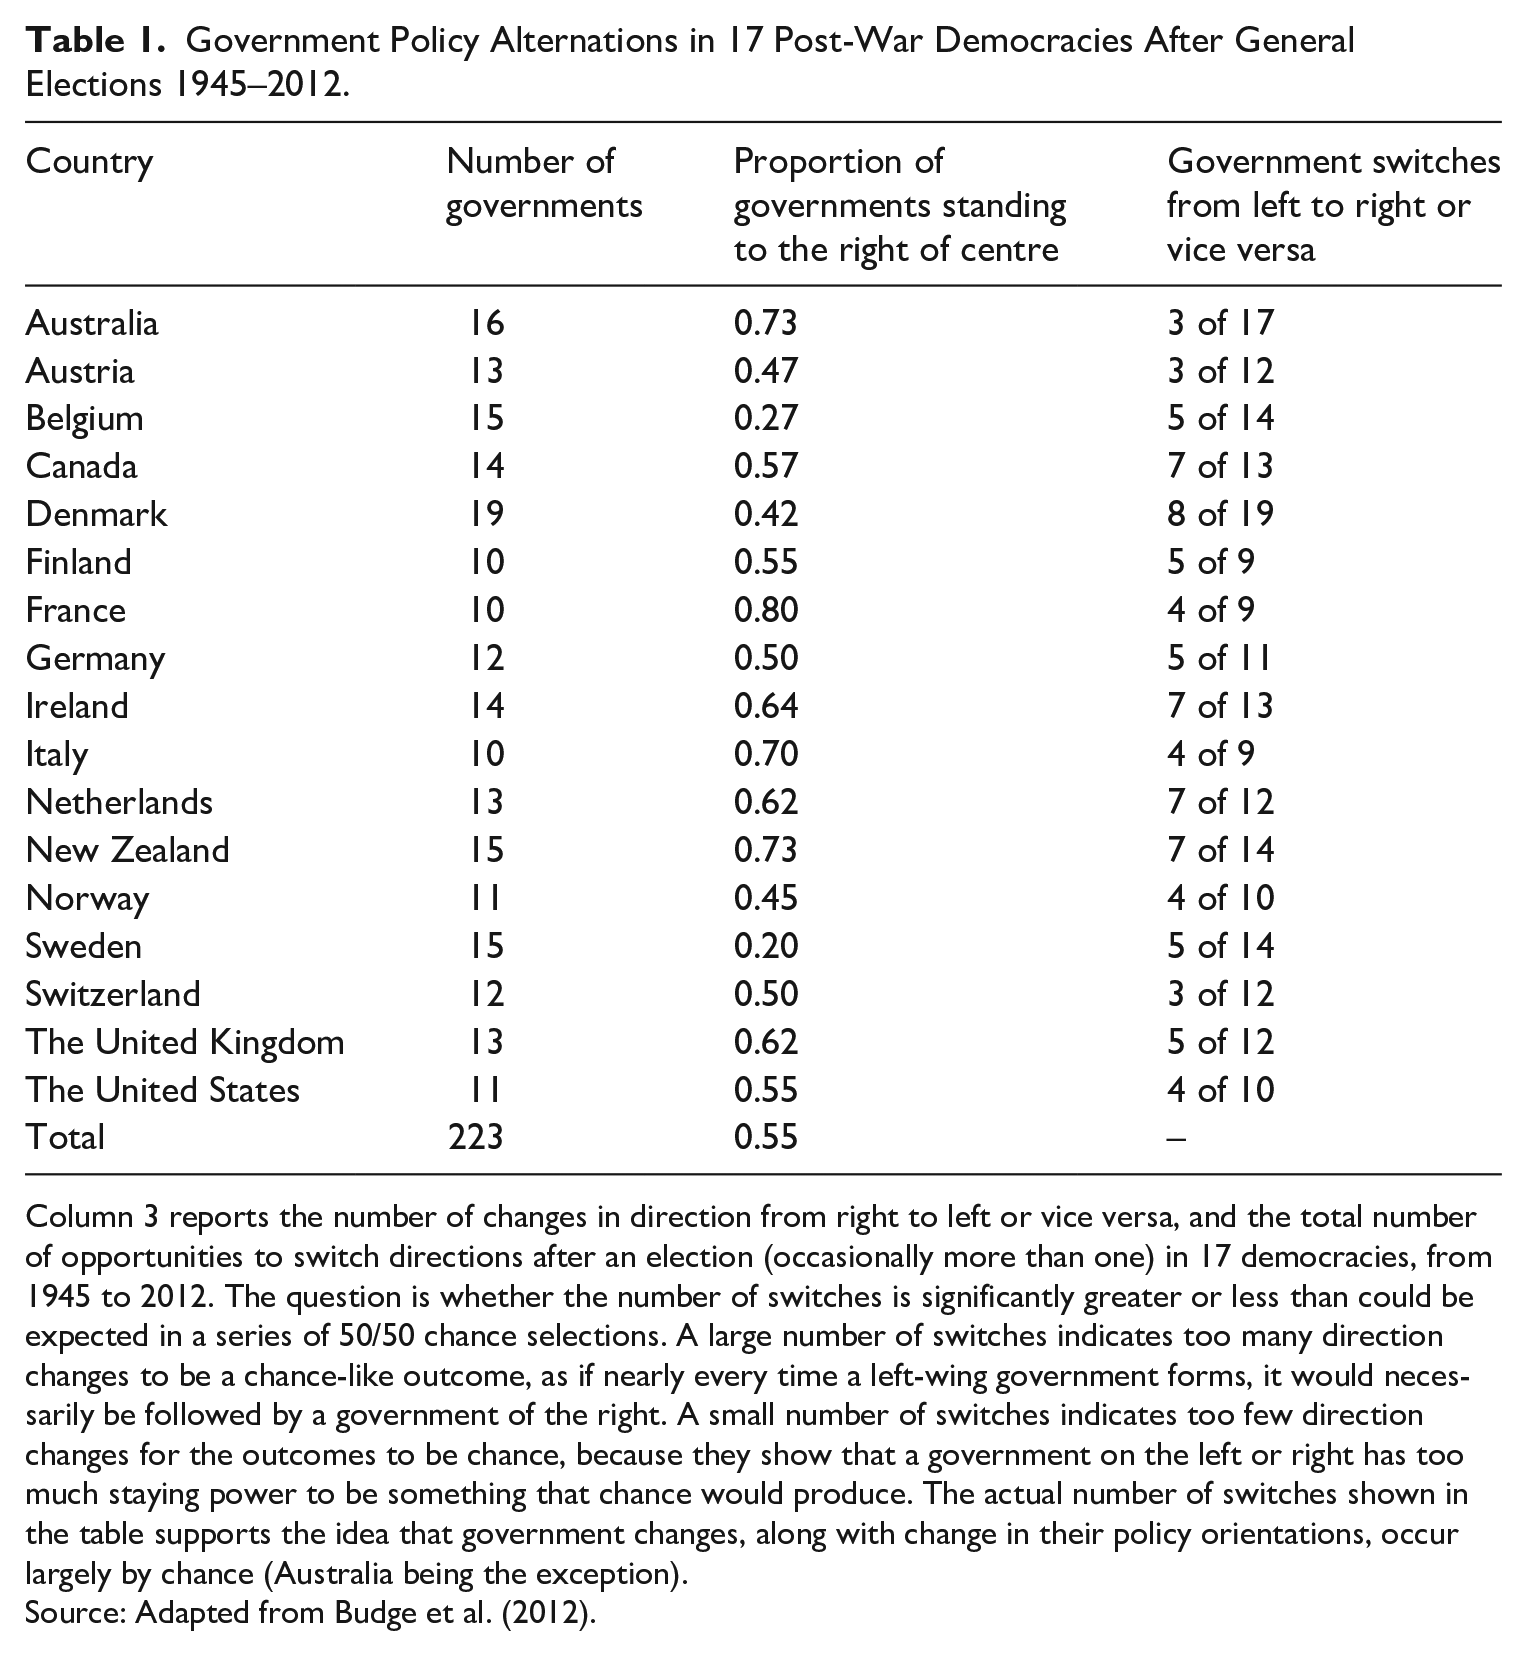
Column 3 reports the number of changes in direction from right to left or vice versa, and the total number of opportunities to switch directions after an election (occasionally more than one) in 17 democracies, from 1945 to 2012. The question is whether the number of switches is significantly greater or less than could be expected in a series of 50/50 chance selections. A large number of switches indicates too many direction changes to be a chance-like outcome, as if nearly every time a left-wing government forms, it would necessarily be followed by a government of the right. A small number of switches indicates too few direction changes for the outcomes to be chance, because they show that a government on the left or right has too much staying power to be something that chance would produce. The actual number of switches shown in the table supports the idea that government changes, along with change in their policy orientations, occur largely by chance (Australia being the exception).
Source: Adapted from Budge et al. (2012).
From Theory to Practice
That is the theory. Figure 3 illustrates how it works out in practice in the United States (Budge et al., 2012: 160–163). Party policy targets are mapped in Left-Right units on the basis of their Presidential Election Platforms, as reported in the Comparative Manifestos data-set (https://manifesto-project.wzb.eu/). Policy Mood (a measure of popular preferences over time; Stimson, 1999) and total Government expenditures have been transformed into Left-Right units for comparability (as described in the Notes to the Table and detailed in Budge et al., 2012: 142, 160–163). Note that when the expenditure line goes up it records cuts, and when it moves down increases in spending, in line with Right-Left preferences for more or less State action.
Other influences than simple Government alternation (e.g. intensification and relaxation of the Cold War) obviously affect total expenditure over this period. However, there is a clear correspondence with the theoretical expectations embodied in Figure 2 – alternating Republican and Democratic policy positions almost always bracket electoral preferences for more or less state action, change is slow, polarisation limited and popular preferences and spending move together over time. Preferences and actual policy are never far apart – the average absolute distance between them is 6.4 in Left-Right units (out of a range between –100 (Left) and +100 (Right)). Leftist and Rightist discrepancies cancel each other out to some extent over time, making the average of differences 4.6 if we take their positive and negative values into account. Moreover, expenditure also seems responsive to preferences, moving closer to them over time – but slowly, demonstrating the effects of policy inertia and ‘friction’.
The supportive results for the United States also appear in graphs constructed on similar lines for eight European democracies (Budge et al., 2012: 226–247). In six of these cases, the prerequisites for the dynamic correspondence between policy and preferences anticipated in Figure 2 were met and a broad correspondence actually appeared. In two cases (Ireland and Italy), party bracketing of the electoral policy median was generally absent and close preference-policy correspondence was lacking. 2
The Wider Representational Context
Moving the theoretical focus from an individual to a collective level by putting policy-oriented but inward-looking parties at the centre of representational processes seems paradoxical. But it is only realistic in light of the comparative evidence we have for their ideological commitment and the erratic role that policy voting plays in general elections. Support for these ideas, as well as for the slow pace of policy implementation and limited party distancing also comes from other theories of party and government behaviour validated (so far) against comparative data. These are as follows:
The Factional theory of party policy change, which sees variations in party polarisation as driven primarily by changes in factional control within parties, rather than as a direct response to public opinion (Budge et al., 2010).
Developmental party-family theory which sees parties as originating from particular support groups, with opposing ideological commitments difficult to change (Mair and Mudde, 1998: 215).
Generally Incrementalist budgeting (Davis et al., 1966) which except in exceptional situations limits the speed of real policy change, with ‘frictions’ which also slow it down (Baumgartner and Jones, 2009).
‘Thermostatic’ theories of generally negative collective reactions to government policy initiatives in specific sectors (Soroka and Wlezien, 2010). This contributes both to slow implementation of moves around the centre and electoral ‘costs of governing’ which promote governmental change (Cuzán, 2015, 2019; Nannestad and Paldam, 2002).
To see why these independent but concurrent processes generally power the policy alternation keeping popular preferences and implemented policy together, rather than blocking their long-term congruence, we need to specify them in more detail (Tables 2–6: Figure 4). A supporting reason for focussing on these particular representational theories is their clear specification and predictive success, which we also report in the text.
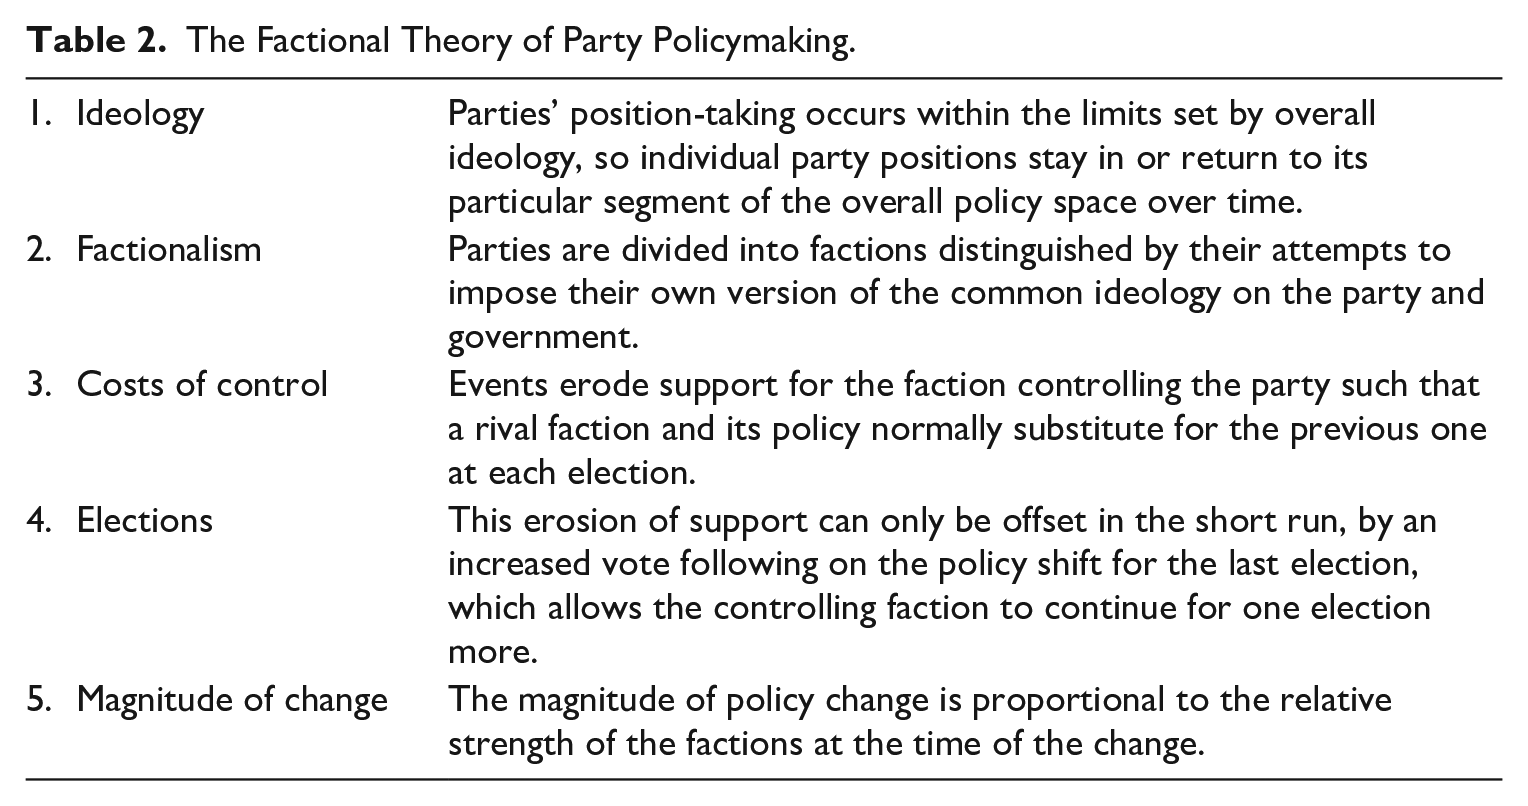
The Factional Theory of Party Policymaking.
Specifying Concurrent Democratic Processes Affecting the Preconditions for Government Alternation to Produce (Implemented) Policy Congruence With Centrist Citizen Preferences
The Factional Theory of Party Policy Making: Policy Change Within Overall Ideological Stability
Alternation theory predicts that governing parties will seek to bring implemented policies closer to their own targets for them. This accounts for the major policy changes traced in Figure 2. However, the speed and direction of change vary somewhat at different points in time. Party factional theory explains these lesser policy variations as mostly resulting from shifts in control within the party. All party factions will subscribe to its overall ideology – a comprehensive theory about politics and society which helps its adherents choose a policy under uncertainty about its effects. Socialist ideology for example will always favour state intervention as a way of solving problems. However, pervasive uncertainties still lead to internal party divisions about how exactly the general ideological prescriptions are to be applied.
Policy differences between ideological moderates and purists are common in all parties, leading to internal struggles to nudge policy targets in their own direction. However, nobody can remain indifferent to electoral reactions. Policy is one factor influencing voters (Wlezien, 2017a). Their support in turn affects the party’s chances of getting into government and putting preferred policies into effect. If a change in policy initiated by a factional change in control is followed by an increase in the party vote, even the opposing faction(s) will continue with it for the following election. After that, however, the controlling faction will be weakened by the continuing compromises and concessions it will be forced to make, especially in coalition governments. So after two elections, even if it is successful in voting terms, it will be forced out; another faction will take over and policy will change direction. The size of the change will depend on the relative strength of the two factions. If the incoming faction is larger than the other, then the direction of change will not just alter but change quite markedly. If, however, the two factions are relatively equal in size, there will probably be a standoff, and policy will stay where it is with neither faction being able to move it much in their own direction.
These points are all spelled out in Table 2.
Factional competition to impose their own version of the shared ideology on the party as a whole thus accounts for incidental changes in the speed and direction of policy changes in Figures 2 and 3 and ultimately for the extent of party policy polarisation – greater or less depending on whether centrists or extremists are in control inside each party. With greater polarisation, the possibility of implemented policy moving further from the centrist position increases, adversely affecting representational congruence.
Factional theory makes specific predictions about policy change in Proposition 3 (costs of control) and Proposition 4 (Elections). In combination, they predict that party policy shifts will take the form of an interrupted zig-zag, shifting marginally from extreme towards the centre or vice versa after every election – unless there are vote gains, in which case it stays where it is for one other election. This expectation was confirmed in 73% of 1737 Left-Right policy moves by 103 parties in 24 democracies from 1945 to 2005 (Budge et al., 2010). This improves substantially on naive forecasts such as anticipating moves at random or assuming that positions will stay the same from election to election – or change in the opposite direction every time. Even more important, factional alternations provide an explanation of why party governments modify or speed up their general push towards overall policy targets – one that fits in with previous arguments for them being highly ideological and inward-looking, with electoral opinion generally impinging indirectly and as only one consideration influencing policy moves. As these assumptions are shared with the general party alternation theory sketched earlier, and explain variations in party distancing within it, factional theory’s validation against an independent body of evidence strengthens the case for the former’s (provisional) acceptance and explains why the necessary precondition for preference-policy congruence of limited polarisation may be strengthened or weakened by internal party changes.
The Developmental-Family Theory of Party Formation
Party aloofness from electoral concerns is further emphasised in the second free-standing theory influencing the necessary preconditions (in this case bracketing) for party policy alternation in government to produce congruence. This again makes the point that parties are primarily defined by their ideologies, which emphasise certain policy priorities and preferred ways of tackling them, usually in opposition to other parties.
Party ‘policy bundles’ do not emerge by chance or as temporary responses to electoral pressures. They stem from a particular analysis of societal problems and appropriate political remedies for them, which brought different social groups together to start up their party. Each had their own interests to pursue. But they also had to justify them in terms of wider national interests. So they developed ideologies to do so, linking up their particular aims and aspirations to the general good. These developments and their consequences are summarised in Table 3 as a predictive theory.
The Developmental-Family Theory of Parties and Policy.
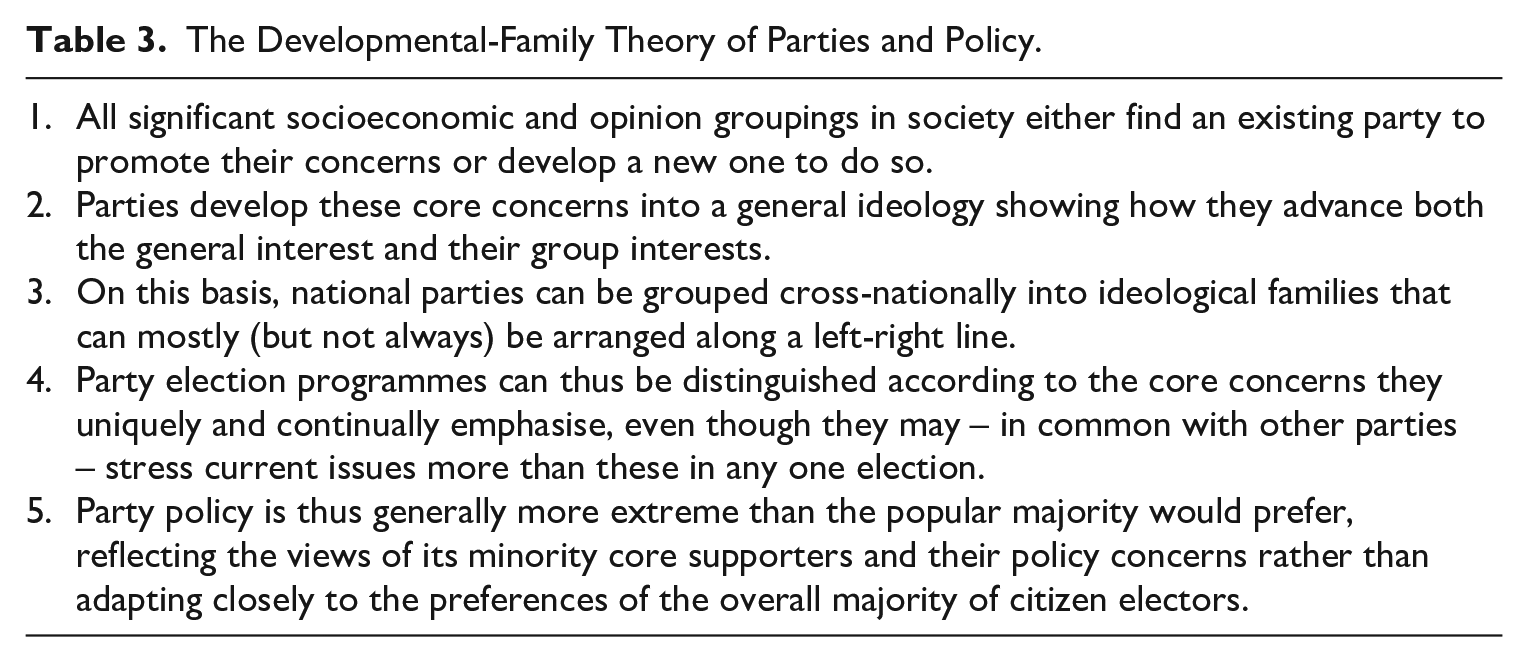
One consequence is that parties cannot just abandon their characteristic policies in pursuit of election votes. To do so would endanger group support and their own identity. They must in their programmes and proposals always stick to their core concerns, even though they may emphasise other issues more at any one election because of their immediate importance. It follows from Proposition 4 in Table 3, which makes this point, that parties can usually be placed in an ideological family in terms of the issues which they (in common with family members in other countries) uniquely emphasise in their programmes.
Another consequence is noted in Proposition 5. Party preferences on ‘its’ issues will always be more extreme than those of the citizen majority in a democracy, which is partly formed by supporters of opposed parties. Median citizens are thus likely to find themselves bracketed by the parties, near the centre of any policy space marked out by their positions. This is a long-term outcome of the way parties develop and of their different connections with particular groupings in the population.
A more immediate prediction from the developmental-family theory is Proposition 4 which can be used to check its validity against actual evidence. That specifically expects party programmes to be distinguishable in terms of their family’s issue concerns. As it turns out, 80% of individual parties competing in EU elections can be correctly assigned to ideological families on the basis of characteristic issue concerns articulated in manifestos (Klingemann et al., 2006: 39; Volkens and et al, 2013: 60).
As a provisionally validated predictive theory, this explanation of party development and continuing ‘family’ concerns underlines the ‘paradox of democracy’ – that relatively extreme parties with minority interests at heart are supposed to make public policy in line with centrist majority preferences. The general alternation model (Figure 2) also confronts this paradox but shows how the problem can be resolved by the opposed parties’ reversals of each other’s policies over time, which brings implemented policy back across the centre.
Incremental Budgeting and Punctuated Equilibrium
Ideological non-responsiveness reinforces the inertia separating party policy targets from actually implemented policy. However, inertia also stems from the practical difficulties of making changes to established policy routines through an entrenched bureaucracy divided into many, often competing, Ministries. They may compete on policy. But they will certainly compete for shares of the overall budget to finance their activities.
The theory of ‘incrementalism’ (Davis et al., 1966) argues that budgets are largely determined through interdepartmental bargaining. The bureaucrats within each department seek to enhance their standing by expanding its activities and spending. However, the other ministries have the same aim. They all have to agree on the overall budget; otherwise, the politicians may step in with unpredictable consequences. The negotiators therefore have an incentive to reach agreement while safeguarding their own departmental position. The easiest solution is to start from the previous year’s budget allocation and raise or lower it a little (‘incrementally’) – thus threatening no one too much by heavy cuts. In this way, agreement is secured, and budgets do not change too much – contributing to the inertia separating new government policy targets from the actual policy being applied.
Incrementalism, however, does not explain allocation and expenditure change when it does take place. This may be rare, but it is often far-reaching. So although spending may remain much the same over extended periods, it may change drastically at one point in time before continuing at the new level over following years. To explain the pattern of long-lasting stability interrupted occasionally by drastic change, incrementalist thinking has been expanded to incorporate the forces making for change (e.g. a party coming into government with drastically new priorities for the relevant policy area – or external developments such as wars or weather events – which change allocations quickly and for good). This line of thinking is summarised as a predictive theory in Table 4 and equation 1 below.

The Theory of Punctuated Incrementalism in Budgeting Allocations – Occasional Events Drastically Change the Allocation But Then it Stays Stable for a Long Time.
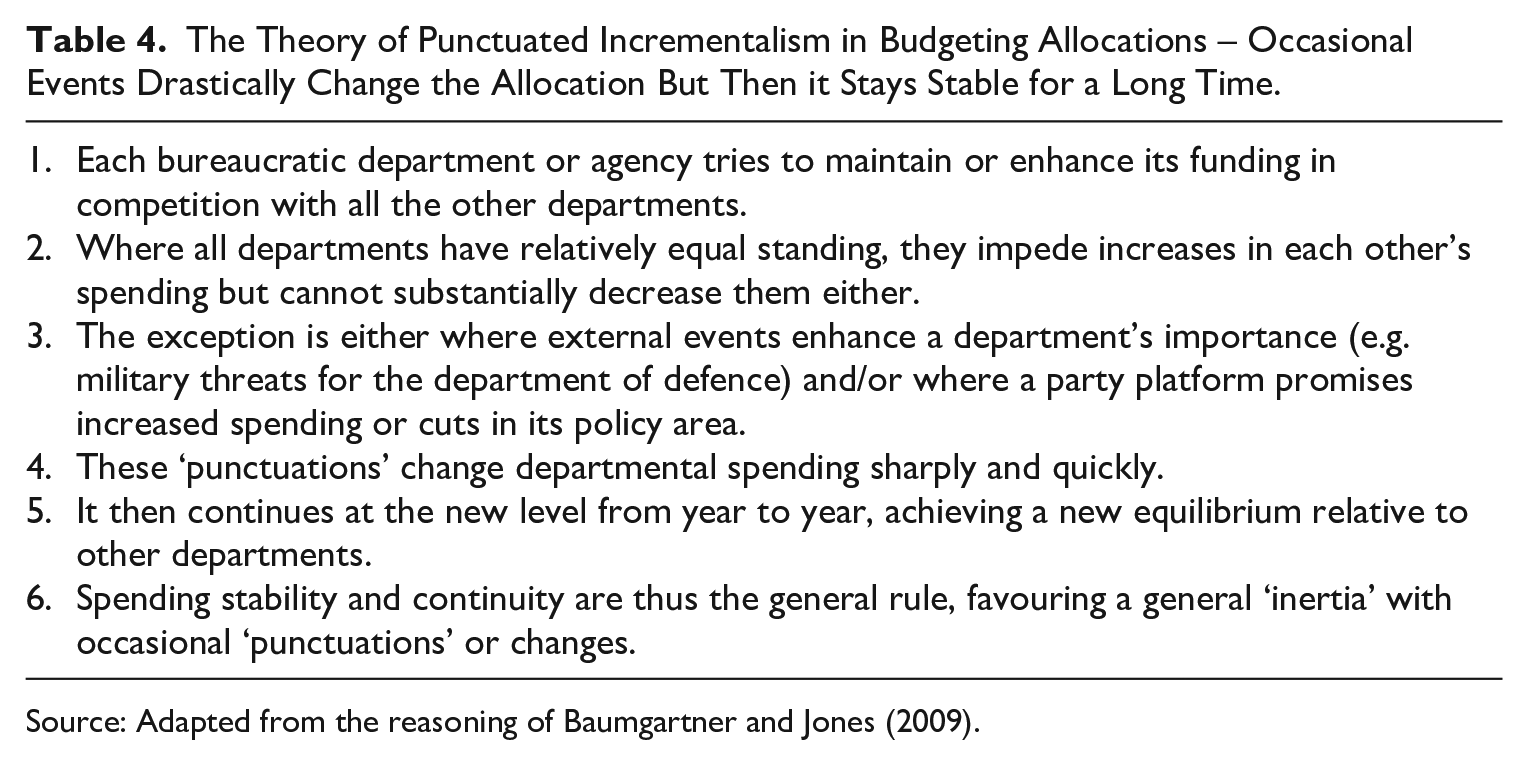
Source: Adapted from the reasoning of Baumgartner and Jones (2009).
where $At is this year’s budgetary allocation, $At-1 is last year’s allocation; Pt is the policy target for the ministry’s area as set by the governing party(ies); and Et are external developments unanticipated when policy targets were set but needing attention – for example, new wars or climatic crises. The β1 coefficient estimates year-to-year policy stickiness. Its complement, 1–β1, is an estimate of the annual pace of change to an allocation equilibrium. An equilibrium allocation level without a new target or external development is estimated by the intercept, a, divided by the pace of change (1–β1). β2 and β3 are short-run adjustments due to shifting policy targets and external developments, and εt is a set of essentially random perturbations to allocations, with mean zero and constant variance.
The equation puts into quantitative and testable form the idea that allocations (and, by extension actual expenditures) will continue at much the same level unless government priorities shift or external developments render more, or less, spending necessary in the area – a plausible though not as yet widely tested qualification to observed incremental processes. These contribute to the difficulties government has in translating policy targets into implemented policy and thus to the inertia which is one of the necessary conditions for congruence with popular preferences illustrated theoretically in Figure 2 and applied practically in Figure 3.
Thermostatic Interactions Between Government Policy Implementation and Electoral Preferences
Thermostatic theorising sees government policy implementations as not only matching some citizens’ demands for them but also as changing them. As a particular policy is implemented, those citizens who only wanted little changes in the area cease to provide support, while the beneficiaries of existing policies mobilise in opposition. Most citizens may remain relatively indifferent to the changes. But the signals the electorate as a whole gives out are increasingly negative as more change takes place. This leads to the paradoxical result that as governments respond to popular support for policy change it generally drops away, except in particular areas such as tax cuts or support payments during emergencies like COVID. These ideas are summarised in Table 5.
The Thermostatic Theory of Government – Electoral Interactions.
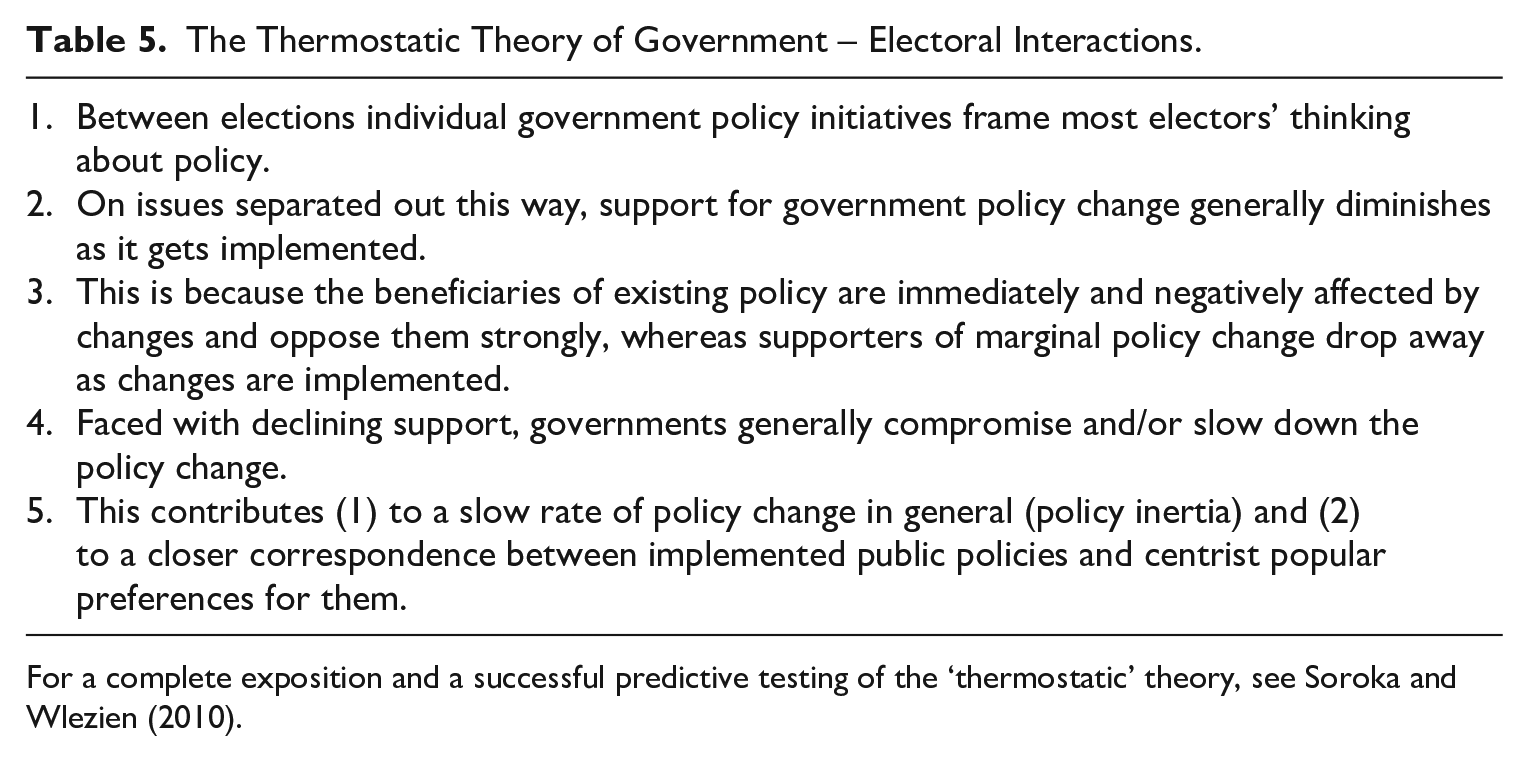
For a complete exposition and a successful predictive testing of the ‘thermostatic’ theory, see Soroka and Wlezien (2010).
They bear on two necessary preconditions for alternation producing representational congruence as shown in Figure 2. One is considerable inertia, slowing down any change from existing policy to policy targets, as popular support diminishes and opposition grows. This also raises the ‘costs of governing’, that is, a general erosion of voting support as the government approaches the general election (Wlezien, 2017a). All this contributes to changing the parties in government and to the policy alternation shown in Figures 2 and 3, which pushes implemented policy back towards the centre. Again, this reasoning can be operationalised in an equation:

where Rt is relative public preference for policy change at time t; Pt is implemented policy; Wt factors that give rise to or are otherwise associated with the public’s preferred policy; and et, the error term. The important expectation of the thermostatic model is that β1 takes a negative value: as policy expenditure increases (decreases) the relative preference is for less (more).
Over 3–6 policy areas examined for Britain, the United States and Canada from the 1970s to the 1990s, this expectation was upheld in a strong majority of cases (Soroka and Wlezien, 2010: Chapter 5, 125–144). The result not only lends credence to thermostatic reasoning about the inter-relationships between public policy and public opinion in specific policy areas, but also to the assumptions about government and policy alternation and slow policy implementation made by alternation theory, which are explored in more detail in the next section.
Relating Democratic Policy Processes to Each Other
The various models of concurrent representational processes and party behaviour under democracy (all provisionally validated and clearly specified above) were proposed independently and only brought together here to provide a general overview of representational democracy at work. At first sight, they might seem to strengthen the case against the possibility of good policy representation given the developmental and factional emphases on parties’ ideological and inward-looking character and the thermostatic emphasis on their difficulties in adjusting to shifting popular policy demands.
Party aloofness and popular opposition however contribute to the inertia and governmental and policy turnover which alternation theory identifies as necessary, along with bracketing and limited polarisation, in keeping enacted policy closer to popular preferences. By promoting governmental and policy oscillations around the centre, all the theories presented in Tables 2–5 combine to resolve the central Paradox of Democracy – how ideologically rigid, relatively unresponsive parties can meet broadly centrist collective demands. The answer being that slow policy implementation and its frequent reversals under successive governments under the specified conditions keep enacted policy relatively close to the centre where most electors locate themselves.
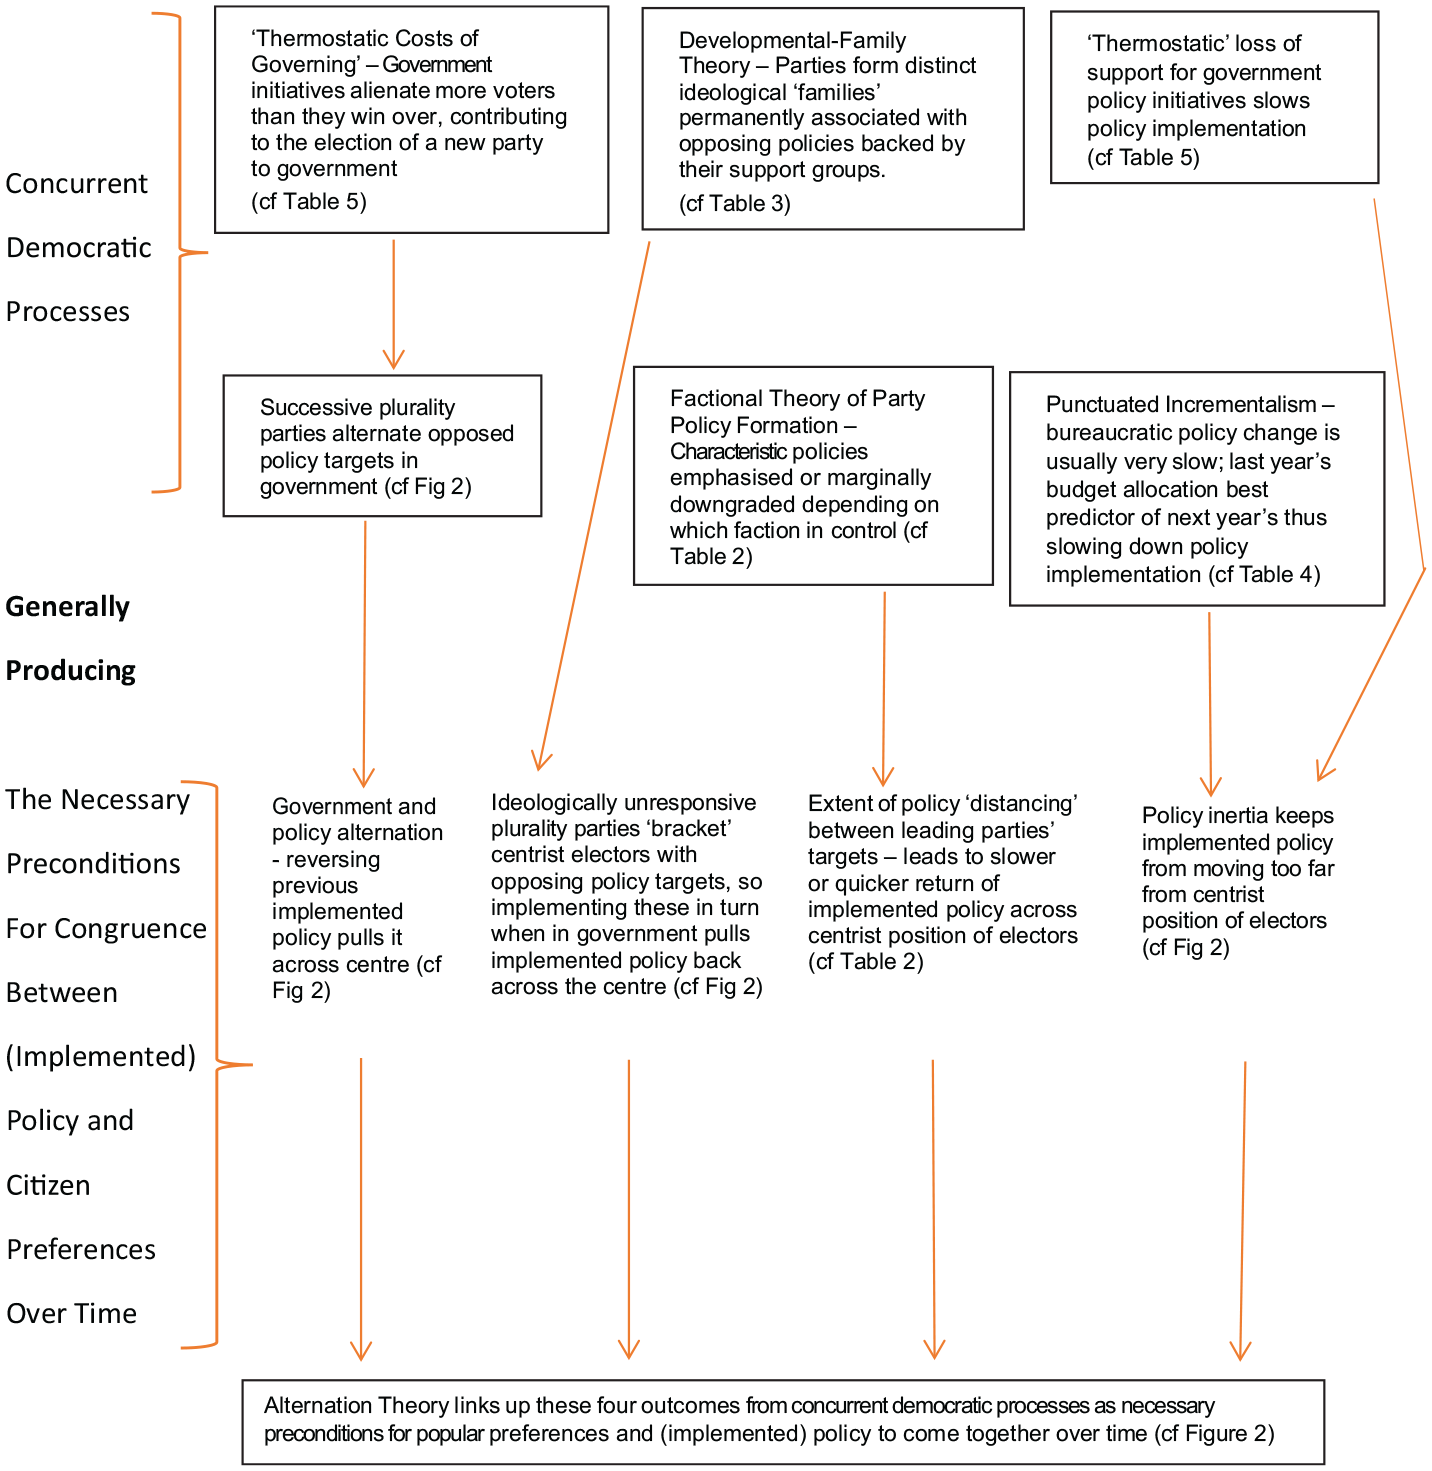
Figure 4 provides a schematic overview of how these independently conceived and validated theories of five concurrent democratic processes explain why party alternation in government generally occurs; why parties usually bracket the majority (median) preference; why they distance themselves or come closer together on policy; and why there is mostly slow implementation of policy targets (inertia). These preconditions must all be present as necessary requirements for the (implemented) policy-preference correspondence over time illustrated in Figures 2 and 3 – even if on first sight, they seem to hamper it.
Although in itself Figure 4 is simply a helpful schematic, all the processes and factors it puts together have been operationalised and explained in the preceding graphs, tables and equations. Figure 4 brings them together to provide a unified picture of representational democracy at work – even if it can falter at times when any one of the necessary four conditions for policy-preference correspondence are not produced by relevant concurrent processes (McDonald and Budge, in preparation Using Alternation Theory to Model US Policy Representation 1952–2020. For example, if bureaucratic decision-making speeds up the gap between target and implemented policy disappears, making for immediate implementation of policies and thus long-term incongruence with centrist popular preferences). Relating these processes to each other and to the direct effects of government alternation on congruence thus extends the explanatory and predictive powers of the central alternation model (Figure 2).
Of course, such validation is always provisional – another well-specified theory may in time predict outcomes better. At the moment however, the only rival theories are not predictively successful (Budge, 2019; Budge et al., 2012; McDonald and Budge, 2005). So we have to accept those presented here as providing the best overall explanation (up to now!) of how representational democracy works.
Another advantage of predictive theorising is that in order to make predictions at all, it has to be clearly and unambiguously stated – as recommended by Taagepera (2008) and demonstrated in Figure 2 and Tables 2–5 above. Doing so provides a clearer focus and context not only for the collection and analysis of relevant data, but also for general debate and discussion. To properly assess democratic performance for example, one needs to have a clear theory of how representation works and what is essential to it, rather than basing assessments on a blanket array of institutions and processes common to most democracies but not necessarily essential to their central procedures.
Bringing independently formulated theories into a mutually supportive overview of democratic representation (Figure 4) is also facilitated by the background assumptions they make in common. We deal with these in the next section.
Shared Methodological and Conceptual Foundations
By their nature explanatory theories cannot go all the way back in the chain of reasoning which produced them. Their objective is to provide a clear concise account – often spatial in nature – of the immediate processes leading to preference-policy correspondence. They can hardly go back every time to the basic measurement and other assumptions involved in representing preferences and policies as points in space, even though these are essential to the reasoning behind most of them. As a result of just assuming rather than clearly stating such assumptions however, attempts at evaluating competing representational models often miss major points of discussion – for example, what kind of space (straight line, many dimensioned), is best suited to representing policies and preferences? (Budge, 2019) Or should (or can) we evade the need for spatial representations at all?
We should note that this is not just a problem for explicit model building and analysis of the kind presented here. Purely descriptive and even historical accounts make implicit spatial assumptions by using terms such as ‘Centrist’ or ‘extreme’ to describe policy moves or positions. These must rest on some conception of preferences being distributed within some space (usually a straight line) with extremes and a centre, over which actors can be located. From here to actually measuring their positions is but a short step, conceptually speaking. Making such assumptions explicit is thus an important step towards providing a common frame of reference for all types of research on representation.
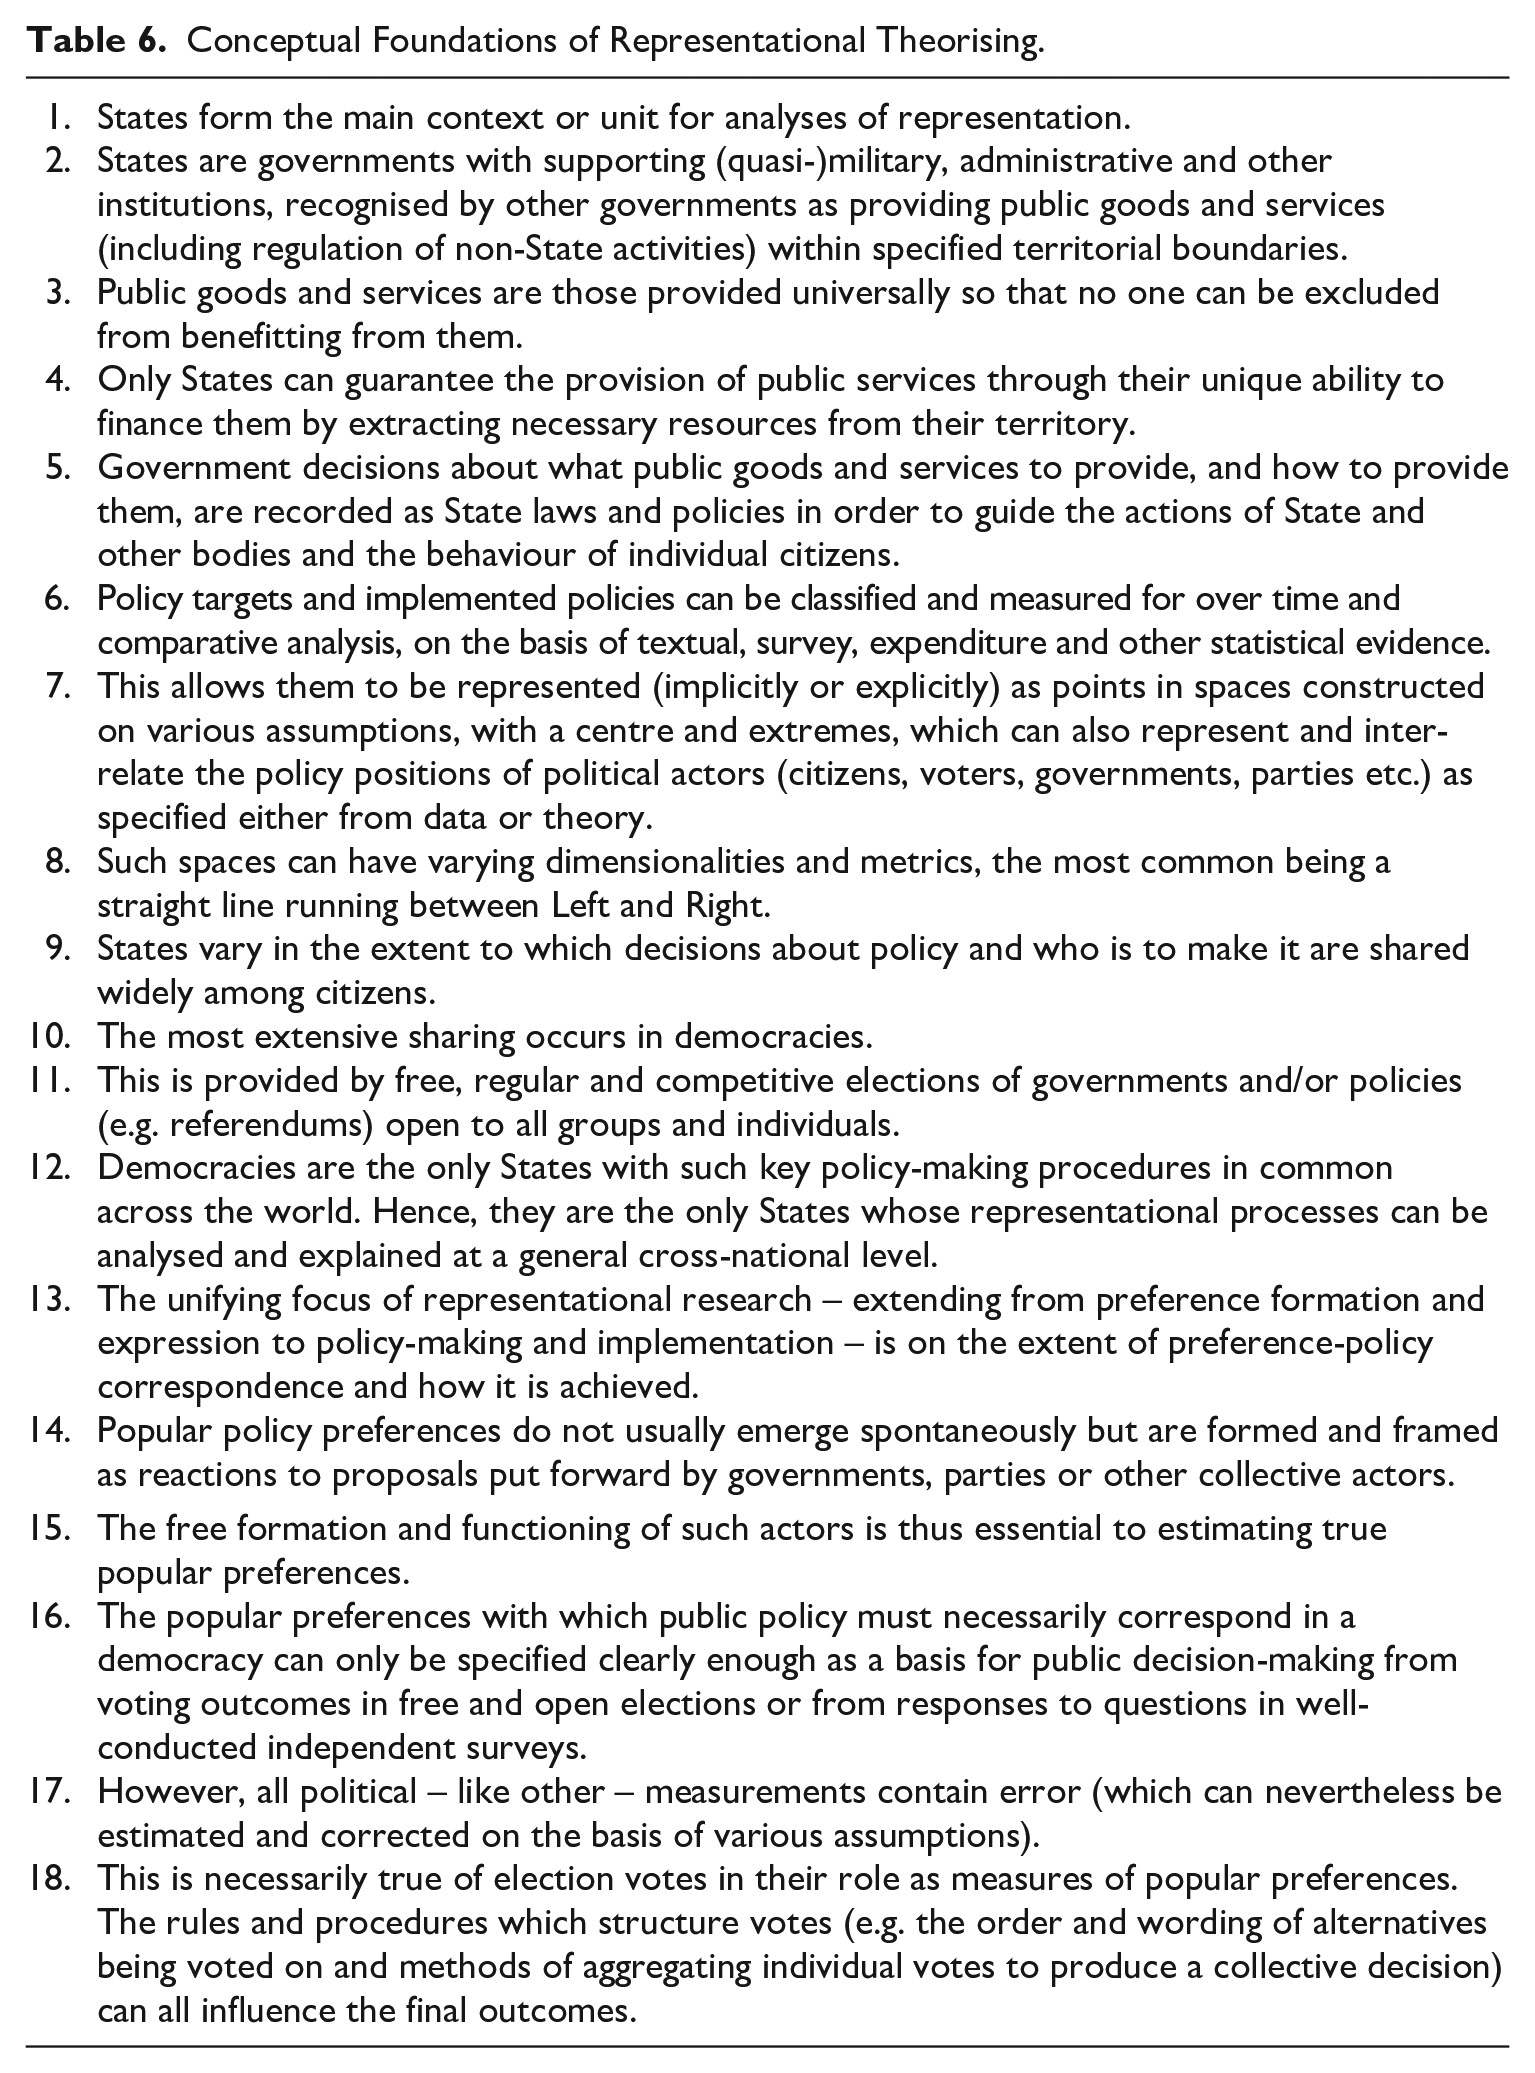
This is provided in Table 6 in the shape of 18 propositions. Not all representational theories make all the assumptions listed. The claim is rather that they all use some of them and the overlaps provide a common basis for discussion and research on the processes they describe. Table 6 details the assumptions themselves, numbered for easy reference. This is followed by a brief comment on each – which hopefully provides a basis for later and wider methodological discussion.
Conceptual Foundations of Representational Theorising.
Commentary and Discussion
The use of most assumptions propositionalised in Table 6 in the representational theories discussed earlier is sufficiently obvious that they need little explanation. A brief commentary may help however – also in terms of underlining their relevance to studies of representation in general, not just those reviewed earlier.
We key our commentary to individual propositions or interrelated groupings, referenced by number: 1, 2: One could look at representation in a wide variety of contexts (businesses, labour unions, courts etc.) However most representational research is in practice focussed on State institutions – usually national but sometimes local – either as case studies within the context of one State or as comparisons between States, taking each as a unit. The focus is overwhelmingly on governments rather than other State institutions, because governments are the main policy-making institution within the State. 3, 4: This is because they decide on the ‘public goods’ to be supplied in their territory and how to supply and pay for them. Since everyone can ultimately be coerced to pay, how do we know that they really want them? – the central question addressed by representational research. 5, 6, 7, 8: Both qualitative and quantitative research on political representation use textual evidence (election and legislative programmes, reports, newspapers etc.) to estimate government intentions: expenditures for implementation: and opinion data to estimate popular preferences. The more extensive the investigation over time and across countries the greater the need for summary measures which often take a spatial form (7). This is convenient as most representational theories are also spatial in nature, allowing them to be matched quite closely against data-based evidence. However, constructing spatial representations of either theories or data involves strong assumptions about what kind of space is appropriate, which are best made explicitly rather than implicitly (8). 9, 10, 11, 12: Democracies are the countries almost all representational research focuses on, since other regimes only pretend to be representative or do not even pretend to be, having what they consider higher goals to pursue. There will be little dispute that free elections are key to good representation. But the question (answered in various ways by different models and studies) is how they provide it. To compare political processes in any detail across countries they have to have key features in common, the point made by Proposition 12. 13: Another point has already been made – that representational research, whatever form it takes, has an unusually strong focus on the correspondence between public policy and popular preferences for it, corresponding to the matching of supply and demand in economics. 14, 15, 16, 17, 18: However, preferences cannot just be taken as given, or as emerging spontaneously. They usually emerge as reactions to party or government policy proposals, so are ‘framed’ by other political actors, including the polling agencies (Soroka and Wlezien, 2010). So the free functioning of these, as well as of elections, is essential to identifying the preferences to be matched up with policy. Even so error may creep in and needs to be guarded against. Even votes in free elections may not provide a true reflection of preferences, depending on the way choices are set up. Here the voting paradoxes identified by social choice theory (Arrow, 1951) and proposed solutions (Budge, 2019: 154, 376) link up with empirical representational research (18).
Conclusion
Both the substantive explanations presented earlier, and their underlying methodological assumptions just reviewed, help to focus discussion of representational processes. Rather than simply dismissing their feasibility, they show how their guarantee of making public policy responsive to popular preferences is provided by established institutional processes which compensate for shortcomings of individual citizens. Concentrating on individuals indeed commits a level of analysis fallacy by generalising weaknesses at the individual level up to the collective actors which dominate institutional processes – electorates, parties, governments. Who says processes says time of course, since processes have to run over a series of elections and resulting governments rather than these being considered as discrete events.
With time brought in, we can check on the relevance and correctness of our explanations by seeing if they correctly predict (or postdict) the independently observed outcomes of the processes they describe. Predictive theorising has been discredited by the failure of voting studies to forecast voting and election outcomes substantially better than naïve models. We just have to accept that general elections are by their nature open-ended and designed to cope with multiple events as well as ongoing policies – a fact accepted here. But that merely indicates that we have chosen the wrong outcome to predict rather than that political prediction is impossible. Surely long-term electoral and governmental processes are more important to focus on than individual election outcomes within them, whose random nature may itself form part of the overall processes. Viewed in this way, policy representation offers a more rewarding focus for political research than voting and elections per se, particularly since it now comes with interrelated, validated and well-specified explanatory models.
Of course, theories – even those validated by prediction/postdiction – are only contingently true, especially when comparative evidence is limited in terms of time periods and the current observations available. Another better specified or more predictively successful theory may be formulated and replace them, especially as their predictions are statistical in form, limited by existing data and generally succeed in anticipating only 70%–80% of independently observed outcomes.
However, the lesson from theory-led data analysis is that currently validated explanations should only be rejected if there is an equally clear and more successful explanation to replace them. Just citing opposing instances without adequate explanatory backing will take us nowhere in terms of cumulative theory-building. This is especially so when the evidence is statistical in form, dealing with probabilities rather than totally deterministic. The wider methodological promise of the procedures used here is that they will help move the discipline from historical narrative as its main mode of explanation to a concern with cumulative theory-building, having public policy supply and demand – aka policy representation – at its core.
Footnotes
Appendix 1
This article is primarily concerned with clarifying and contextualising previously validated representational theories rather than retesting them. Hence, it mostly reports results from the original data analyses, citing relevant published sources, rather than replicating them. This report details data used, how they were sourced and methods used to analyse them. They have all been referenced in the text so interested readers can follow them up from there. However, a brief overview may be helpful in orienting readers towards the relevant data-sets used in these sources and reports. This follows below:
Declaration of conflicting interests
The author(s) declared no potential conflicts of interest with respect to the research, authorship, and/or publication of this article.
Funding
The author(s) received no financial support for the research, authorship, and/or publication of this article.