
Abstract
Cr2O3–Al2O3 ceramic coatings were elaborated by flame spray on AISI/SAE 1020 and ASTM A572 steels to evaluate their performance in marine environments. Three powder mixtures were prepared, consisting of 90% Cr2O3–10% Al2O3, 80% Cr2O3–20% Al2O3 and 70% Cr2O3–30% Al2O3 wt. The coatings were applied using flame spraying and immersed in artificial seawater for 28 days. Microstructural analysis revealed that higher Al2O3 content produced thinner coatings, while porosity and micro-crack distribution remained similar across samples. X-ray diffraction and elemental composition analysis confirmed the presence of eskolaite (Cr2O3) and corundum (Al2O3) phases. Electrochemical impedance spectroscopy (EIS) and Tafel extrapolation methods were employed to assess polarisation resistance (RP) and corrosion rates (CRs). Results showed that coatings with 20% Al2O3 exhibited superior corrosion resistance, particularly on AISI/SAE 1020 steel, achieving RP values around 18.36 kΩ·cm² and the lowest CR of 0.006 mm/year. Bode plots revealed shifts in phase angle peaks towards lower frequencies, indicating enhanced barrier properties over time. Post-exposure analysis identified iron in the corrosion products, suggesting the formation of iron oxides and oxyhydroxides. The findings confirm the beneficial effect of Al2O3 on Cr2O3 coatings and highlight the Cr2O3–20%Al2O3 composition as the most promising candidate for protecting steel structures in marine environments.
Keywords
Introduction
Proximity to the sea has consistently played a key role in the development of human civilisations, due to the economic, strategic and ecological advantages of marine environments. Today, a significant portion of infrastructure is located in these regions, and steel remains one of the most widely used structural materials due to its high mechanical strength and versatility. However, prolonged exposure to marine environments presents a significant challenge, as high salinity significantly accelerates corrosion. The corrosivity of ferrous alloys in marine environments is associated with the concentration of chloride ions (Cl−), which promotes the oxidation of iron, forming iron oxyhydroxides and chlorides. This effect is more relevant when the material is exposed to a high-humidity environment, as water facilitates the diffusion of chloride ions and the formation of iron chloride, which is highly soluble in an aqueous environment.1–5 For this reason, studies on corrosion in marine environments focus on controlling the diffusion of seawater to the surface through coatings or by using sacrificial anodes. 6
Coatings produced by thermal spraying for corrosion protection have been studied in applications where resistance to wear or high temperatures is necessary.7–9 In contrast, at lower temperatures, the application of coatings with materials that serve as sacrificial anodes has proven to be a more viable solution for protecting steel in marine environments.10,11 In both cases, a critical factor that significantly affects coating performance is the number of microstructural defects. Since coatings act as a barrier, defects such as porosity and cracks can facilitate water penetration to the steel surface, promoting corrosion. Therefore, methods that reduce microstructural defects in the coating, such as cold pressing or the formation of phases between compounds, have been investigated to improve their performance.12,13
Flame thermal spraying is a technique in which the feedstock material is heated by the combustion of a gas, commonly acetylene, due to its high flame temperature and low oxygen consumption. 14 This method allows the deposition of both metallic and ceramic materials, and can operate at either low or high particle velocities depending on the process parameters. The process can be automated using a powder feeder and a mechanical support system, which enhances reproducibility and consistency in the coating results. Moreover, flame spraying remains one of the most cost-effective thermal spray techniques because it requires no sophisticated equipment.
Various authors have studied the system of Cr2O3–Al2O3 metallic oxide coatings, applied to different substrates, and through other techniques. Both oxides share the same crystal structure, hexagonal close-packed for the oxygen atoms, with 2/3 of the interstices occupied by the aluminium and chromium atoms forming an octagonal arrangement. This allows the precipitation of a solid solution at the splat interface due to a diffusion phenomenon that reduces the microstructural defects of the coating and improves its mechanical properties.15,16
Cr2O3 and Al2O3 coatings have been studied by varying their composition, as well as through the application of chemical and physical treatments to reduce porosity and improve mechanical properties and corrosion resistance.17,18 In Cr2O3–Al2O3 coatings fabricated by plasma thermal spraying, an increase in mechanical properties such as hardness, fracture toughness and bending strength has been found for specific proportions. This is due to the diffusion of Al and Cr atoms between adjacent splats, increasing the adhesion to each other and reducing the microstructural defects of the coating. 19 Other studies have evaluated the mechanical properties and corrosion resistance of Cr2O3 coatings elaborated by detonation, and Cr2O3 with Al2O3 by atmospheric plasma on Ti6Al4V, finding better performance when Al2O3 is added. 20 Authors like Dhakar et al. 21 tested the influence of heat treatments on Cr2O3 with Al2O3 coatings over AISI/SAE1020 steel substrate. They concluded that the presence of α-Al2O3 phase increases the hardness, wear resistance and Young's modulus while decreasing porosity and roughness.
Recent research has continued to emphasise the optimisation of oxide-based coatings for marine and corrosive environments. Zhang et al. 22 demonstrated that Al2O3–20TiO2 coatings exhibited superior corrosion resistance compared with Cr2O3–3TiO2–5SiO2 coatings in hydrogen sulphide seawater due to their lower porosity and higher compactness. Suman and Sabiruddin 23 found that minor Cr2O3 additions improved the oxidation resistance and toughness of Al2O3 coatings through (Al,Cr)2O3 solid-solution formation. Wang et al. 24 Reported that Al–Al2O3–Cr2O3 coatings fabricated by supersonic plasma spraying showed low porosity and enhanced wear and corrosion resistance, while Jiang et al. 25 confirmed that nano-Cr2O3 formation improved the oxidation resistance of Inconel–Al2O3 coatings prepared by plasma-enhanced arc spraying.
In this context, the present work investigates the influence of varying Cr2O3– Al2O3 ratios and substrate types on the microstructural and electrochemical behaviour of flame-sprayed coatings in artificial seawater. The addition of Al2O3 is expected to reduce coating porosity and increase hardness, thereby enhancing the overall protective capacity and long-term corrosion resistance of the coatings under saline conditions. This approach aims to evaluate the feasibility of the flame spray process as a low-cost and versatile technique for producing ceramic coatings capable of improving the durability and service life of structural steels exposed to marine environments.
Materials and methods
The materials and methods followed to determine microstructure, chemical composition, XRD patterns and corrosion rate (CR) are presented below.
Substrate and thermal spray powders
The substrates were two references of carbon steel: AISI/SAE 1020 and ASTM A572 grade 50. These steels were chosen due to their application as structural steels. AISI/SAE 1020 is a steel with good machinability and weldability and ASTM A572 steel is a high-strength structural steel.
The AISI/SAE 1020 steel substrate was a 1-inch diameter bar cut into one cm-thick sections. The ASTM A572 steel substrates were 8 mm thick, 7 cm square plates. The pre-sprayed surfaces of the AISI/SAE 1020 steel specimens were ground with SiC #80 sandpaper to remove the finish left by machining, while the pre-sprayed surface of the ASTM A572 steel specimens was worked with a wire brush to remove the oxide layer that had formed. Finally, both materials were subjected to abrasive blasting with a corundum jet to remove any remaining rust from the substrate before coating and create a rough surface that promotes coating adhesion.
Commercial ceramic powders of Cr2O3 reference MEC 707™ and Al2O3 reference Saint Gobain Thermal Spray Powders #184 were used. The morphology and phases of the powders were determined by scanning electron microscopy (SEM) and X-ray diffraction (XRD), respectively. Quanta FEG 650 scanning electron microscope and JEOL-JSM 6490LV X-ray diffractometer were used. Three mixtures by weight with these powders were elaborated: the first with 10% of Al2O3, the second with 20% of Al2O3 and the third with 30% of Al2O3 through mechanical agitation. The remaining 90, 80 and 70 weight percentages were completed with Cr2O3 powder. The mixtures were heated in an oven at 105°C for at least one hour before spraying to remove moisture from the powders.
The coatings were fabricated using the flame thermal spray technique with the MEC POWDER FLAME SPRAY SYSTEM POWDERJET-86 II. This technique uses a mixture of gases: oxygen (O2) as the oxidiser, acetylene (C2H2) as the fuel, and nitrogen (N2) as the carrier gas for the powder, in the correct proportions to create an oxidising flame.
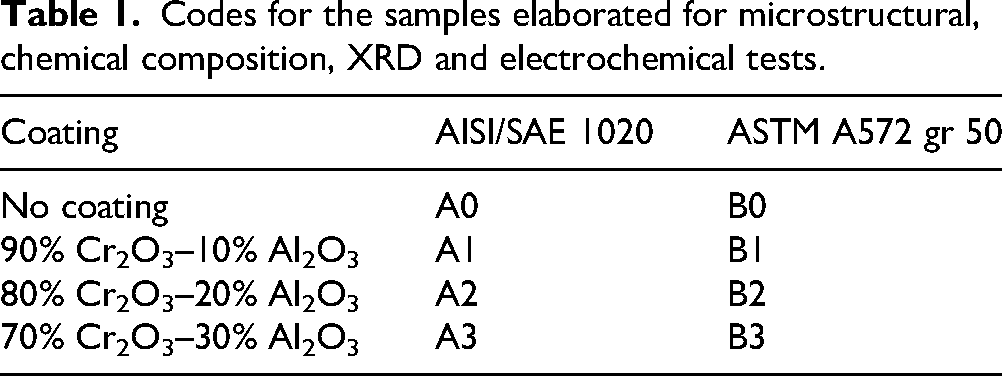
The proportions and flame spraying parameters were chosen based on previous work, 26 where Cr2O3 powder was sprayed onto AISI/SAE 1020 steel. The flame torch was operated by an X–Y mechanical system managed by the AMC 4030 software, following Cartesian coordinates. The spray routines for both substrates were designed to ensure that the torch passed over each area of the substrate twice in each pass. The coating feedstock was supplied by a rotary drum powder distributor (MEC PF-700). Once the spray routine was completed, the coatings were allowed to cool and then removed from the support and stored. The codes of the fabricated coatings are presented in Table 1. Note that the materials with the codes A0 and B0 refer to uncoated specimens, used as blanks in the electrochemical tests.
Codes for the samples elaborated for microstructural, chemical composition, XRD and electrochemical tests.
Coating characterisation
The A1, A2 and A3 specimens used in the microscopy analysis were mounted in cold resin directly after being coated. Meanwhile, the B1, B2 and B3 were obtained from prepared 7 cm × 1.5 cm × 0.8 cm plates. These were cut previously to this size to facilitate preparation for microscopy tests. Once coated, they were taken to a diamond cutting disc, where small enough samples were extracted to be mounted in cold resin. Once mounted in resin, they were taken to a diamond disc cutting machine, and a cross-sectional cut was made, which was prepared metallographically following the ASTM E1920 27 standard, passing through sandpapers of sizes 80, 100, 120, 150, 180, 220, 320, 400, 600, 1200 and 1500. Finally, the specimens were polished with 3 μm and 1 μm diamond paste.
The morphology of the coatings was evaluated by SEM, while their elemental chemical composition was analysed by energy-dispersive X-ray spectroscopy (EDS). The equipment used for Cr2O3–Al2O3 powders and AISI/SAE 1020 cross-sectional samples analysis was the Quanta FEG 650 scanning electron microscope, while the equipment used for ASTM A572 samples and corrosion products was the JEOL-JSM 6490LV, both of which have an integrated spectrometer for EDS. The value of microstructural defects was evaluated according to the ASTM E2109 28 standard, determining the percentage of the area corresponding to porosity and microcracks.
Electrochemical tests and CRs
To evaluate the corrosion-resistive capacity in marine environments of the coatings, Gamry Interface 1000 Potentiostat/Galvanostat was used to carry out electrochemical impedance spectroscopy (EIS) tests and polarisation curve tests, according to the ASTM G106 29 and ASTM G59 30 standards, respectively, with artificial seawater as the electrolyte, according to ASTM D1141. 31
The electrochemical test cells are presented in Figure 1, with the coated steel specimen as the working electrode, a saturated calomel electrode as the reference electrode, a platinum sheet as an auxiliary electrode for the AISI/SAE 1020 steel coatings, and a graphite rod as an auxiliary electrode for the ASTM A572 steel coatings. The setup relative to the coatings on AISI/SAE 1020 steel, shown in Figure 1(a), consists of PVC and polyethylene (PE) supports that serve as a structure to keep the working electrode in place during the tests and maintain a constant 1 cm² exposure area. The glass cell is sealed by a screw that generates pressure, using O-rings and silicone liquid glue to prevent electrolyte leaks at the joints between the elements. On the other hand, the setup shown in Figure 1(b) corresponds to the Gamry PTC1 Paint Test Cell reference, which consists of a polymeric base, a glass cell, an O-ring and clamps that hold all the elements together under pressure. This setup was also sealed with silicone liquid glue to prevent electrolyte leaks. The area of the piece exposed to the electrolyte was controlled using an adhesive sheet with a 1 cm² hole.
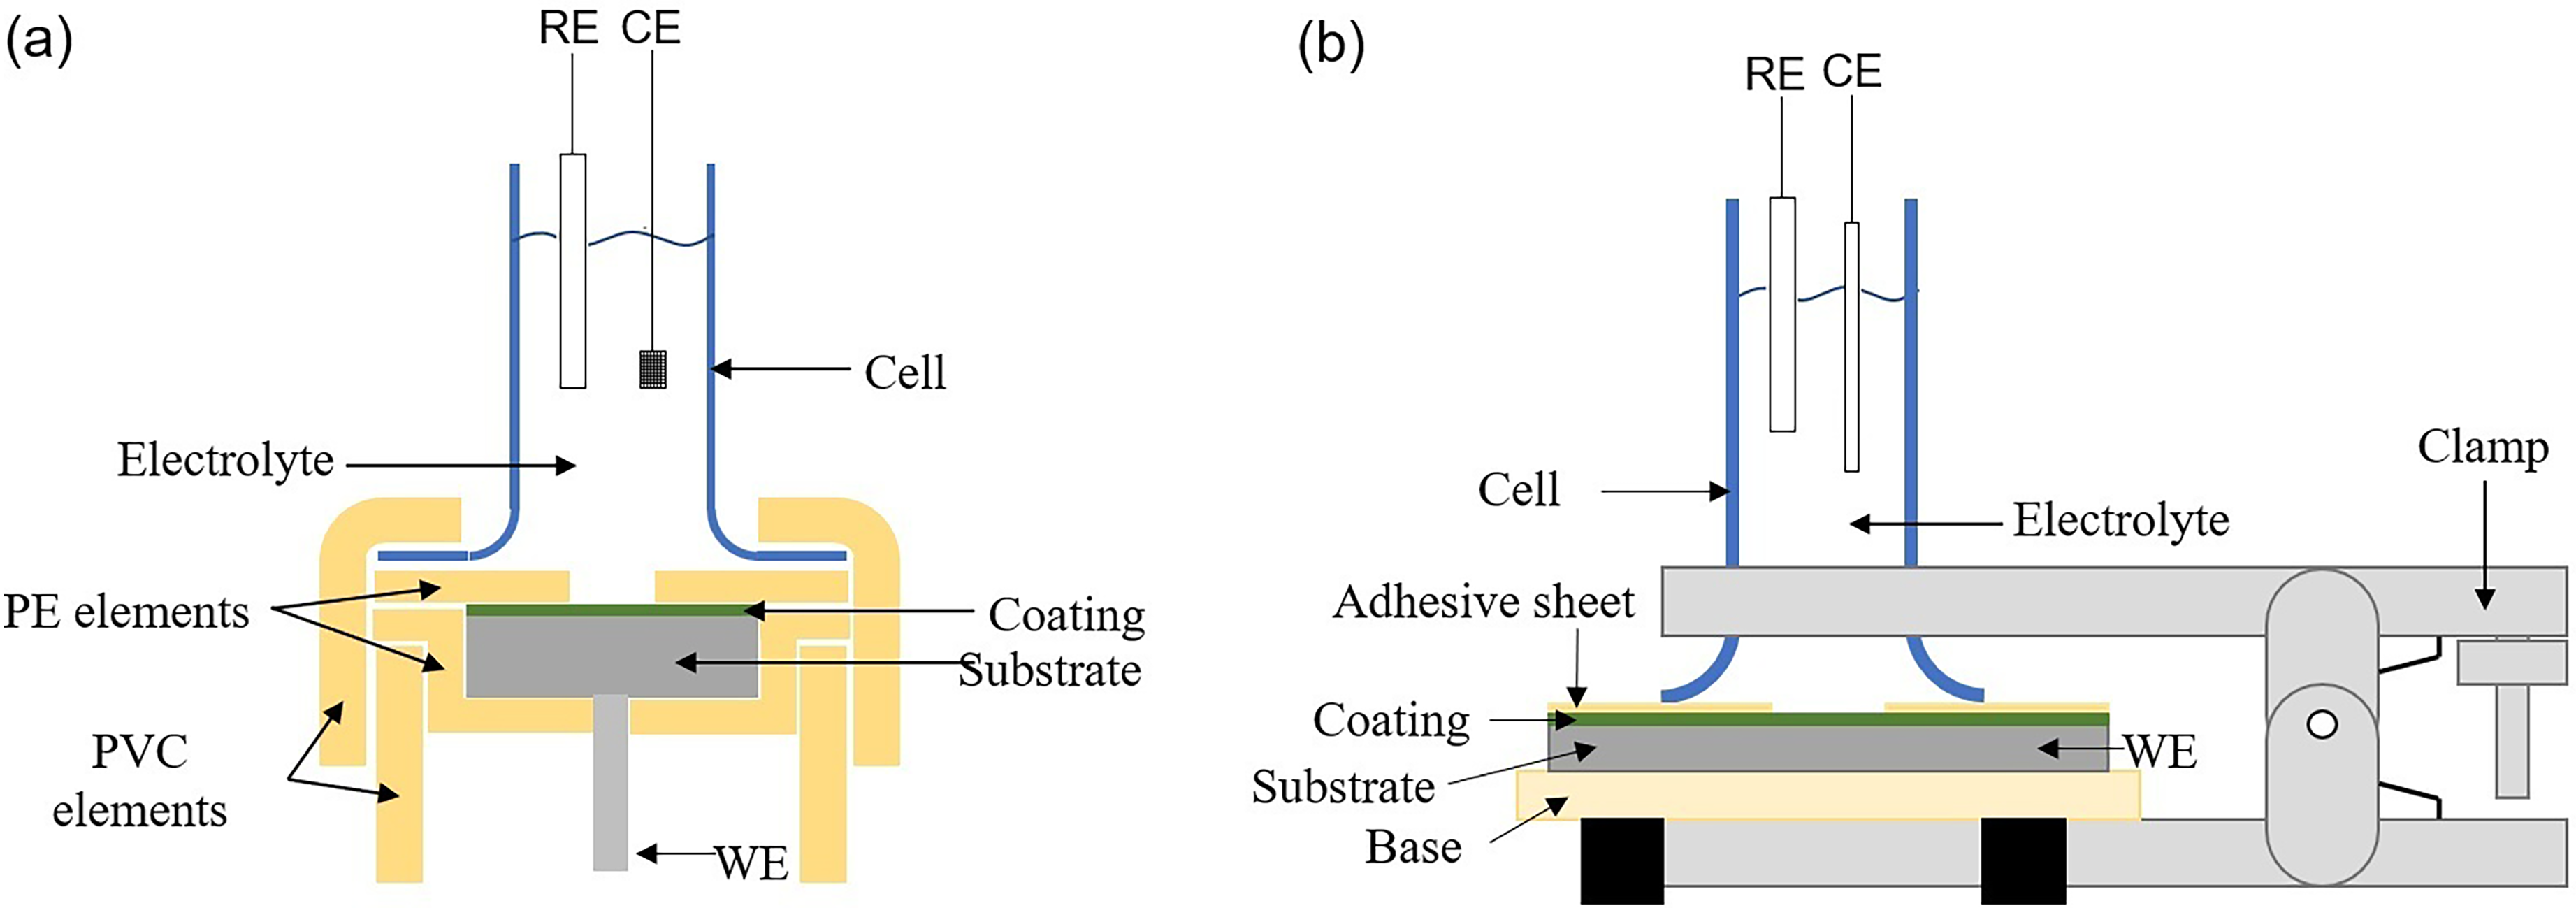
Electrochemical test cells for (a) AISI/SAE 1020 samples and (b) ASTM A572 samples. RE: Reference electrode. CE: Counter electrode. WE: Working electrode.
EIS tests were carried out after 1, 7, 14, 21 and 28 days of exposure to the electrolyte, determining the open-circuit potential (OCP) before each test. The frequency varied from 10 mHz to 100 kHz, with an applied amplitude potential of 5 mV, and the results were verified in triplicate. Similarly, the polarisation test was performed after the EIS test on the 28th day of exposure, scanning from −250 mV to 250 mV with respect to the OCP.
At the end of the electrochemical tests, the A1, A2 and A3 specimens were taken to the scanning electron microscope to analyse the elemental chemical composition of the corrosion products obtained.
Results and discussion
Ceramic powders
The results of SEM and XRD of the Cr2O3 and Al2O3 ceramic powders are presented in Figure 2. In Figure 2(a), the rounded shape of the Cr2O3 powder is visible due to the grinding process of the material, followed by sintering. In Figure 2(b), the angular morphology indicates the raw material's grinding process to produce the Al2O3 powders.
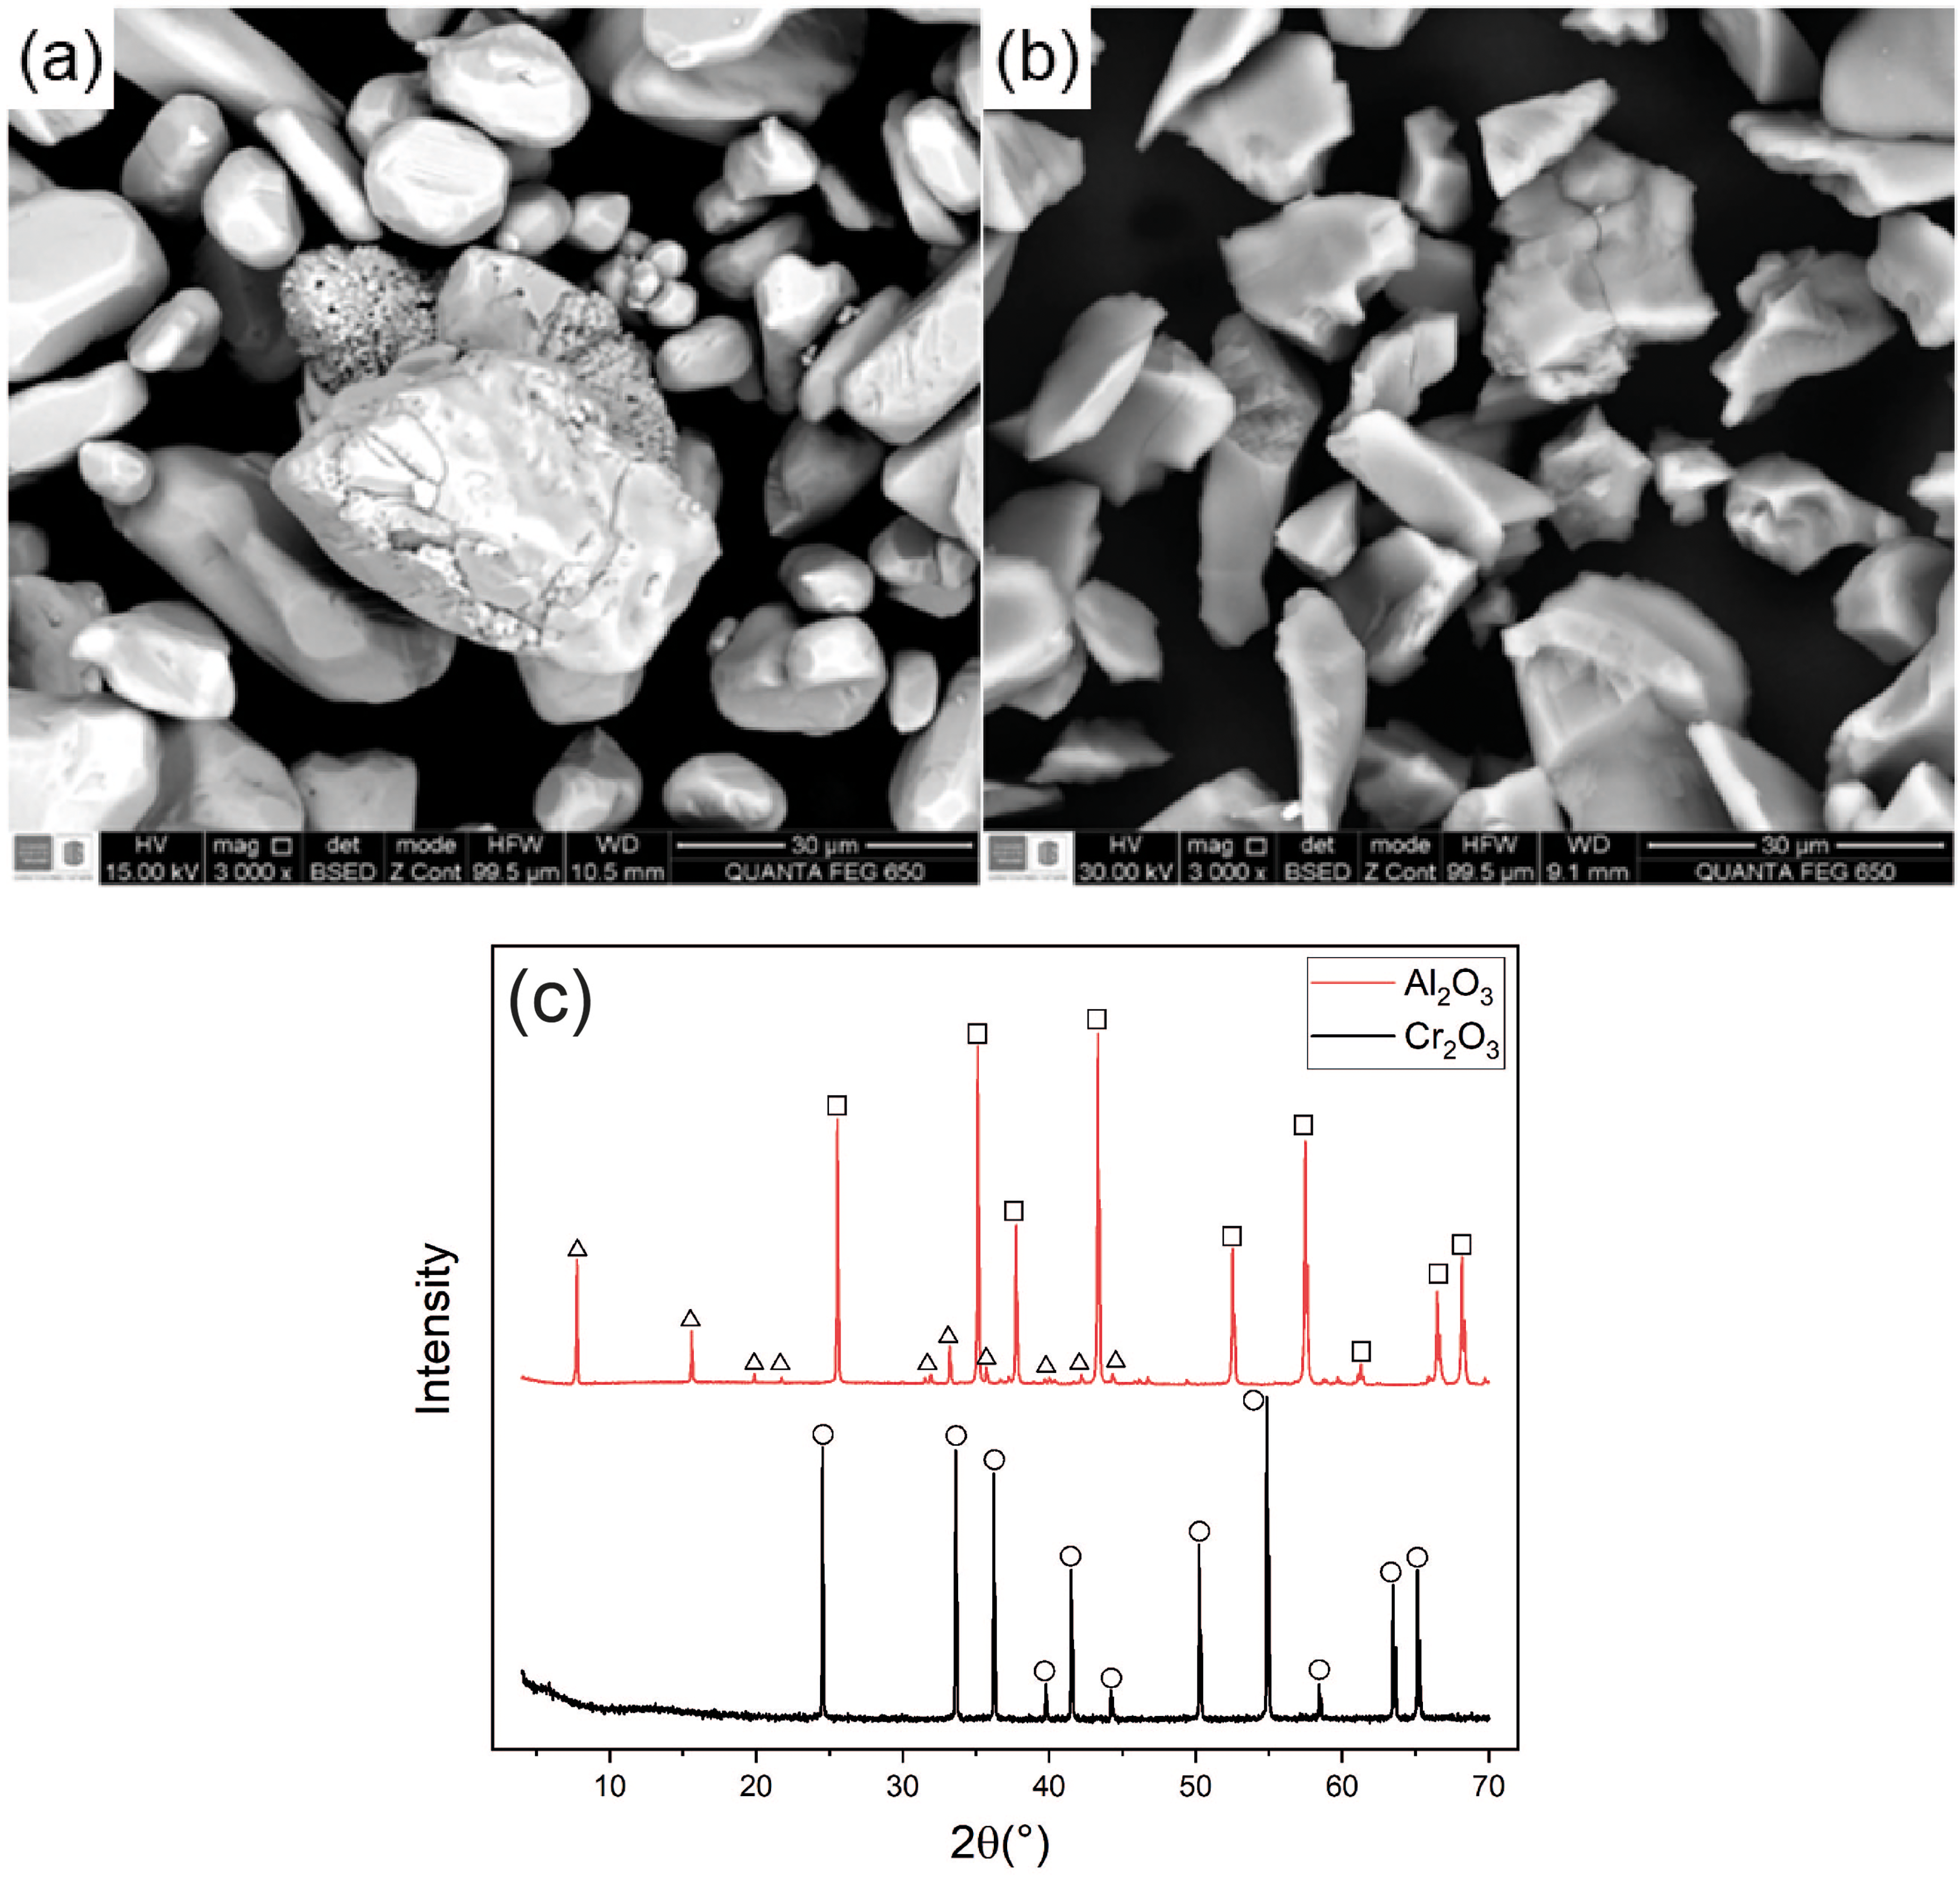
SEM of (a) Cr2O3 and (b) Al2O3 ceramic powders and (c) XRD patterns. Cr2O3 diffraction peaks (circle) correspond to the eskolaite phase, whereas the Al2O3 patterns exhibit corundum peaks (square) along with additional kahlenbergite peaks (triangle, KAl11O17).
Finally, Figure 2(c) shows the XRD patterns of both powders. In the Cr2O3 powders, the peaks corresponding to the eskolaite phase were identified. In contrast, the Al2O3 powders exhibited peaks associated with the corundum phase and with kahlenbergite, a potassium aluminium oxide phase with the chemical formula KAl11O17. 32
Ceramic coatings
Coatings elaborated by flame spraying have a layered structure formed by small overlapping sheets called lamellae. The structure of coatings elaborated by thermal spraying is inherently porous, as it is formed by superimposing lamellae at high speed and high temperature. Microcracks also form due to the cooling of the coating and the difference in thermal expansion coefficients of the materials, especially between the substrate and the coating.
Figure 3 shows the cross-sectional micrographs corresponding to all the coatings. The phase in the lowest part of each micrograph corresponds to the steel substrate, and there is also a light phase and a dark phase corresponding to the coating. EDS analysed the elemental chemical composition of both phases, and the results are presented in Figure 4.
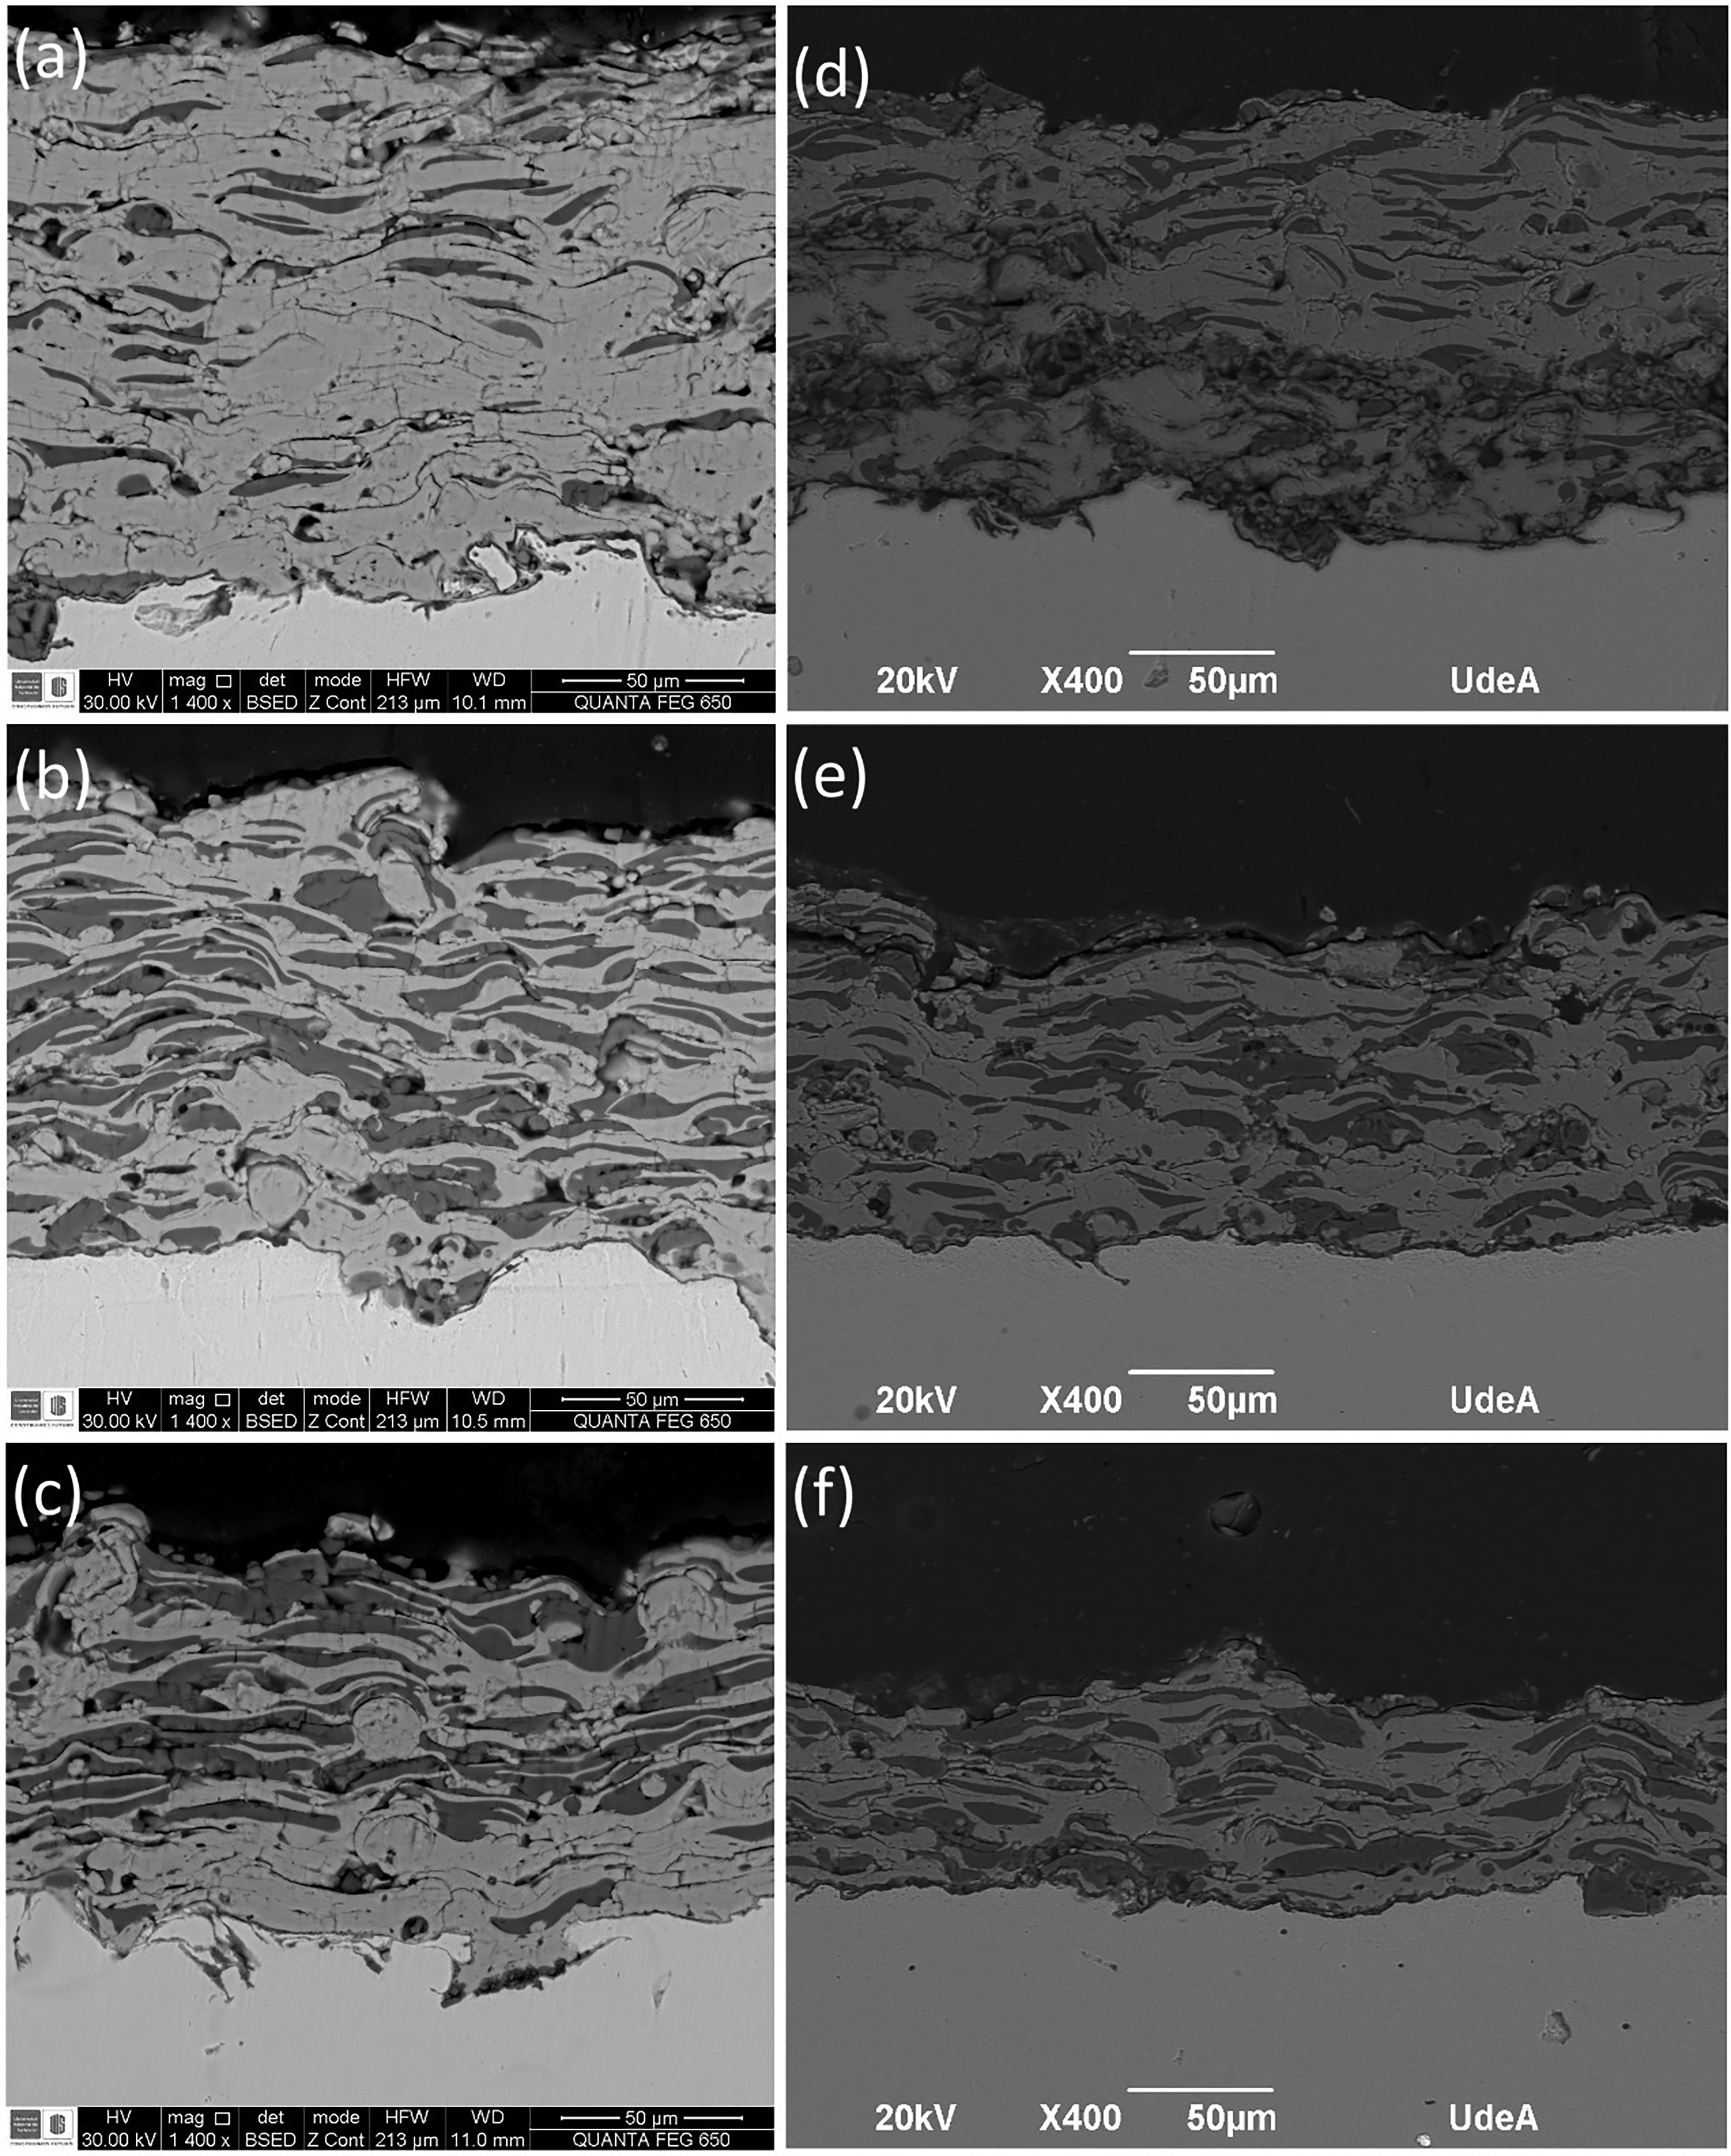
Cross-sectional SEM of (a) A1, (b) A2, (c) A3, (d) B1, (e) B2 and (f) B3 samples.
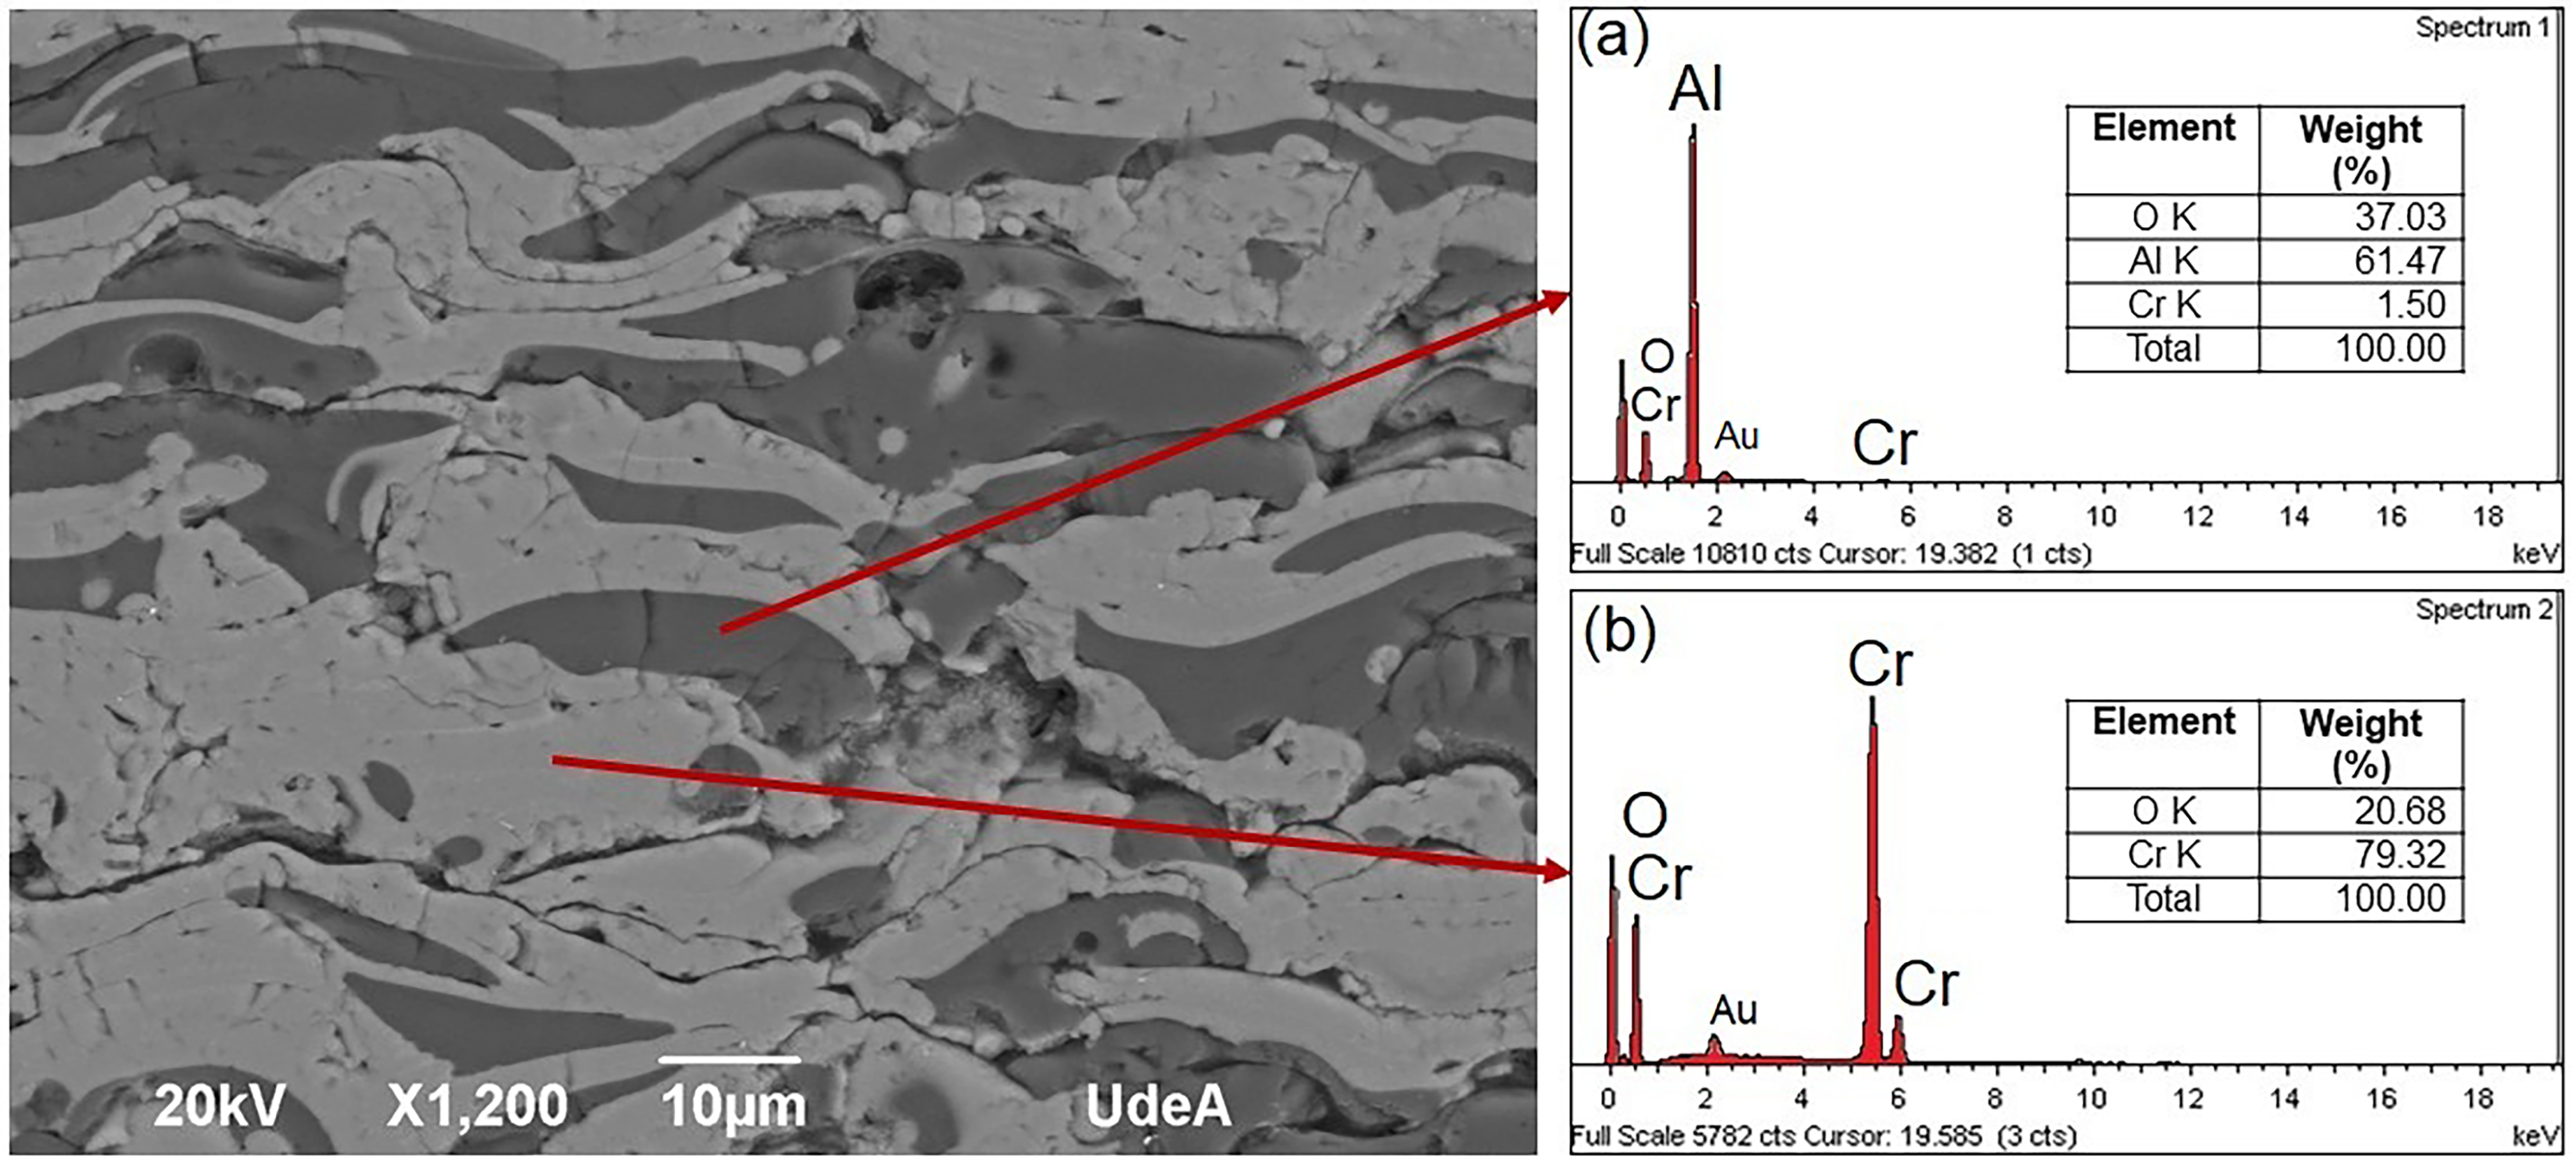
Elemental chemical composition of (a) darker phase and (b) lighter phase of the A2 coating measured by EDS.
Figure 4 shows the energy dispersive X-ray spectra taken at two points in the cross-section of the coating, the first corresponding to the dark phase (Figure 4(a)) and the second to the light phase (Figure 4(b)). The spectrum in Figure 4(a) indicates a predominant presence of aluminium and oxygen, with small amounts of chromium. On the other hand, Figure 4(b) shows the spectrum measured in the light phase, which is mainly composed of chromium and oxygen. The presence of chromium in Figure 4(a) may be due to the analysis area of the EDS test, as it does not measure the elemental chemical composition at a single point, but in a small region. 33 The presence of gold (Au) in the spectra is attributed to the gold layer applied during the initial preparation for testing.
Similarly, the lamellar structure of the coating can be appreciated in its cross-section, where the presence of microstructural defects was detected. Porosity in thermal spray coatings can be generated by air trapped during the spraying process, voids, unmolten particles, trapped gases, or the thermal contraction of the coating.34–36 Depending on their shape and size, pores can be identified as isolated pores, clustered pores and microcracks.37,38 In the coatings, isolated pores and microcracks were detected throughout the coating volume. Figure 5 shows the thickness and percentage of microstructural defects, referred to as porosity.
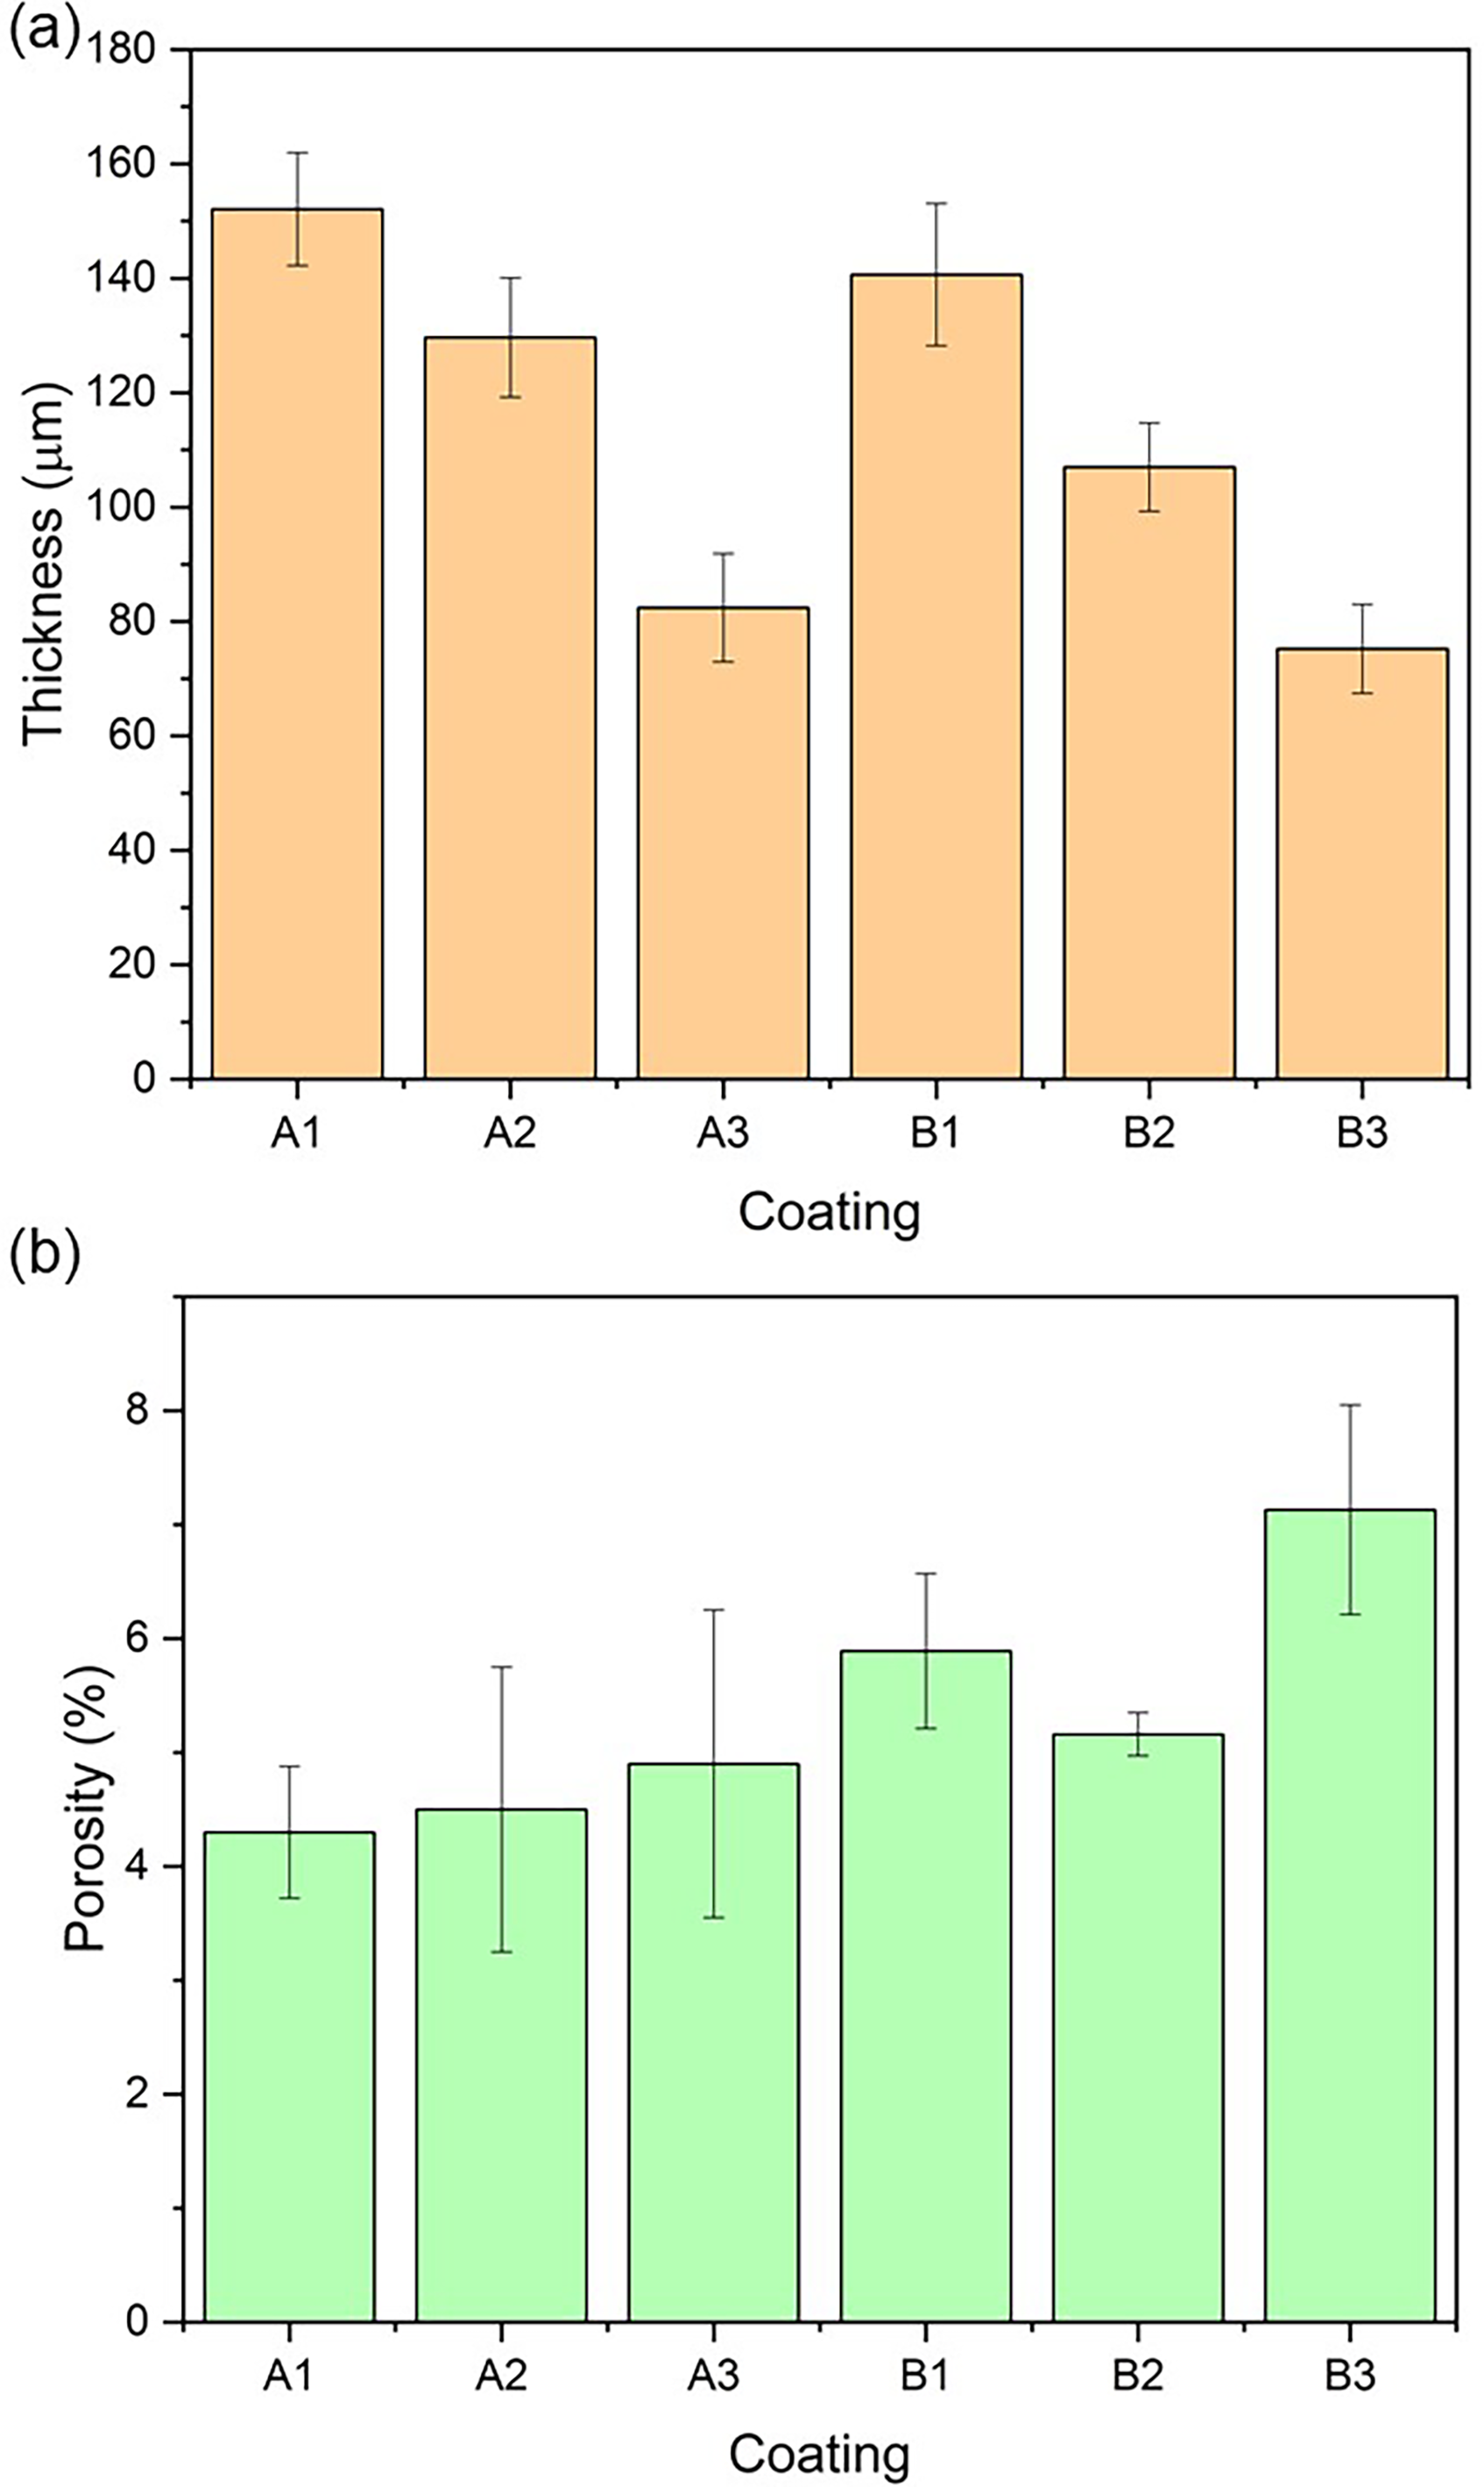
Coating thickness and porosity.
In Figure 5(a), it can be noted that the thickness of the coatings decreased as the amount of Al2O3 increased, meaning the A1 and B1 coatings (10% Al2O3) had the highest thickness, while the A2 and B2 coatings (20% Al2O3) had intermediate thickness. Finally, the A3 and B3 coatings (30% Al2O3) had the lowest thickness. This relationship can be attributed to the favourable effect that Al2O3 has in increasing the compactness or stacking of the melted particles in the Cr2O3 coatings, as reported by Yang et al. 19 These authors found that Al2O3 with Cr2O3 coatings elaborated by plasma spraying improve: the cohesion between lamellae, fracture toughness, bending strength and hardness. Similarly, Figure 5(b) shows that the microstructural defect values are similar for the A1, A2 and A3 coatings, considering their standard deviation. The average microstructural defect value among the B1, B2 and B3 was analysed following the same process. B2 coating showed the lowest microstructural defect percentage among ASTM A572 samples, followed by B1 coating and B3.
XRD was performed on their surface to identify the crystalline phases present in the coatings. The diffraction spectra are presented in Figure 6. These spectra show that all the coatings exhibit the same prominent peaks, primarily identifying the eskolaite phase of chromium oxide (PDF 01-078-5444), and aluminium oxide in the corundum phase (PDF 01-078-3877). These results suggest that the behaviour of the coating corresponds to what is expected according to the literature. The results show no marked difference in the amount of Al2O3 present in the coatings, indicating that the intensities and positions of the peaks are similar across all coatings due to the crystallinity.
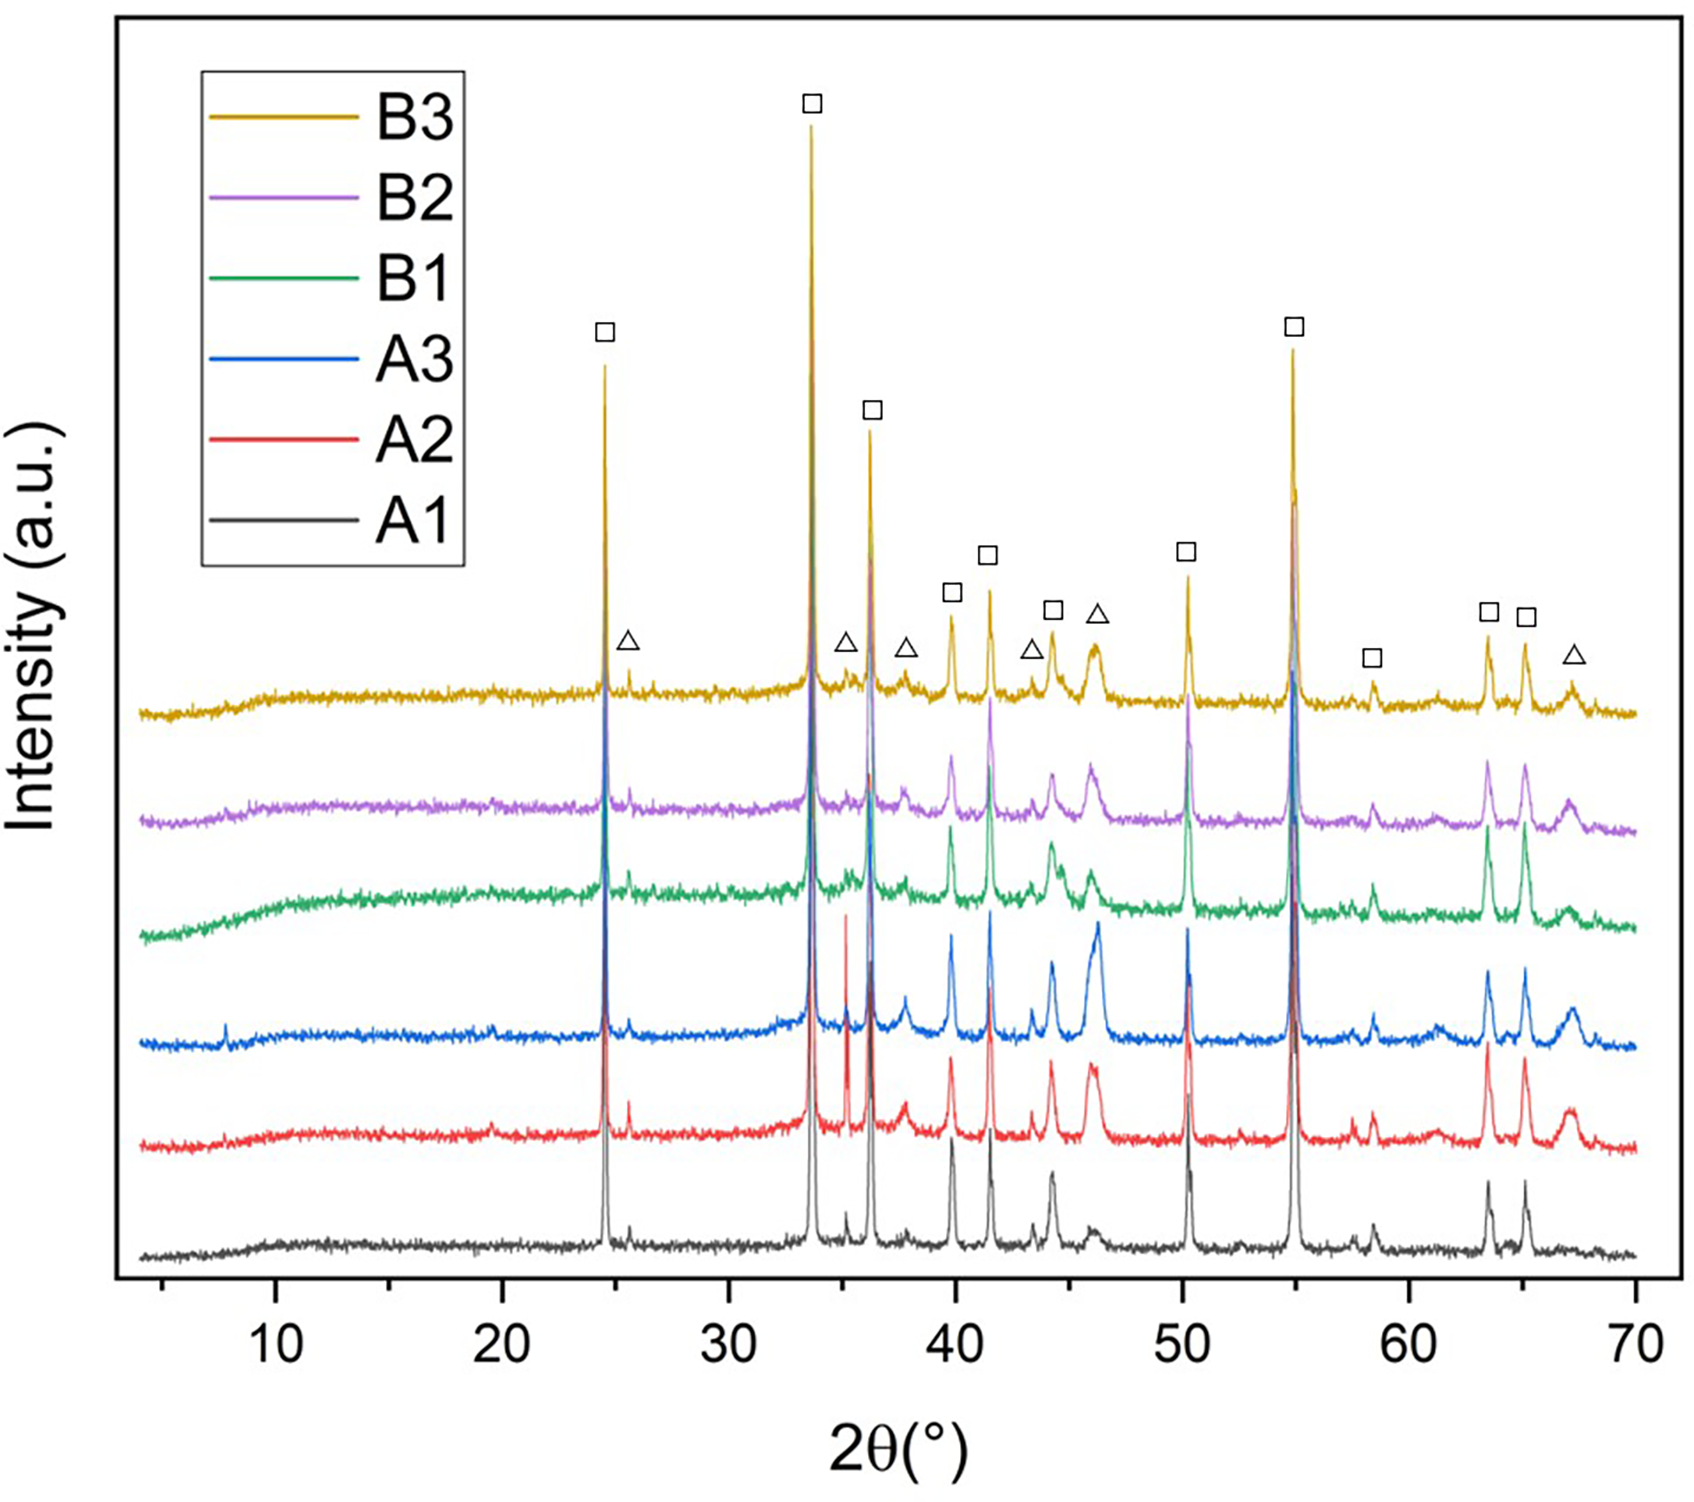
XRD of the coatings where eskolaite (squares) and corundum (triangles).
Electrochemical tests
EIS was used to analyse the corrosion protective capacity after 1, 7, 14, 21 and 28 days of exposure to artificial seawater. Equivalent circuits were considered to analyse the EIS results; these circuits are presented in Figure 7. The Nyquist plots and polarisation resistance values are presented in Figures 8 and 9, while the Bode plots are shown in Figures 10 and 11. Additionally, polarisation curves were performed after 28 days of exposure and are presented in Figure 12.
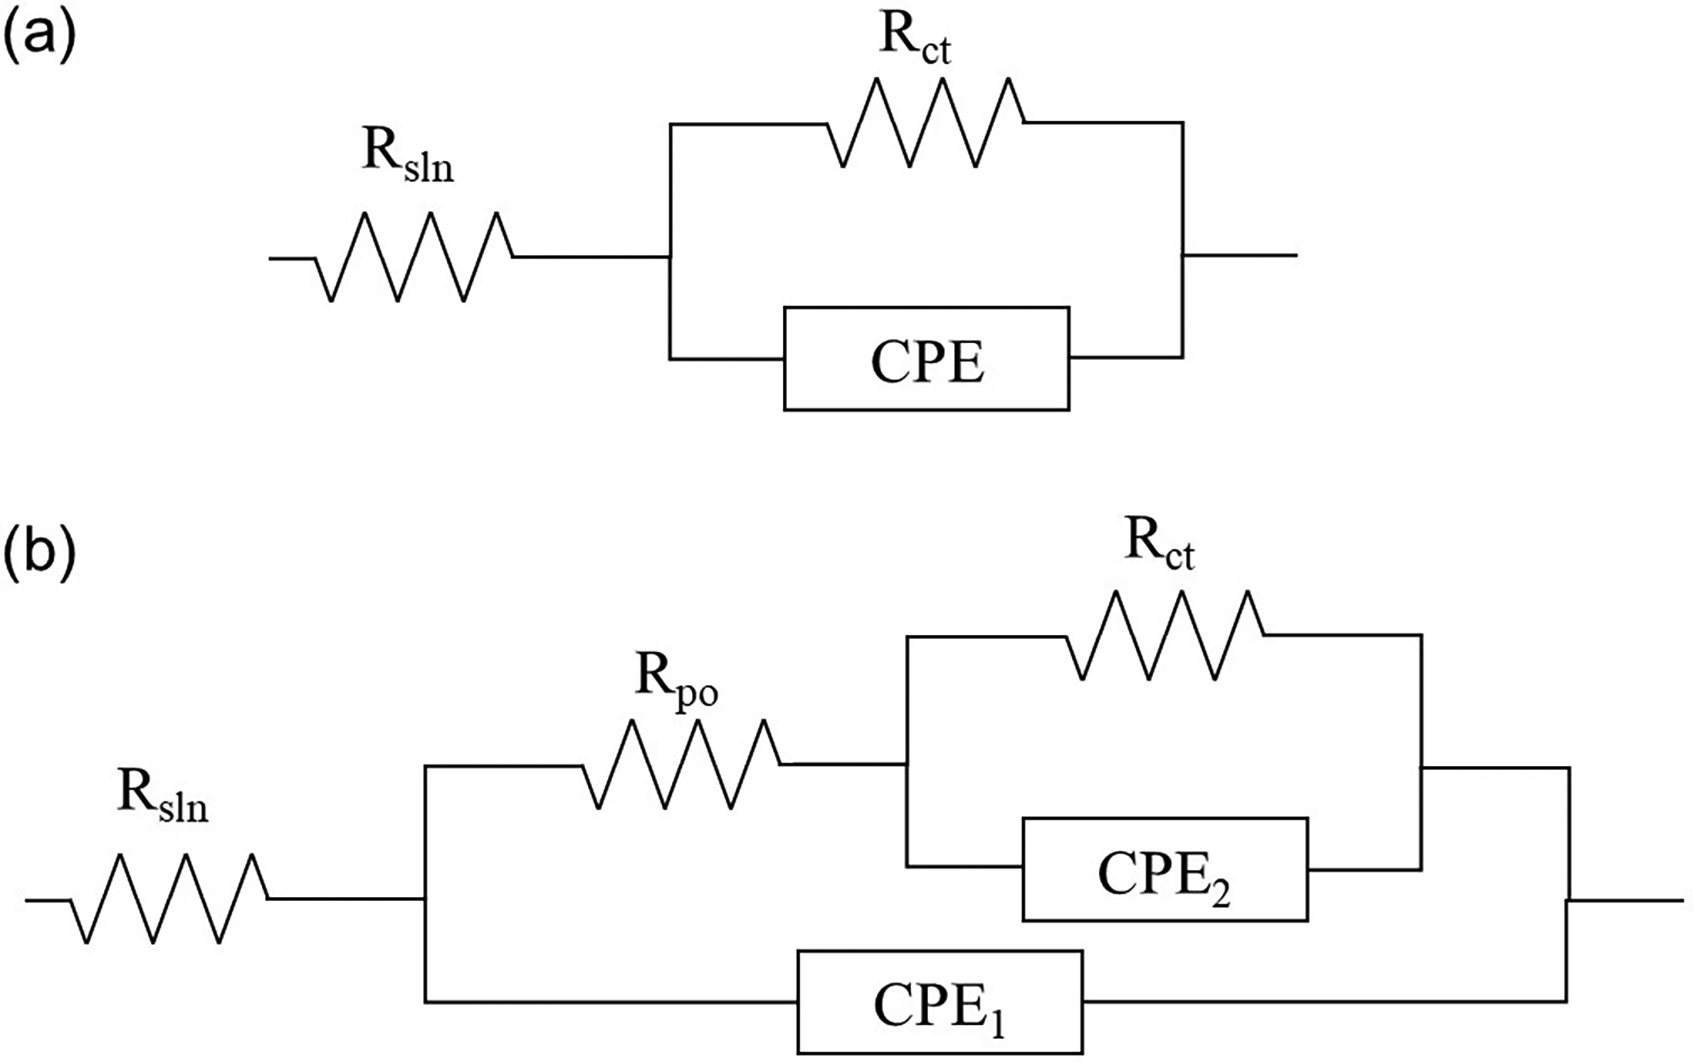
Equivalent circuits for (a) uncoated metal samples and (b) flame-sprayed ceramic coating samples for EIS tests.
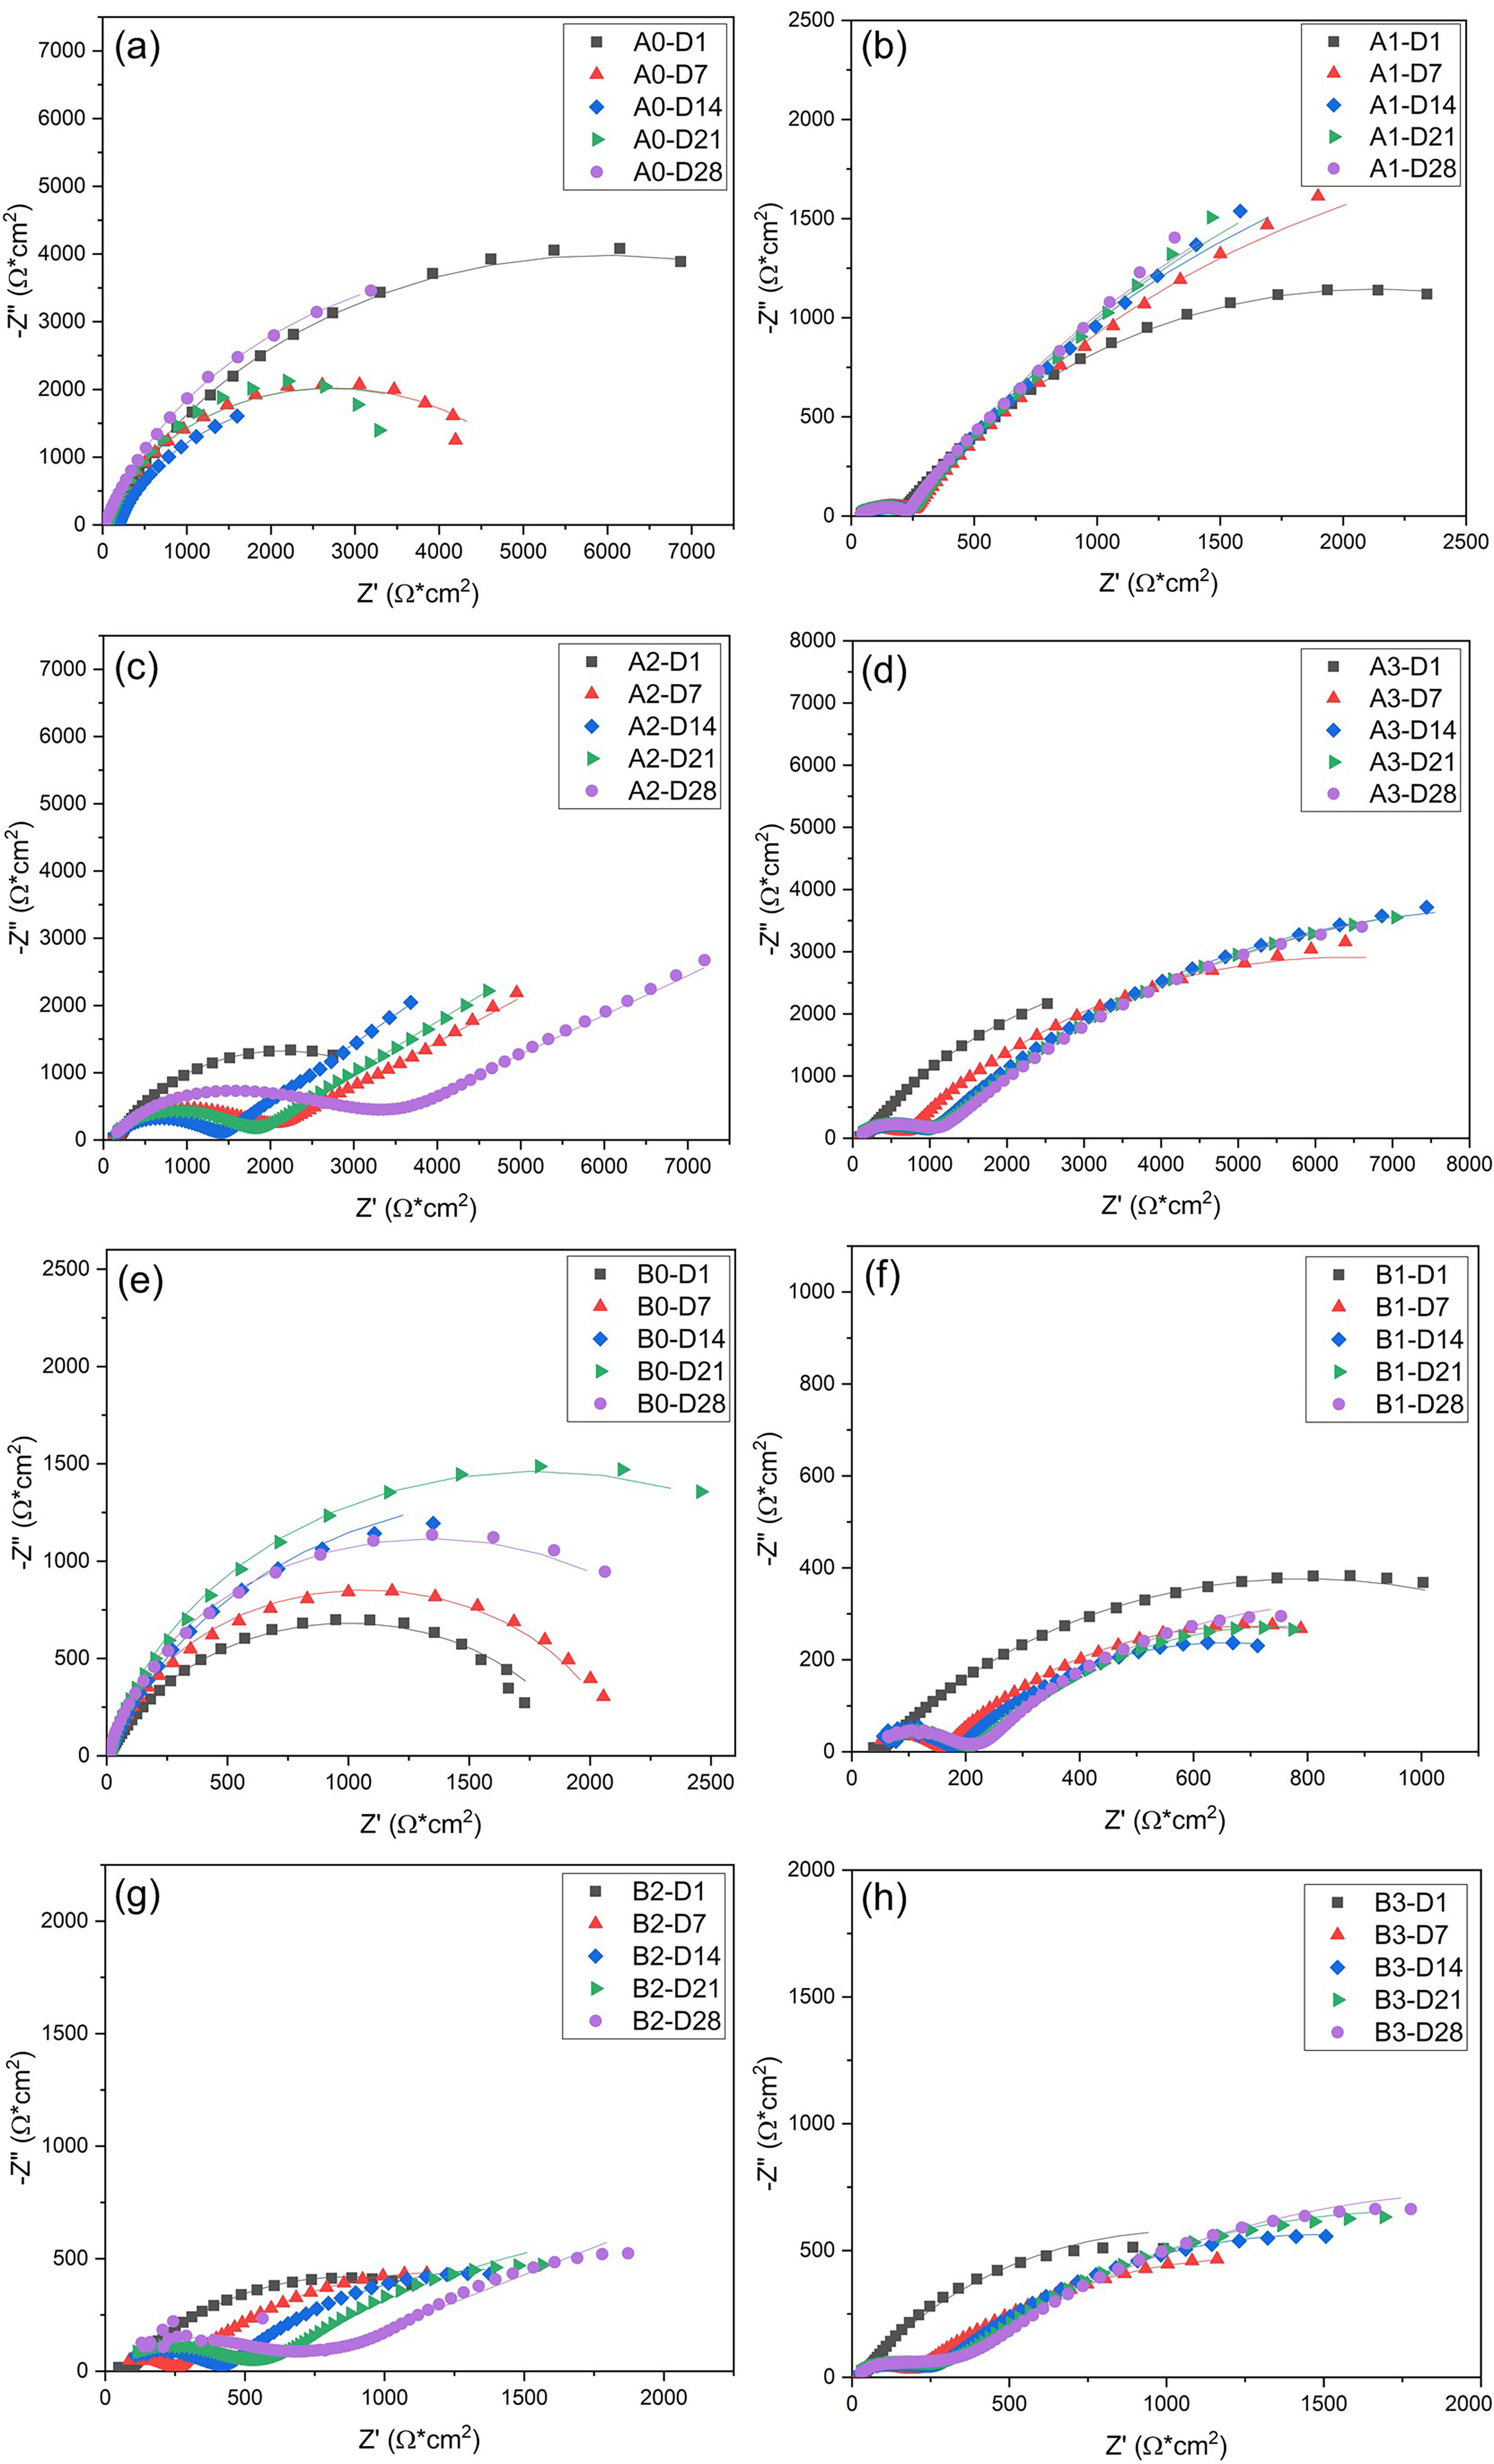
Nyquist diagrams for (a) A0, (b) A1, (c) A2, (d) A3, (e) B0, (f) B1, (g) B2 and (h) B3 samples evaluated in artificial seawater at different periods.
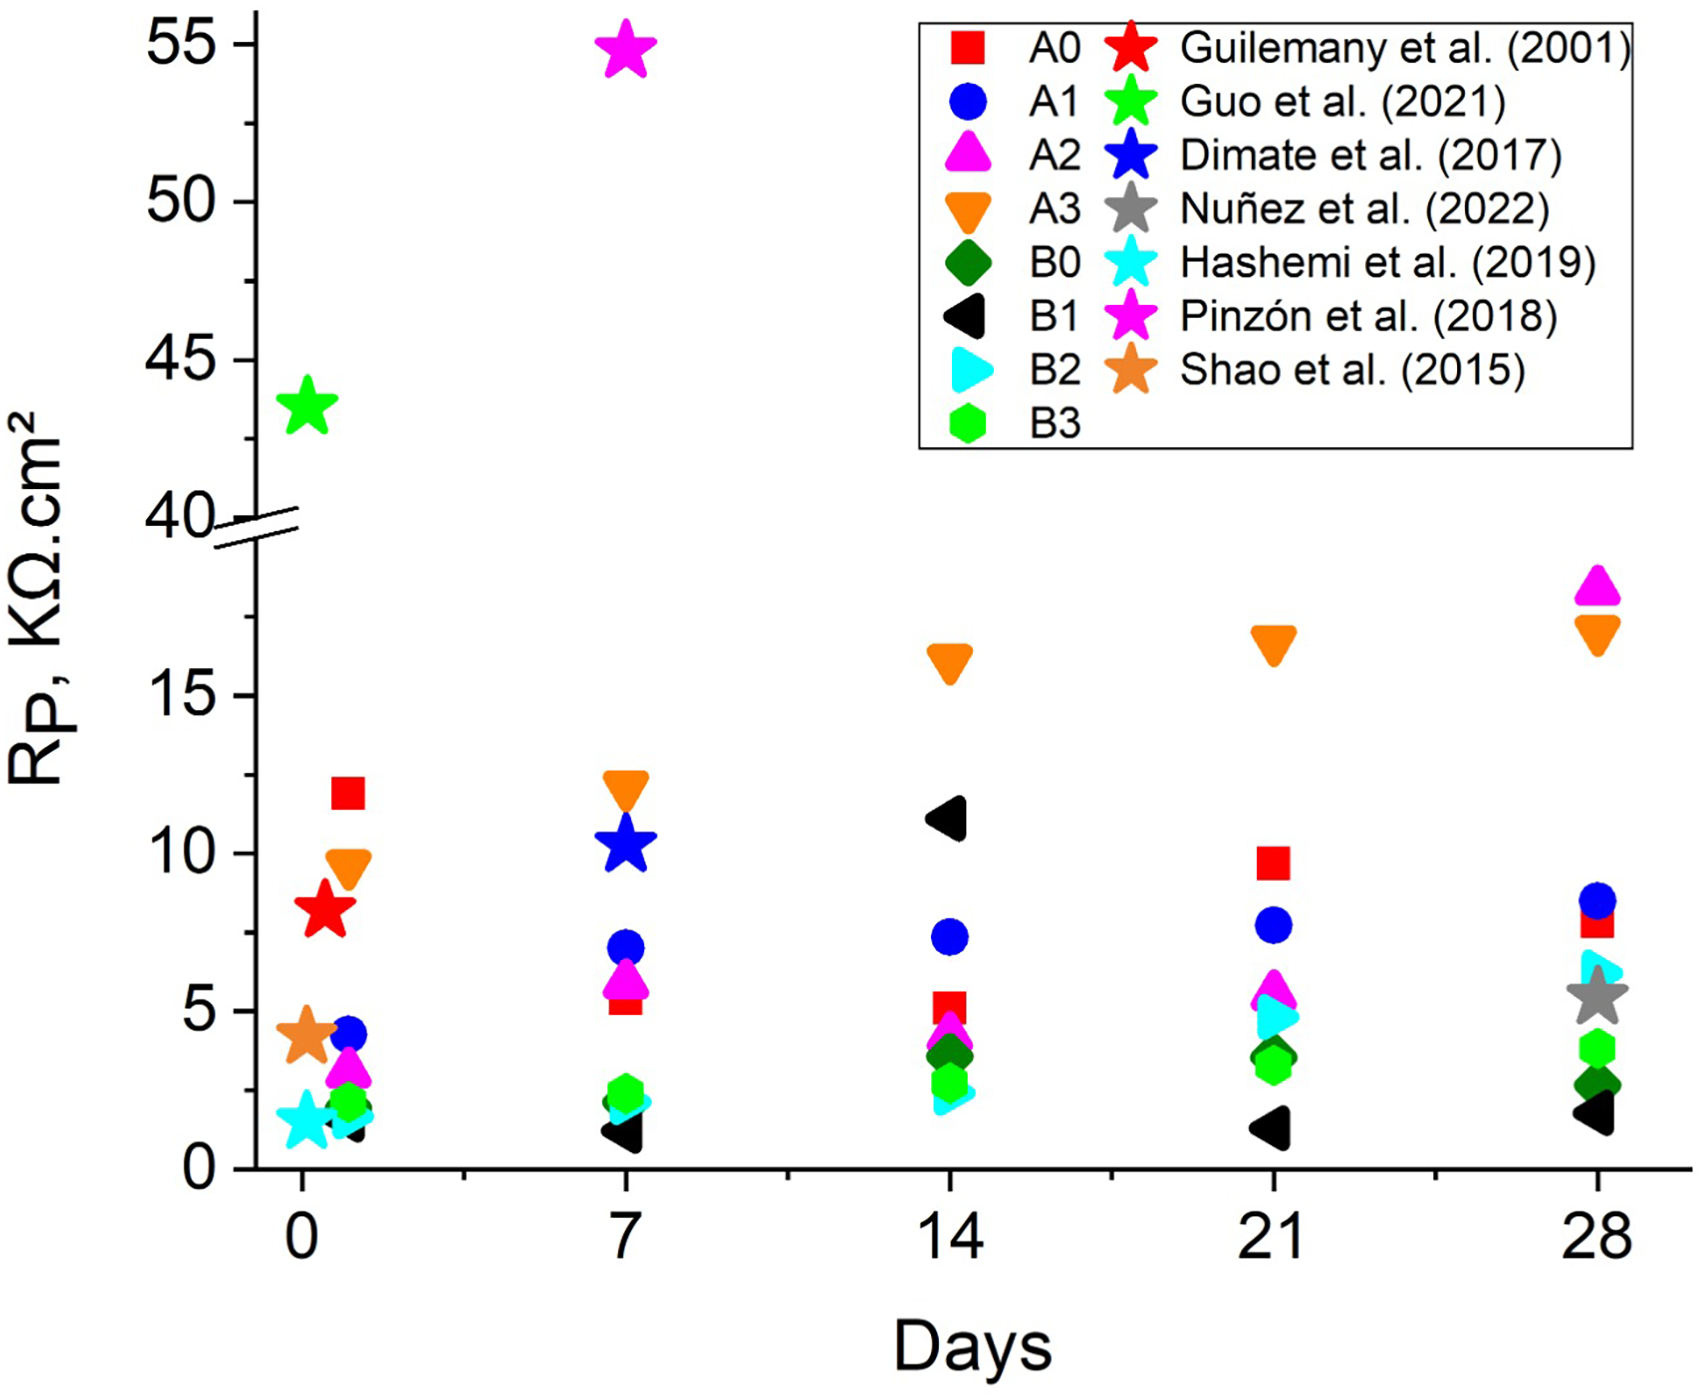
Polarisation resistance (RP) values of coated and uncoated samples after exposure to artificial seawater at different immersion times, compared with literature-reported data.
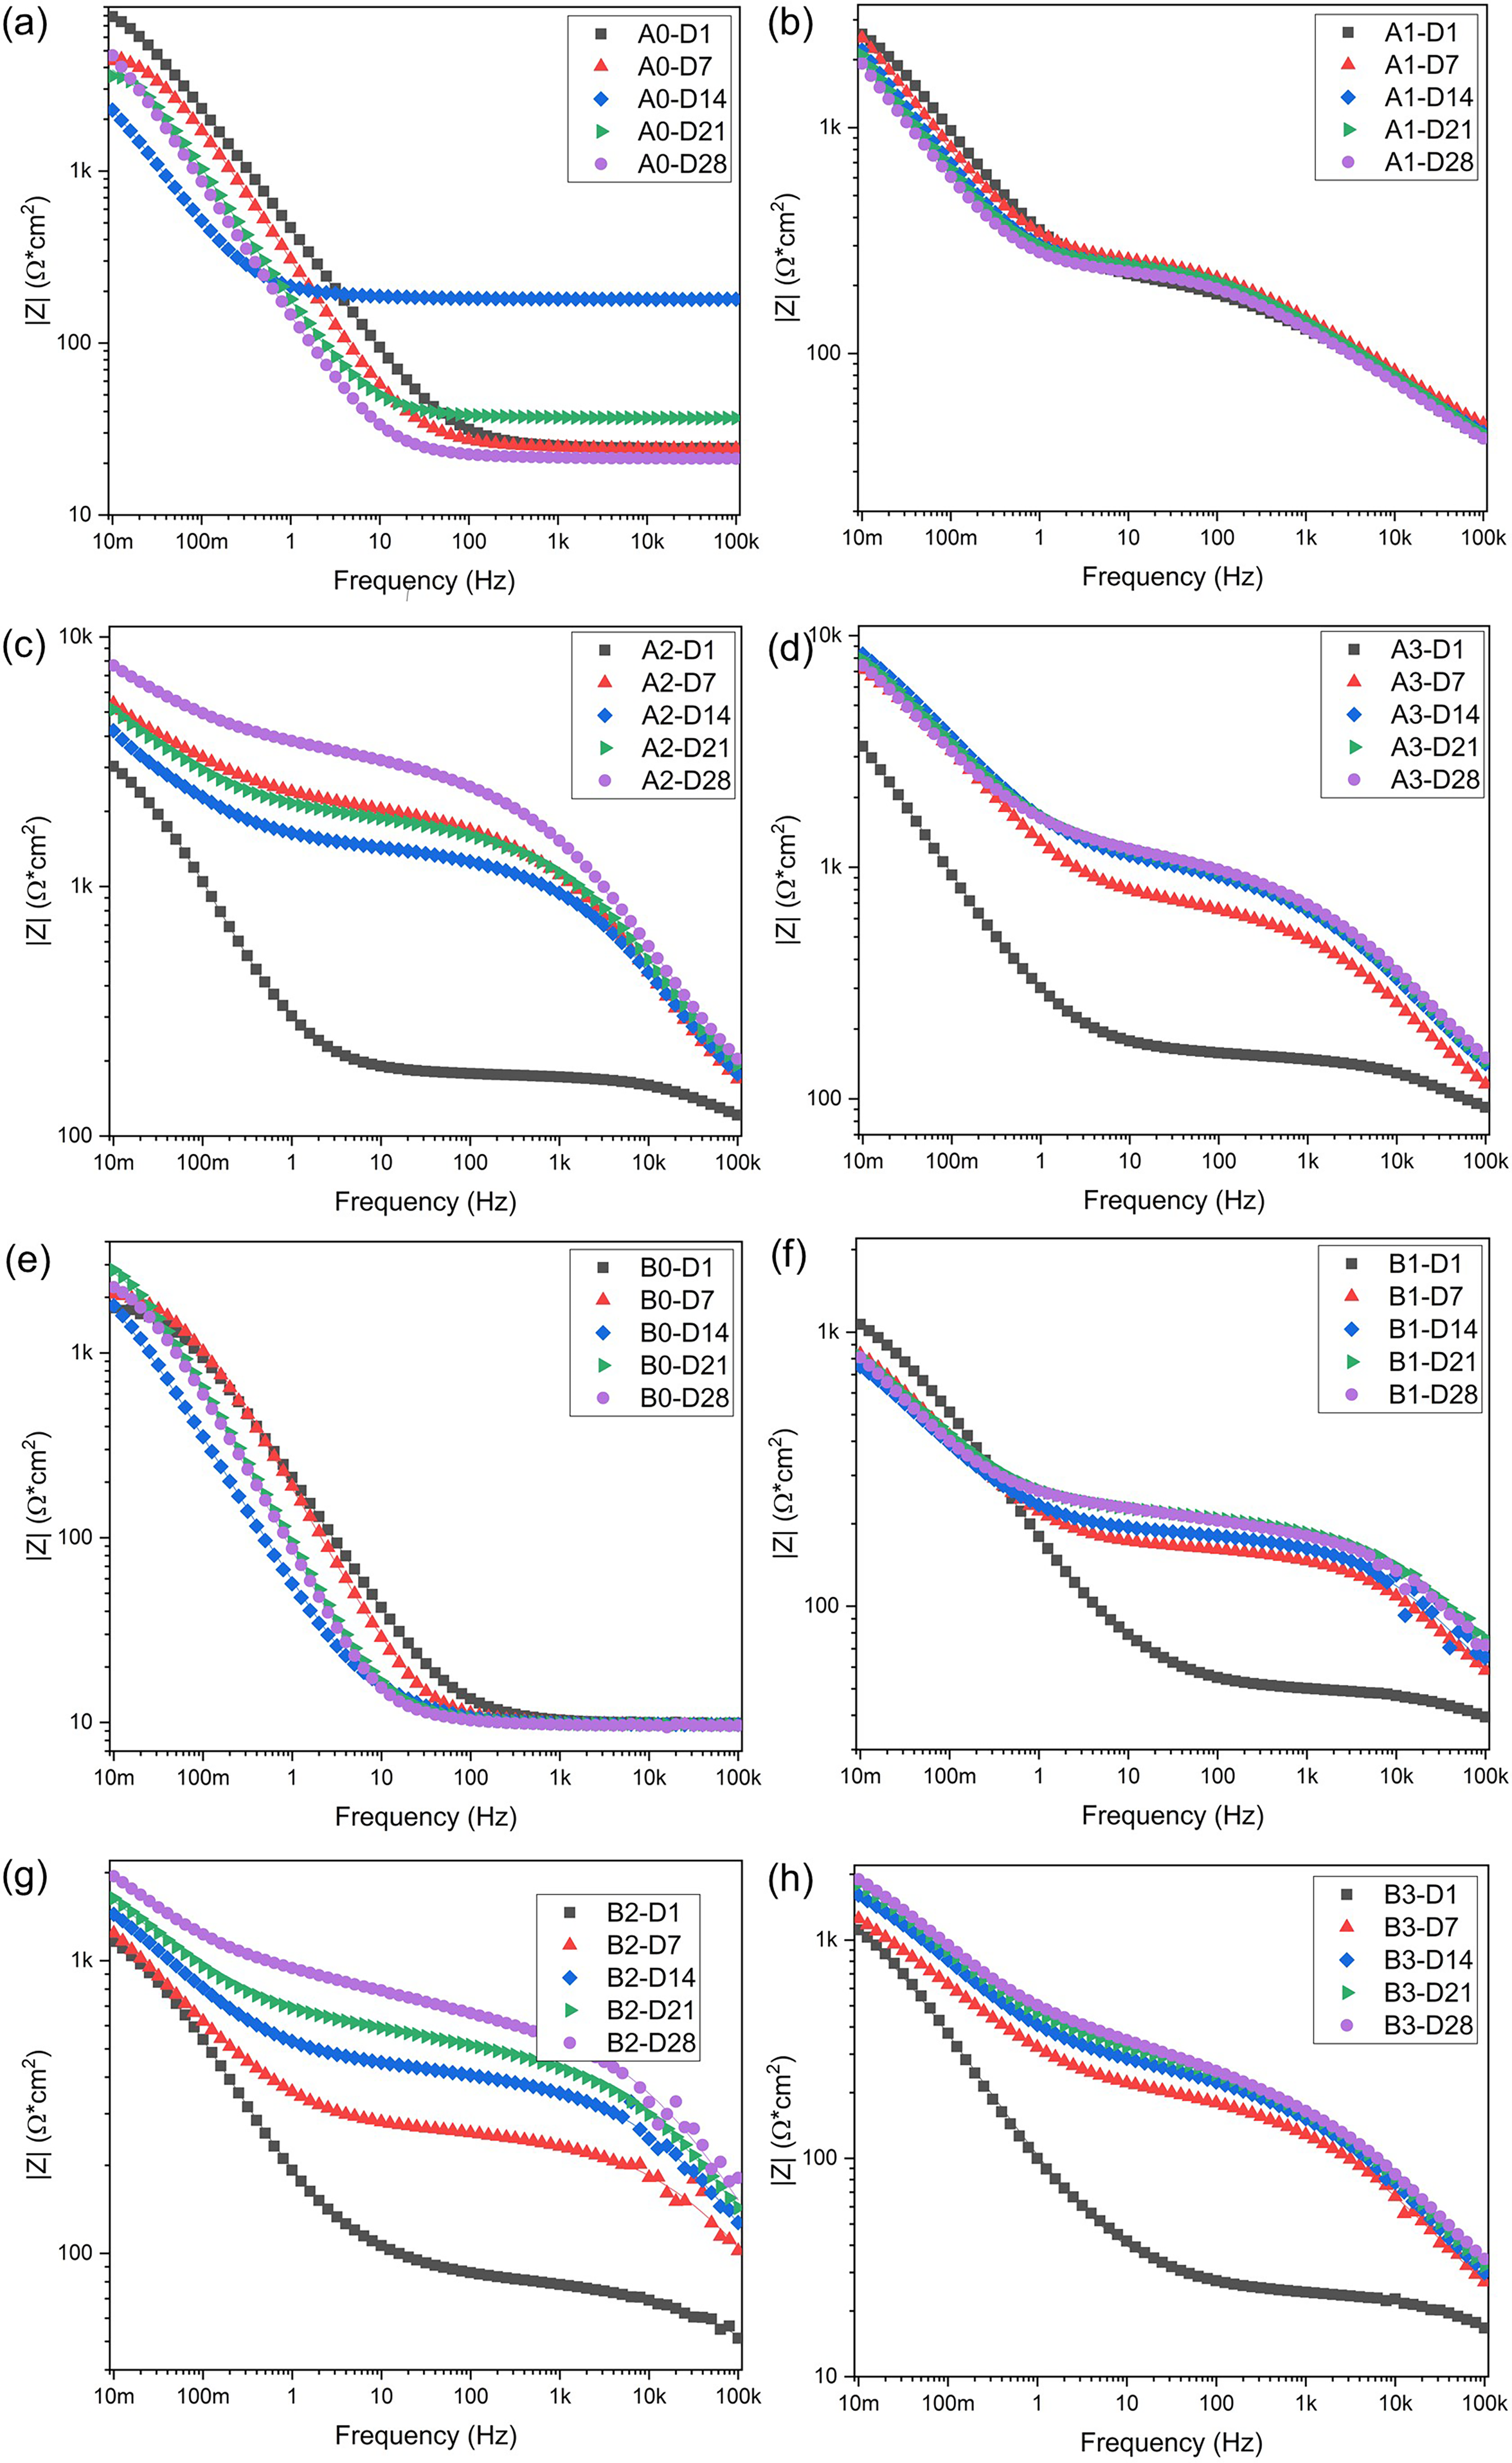
Impedance magnitude Bode diagrams for (a) A0, (b) A1, (c) A2, (d) A3, (e) B0, (f) B1, (g) B2, (h) B3 samples evaluated in artificial seawater at different periods.
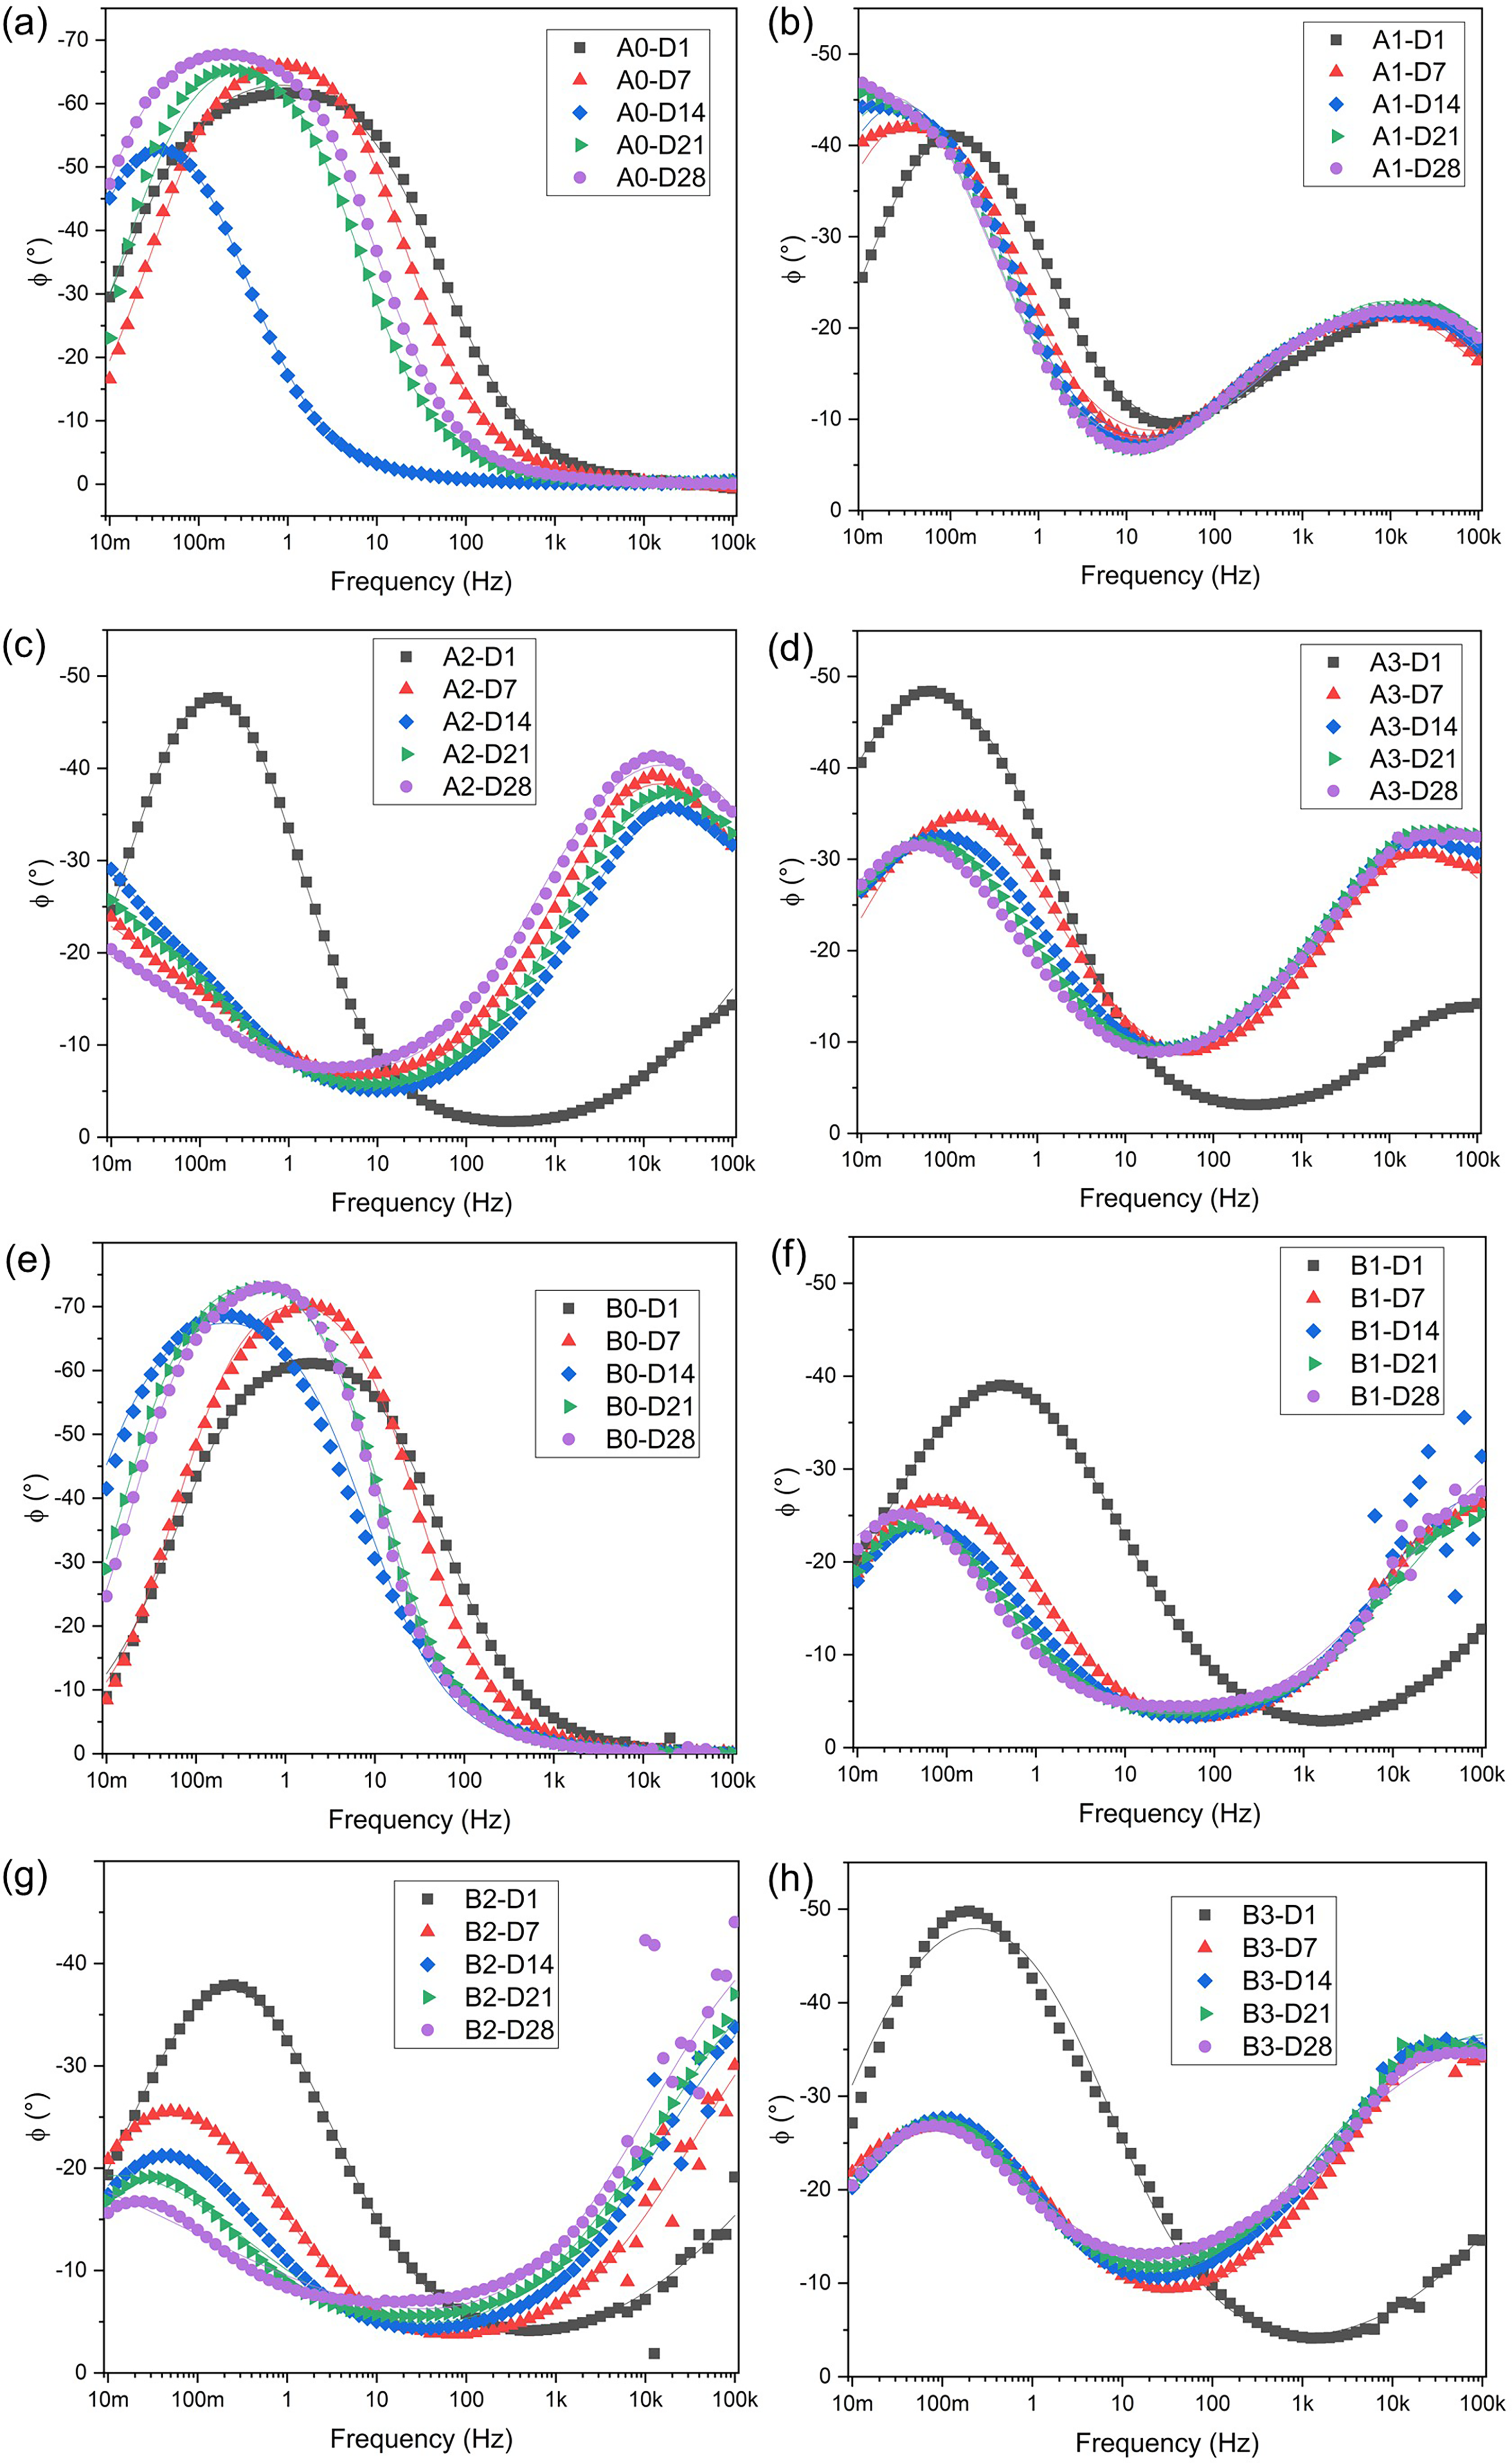
Phase angle Bode diagrams for (a) A0, (b) A1, (c) A2, (d) A3, (e) B0, (f) B1, (g) B2 and (h) B3 samples evaluated in artificial seawater at different periods.
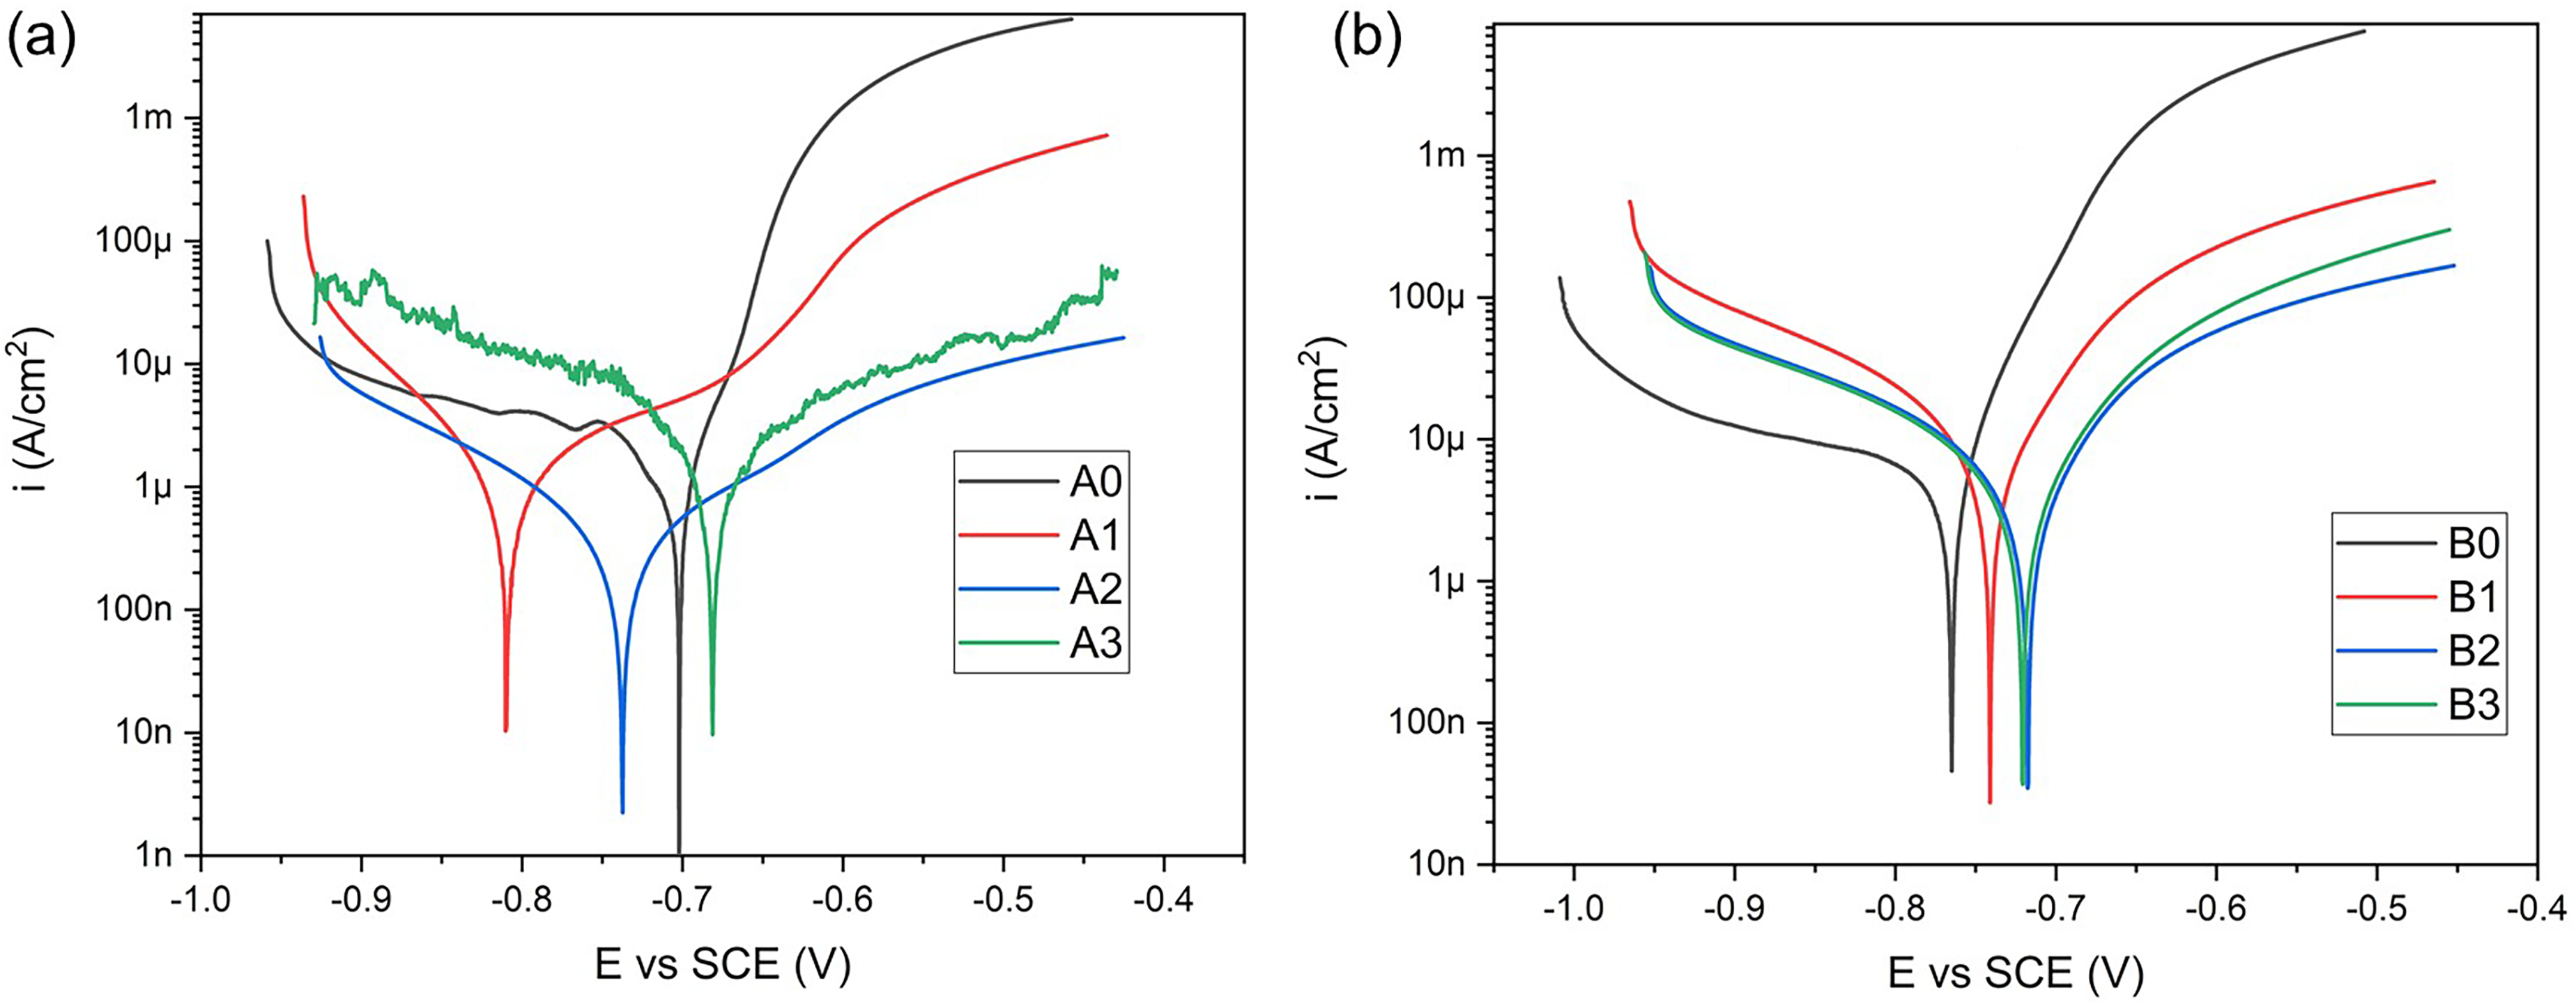
Polarisation curves of (a) AISI/SAE 1020 and (b) ASTM A572 samples after 28 days of exposure to artificial seawater.
The protective capacity has been related to the polarisation resistance (RP), as it is directly proportional to corrosion resistance, providing essential information about its behaviour in a seawater environment.
39
The polarisation resistance of the ceramic-coated samples was calculated using equation (1),
40
where Rct is the charge transfer resistance and RPo is the coating pore resistance. For uncoated samples A0 and B0, Rct is taken as the polarisation resistance (RP).
A commonly used equivalent circuit for ceramic coatings elaborated by thermal spraying 41 is presented in Figure 7. The resistances in the model correspond to Rsln (solution resistance), RPo (resistance to current flow through the coating pores) and Rct (charge transfer resistance), and the constant phase elements (CPEs) reflect the capacitive properties of the coating and the substrate. CPEs were used instead of ideal capacitors to improve the fit of the obtained data, as both the substrate and the coating are elements with many heterogeneities, such as porosity and roughness. 40 Figure 7(a) was used for A0 and B0 samples, in which an uncoated substrate was tested. Due to the previous, no RPo nor a second CPE related to the capacitive property of the coating was considered. Figure 7(b) represents the circuit for coated samples, where CPE₁ (Q₁, n₁) and CPE₂ (Q₂, n₂) correspond to the capacitive response of the coating/electrolyte and metal/coating interfaces, respectively. Here, Q denotes the magnitude of the CPE, expressed in S·sⁿ·cm−2, and n is the corresponding exponent (0 ≤ n ≤ 1) that indicates the deviation from ideal capacitive behaviour.
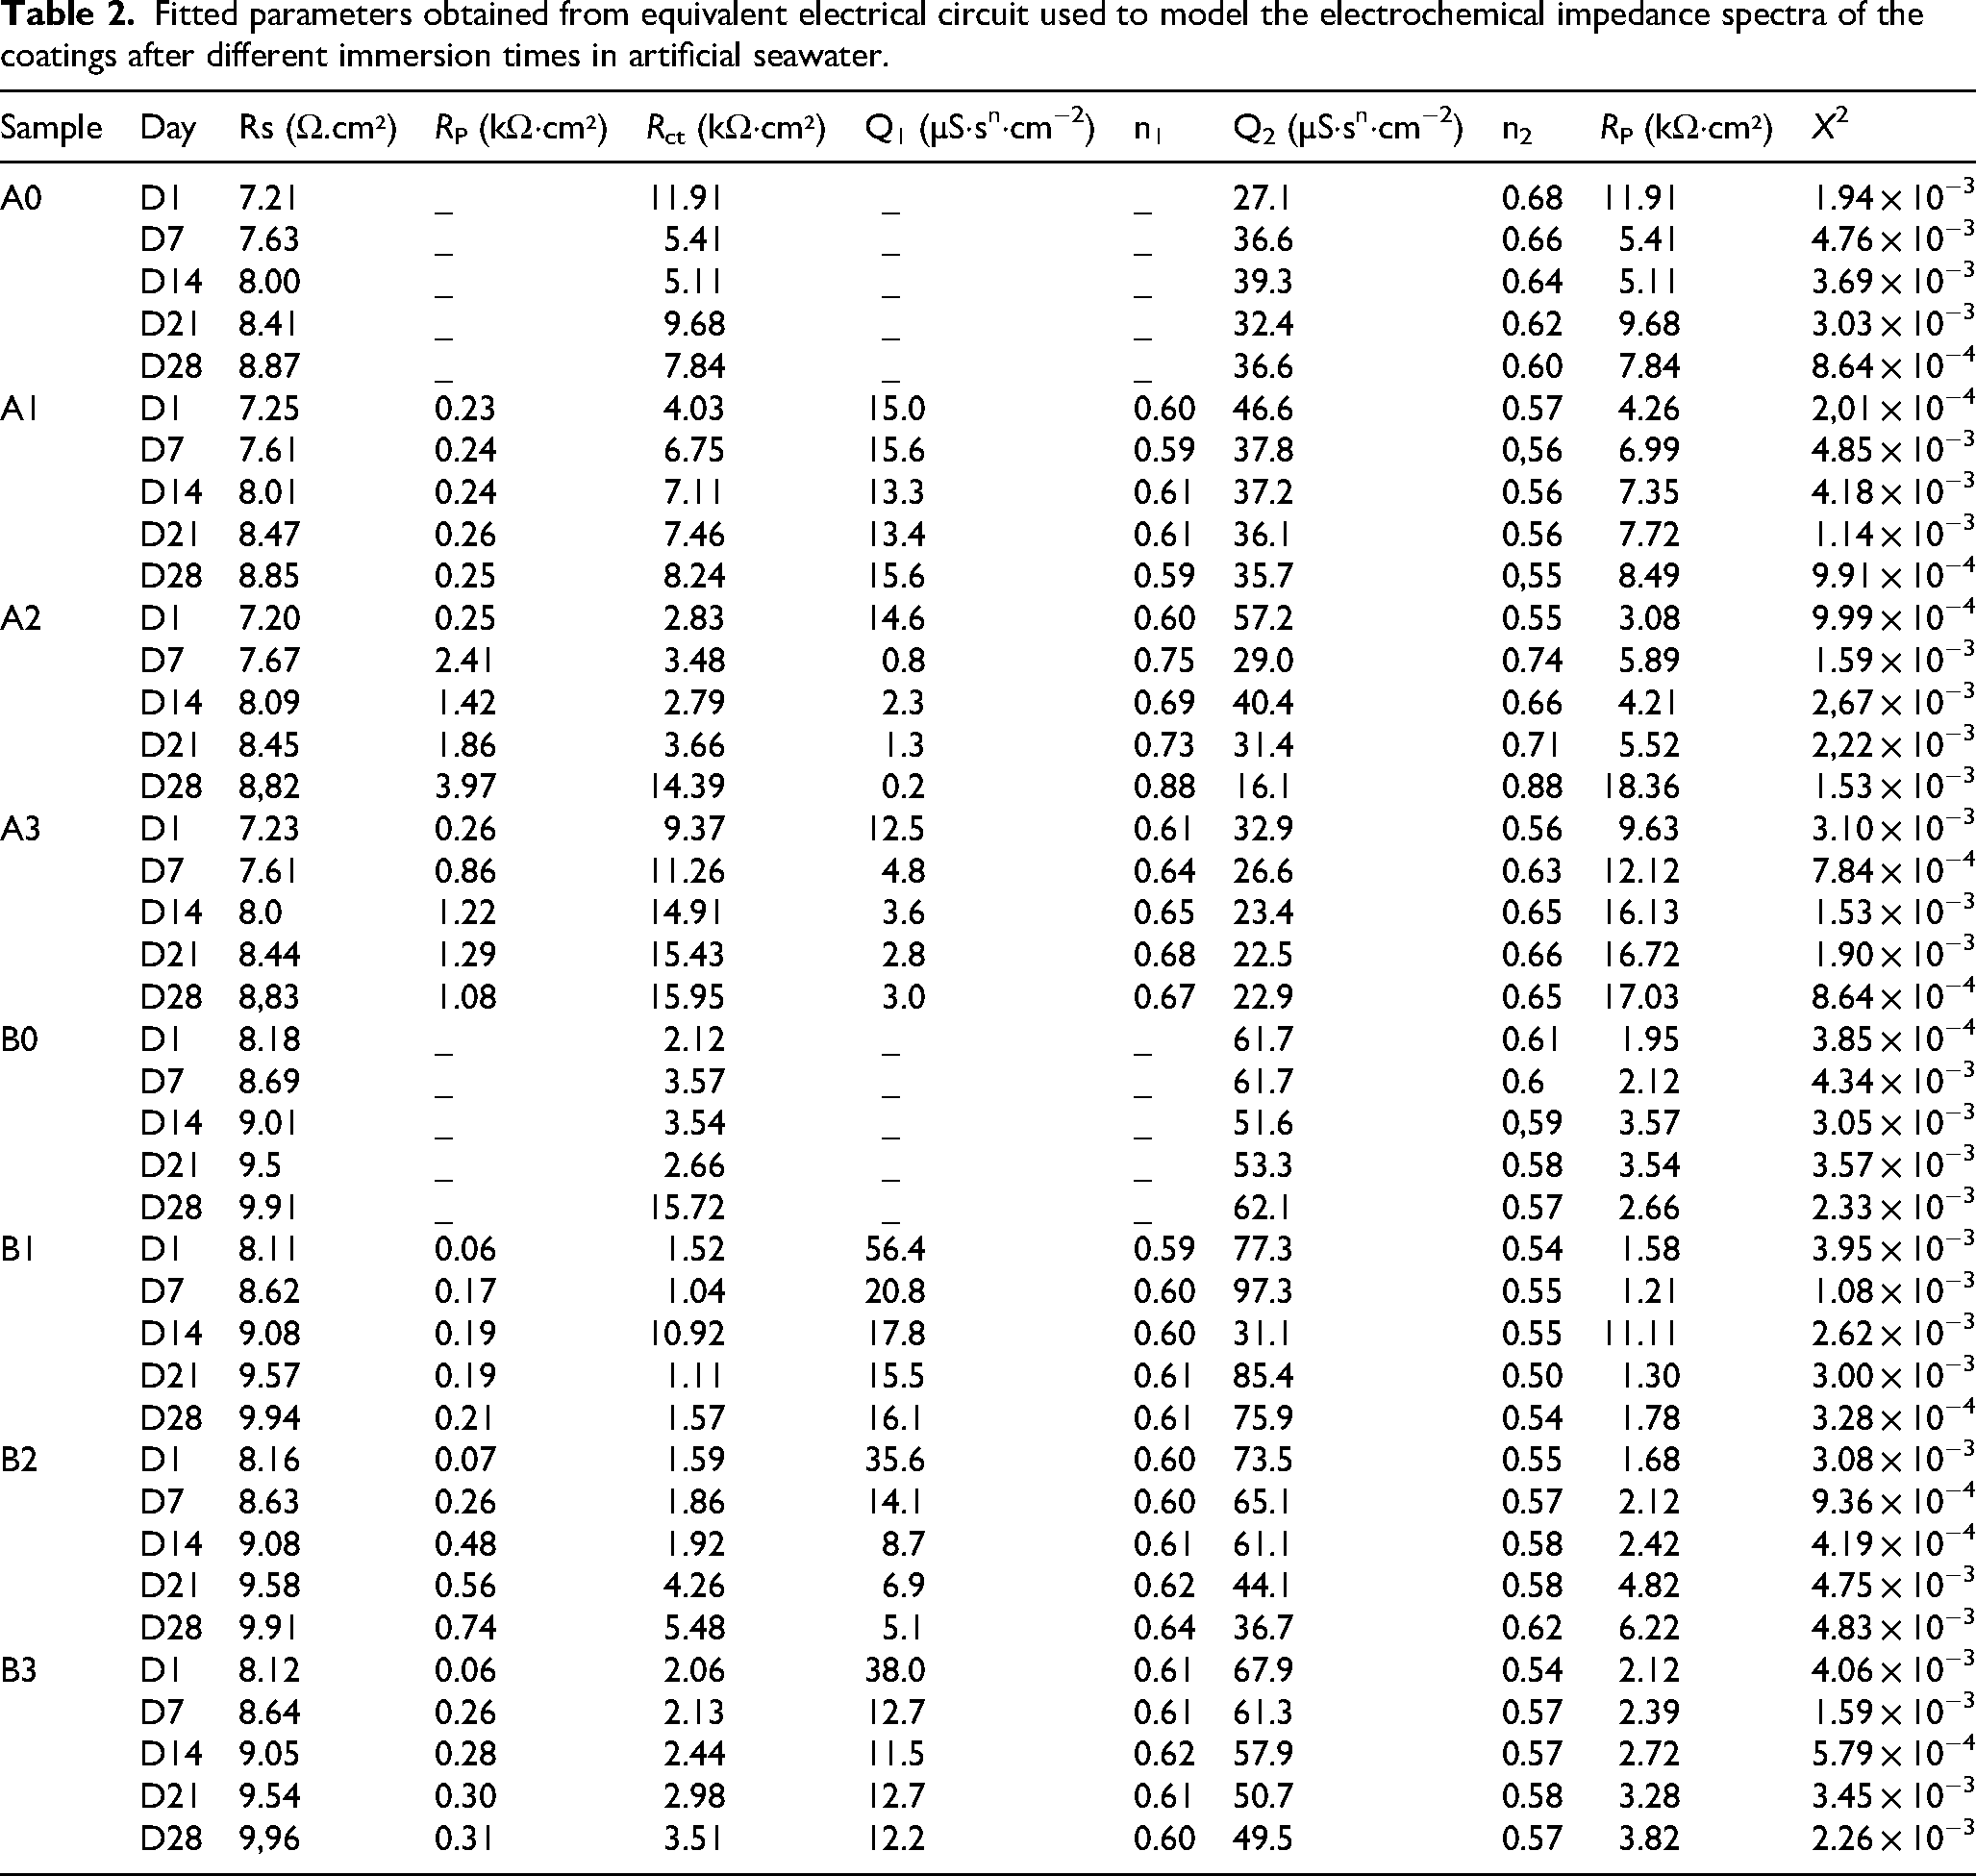
Gamry Echem Analyst software was employed to analyse the EIS results using the proposed equivalent circuits. From the fitted data, the electrochemical parameters of all samples were obtained, as summarised in Table 2.
Fitted parameters obtained from equivalent electrical circuit used to model the electrochemical impedance spectra of the coatings after different immersion times in artificial seawater.
For the coated samples, the smaller loop, which is formed near the origin and corresponds to impedance data taken at high frequencies, reflects the behaviour of the coating. In comparison, the larger loop, further from the origin and corresponding to data taken at low frequencies, shows the behaviour of the substrate. On the other hand, in Figure 8(a) and (e), corresponding to the uncoated samples, the traditional behaviour of steel is observed, forming a single loop.42,43 Additionally, a Nyquist plot allows for the approximate visualisation of Rct and RPo values, reflected in the larger diameter of the loops (low frequencies and high frequencies, respectively).
Figure 8(a) shows the evolution of the AISI/SAE 1020 steel substrate over the 4 weeks of exposure to the saline environment. In this representation, a decrease in the size of the semicircle is seen on days 7, 14 and 21, which reflects a lower RP value for these days, followed by an increase on day 28. In contrast, Figure 8(e) shows the behaviour of the ASTM A572 steel substrate. In this case, an increase in the size of the semicircle is observed until day 21, followed by a reduction on day 28. This phenomenon can be attributed to the formation of corrosion products on the steels, which could affect the ion exchange between the steel and the environment, thus generating variations in the behaviour of the material in the medium.44,45
Figure 8(b) shows that the behaviour of the A1 coating at high frequencies was similar throughout the test, while the loop at low frequencies increased in size for each test conducted, which is reflected in the increase of RP. The A2 coating is notable for having a larger loop at high frequencies than other materials. When further adjustment is applied, the data obtained at low frequencies leads to high RP values. Finally, the A3 coating, in Figure 8(d), shows an increase in the size of both loops with exposure time.
Figure 8(f) shows the behaviour of the B1 coating. It can be observed that the loop corresponding to low frequencies presented its maximum size on the first day, leading to a smaller RP in subsequent days (as seen in Table 2). The behaviour of the B2 coating improved throughout the test, as seen in Figure 8(g). Finally, the B3 coating showed a slight progressive improvement during the 28 days of exposure, which was reflected in a higher RP value than the base metal.
The greater resistance presented by the coatings with 20% Al2O3 compared to those with only 10% can be explained by the favourable effect that the addition of this compound has on Cr2O3 coatings.13,16,19,20,46 In contrast, the better performance of the coatings with 20% Al2O3 compared to the coatings with 30% could be due to the latter having the lowest thicknesses, which may have compromised their performance.47,48
Guilemany et al. 49 fabricated 75% Cr3C2–25% NiCr by weight cermet coatings using atmospheric plasma spray (APS) on UNS G11200 steel, varying the coating thickness through the number of spray passes. After exposing the coatings to a 3.4% NaCl solution and stabilising the OCP, the coating with 20 passes presented the highest resistance with a value of 8.2 kΩ·cm²—meanwhile, Guo et al. 50 Evaluated a CoNiCrAlY coating coated with Al2O3 using the Core-Shell structured powder technique applied via HVOF on AISI 304 steel. When exposed to a 3.5% NaCl solution, an RP of 43.9 kΩ·cm² was obtained. These results show the good performance of cermet coatings in saline environments, as the presence of a metallic material helps reduce residual stresses and porosity.
Other authors have fabricated Cr2O3 coatings using oxy-acetylene flame thermal spray on various substrates, such as phosphor bronze with a NiAl bond coat or AISI/SAE 1020 carbon steel without a bond coat. Dimate et al. 51 exposed these Cr2O3 coatings on phosphor bronze with an NiAl bond coat to a 3.5% NaCl solution for 7 days. They obtained a maximum RP value of 10.28 kΩ·cm². At the same time, Núñez Celis et al. 26 elaborated the Cr2O3 coating on an AISI/SAE 1020 carbon steel substrate and, after 28 days of exposure to a 3.5% NaCl solution, obtained a maximum RP value of 5.45 kΩ·cm². Hashemi et al. 52 evaluated plasma-sprayed Cr2O3 coatings with additions of YSZ (yttria-stabilised zirconia) and SiC (silicon carbide) on AISI 304L steel with a NiAl bond coat. The RP values obtained when exposed to a 3.5% NaCl solution varied between 1.5 and 1.6 kΩ·cm². On the other hand, Pinzón et al. 40 fabricated Al2O3–TiO2 coatings using flame thermal spray on carbon steel. The coating with 14% by weight of TiO2 presented the highest RP value (54.79 kΩ·cm²) after 7 days of exposure to a 3.5% NaCl solution. Finally, Shao et al. 41 fabricated Cr2O3–Al2O3 coatings using APS on AISI 304 steel with a NiCr bond coat. After exposure to a 3.5% NaCl solution, the RP value was 4.2 kΩ·cm². The comparison of RP values is shown in Figure 9.
An alternative method for analysing impedance results is through Bode plots. These plots graphically represent the impedance magnitudes and phase angles as a function of the frequency at which the impedance was measured. The impedance magnitude |Z| and phase angle φ are calculated using equations (2) and (3), as shown below.
53
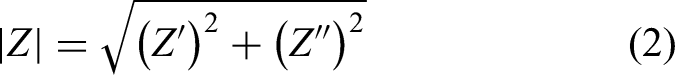
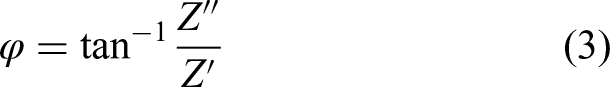
Figure 10 presents the impedance magnitude as a function of frequency, with both axes plotted on a logarithmic scale. It is crucial to note the impedance magnitude at low frequencies (10 mHz), as this value is directly related to the protective capability of the coating.40,54 Based on these results, the degradation of sample A0 can be highlighted, as the impedance magnitude at low frequencies decreases over the days of exposure. In contrast, coating A1 showed no significant change over time, whereas coating A3 exhibited an increase in impedance magnitude at low frequencies after 7 days of exposure. After 28 days, coating A2 had a low-frequency impedance magnitude similar to coating A3.
The steel substrates (Figure 10(a) and (e)) exhibited a variation from 1.75 kΩ·cm² on day 1 to 2.8 kΩ·cm² on day 21. Overall, the impedance magnitude increased from the first day due to the formation of corrosion products; however, it did not exhibit stable behaviour due to the heterogeneity of these products.44,45 The behaviour of the B1 coating was similar to that of the A1 coating, as it reached its maximum impedance value on day 1 and then decreased after day 7. However, unlike A1 (Figure 10(b)), the B1 (Figure 10(f)) coating showed higher impedance at frequencies above 500 mHz starting from 7 days of exposure. Both B2 and B3 (Figure 10(g) and (h)) coatings demonstrated an increase in impedance at low frequencies over time, reaching values of 1.94 kΩ·cm² and 1.9 kΩ·cm², respectively. Meanwhile, coatings A2 and A3 (Figure 10(c) and (d)) exhibited a similar behaviour but with impedance values around 8 kΩ·cm² at low frequencies.
Figure 11 shows the Bode plots of the phase angle as a function of frequency. These diagrams identify the frequency ranges where the phase angle reaches local maxima or peaks. This information can be correlated with the nature of the reactions occurring within the system, and its interpretation depends on the specific system. For a coating, peaks at high frequencies are associated with the behaviour of coating defects, while peaks at lower frequencies are related to the behaviour of the substrate. 55 Therefore, the metallic substrates of AISI/SAE 1020 and ASTM A572 (Figure 11(a) and (e)) exhibit only one peak, as they are uncoated.
Figure 11(a) and (e) shows that the singular peak shifts to lower frequency values and higher phase angles as time increases. For the A1 coating (Figure 11(b)), only the peak at low frequencies shifts to lower frequency values, while the high-frequency peak remains constant. When comparing the A2 and A3 coatings (Figure 11(c) and (d)), after the seventh day, the peaks of the A2 coating shifted significantly further toward lower frequencies than those of the A3 coating, even reaching a maximum value below 10 mHz. This explains the superior performance of the A2 coating compared to the A3 coating.
For the coatings on ASTM A572 steel, significant dispersion was observed at high frequencies (>6 kHz). Likewise, the behaviour of all three coatings was similar on the first day, with a low-frequency maximum between 200 and 500 mHz, and a high-frequency maximum over 100 kHz (beyond the studied frequency range). The low-frequency maximum shifted to lower frequencies (<100 mHz) and lower phase angles (<28°). The high-frequency maximum also shifted to lower frequencies, with only the B3 coating (Figure 11(h)) exhibiting a maximum within the studied frequency range (30 kHz). In contrast, the high-frequency maximum for the B1 and B2 (Figure 11(f) and (g)) coatings after 7 days of exposure remained above 100 kHz.
The evolution of the performance, evaluated using EIS, showed that the impedance magnitude increased for coatings with 20% (A2, B2) and 30% (A3, B3) Al2O3. Among these, the coatings with 20% Al2O3 exhibited a greater shift in the maximum phase angle at low frequencies toward lower frequency values. This suggests a favourable effect of Al2O3 on Cr2O3–Al2O3 coatings. However, the coatings with higher Al2O3 content (A3 and B3) demonstrated lower performance, possibly due to their reduced thickness (<85 μm).
The reduction in coating thickness with increasing Al2O3 content can be explained by the different thermal responses of the oxides during flame spraying. Although Al2O3 presents a lower nominal melting temperature (≈2050 °C) and a higher thermal conductivity compared with Cr2O3 (≈2435 °C), its molten phase shows greater viscosity and lower heat absorption efficiency under flame conditions. These characteristics hinder the complete melting and spreading of Al2O3-rich particles, which decreases the deposition efficiency and produces thinner coatings when the Al2O3 fraction increases.
At intermediate contents around 20 wt.-% Al2O3, a favourable balance is achieved since the presence of Al2O3 improves interlamellar cohesion and promotes solid-solution formation at the Cr2O3–Al2O3 interfaces, while Cr2O3 contributes to adequate splat flattening and coating build-up. This combination produces a dense and continuous microstructure that effectively limits electrolyte penetration and enhances corrosion resistance. In contrast, coatings containing 30 wt.-% Al2O3, although morphologically compact, are thinner and exhibit local interlamellar discontinuities that reduce RP and overall protective performance.
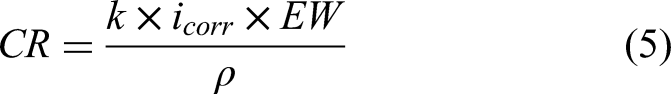
The Tafel extrapolation method, based on polarisation curve data, is a common approach for calculating corrosion current density and CR.56,57 This method involves plotting the logarithm of the current density against the electrode potential to determine the anodic (βa) and cathodic (βc) Tafel slopes, as shown in Figure 12. Using these slopes and the Stern–Geary equation (equation (4)), the corrosion current density (icorr) can be calculated, which is directly proportional to the CR. The CR is then determined through Faraday's law, represented in equation (5), which incorporates the Faraday’s constant (k = 3.27 × 10⁻³ mm g/μA cm year), the material density (ρ = 7.87 g/cm³) and the equivalent weight of iron (EW = 27.94 g/eq, based on the atomic weight of iron and its two-electron oxidation state).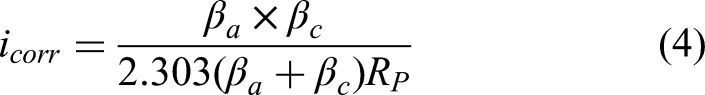
The corrosion behaviour of coated samples with varying Al2O3 content was evaluated on each substrate. For the samples deposited on AISI/SAE 1020 steel, the coating containing 20% Al2O3 (A2) demonstrated the lowest corrosion current density (icorr = 0.58 μA/cm²), significantly lower than both the uncoated sample (A0, icorr = 2.11 μA/cm²) and the other coated variants (A1 and A3), as shown in Table 3. A similar trend was observed for the samples deposited on ASTM A572 steel, where B2 showed a decreased icorr value (9.23 μA/cm²) compared to B1 (14.33 μA/cm²) and B3 (9.84 μA/cm²).
Corrosion kinetics parameters. Tafel slopes anodic (βa) and cathodic (βc), corrosion current density (icorr) and corrosion rate (CR) for all samples at 28 days of exposure.
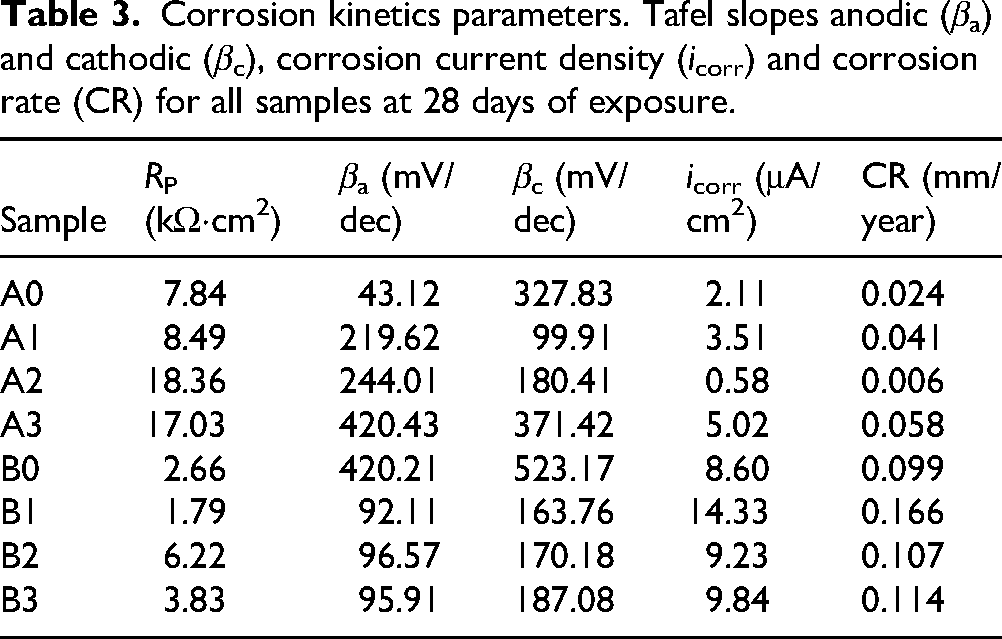
This behaviour is consistent with the CR results, which reflect the same tendencies. For AISI/SAE 1020, the sample A2 exhibited the lowest CR value (0.006 mm/year), in contrast to A0 (0.024 mm/year), A1 (0.041 mm/year) and A3 (0.058 mm/year). In the case of ASTM A572, B2 also presented a lower CR (0.107 mm/year) relative to B1 (0.166 mm/year) and B3 (0.114 mm/year). These values support the electrochemical data and suggest that the coatings containing 20% Al2O3 offer the most effective barrier properties among the compositions evaluated.
The higher resistance of the A2 and B2 coatings can be explained by the favourable influence of Al2O3 at that specific proportion, which reduces porosity. 19 Additionally, as reported in the literature40,46 thermal spray coatings do not protect against corrosion by impermeabilising the substrate, due to their inherent porosity. Instead, they protect by blocking their pores with corrosion products. This effect is evident in all the coatings, whereas in the uncoated samples A0 and B0, the RP decreased after 28 days of exposure.
The corrosion products formed after 28 days of exposure were evaluated using SEM and EDS, as shown in Figure 13. The elemental chemical composition analysis revealed the presence of aluminium, chromium, oxygen and carbon, corresponding to the original components of the coating. Carbon is attributed to the graphite layer applied during the initial preparation for testing. Additionally, iron was detected on the coating surface, suggesting the formation of iron oxides or oxyhydroxides, as reported in the literature.2,4,58
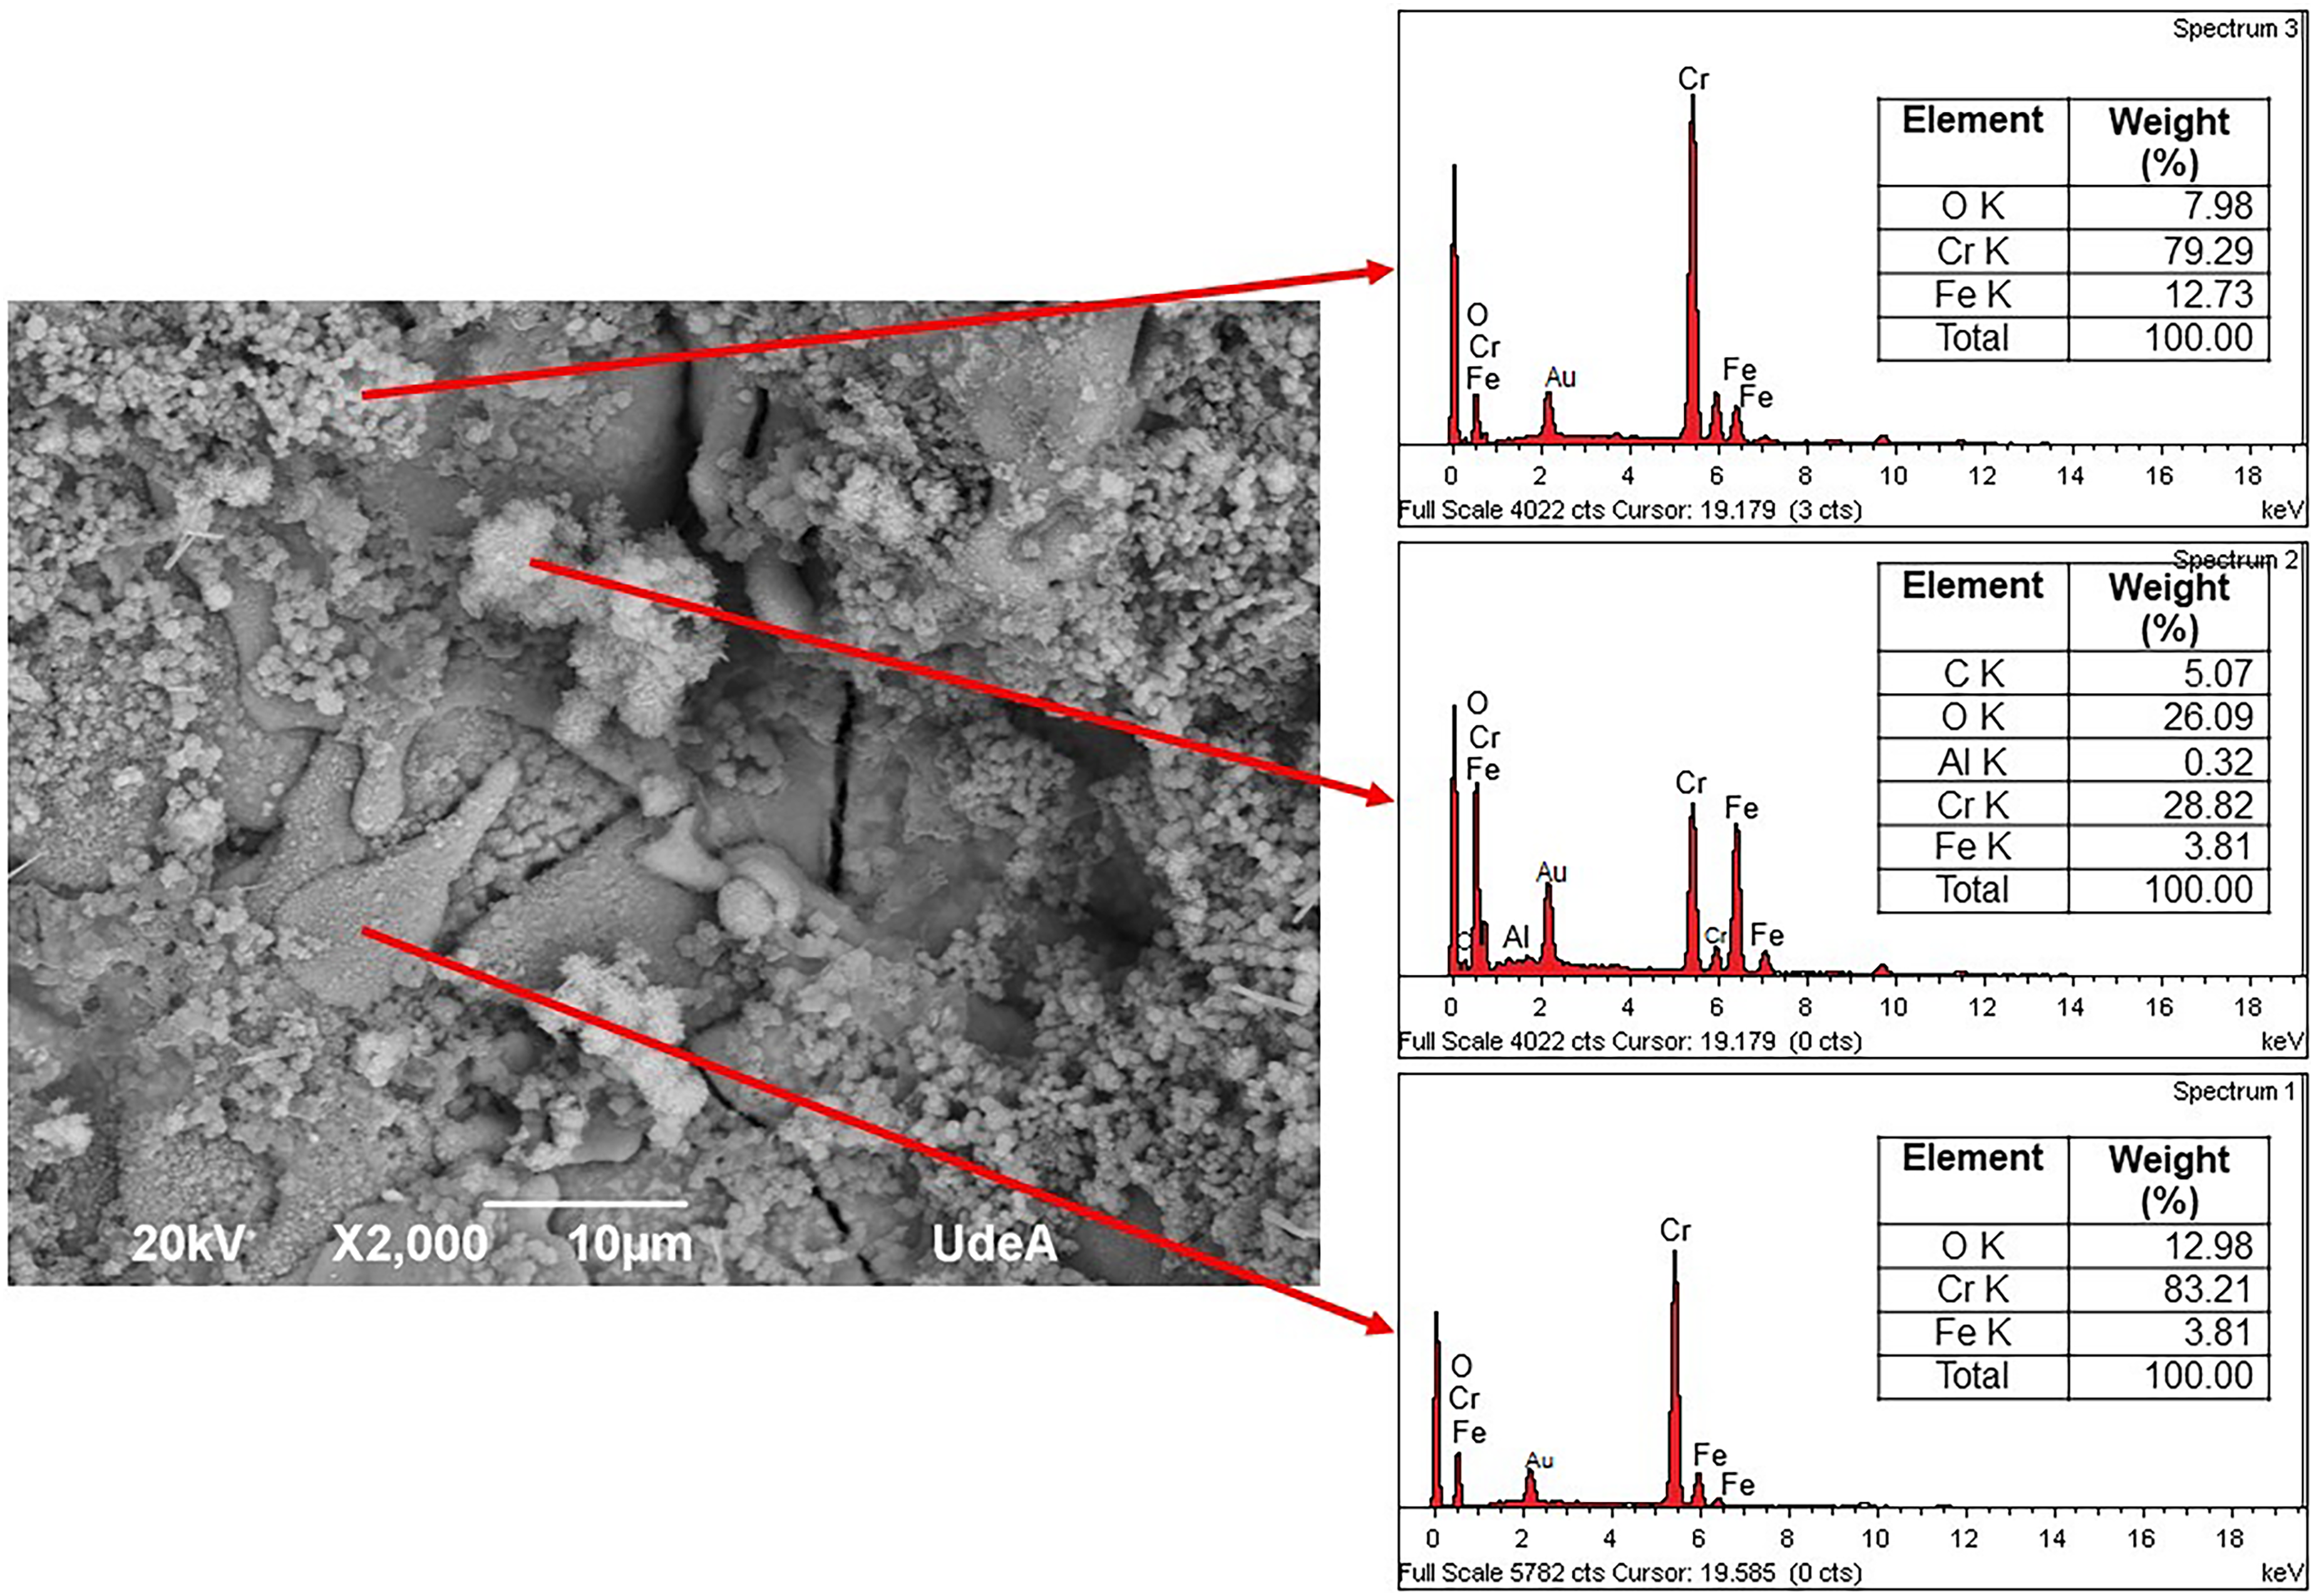
Elemental chemical composition of the corrosion products on the A1 sample after 28 days of exposure to artificial seawater, measured by EDS.
The EDS test did not reveal the presence of chlorine, the element responsible for steel corrosion. This absence is explained by the fact that the compounds formed with chlorine (mainly chlorides) are mostly soluble in aqueous media and, therefore, do not remain on the coating surface but rather re-enter the solution. 59 Additionally, the final condition of the tested samples is shown in Figure 14, where the mechanical integrity of the coatings was compromised after immersion in artificial seawater. This degradation resulted from corrosion occurring at the interface between the steel substrate and the ceramic coating, weakening their adhesion. This effect was particularly noticeable in samples B1, B2 and B3, where the adhesive used to limit the exposed area to the corrosive environment caused portions of the coating to detach upon removal. Similarly, in samples A1, A2 and A3, the silicone glue used to seal the cell and prevent leaks is visible, highlighting the exposed area to the saline medium by the reddish tone of the iron oxides formed. The figure also reveals localised deterioration beyond the exposed area, attributed to seawater penetration through pores and microcracks, although diffusion in these regions was slower, resulting in less damage. The circular perimeter corresponding to the O-ring sealing remains intact, with no signs of electrolyte infiltration.
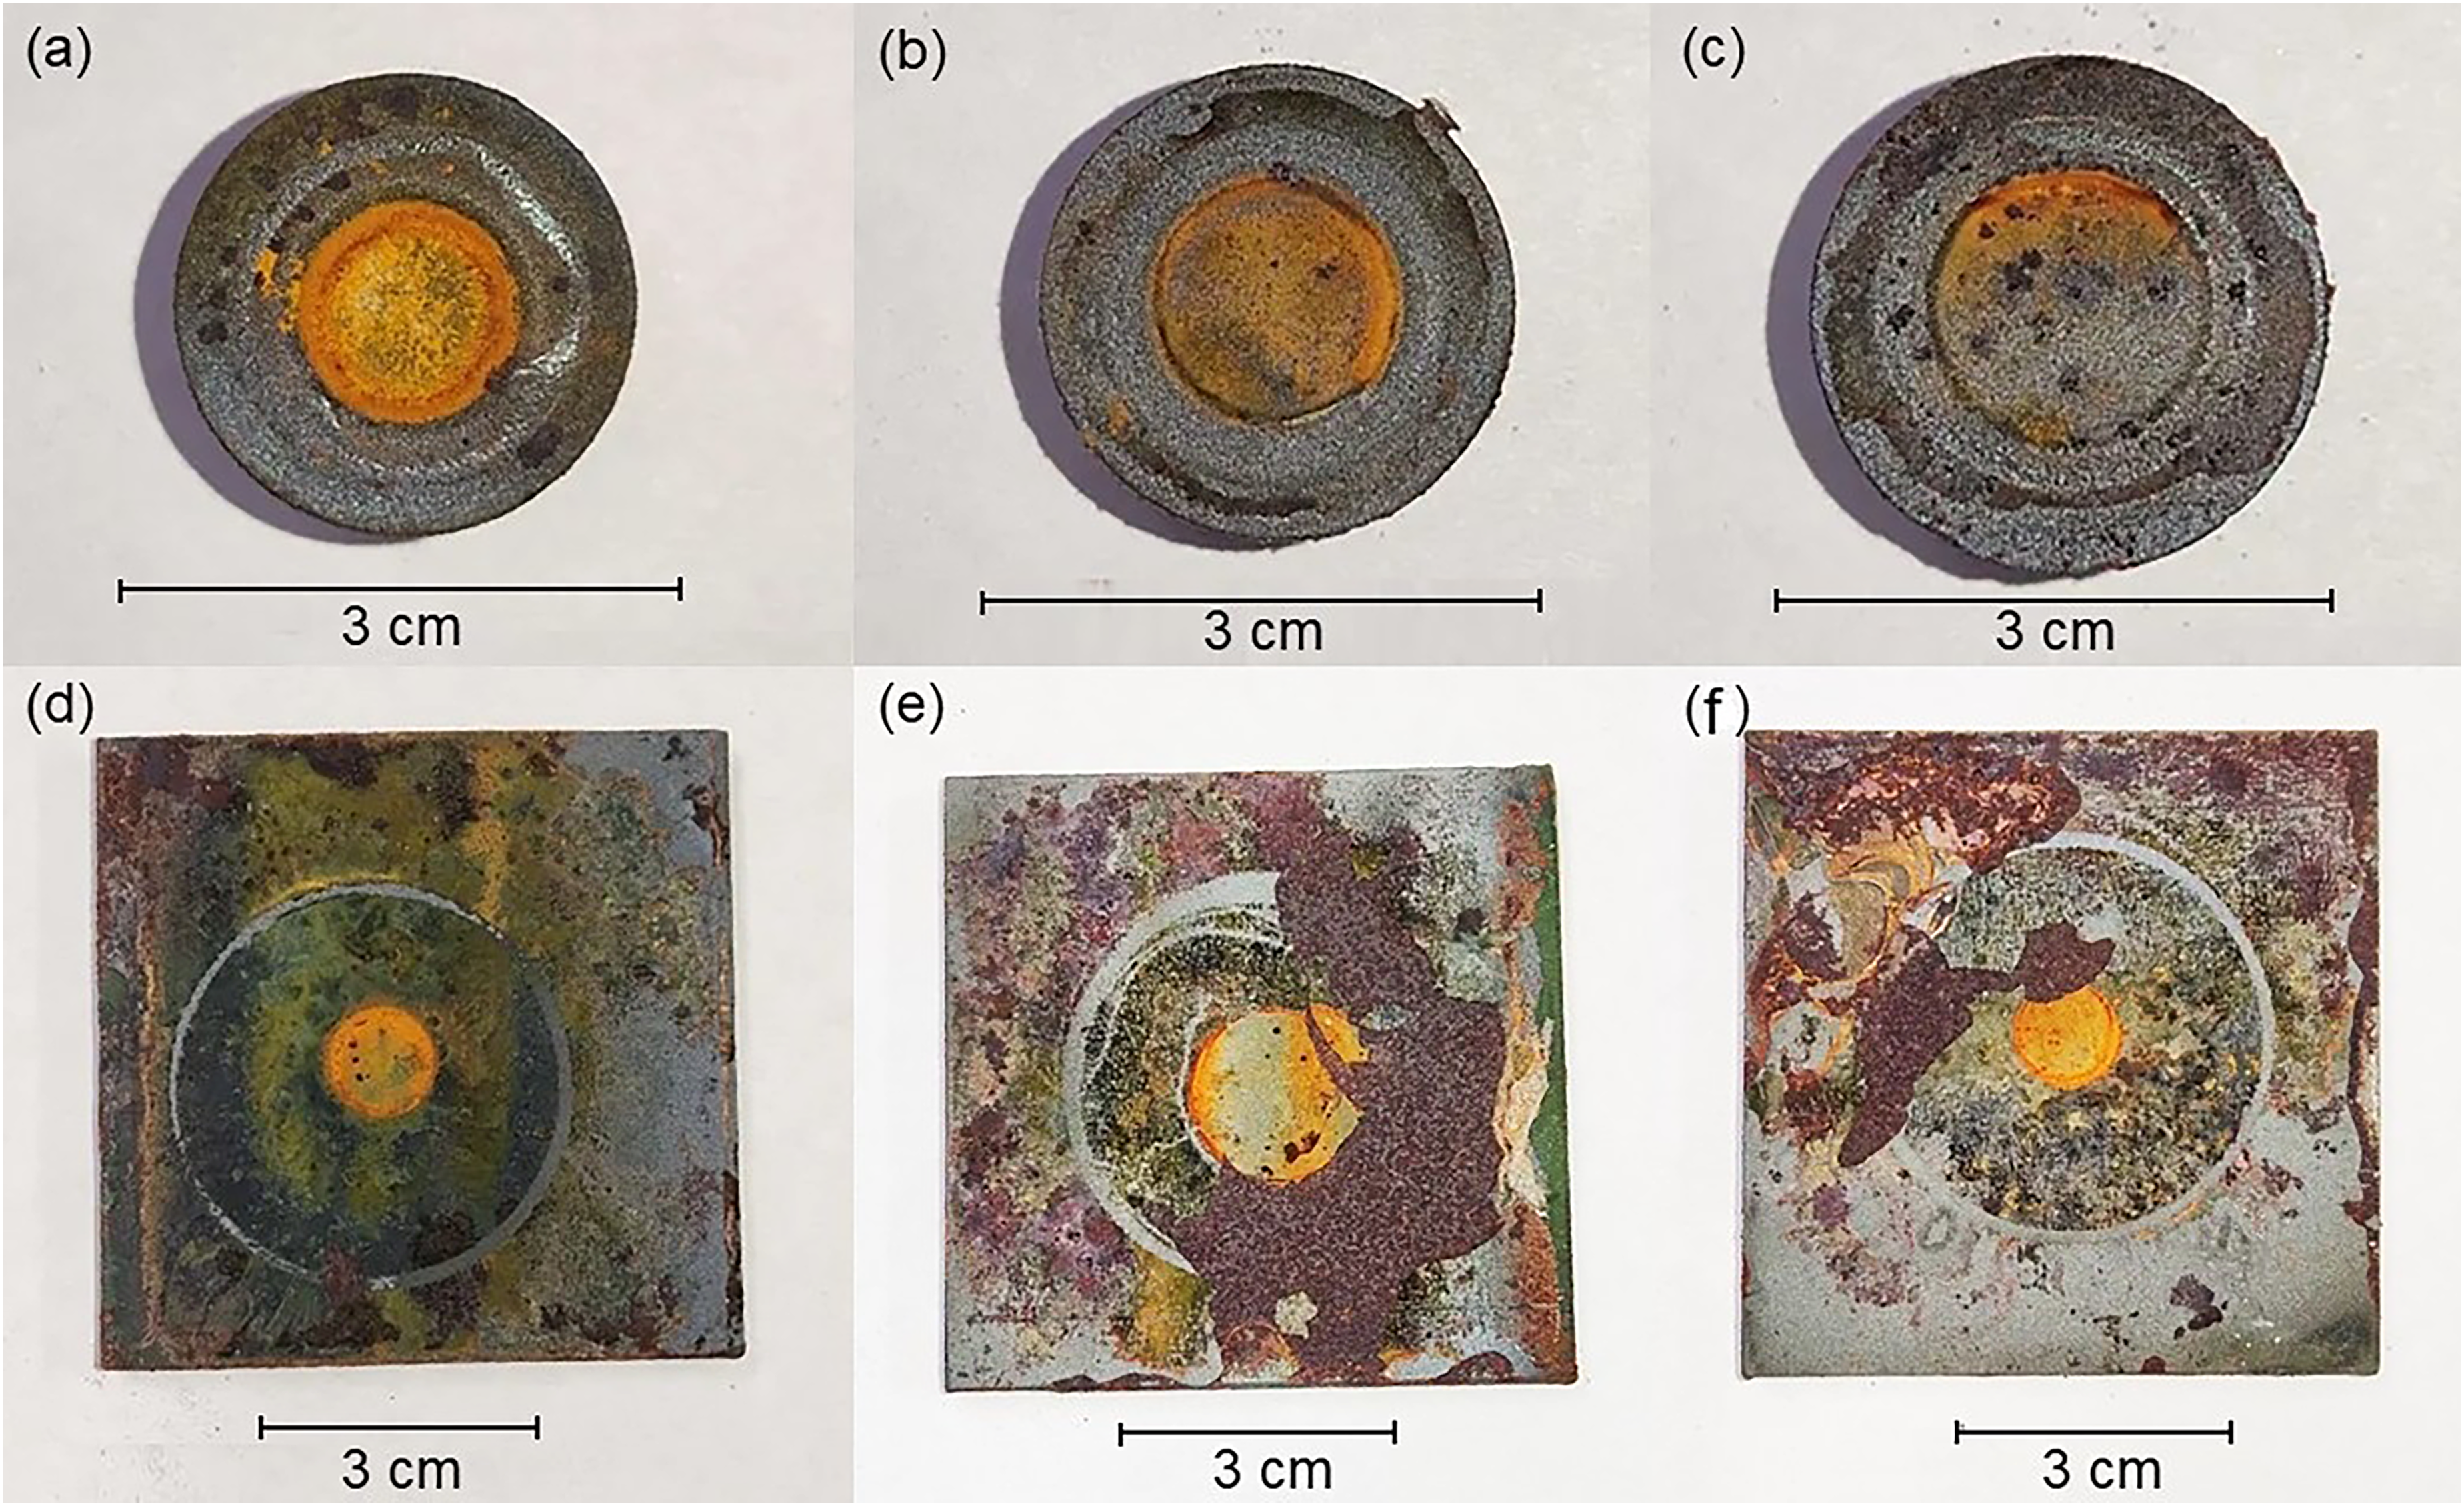
Post-electrochemical testing (a) A1, (b) A2, (c) A3, (d) B1, (e) B2 and (f) B3 samples.
Conclusions
Chromium oxide-based coatings containing 10, 20 and 30 wt.-% Al2O3 were successfully produced on AISI/SAE 1020 and ASTM A572 steel substrates using flame spray, achieving thicknesses from 70 to 150 μm with a uniform distribution of phases. Microstructural analysis revealed that increasing the Al2O3 content promotes coating compactness, decreasing the overall coating thickness. Microstructural defects such as porosity and microcracks (approximately 4–6%) are consistent with the typical characteristics of flame-sprayed ceramic materials. Additionally, the principal phases identified—eskolaite (α- Cr2O3) and corundum (α-Al2O3)—match those present in the feedstock powders, indicating that no chemical interaction occurred between the components during spraying and that the phase composition remained stable throughout the process.
EIS showed increased polarisation resistance (RP) over time for all coatings when exposed to a corrosive environment, implying enhanced barrier properties as the coatings aged. Notably, the composition of Cr2O3 with 20 wt% Al2O3 demonstrated the most favourable corrosion performance, especially on the AISI/SAE 1020 substrate, reaching RP values of approximately 18.36 kΩ·cm². These findings, supported by Tafel extrapolation data, suggest that coatings containing Cr2O3–20 wt% Al2O3 are particularly suitable for applications in aggressive or marine environments, where high corrosion resistance is essential. The expected CR calculated with Faraday's law showed that these coatings achieved the lowest CRs, with values of 0.006 mm/year for A2 and 0.107 mm/year for B2. Based on the results above, the coating with a chemical composition of Cr2O3–20% Al2O3 shows the highest potential for application in marine or coastal environments. They demonstrated the lowest CR calculated from the electrochemical test results.
Footnotes
Acknowledgements
Our sincere thanks to the GIMAT research group at Universidad Industrial de Santander for their contributions to the development of this project.
Funding
The authors disclosed receipt of the following financial support for the research, authorship, and/or publication of this article: This work was supported by the Vicerrectoría de Investigación y Extensión, Universidad Industrial de Santander (grant number 2512, 4499).
Declaration of conflicting interests
The authors declared no potential conflicts of interest with respect to the research, authorship and/or publication of this article.
Data availability statement
The data that support the findings of this study are available from the corresponding author upon reasonable request. These include raw and processed data from electrochemical measurements (EIS and Tafel), microstructural analyses and phase identification via XRD. Due to institutional policies and the ongoing nature of related research, the datasets have not been deposited in a public repository.