
Abstract
The purported purpose of school choice policies is to increase students’ access to “good schools.” There is little discussion, however, of where those good schools are located, nor of the ways in which the distribution of good schools mirrors broader patterns of uneven development in the United States. Given that schools are neighborhood assets and that the distance which students travel to get to school affects their success, the locations of schools matter tremendously and are inextricable from questions of social and spatial justice. We introduce and argue for the explicit use of the term “school desert” as a way for scholars to understand and describe the spatial injustice of school closures and for activists to argue the importance of effective local schools. Spatial visualization and rendering of social problems is an invaluable strategy for effecting policy change. As cities move increasingly to a “de-spatialized” geography of schooling where catchment zones are less determinate of where a student attends school, it is important to consider where the desirable schools are and where they are not. A more nuanced visualization of school locations than neighborhood demographics offers a new lens through which to examine the (un)intended effects of school closures on students, communities, and development. Using Pennsylvania as a case study, we use a geographic information system (GIS) to evaluate the broader reverberations of school choice policies and determine who, demographically, has access to high-quality schools. In light of this research, we also propose an innovative analytic and methodology that describes the educational inequity which is caused by spatial relationships between students’ homes and high-quality schooling. Through the concept of a school desert we explore the (un)intended spatial implications of school closures. School deserts occur as a result of school choice policies that justify school closures. Closures and the location of good schools are geographically uneven, tempered by the federal and local policies that ensure income and racial segregation in US housing. Our analysis of Pennsylvania reveals the uneven distribution of access to good schools in the same way that mapping food deserts displays how market forces have failed to evenly distribute quality food. We find that areas with high-quality schools are significantly wealthier and whiter than school deserts, a conclusion which mirrors those concerning other low-quality neighborhood assets. School deserts as a methodology demonstrate that if students do not have geographic access to good schools, then school choice policies do not, in fact, offer choice.
Introduction
School consolidation policies in Pennsylvania were created in response to underperforming schools and population changes, but these policies have had substantial unintended consequences. Pennsylvania’s school consolidation began in the 1960s as a statewide policy for managing population decline and has recently resurfaced as a component of school choice policies at the district level. These policies apply public school funds to allow families to select from a range of public and private schools to coincide with the closing of neighborhood schools. Consolidation has and will continue to fundamentally reshape the geography of education access across the country (Duncan-Shippy, 2019). The aspiration of school choice is to “liberate” families and communities from “failing” neighborhood schools. Scholars have explored the benefits of school choice and school consolidation from myriad angles (De la Torre and Gwynne, 2009), but there has been little consideration of the geographic distribution of the “good schools.” The liberation to attend a school outside one’s neighborhood is not beneficial if good schools are overwhelmingly located outside a student’s geographic reach.
By introducing the concept of a “school desert,” this paper explores the unintended consequences of school choice and school consolidation policies. School choice policies purport to give more freedom to choose a good school, and this celebration of “choice” justifies school closures. However, an unintended consequence of school closures, we argue, is school deserts. Visualizing school deserts is a useful methodology because it proves that, due to issues of geographic access, school choice is a myth. School closures do not give students access to high-quality schools. Using Pennsylvania as a case study, we conducted a geographic information system (GIS) analysis of the state to determine the geographic extent of school deserts. We used US census data to analyze the demographic characteristics of those deserts compared to the areas with access to high-quality schools. We found that areas with access to high-quality schools are significantly wealthier and whiter than the school deserts, a conclusion which mirrors other findings and implications about low-quality neighborhood assets (McEntee and Agyeman, 2010). School deserts are prevalent across Pennsylvania in areas whose demographic qualities indicate insufficient educational opportunities for students of color and families living in poverty. Thus, closing their schools in no way gives them choices because there is no good school in their immediate area.
School closure as sound educational policy?
Historically, our country has relied heavily on federal and local legislation to govern schools and direct educational systems. While these policies are intended to improve educational quality for all students, they have instead created a widening achievement gap, enacted gratuitous statewide standardized testing, and resulted in broad school closures that have ravaged urban school districts, and become inextricably entangled with governments’ fiscal health.
School closures in America have been driven by three primary factors: federal education policy, state education budgets, and decline in local enrollment. The Elementary and Secondary Act (ESA) of 1965, signed under Lyndon B Johnson, was the first federal policy intended to ensure quality and equitable education for all American students. Born out of the civil rights movement, it has been consistently reauthorized over the last 60 years, continuing the mission to provide universal high-quality education. The most recent reauthorization of ESA included the No Child Left Behind (NCLB) Act of 2002 which focused on the academic performance of school districts as a means of ensuring that all students receive equal educational opportunities (DeBray-Pelot and McGuinn, 2009; Martin et al., 2016). Seeking to bring all students to “proficiency” by 2014, the policy uses standardized testing as a major data collection and enforcement strategy. The resulting scores provided a mechanism by which to rate schools, offer incentives to schools that demonstrated growth, and to hold low-performing schools to account. As these low-performing schools were identified, departments of education across the country were faced with a choice between remediating through state takeover or reconfiguration by consolidating or closing schools.
The 2008 recession struck just as the popularity of the accountability movement was rising. When the housing bubble burst, the resulting economic recession caused a sharp decline in tax revenues that left local municipalities and even state governments straining to provide services. This strain exacerbated a longer period of austerity driven by a shifting US economy which increasingly expected municipal governments to be efficient and even to generate revenue (Hackworth, 2007). The accountability movement therefore spurred an ideological fervor to closely guide the allocation of limited public resources. This fiscal austerity intersected with the notion of school accountability leading to rampant closures of low-performing schools. This confluence of policies and economic events drove school districts to employ pre-existing local policies to simultaneously close schools, save budgets, and enforce the mandates of NCLB. As tax dollars became scarce, per-pupil dollars needed to support building operations, staff, and quality educational resources were lost. Many school districts devised school codes similar to the local and state policies regarding school reconfiguration and closure. Article XIII of the Pennsylvania Public School Code of 1949, for example, defined the qualifications for school closing and reconfiguration: The board of school directors of any school district may, on account of the small number of pupils in attendance, or the condition of the then existing school building, or for the purpose of better graduation and classification, or other reasons, close any one or more of the public schools in its district. Upon such school or schools being closed, the pupils who belong to the same shall be assigned to other schools, or upon cause shown, be permitted to attend schools in other districts.
This new application of old codes had a dramatic impact on the educational landscape. Closing schools is traumatic to communities and students (Ewing, 2018) and has been well documented as an intense, contentious, and often divisive process for communities, staff, and local school districts (Green, 2017). When schools are closed for reasons of underperformance, budgeting, or low enrollment, families and neighborhoods can either transition to the next closest and available school, or take advantage of school choice policies. Federal and state grants have created incentives to close underperforming schools leaving school districts vulnerable to educational policies that seek to improve academic achievement and simultaneously loosen the stranglehold of debt. The school accountability movement transforms school closures from a practical, administrative, and fiscal necessity to a moral imperative. Unsurprisingly, the strong focus on student performance as an exclusive product of the school itself, without regard to outside variables (i.e. poverty and other markers of social disadvantage) has provoked a range of unintended consequences.
In Pennsylvania, declining student enrollment has sparked a movement towards reconfiguration processes and school closings. Between 2010 and 2015, student enrollment in the state of Pennsylvania dropped 4.2% (Hussar and Bailey, 2018). Even on the east and west edges of the state where large populations live in urban and suburban sprawl, declining enrollment and expansive debts have caused school closures.
Unintended consequences of school closings
The imbrication of the aforementioned financial and demographic pressures and the school accountability movement have ensured that school closures are not executed solely through evidence-based practices nor to the benefit of students. While schools close for a variety of reasons, their loss has unintended consequences and disproportionately affects marginalized groups.
Although federal and local policies were originally touted as the solution to underperforming schools, research has found that closing schools has not improved the educational achievement of displaced students (Kirshner et al., 2010). A 2009 review of Chicago public school closings revealed that students were likely to enroll in schools that were weaker academically than their previous school and that transfers yielded neither positive nor negative change in their performance (De la Torre and Gwynne, 2009). Since this groundbreaking research, a number of other scholars across the country have either affirmed that the academic growth of transferred students is minimal or, most important for this research, found that displaced students are at a geographical disadvantage in attempting to enroll in a school with better academic performance than their previous institution (Stroub and Richards, 2013). Policymakers failed to anticipate the hurdles to relocation which include insufficient seating at higher-performing schools for a large number of transfers, logistical issues in transportation and scheduling (Richards, 2014), and longer commutes for students and for families who wish to attend school events (Talen, 2001). These transportation concerns also limit transferred students’ involvement in extracurricular activities.
Eve Ewing’s (2018) harrowing tales of school closures in Chicago highlight their most painful consequence on communities and neighborhoods. As schools close, entire communities experience institutional mourning. The closing of their school, a community hub, is felt as a familial death. Communities mourn the loss of connections between the generations of students who have attended the school; the loss of connections between teachers, students, and their families; and the loss of the school as a communal space embracing pride, community culture, and community history (Ewing, 2018).
Also, ironically, school closure policies have exacerbated the exact inequalities that they were designed to ameliorate. Although the educational community recognizes school closures as current, disruptive, and wide-ranging, few have focused on statistically quantifying the state of school closures in this country. This analysis reveals that closures disproportionately affect low-income communities and students of color rather than their white and wealthier counterparts. This pattern, defined as the geography of opportunity by Tate (2008), highlights how students in poverty and students of color are deprived of access to high-quality schooling opportunities merely because of their home address. While we tend to assume that the geography of opportunity is confined to old urban neighborhoods comprised largely of families of color, new research demonstrates that gentrification has also contributed to inequitable access to high-quality schooling in fast-growing, opportunity-rich cities (Green et al., 2017). Lubienski and Lee (2017: 57) describe this best by saying that “the recent school closing policies in urban school districts may lower ease of access to schools for students who already reside in less advantaged neighborhoods.”
Proponents of school choice policy argue that closing underperforming schools benefits everyone by creating a market force that motivates schools to “shape up,” to respond to the competitive threats presented by higher-performing schools or face closing (Hoxby, 2002). They argue that this pressure will also encourage families to send their children to better-performing schools. However, as school closures spread, a cascade event causes charter schools of varying quality to pop up in their place and opportunities for access to high-quality education decrease. It is therefore imperative to ask not only if families and students have the opportunity to choose high-quality schools, but if access to schools of high quality even exists in the face of school closures and school choice. If this access is limited, these communities are not benefiting from the wider regional asset of high-quality schools.
Geographic deserts and schools as spatial justice
Now that scholars have clearly identified the relationship between underperforming schools, closures, and the geography of opportunity for underrepresented minorities and students of low socioeconomic status, it is vital to conduct research outside the traditional quantitative and qualitative methodologies. Lubienski and Lee (2017) spearheaded the call to use geospatial methods in school choice research to expand beyond the analysis of neighborhood and local effects and scale up to using GIS to capture broader trends and consequences. Very few studies have applied GIS to better understand the spatial implications of school closure policies or to analyze the potential injustices those policies create. GIS methodology allows us to use the concept of deserts to broaden our geographic understanding of the consequences of school choice and consolidation policies.
Desert nomenclature is a powerful tool in conceptualizing the lack of access to particular services that results from a wide array of intersecting policy choices. This approach first became widely used in the 1990s to assess the prevalence of food deserts, areas that lack access to affordable, good-quality, fresh food (Shaw, 2006). The United States Department of Agriculture (USDA) measures food deserts by the travel distance to a grocery store (approximately one mile for urban areas and 10 for rural areas) (Rhone, 2019). The concept of access deserts is a powerful lens through which to consider a community’s spatial justice in terms of access to needed services. Scholars examined food access, for example, in relation to health and the uneven geographies of diet-related illnesses. The concept has since been applied to the geography of a wide range of services including surgery (Belsky et al., 2010; Uribe-Leitz et al., 2018), contraception (Kreitzer et al., 2017), higher education (Dache-Gerbino, 2016; Hillman and Weichman, 2016), and basic healthcare (Dosen et al., 2017).
In each case, lack of access has been found to be a result of the complex historical forces of segregation, disenfranchisement, and privatization which coalesce to create uneven geographies of accessibility. The very existence of segregation by race and class in the United States, which undergirds most of the access deserts which have been mapped and analyzed, is the result of post-World War II housing policies (Rothstein, 2017). Grocery stores, for example, hesitate to build in impoverished urban areas because of higher rents, lower purchasing power of residents, and a lack of demand for healthy foods due to expense and cultural disconnects (Shaw, 2006). Scholars have honed their considerations of access further, arguing that the preponderance of food deserts is part of a complex social network (Brown and Brewster, 2015). As such, simply putting more supermarkets in areas that do not have them will not fix the problem. Instead, it is necessary to restructure the entire food industry, which saturates food markets with cheap, unhealthy, addictive foods, and to tear down the barriers to healthful eating brought about by entrenched poverty. A web of policies regarding housing, segregation, social welfare, zoning, agricultural subsidies, and more come together to create the uneven geography of food access. The concept of food deserts helps to illustrate this end point, but does not reveal a simple solution.
Suffice it to say, conceptualizing access deserts does not mean that services can simply be added; instead, it is a starting point from which to untangle the web of policy decisions behind them (Páez et al., 2010). Access deserts offer a powerful visual tool with which to influence policy conversations, as has been demonstrated by the evolution of discussions regarding food deserts (Almadan, 2015; Sadler et al., 2016; Ver Ploeg, 2010). As research on food deserts has proliferated, their complexity has been increasingly understood by scholars, policymakers, and the public. As Shaw (2006) pointed out, acquiring and consuming nutritious food requires “several different types of resources,” including transportation, wealth, and even cultural frameworks that support the purchase and preparation (Guthman, 2008), all of which influence true access to and consumption of healthy foods. In other words, analyzing the locations’ physical proximity is only a first step. Thus, identifying access deserts geographically does not equate to simple solutions. The solutions will be complex and multifaceted, but mapping and analyzing geographic access to good schools offers a starting point from which to consider spatial justice in educational policy.
Collectively, the scholarly use of access deserts to demonstrate uneven access to services contributes to the articulation of spatial (in)justice. In the case of school policy, Tieken and Auldridge-Revel (2019) have argued that school closures are a spatial injustice issue. They draw on the wealth of literature in geography and cognate disciplines that represent a spatial turn in the social sciences and establish that “economic, social and political access and resources are clustered and stratified by locale, with some places enjoying fewer opportunities” (918). They argue that not only do recent school policies perpetuate inequality in the US school system, so too do school closures in both urban and rural contexts. Their review of the literature “shows how a spatially neutral policy can create unjust geographies, uncovering an important mechanism in the production of spatial injustice” (939). They lay out three pathways for future analysis of how “educational inequality is generated and maintained through the fundamental relationship between schooling and location.” The first is to conduct more impact studies. The second is to consider urban and rural areas in tandem with one another instead of discretely. The third is to conduct research that explores more “inclusive, responsive alternatives to closure” (940). We propose that the conceptualization of school deserts at the K-12 level 1 can be used to guide analysis in all three of these important directions.
Delimiting school deserts reveals which neighborhoods (and subsequently which types of people) have access to good schools and which are in school deserts. Considering geographic access reshapes the terrain of the school closure and school accountability movement in compelling ways. Specifically, geographic visualizations invite us to reconsider our assumption that freedom and choice are built into school accountability. Being granted the “freedom” to commute to a good school by having your school closed has a range of latent consequences for the neighborhood around the closed school. Through access zones, we can also start to think about the broader impact of school location on communities and students. We define school deserts in terms of who has access to good schools. Overwhelmingly, most students do have a school near where they live, so we also considered the quality of those schools. By examining these patterns statewide, we produced a mapping methodology based on a universal analytic which can be applied to urban and rural districts in tandem. In conducting this study, we also inverted the assumed question; instead of asking who is impacted by a school closure, we used US census data to analyze who has access to the good schools that remain open across Pennsylvania.
Methodology
To develop an analytic of school deserts, we focused on Pennsylvania at the state level; however, our approach could be applied to any state, the whole country, or a metro region. We first had to determine an appropriate process for discovering “good schools,” since this data is not consistent nationwide. We classified each part of Pennsylvania as either an access zone or a school desert. We then assessed the demographic differences between the two categories
Selecting “good schools”
Ladd and Loeb (2013) highlighted three measures by which to determine school quality across districts: resources, internal practices and policies, and student outcomes. Most measurements of school quality rely too heavily on markers of academic achievement to evaluate school quality. However, we used a database that took a more comprehensive approach. The Pennsylvania Future Ready index, formerly known as the Pennsylvania School Performance Profile (PSPP), records a thorough assessment of student academic performance for each given school and school district. This ranking includes measures of school quality such as graduation rate, access to advanced coursework such as Advanced Placement/International Baccalaureate Degrees and college credit, and other measures that highlight a school’s access to enriching resources. 2 Each school in the index is rated with a quantitative score on a 0–100-point scale according to these indicators. The score is composed of defined weighted data categories, and it provides a snapshot of overall quality for each school that families, administrators, and reporting agencies can use to compare schools.
Since the PSPP ranks all schools (elementary, middle, and high school) throughout the state of Pennsylvania, we needed a methodology by which to rank entire school districts or catchment zones. As previously mentioned, the PSPP uses a wide variety of indicators, most of which, like graduation rates, attendance rates, and dual enrollment, help to measure overall school quality. Many indicators are tied to senior high schools and tend to highlight resource-rich school districts with access to invaluable resources. To find schools whose PSPP score could represent their district or catchment area, we sorted through an initial volume of 2900 schools. High schools often serve large swaths of school catchment zones and, thus, can serve as indicators of access to resources throughout an entire school district. Thus, we selected only schools from the data set that had grades 11 and 12 and removed the rest. This created our data set of 758 high schools which covered all possible attendance zones across the state. While we selected high schools for our statewide analysis, other researchers could, in fact, use other filtering methods to attain a unit for analysis.
Our final analysis included a list of 758 schools which were then sorted by their overall PSPP numerical ranking. The standard for establishing “good schools” was set at a Z score of 1 or higher indicating a PSPP score of 84.8 as the benchmark for labeling a “good school.” This analysis sought to include brick-and-mortar schools that represented traditional public schools as community hubs for family and community access. Thus, the four cyber schools were eliminated from the analysis as these schools are effectively aspatial, and cannot be narrowly connected to one catchment zone. In total, 114 high schools emerged across the state of Pennsylvania as “good schools” based on the PSPP data.
Selecting “access areas” and “deserts”
Determining whether or not residents have access to a good school required us to consider two aspects of location: travel proximity and school catchment zone. In many cases, families can live right next to a school, but still do not live within its catchment zone. One school which is not situated in its catchment zone (see Figure 1) draws its students from the other side of town. This is an extreme example of a common phenomenon in which students are not sent to the school closest to their home because of the way the catchment zones are drawn. The inverse is therefore also true, with many students making long trips to reach the school assigned to their zone or to attend a magnet or charter school. We defined proximity to good schools according to residential classifications from the Pennsylvania Department of Education. All school catchment areas are classified as urban, suburban, suburban II, or rural. Figure 2 illustrates how we used the Pennsylvania Department of Education’s classification for each good high school as city (n=6), town (n=13), rural (n=11), or suburban (n=84) schools. We calculated walk and drive times, mapping “drivetime areas” in ArcGIS online. In urban areas, we defined access as being within a 10-minute walk; for suburban areas, a 10-minute drive; for suburban II areas, a 15 minute drive; and for rural areas, a 20-minute drive. These travel times were based on the typical use calculated for other daily activities (Charreire et al., 2010). If residents usually travel 20 minutes for basic activities, then the same travel time is reasonable for school. In a city, where the friction of distance is higher (Páez et al., 2010), a 20-minute drive is rare in day-to-day activities. This measure was also important because if schools anchor community networks and civic life, then they must be proximate to routine travel. Communities with easy access to a good school benefit from this community asset at a neighborhood level in the way that students coming from outside the area cannot.
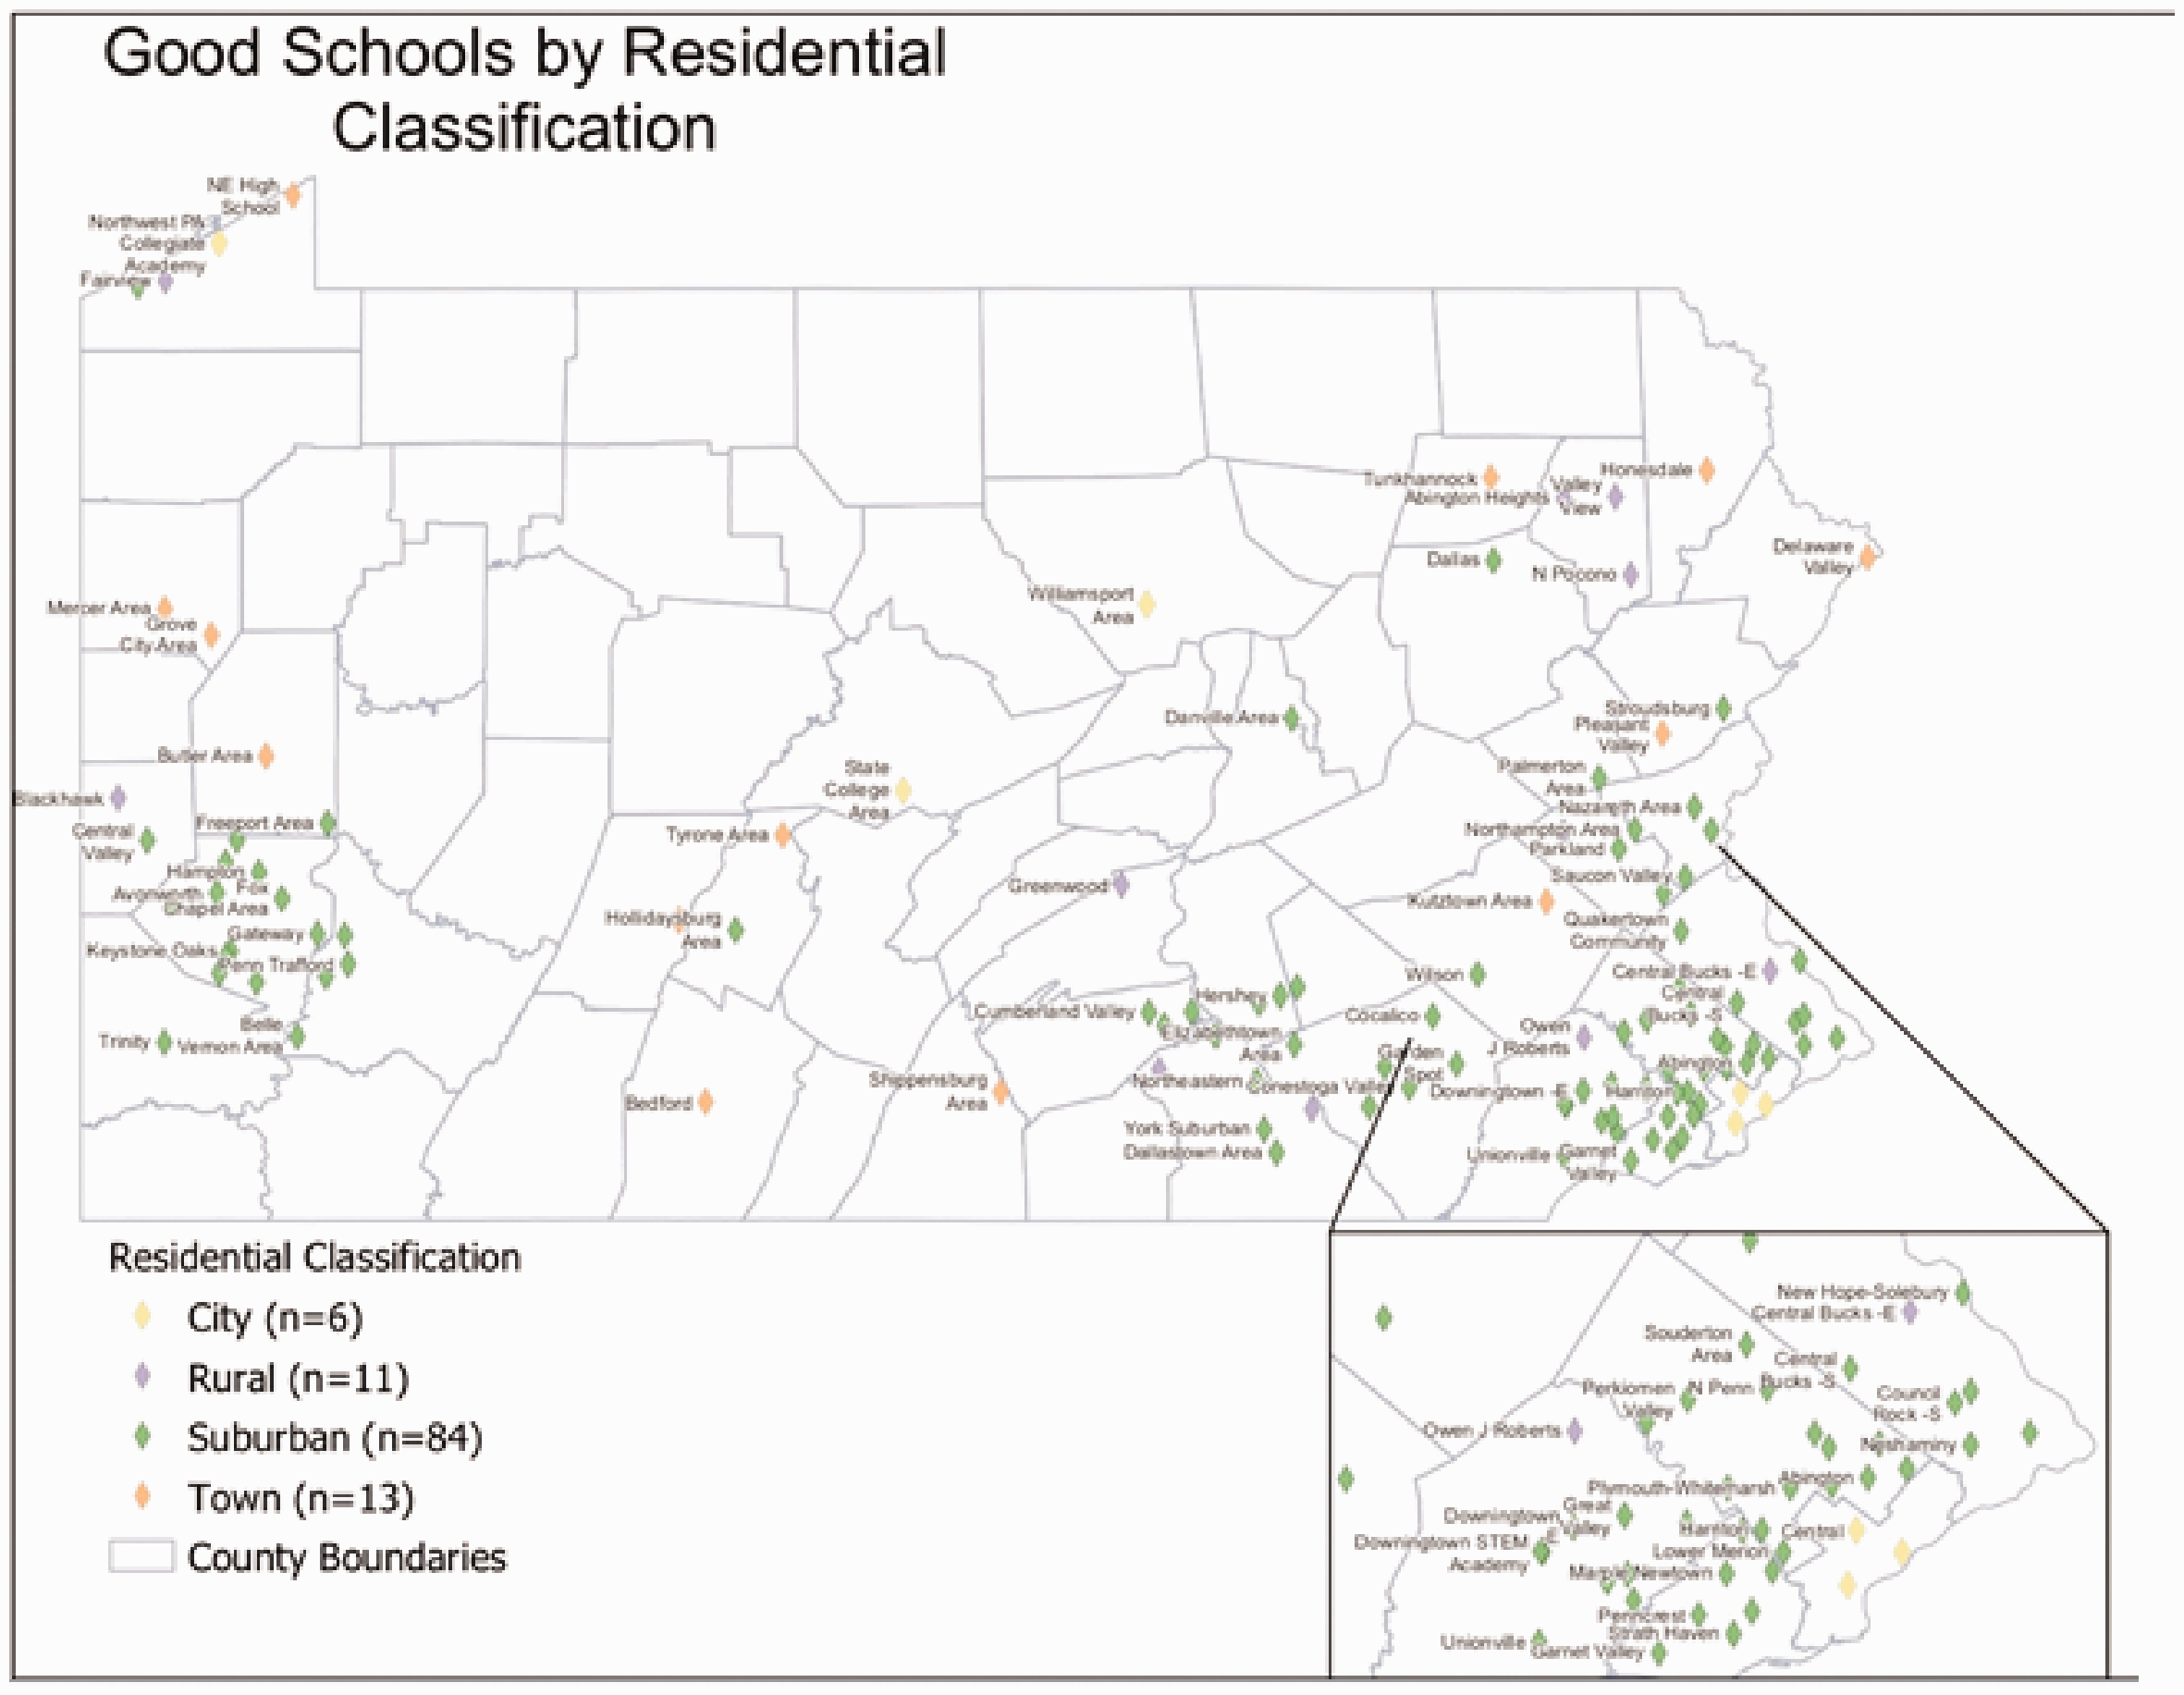
All of the secondary schools classified as "good schools" color coded by residential classification.
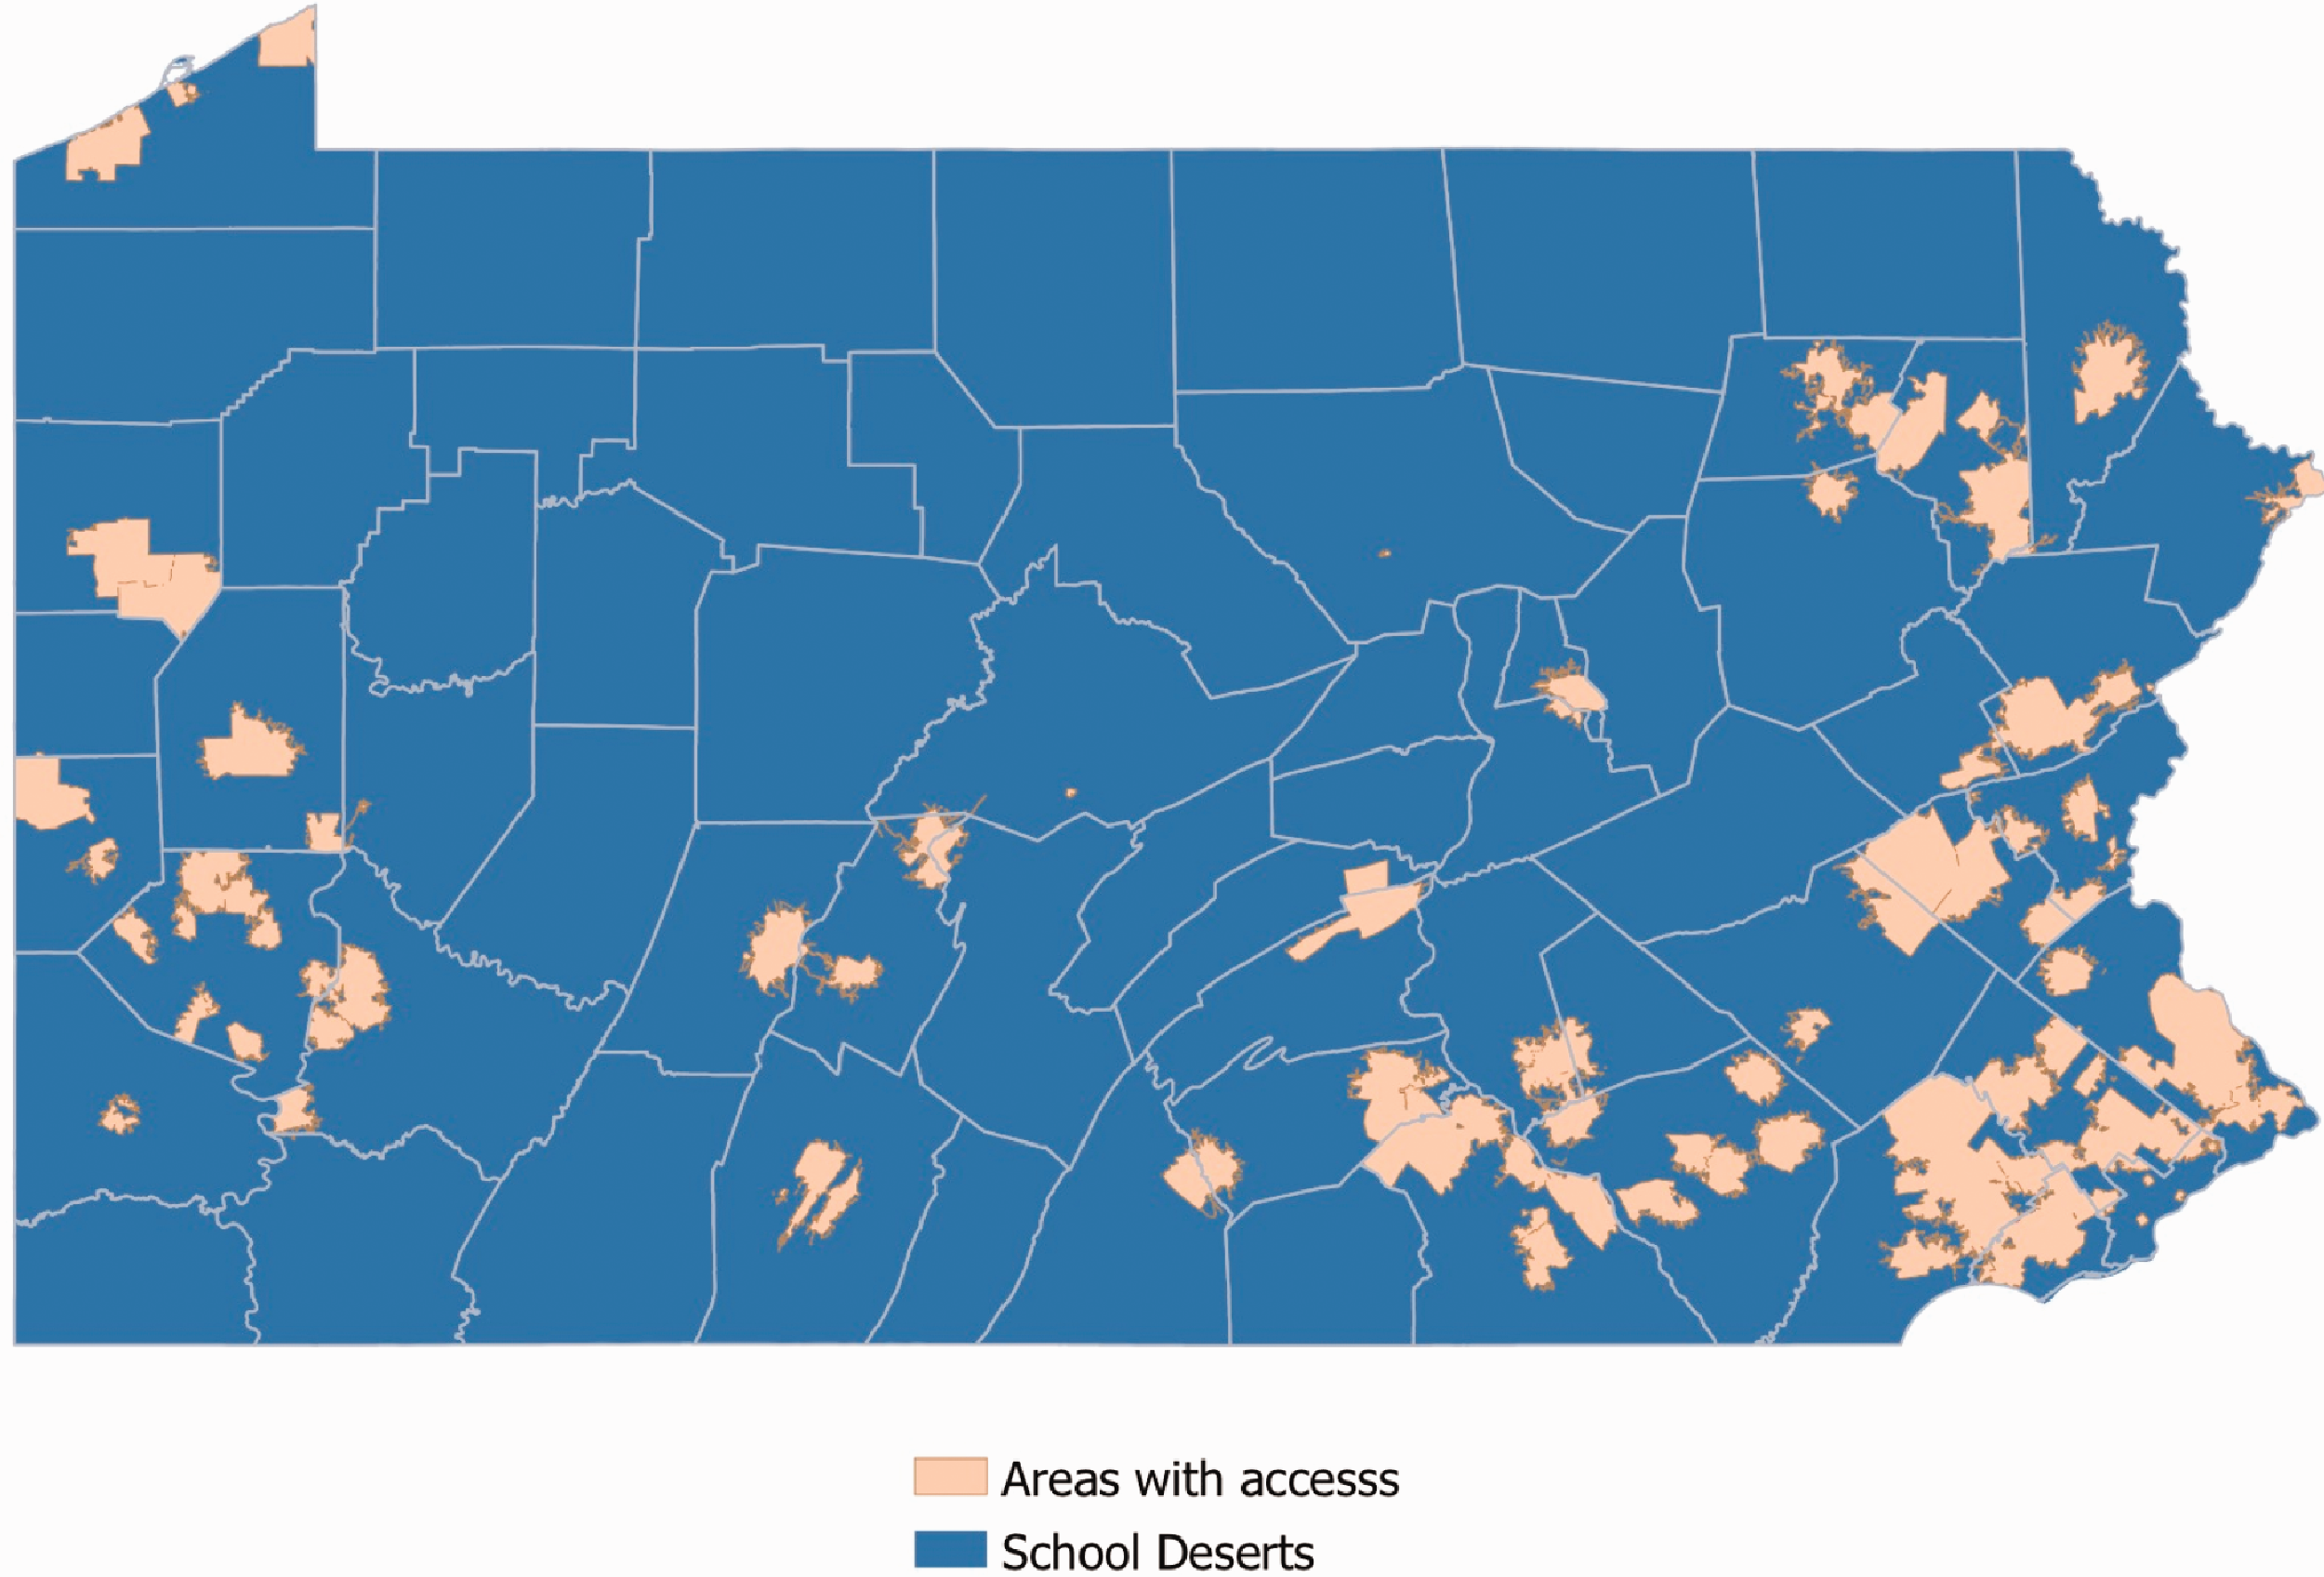
School deserts and school access areas in the state of Pennsylvania.
We cross-referenced these travel zones with the school catchment areas from the National Center for Education Statistics’ (2017) Locale boundaries. A household which is located within spatial proximity, but is not in the school’s catchment area, cannot be said to have access to that school. The benefit to property values of falling within the catchment area of a high-quality school is well documented (Sklarz et al., 2018), so clearly proximity alone is insufficient as a means to assess how a good school is benefiting the surrounding community.
We used the combination of proximity and catchment to determine which areas constituted “access areas” in ArcGIS. If an area does not fall within these access areas, it does not have access to a good school and is a school desert. Having defined these two geographies, we collected aggregate demographic indicators for both the access areas and school deserts and compared them to the state as a whole (see Table 1).
Demographic indicators for school deserts, school access areas and Pennsylvania.
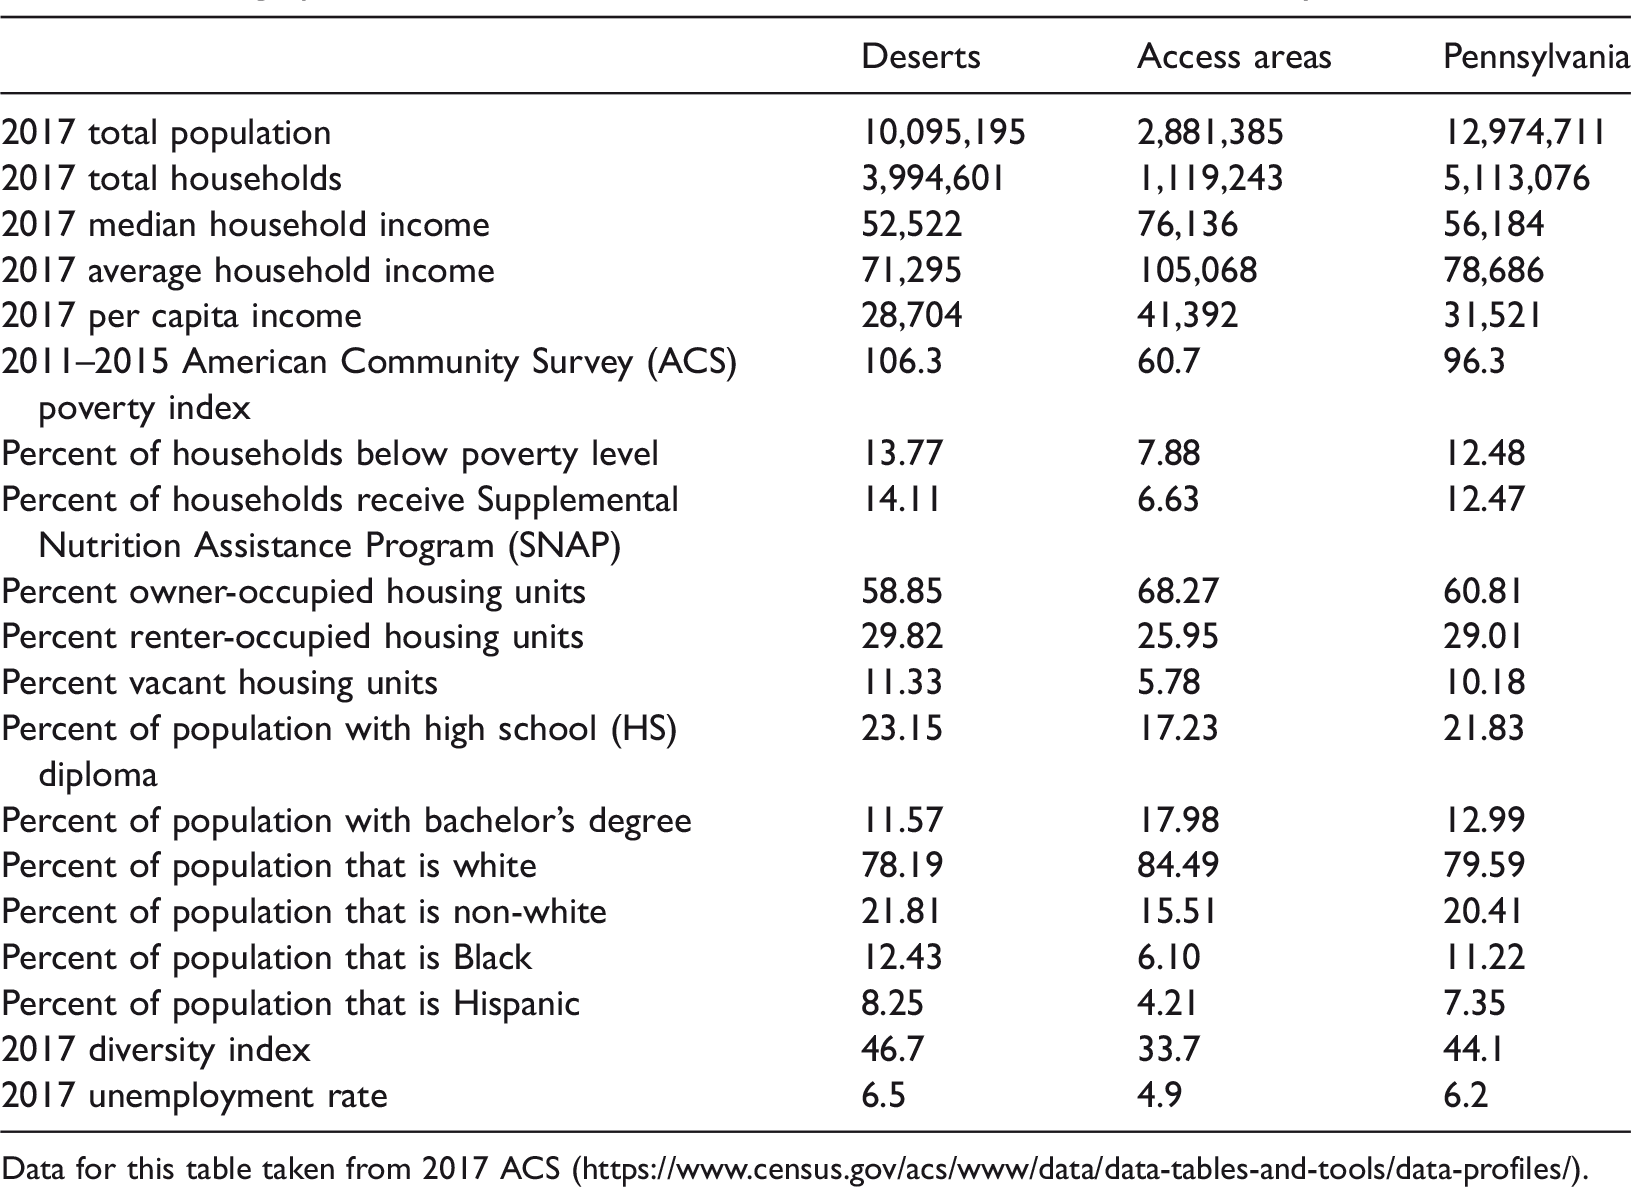
Data for this table taken from 2017 ACS (https://www.census.gov/acs/www/data/data-tables-and-tools/data-profiles/).
The demographics of deserts and access areas in Pennsylvania
Our analysis delimits all areas of Pennsylvania as either access areas or school deserts. This delineation allows us to visualize the net effect of educational policies on individual students, communities, and the state as a whole. School- or district-level decisions may be driven by wider cultural movements and policy initiatives. By viewing school deserts at the state level, we can examine the aggregate effect of micro-level decisions.
It was immediately apparent that the disproportionate presence of good schools in suburban areas indicates an uneven distribution of access. While 27% of the state’s residents live in rural areas, only 9.6% of good high schools are in rural districts. Nearly 75% of all good schools are classified as suburban. This distribution reflects the long history of white flight, housing discrimination, and urban disinvestment that has ultimately concentrated wealth in the suburbs (Anderson, 2013; Connolly, 2016; Jacobs, 1992). The quality of schools throughout Pennsylvania mirrors the ongoing overinvestment in suburbs and more meager resource allocations to urban and rural areas (Feagin and Parker, 2002; Theodos and Hangen, 2019).
Table 1 displays aggregated demographic indicators using 2017 census data for three geographies: (a) deserts across the state; (b) areas with access to high-quality high schools; and (c) the state as a whole. The vast majority of residents in the state, 77.81%, live in school deserts. A smaller, elite minority populates the access areas, just 22.21% of the total population. Knowing this, the data in Table 1 is surprising because of the striking difference between the deserts and the state averages. We expected the deserts, because they represent such a large swath of the state’s population, to be similar to the overall state demographics. Instead, we found that the wealthy are crisply separated from the poor, from racial minorities, and from other historically excluded and disadvantaged groups by their access to high-quality schools. This reflects the history of suburbanization as actively exclusionary along lines of race and class in Pennsylvania and the US. The vast majority of the state’s good schools are located in wealthier suburbs.
In school deserts the American Community Survey (ACS) poverty index is more than 45 points higher than in access areas and 10 points higher than the state index. Similarly, the percentage of households receiving Supplemental Nutrition Assistance Program (SNAP) benefits in the deserts is more than twice that in the access areas, 14.11 and 6.63 respectively. In every indicator of poverty, it is clear the desert areas are much poorer than their access counterparts. Access areas are also considerably wealthier, with a 2017 average household income in access areas of $105,068. This number is extraordinary considering that the average for the state was $78,686 and the nationwide average just over $61,000. Rates of home ownership are also higher, with 68.27% of households in the access areas owning their homes compared to 58.85% in the deserts. Vacancy rates are 6 percentage points higher in school deserts than in access areas, where only 5.78% of homes are vacant. This lower vacancy rate is surely connected to the desirability of access to a high-quality high school. This iniquitous distribution both arises from and exacerbates racial inequality. Given the explicit racial segregation of housing in the US (Green, 2015; Rothstein, 2017; Saporito and Sohoni, 2007), it is no surprise that access areas are whiter than school deserts by six percentage points. Conceptualizing school deserts allows us to recognize the inequality being perpetuated not only through unequal education (though students in the access areas do have notably higher educational achievement), but also the way that access to good schools perpetuates the inequality of place values. Wealthy, white residents dominate the access areas, while poor, minority families are relegated to the deserts. While high-quality schools stabilize property values in their catchment, their uneven distribution contributes to longstanding wealth inequality in the US (Asante-Muhammad et al., 2017; Thompson, 2018).
The consequences of uneven access
Local and national policies have converged to reinforce an educational landscape in which the most privileged students have access to high-quality schools. The combination of school choice policies with school consolidation policies has led to fewer schools in the state as a whole. This scarcity increases the overall travel time that students devote to attending school and decreases their likelihood of living near a good school. Schools, especially high-quality ones, contribute strongly to property values and community cohesion (Lautz et al., 2017). In short, good schools are a community asset, strengthening property values, civic engagement, community ties, parental involvement, and even student engagement (Lyson, 2002). Distance causes deterioration of all of these assets. When students travel to school from throughout the city (as is increasingly common in Philadelphia) it presents myriad challenges to community cohesion and even student safety (Owens, 2017; Winberg, 2019). Students who are not local to their school face a range of challenges in attending school and participating in extracurricular activities (Kirshner et al., 2010). It also becomes more difficult for parents to participate in school activities and build community around their children (Bell, 2007; Graves, 2011; Honey, 2017). For all of these reasons, the uneven distribution of good schools exacerbates pre-existing inequalities. These findings suggest three points for further discussion with regards to the unintended impacts of school closures. The first is the utility of the desert analytic to inform policy. The second is the implications for individual students and for spatial justice in education. The third is the impact of these policies on communities as a whole.
The methodological utility of “school deserts”
This visualization of Pennsylvania’s access areas demonstrates the potential of the desert concept to visually expose the consequences of various federal, state, and local policies. By creating a visual of where resources should be located we upend the logic that seeks to punish underperforming schools by closing them. Our map, which highlights the disproportionate access of high-poverty areas and racially diverse students to high-quality schools, invites an investment of resources in the deficient areas and assumes that all areas should have good schools. The spatial imagery of school deserts makes it easier to understand which communities are benefiting from vibrant schools and which are not and to grasp the entrenched history of residential segregation and the link between property values and school quality.
Lessons from research on food deserts and the subsequent policy effects offer a clear precedent for using access deserts as a conceptual starting point for assessing the impacts of school closure and voucher policies. Research shows that students benefit from environments that support their development and learning – that is, less stress and travel, more security and stability. Simply closing a school and sending its students elsewhere has proven ineffective. Examining the question in terms of access clears the way for interdisciplinary research teams to reframe schools as geographically tied to communities, not just students. Indeed, students themselves are geographically tied to communities and will not thrive in isolation (Tieken and Auldridge-Reveles, 2019). While we conducted our analysis at the state level, this process could and should be applied nationally or regionally in exploring the future implications of new policies or closures.
Implications for spatial justice in education
While it is clear that not having access to a high-quality school can substantially harm students’ academic achievement and create barriers to future employment opportunities, the effects of school deserts do not end there, for students or their families. Families who live in school deserts are currently advised to take advantage of school choice options in their search for high-quality schooling. Yet transporting students to schools further from home interferes with the school’s role as a communal space. Students who seek to travel to high-quality schools outside their normal attendance zone face transportation issues including increased travel time and higher travel costs, which may also affect the school district. While such hassles may seem a minor inconvenience, they directly decrease the students’ study time, participation in extracurricular activities, and free time (Eyre and Finn, 2002). Distance is also a barrier to forming relationships with other students and adults. Students who are forced by school closures to relocate struggle to create new friendships at their new schools and to maintain their lifelong friendships with peers from their previous institution, while also finding it difficult to bond with adults at their new school (Kirshner et al., 2010). Our use of the desert analytic also demonstrates that schools must be considered community assets and reveals how their location and quality can exacerbate existing inequalities. Any effort to address inequality in the US must be rooted in a just distribution of high-quality education for all students. The inextricable link between property values and school quality ensures that the iniquitous placement of high-quality schools will continue to generate wealth for people who are already wealthy (Kane et al., 2006).
Community reverberations
School deserts, and the uneven demographics which surround them, exacerbate inequality. This action contributes to the uneven distribution of both wealth and community assets. High-quality schools increase property values, either displacing or blocking less-wealthy people from living in those areas (Figlio and Lucas, 2000). Communities, even small, rural ones, with strong public institutions are better positioned to accumulate wealth through property value (Lyson, 2002). They are also able to protect their assets – that is, property – by blocking undesirable zoning. Our findings parallel those regarding the geography of food deserts in Pennsylvania (Walker et al., 2010), as well as environmental justice findings regarding white privilege and the environmental hazards of brownfields (Pulido, 2000). The high property values and community cohesion which follow good schools (Rangel, 2013; Rhodes and Warkentien, 2017) create a loop in which districts with good schools have higher property values and consequently higher property tax revenues. Suburban areas with higher property taxes can therefore fund their schools at, in some cases, twice the rate of poor, urban, or rural counterparts
This loop contributes to the ever-increasing economic injustices suffered by minorities in the US (Asante-Muhammad et al., 2017; Rothstein, 2017; Thompson, 2018). Minority people, especially Blacks, in the US have been systematically excluded from home ownership and particularly from the most valuable, desirable suburban areas, which inhibits their access to high-quality schools and their ability to accrue personal wealth (Coates, 2014; McKittrick, 2011; Shabazz, 2015). It is not just vulnerable students who need good schools; vulnerable communities need them too. Unraveling this complex link between property value and school quality is essential to the future of social justice and to the desegregation of schools and communities in the US.
Schools are a community asset, and “school choice” is far from a choice when it drives the closure of the schools whose communities need them the most (LaFleur, 2016; Nguyen et al., 2017; Talen, 2001). Visualizing school deserts throws the role of school geography in this issue into stark relief. Our findings contribute to broader conversations and concerns about the uneven nature of school funding across the US (Chen, 2018; Education Law Center, 2019; Meckler, 2019; Semuels, 2016; Zappulla, 2019) and highlight the complex nexus of issues, inequalities, and injustices that create all access deserts.
Perhaps most interestingly, this analysis reveals the relationship between suburban, urban, and rural areas. While the discussion of school choice policy tends to focus on urban districts, rural communities also lack educational resources (Post and Stambach, 1999). Desert nomenclature identifies regions of need and unites urban and rural (places with significantly more poverty than suburban regions) as areas of need.
Conclusion
The goal of this study was to apply the concept of access deserts, derived from literature on food, health care, and higher education deserts, to highlight the unintended consequences of PPSP on school closure and school choice. The findings of this study, gained through using routing technology and school catchment zones to determine access areas and subsequent “school deserts,” provide a visual representation of catchment zones across the state of Pennsylvania where students do not have access to high-quality schools. In the event of a school closure, through school consolidation for either financial or quality reasons, students and families may choose to travel to a better school outside their catchment zone. We contend that this is not a meaningful solution. Extracting students from neighborhood schools does not, in fact, guarantee that students will attend a better-quality school (Kirshner et al., 2010). The distance students may need to travel to get to a better school is consequential. On the surface, travel distance from home to school to attain a superior educational experience may seem beneficial to students who are looking for better educational opportunities. However, schools are not only places of learning for students, but also serve as community hubs for families connected to the school. Travel distance to school impacts students and families by creating access barriers to the school as a community hub. Furthermore, better schools are frequently at capacity and unable to accept new students (Stroub and Richards, 2013). Lastly, research has shown that students who take advantage of school choice vouchers only perform moderately better at their new school than at their previous, “low quality” school (De la Torre and Gwynne, 2009). For these reasons, we contend that school closure and school choice policies that justify them in Pennsylvania do not provide students with access to high-quality educational opportunities. While school choice as a mantra purports to give students such opportunities, in actuality, school desert visualization shows that this is not the case because of geographic access. For this reason, such visualizations are vitally necessary for assessing the efficacy of school choice policy and school closure decisions – in both policy realms, it is fundamentally necessary to consider which communities have access to good schools.
In the case of Pennsylvania, our research highlights the disproportionate impact that school deserts have on minority populations. In summary, lack of access to high-quality schools is more frequently found in poorer and browner communities. So, these students are not ultimately given a “choice” when their school closes. Not only do these students lack true access to these schools and will suffer long travel times at best, their communities will not benefit from the anchor of a community asset. In addition to in-depth qualitative study that tracks the effects on students of living in a school desert, we recommend broader studies of community reverberations, including Black trauma (Fullilove, 2005; McKittrick, 2011), racial capitalism (Robinson, 1983), and damage to student success (Falch et al., 2013; Nguyen et al., 2017). There is much fruitful work to be done at the intersection of educational inequality and spatial justice. The geographic method of designating access deserts is a strong methodological tool for these studies and for effecting policy.
Lastly, these discoveries provide a novel conceptualization that should expand the country’s policy definition of equitable access to educational opportunity. If, in fact, neighborhood schools serve as a community hub to support and sustain academic success for all students and also provide for the needs of its surrounding community, then students and families who are forced to relocate to schools that require substantial travel do not have equitable access to high-quality schools. The definition educational policymakers should use to create equitable access to high-quality schools for all must be broadened to include not only the quality of the school, but also the ability for the school to serve as an asset to the students and their families. The greatest barrier to expanding our definition of equitable access is the distance between high-quality schools and families that seek to enroll in them.
Footnotes
Acknowledgements
The authors would like to thank the editors of this special issue, Helge Wasmuth and Elena Nitecki for their help and guidance throughout the process. We are grateful for the insights from two anonomous reviewers, their engagement greatly improved this manuscript. We would espeically like to acknowledge Janine Glathar and Carrie Pirman at Bucknell for their guidance in the research. Lastly, we thank our student research assistants, Elyssa Evans and Patricha Williams.
Declaration of conflicting interests
The author(s) declared no potential conflicts of interest with respect to the research, authorship and/or publication of this article.
Funding
The author(s) disclosed receipt of the following financial supportfor the research, authorship, and/or publication of this article: This work was partially supported by Vanessa Massaro's American Fellowship from the American Association of Unviersity Women.