
Abstract
Optimizing the layout of residential buildings based on daylight performance and view quality is crucial to visual comfort and well-being of building occupants. Machine Learning (ML) methods offer valuable support for performance-based decision-making process at the early-stage building design. In this study, a novel workflow is introduced to integrate ML models into the architectural design process. With the designer’s input floor layout designs, the presented multimodal ML model predicts daylight provision and view quality, which are then translated into practical visual representations by a post-processing step. This approach allows input designs to be evaluated by the ML model, leading to enhanced design decisions while preserving the designer’s autonomy. Results for the best-performing model, implementing ResNet50 and a fully connected network, led to a Mean Square Error (MSE) of 0.0440 and 0.0478, and an R2 score of 0.7411 and 0.7815 for the daylight and view metrics, respectively. The results of the daylight and view predictive models are further interpreted according to different apartment categories and at various resolutions. These results indicate that the method could be viable for predicting daylight provision and view quality in early design tools, providing designers with faster feedback that supports informed decision-making during design iterations. Ultimately, the challenges of the study and further improvements are discussed.
Introduction
Proper lighting conditions significantly influence human well-being, affecting sleep, energy, mood, and cognitive performance.1–3 Providing interior building spaces with sufficient daylight reduces the need for electrical lighting, resulting in lower energy consumption and operational carbon footprint.4,5 In this regard, the availability of natural light, as well as its variability throughout different times and days should be integrated during the building design process.
To ensure the quality and quantity of (day)lighting in indoor spaces, several guidelines have been developed.6–8 More specifically, the EN 17037 guidelines specify requirements for residential spaces regarding both view and daylighting provision. According to this guideline, view quality is evaluated based on three key aspects: the horizontal sight angle, the distance to the outside view, and the number of view layers as the most comprehensive factor. Regarding daylight provision, a target illuminance level over at least 50% of the space is recommended to be achieved, with the minimum target illuminance level of 300 lux set by EN 17037. However, it has been recognized that this threshold is not always met in dwellings while the spaces still provide sufficient daylight for their intended use. 8 Furthermore, different spaces have varying daylight needs, with some requiring ample daylight and others necessitating controlled or reduced light based on their intended activities. Although there have been discussions on the effectiveness of the daylight assessment methods as suggested by EN 17037 – specifically regarding differences in calculation results among daylight simulation software, and in climatic contexts with predominant occurrence of cloudy days – the standard represents a first step towards better inclusion of daylight in building design guidelines and is increasingly taken as a reference when assessing daylighting provision and view quality. 9
Among the building-related characteristics during the design process, building orientation and window placement are two of the most critical factors influencing daylight and views received in interiors.10,11 Interior layout, particularly the orientation, and potential overshadowing, is strongly related to the duration of sunlight penetration. 11 An optimal orientation per room type enhances solar-heat control, natural lighting gain, and aligns with occupancy timeframes and sunlight availability. Accordingly, standards and guidelines have suggested optimal orientation based on sun path diagrams, namely bedrooms facing southeast, kitchens facing east, and living rooms facing southwest.12–15 Moreover, it has been shown that the size, shape, and position of windows significantly impact the distribution of daylight within interior spaces. 16 Therefore, overall daylight performance evaluation is given attention during the building design process.
Extensive daylight simulations for assessing different design alternatives hinder quick initial approximation during early design phases, due to the lengthy computational times. While more accurate simulations may be required during the design development stage, predictive models can be useful for rough estimations during initial design phases. Additionally, simulations require complex or even unknown input, making it challenging to incorporate in early design phases. 17 Therefore, a fast, accurate, and simple method to support decisions would be a useful alternative to full daylight predictions at the beginning of the design process. Machine Learning (ML)-based algorithms can predict daylight provision and view quality based on correlated variables, enhancing the efficiency of building design decisions. Moreover, image-based models have shown to be more efficient with fewer parameters than simulations and can deal with more general building geometry than proxy models. 18 Given the proportion of accuracy levels at different design stages, image-based models could be beneficial to a high extent at early stages.
The interior layout of apartments is determined during the early stages of an architectural project at a time when decisions can have a significant impact on the performance of the building. 19 Given the significance of occupants’ well-being and experience of spaces, daylight, and view performance is more effective when investigated at the early stages of the design process. 20 During this decision-making process, layout alternatives created by a designer need to be evaluated for further design development. On the other hand, ML-based methods offer the potential to provide valuable support for performance-based decision-making process. In this way, the impactful role of the designer and the performance feedback offered by ML-based models could be combined in the design workflow. In this system, driven by human-machine interaction, the integrated ML-based model acts as a lever to assess and further amplify the designer’s objectives during the iterative layout design and evaluation process.
Related literature
Previous studies investigated the application of ML-based methods in the assessment of visual comfort in building spaces, by comparing features of the studied buildings, the employed algorithms, input and output parameters, and different evaluation metrics. In this section, the previous studies at the intersection of daylight and view performance with ML-based approaches are grouped into two sub-categories, namely unimodal- and multimodal-learning strategies. The former corresponds to the applications in which only one data modality (e.g., numerical, textual, or visual) is included, whereas in the latter different modalities could be combined.
Unimodal learning for visual comfort in spaces
During the emergence and development of Artificial Neural Networks (ANNs), many studies experimented with the visual comfort assessment in spaces in an unimodal settings with numerical inputs.21–25 In a relatively more recent study, daylight and view quality assessment of 2880 shoe-box models of side-lit spaces were investigated by Nourkojouri et al. 17 utilizing a simple ANN predictive model with one hidden layer. The prediction results were estimated to be 97% accurate on average compared to the simulated results as the ground truth developed from the LEED v4 evaluation framework. In another study, an ANN model was implemented by Le-Thanh et al. 25 to predict the Useful Daylight Illuminance (UDI) daylight metric in five ranges for 400 parametrically generated space layouts with windows on multiple facades. It was shown that the trained ANN model with two hidden layers resulted in an R2 value of over 0.890 for all the UDI ranges. Based on a review study on the application of ML techniques in early daylight design practices by Ngarambe et al. 26 geometrical characteristics of space layouts were translated into numerical data due to the alignment with the input type of ANN model architectures. Predicting visual comfort performance inside spaces when using numerical input data has shown to be successful. However, during the early stages of architectural design, when 2D drawings and rough estimates are common, layout design alternatives are hardly convertible into solely numerical data. Therefore, the focus of the research line shifted towards using a data modality as the input for the predictive models which could be a proper representation of the early-design stage data, that is images.
Within the architectural field, images are an intuitive communication medium for architects, which led to the increase of image-based applications in performance-driven design practices. 27 Accordingly, in another set of previous studies regarding unimodal learning for visual comfort assessment, the image type of data was regarded as input to predictive models. In a study conducted by He et al., 18 a dataset containing approximately 1k floor plan images of synthetic and real cases was used to evaluate the accuracy of a ResNet50 28 and a pix2pix 29 model to predict static and annual daylight metrics (uniformity, mean lux, success rate, sDA, and UDI) and illuminance distribution in space, respectively. The results led to a Mean Squared Error (MSE) of 0.008 and R2 of 0.959 for the ResNet50 model, and a Structural Similarity Index Measure (SSIM) of 0.90 for the pix2pix model in the best scenario. In another study by Mostafavi et al. 30 an image-based pix2pix model was utilized to predict illuminance, sDA, primary energy intensity, and ventilation maps of 300 synthetic residential layouts. Results indicated that the predicted illuminance and sDA maps had average SSIMs of 0.86 and 0.81, respectively, and the predicted primary energy intensity and ventilation representative maps scored 88% accuracy on average. Other than residential layouts, the application of an image-based pix2pix model has been investigated in office and educational spaces.31,32 Although the approach of using image-based models is closer to real-world early-design situations in comparison to numerical-based models, some architectural features can still be conveyed in a more efficient way using a combination of both. Consequently, the recent research scope of the research field has shifted towards investigating multimodal learning approaches for visual comfort assessment of architectural layouts.
Multimodal learning for visual comfort in spaces
ML-based models relying only on image data have shown limitations with regard to extracting planar geometrical attributes, topology, and façade characteristics such as window positioning. In contrast to unimodal learning models, multimodal learning models are capable of extracting and processing information from multiple data streams. 33 Despite being more effective, multimodal learning has not been widely implemented within the field of architecture and the built environment. In a study conducted by Li et al. 27 a multimodal Generative Adversarial Network (GAN) using vector-based material, weather data, and image-based spatial features was developed to predict indoor daylight performance. By evaluating the proposed method on residential layouts of RPLAN dataset, 34 it was reported that the multimodal approach increased the model’s flexibility to various designs and scenarios, leading to an SSIM of 0.907. In a follow-up study by Li et al. 35 view-based glare performance of residential layouts in the RPLAN dataset was investigated in a multimodal GAN setting. As compared with simulation methods, the model improved computational speed by 97% when applied to residential building luminance distribution. Other than applications in visual comfort evaluations, the effectiveness of multimodal deep learning frameworks using a Multilayer Perceptron (MLP) and a Convolutional Neural Network (CNN) for the task of energy performance prediction was investigated by Sheng et al. 36 The results proved the advantage of utilizing both textual and visual data compared to the unimodal setting. Despite the advancement of multimodal learning approaches, the combined analysis of daylight and view performance utilizing the ML capabilities has been limited so far.17,26
Research scope
Given that a building is inherently a complex integration of multiple qualities, the corresponding representation of technical architectural drawings should contain different layers, which can be translated to various modalities in ML-based models. Moreover, as a result of reviewing the current studies on the topic of visual comfort assessment of residential layouts using ML-based models, the application of multimodal learning has the potential to predict visual comfort metrics. However, the combination of daylight provision and view quality assessment has not been incorporated in multimodal settings using ML-based methods. In this regard, the current study proposes a novel ML-based design framework to assist designers in making informed decisions during the early phase residential layout design with the use of a multimodal predictive model for daylight and view performance. In this way, residential layout design options will be evaluated by the ML model, leading to more enhanced design decisions while keeping the autonomy and control of the designer in the decision-making process. The framework consists of a qualification system that enables the assessment of daylight and view performance of floor layout alternatives provided by the designer. A ranking stage is also included in the process to further fine-tune evaluation results. Accordingly, the contributions of the current study are listed as follows: • Presenting a multimodal ML-based framework for combined assessment of orientation, daylight provision, and view quality of interior residential spaces; • Processing a novel architectural dataset towards a machine-readable as well as human-interpretable material; • Highlighting the role of the designer in the decision-making process at the early stages of building layout design.
The remainder of this paper is organized as follows: Section 3 illustrates the implementation of the multimodal model in the architectural design process, network structure, and the implemented dataset. Section 4 presents the results of the performance test and discusses the directions for the improvement of the model. Finally, section 5 summarizes the main highlights of the study.
Methodology
Integrating AI, particularly ML models, into traditional architectural design has been a challenging task. In this study, a workflow is proposed to seamlessly integrate ML models into a design evaluation workflow by guiding designers in assessing performance indicators (Figure 1). This workflow allows designers to make well-informed decisions that improve the quality and performance of residential layouts while adhering to contemporary design standards and requirements. The workflow is methodically implemented to evaluate daylight provision, view quality, and room orientation by providing numerical and visual feedback and ranking suggestions. The proposed ML-based framework for floor layout design assessment.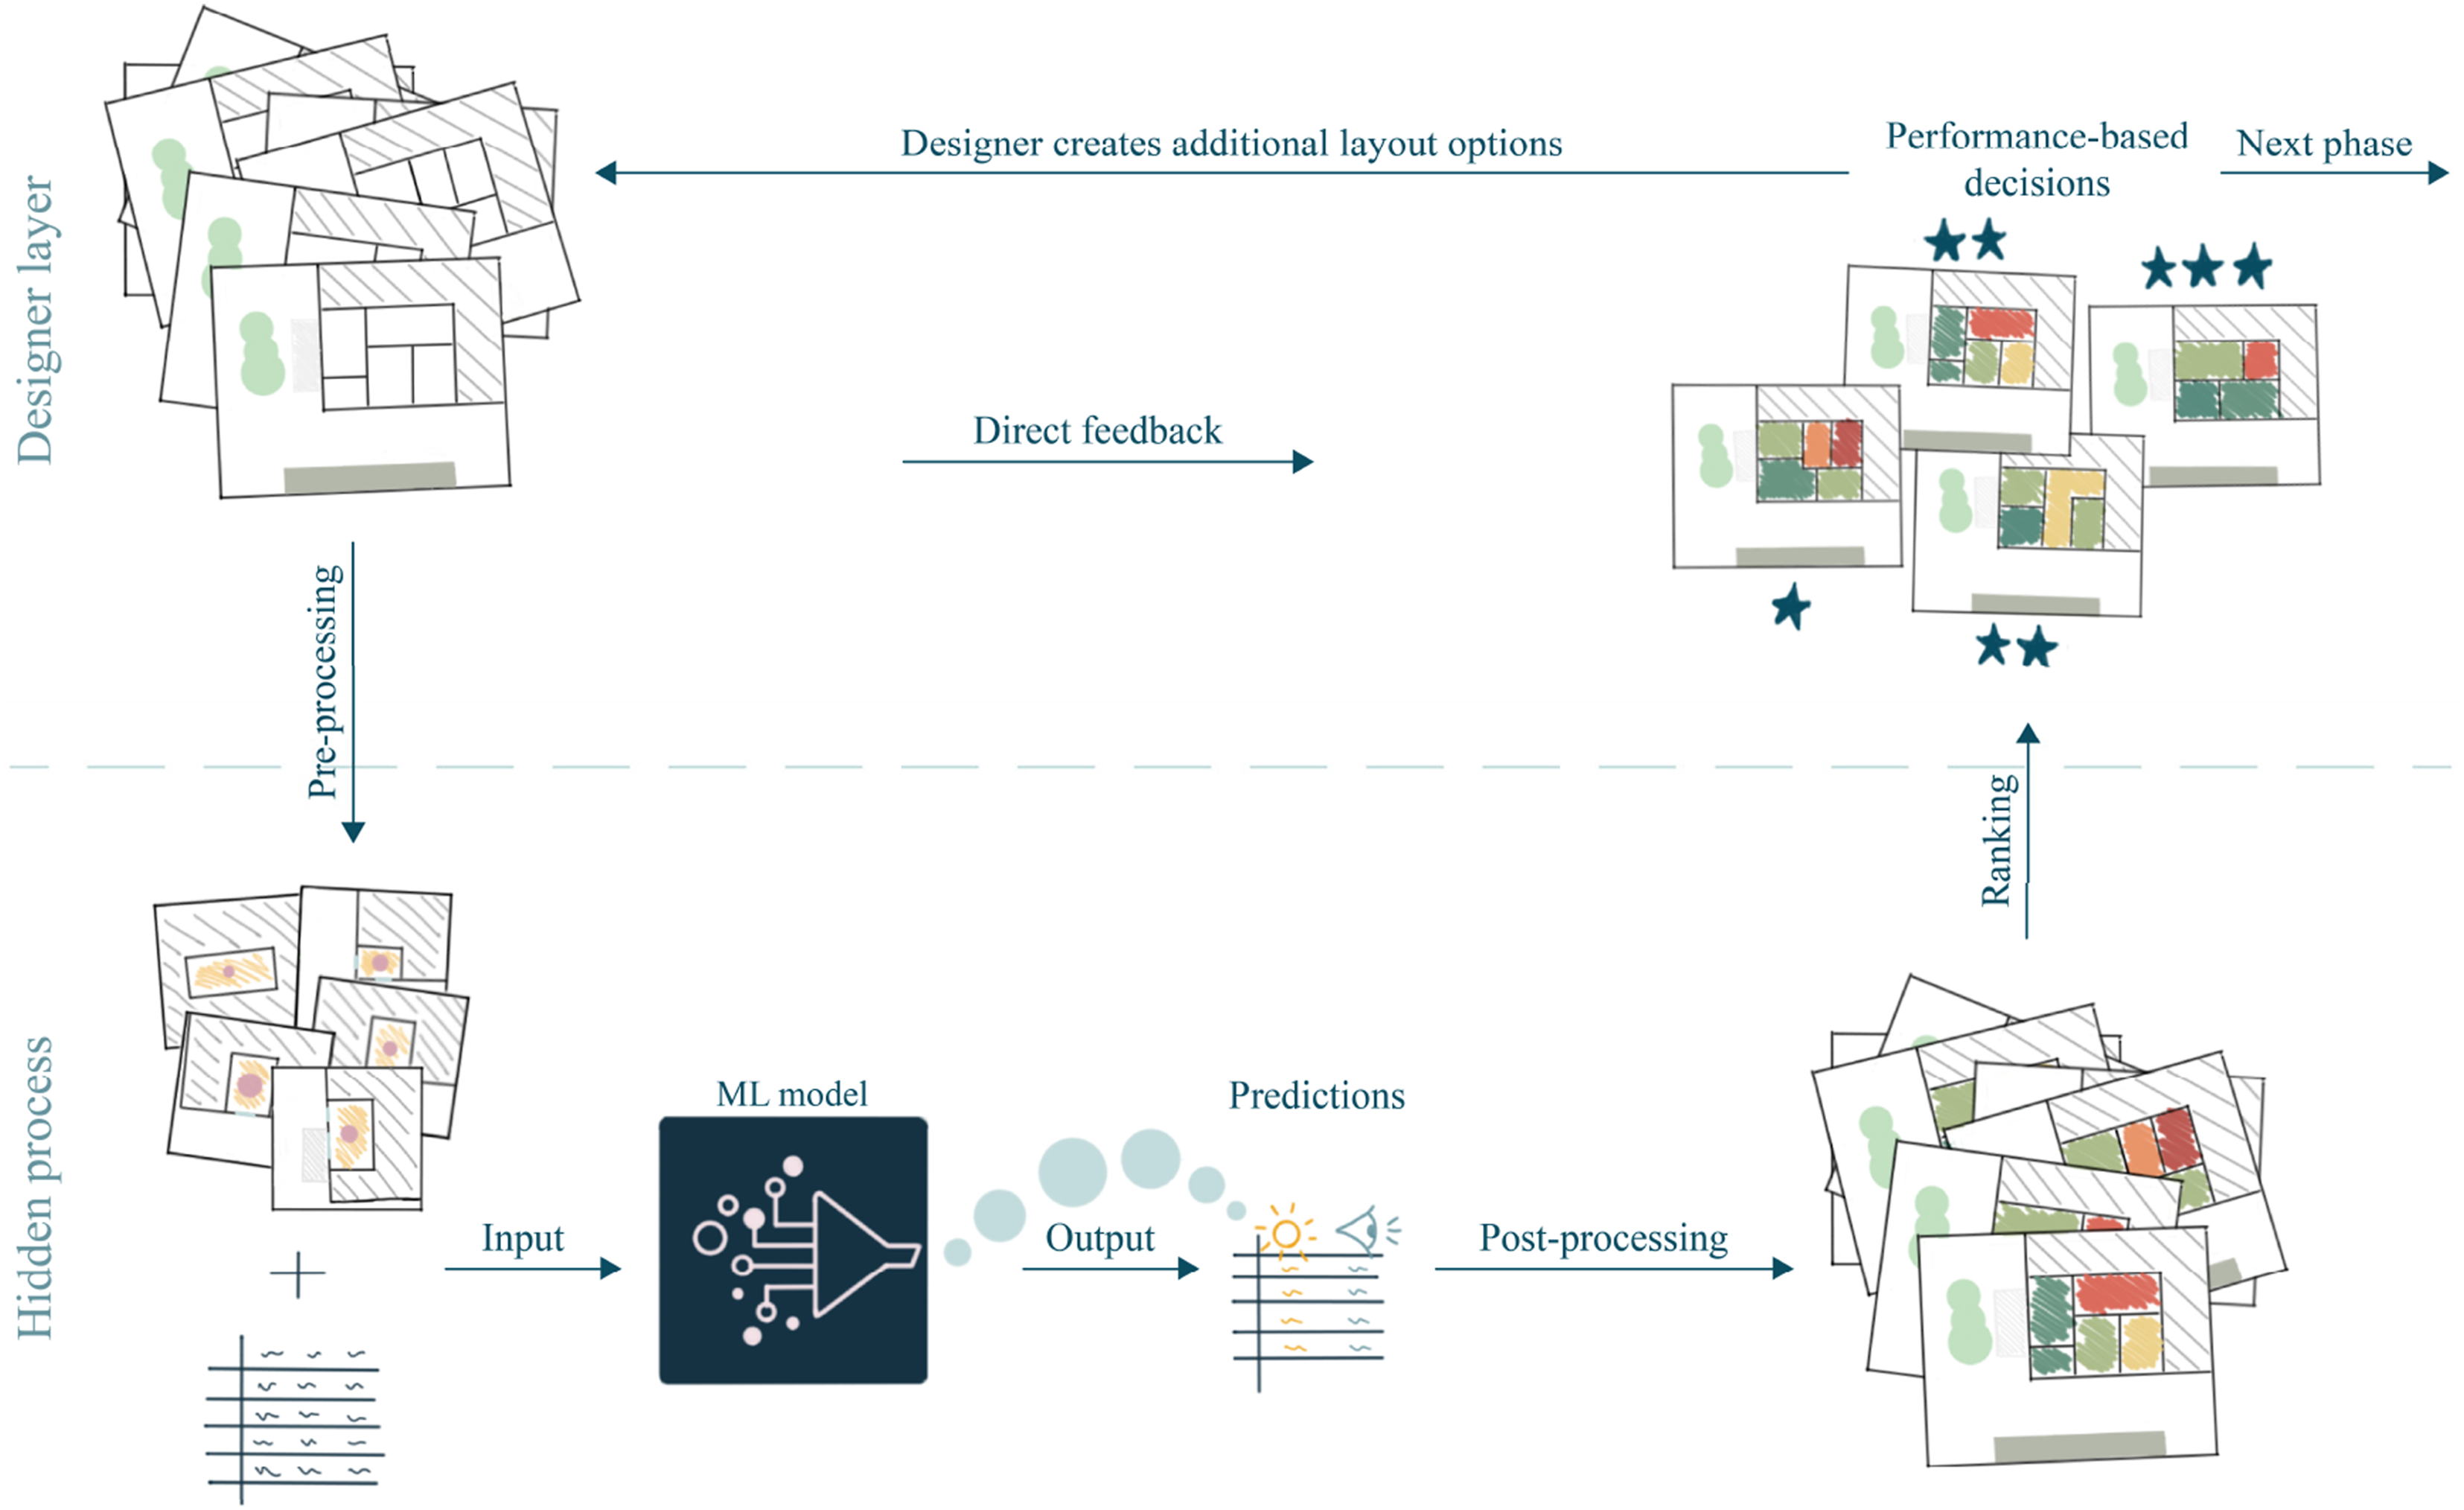
The assessment workflow begins with the layout design alternatives as images provided by the designer, which are the inputs to the framework. Subsequently, the inputs are pre-processed by being converted into a machine-readable format. Using this data, the ML model predicts daylight provision and view quality of the design options. The post-processing step converts the predicted numerical outputs into a practical visual representation for designers to evaluate, which highlights the second round of the designer’s engagement. The post-processing step gives designers direct feedback on their design options, enabling them to investigate the performance indicators of different rooms and apartments in accordance with the guidelines. Next, a ranking procedure is employed to select the most favorable building layout. In this way, designers can choose which of the three aspects (i.e., daylight, view, and orientation) to concentrate on throughout this ranking process. This procedure would lead to design decisions driven by both ML model and the designer.
Data and parameters
The dataset used for this study is Swiss Dwellings v3.0.0, which is a large dataset of apartment models including aggregated geolocation-based simulation results covering viewshed, daylight, traffic noise, centrality, and geometric analysis within the context of Switzerland. 37 In this study, 45k apartment samples in approximately 3k apartment buildings are used as the initial dataset. Besides the geometrical data, the corresponding simulation dataset provides data per room on the apartments’ visual, acoustic, solar, layout, and connectivity-related characteristics. To conform to the purpose of this study, only selected data on geometry, daylight, and view values were considered.
In this study, three daylight and two view metrics (i.e., labels in the ML-based workflow) were utilized. Daylight labels include illuminance values simulated for 12:00 on three different days: 21 March, 21 June, and 21 December. View labels include views to the ground and the sky. The simulation data for daylight and view contains several percentile values, such as the minimum, maximum, mean, median, the 20th percentile, and the 80th percentile. As the labels for daylight and view, the p50 and p80 values for illuminance and view factors were selected, respectively, for the purpose of matching the EN 17037 standard guideline. In this way, the median (i.e., p50) of the daylight values complies with the target illuminance over 50% of the space, and the p80 value for the view labels adheres to the presence of a view layer in 75% of a space according to the standard.
As the input features of the ML model, one image alongside two numerical values are introduced. The numerical features (i.e., window-to-floor ratio and elevation) contain essential information influencing the daylight and view labels, which are more effectively represented as numbers rather than in an image. The image feature represents one room in the dataset and contains six embedded features with information about the room depth ratio, room area, room orientation, window placement, as well as the surrounding environmental features (Figure 2). More specifically, the context of the intended room is distinguished by color-coded outdoor space, as well as overlaying portions of a pie-shaped geometry indicating the visibility of the urban and nature view layers. Samples of the input room image representing the visual features indicating room geometry and its context.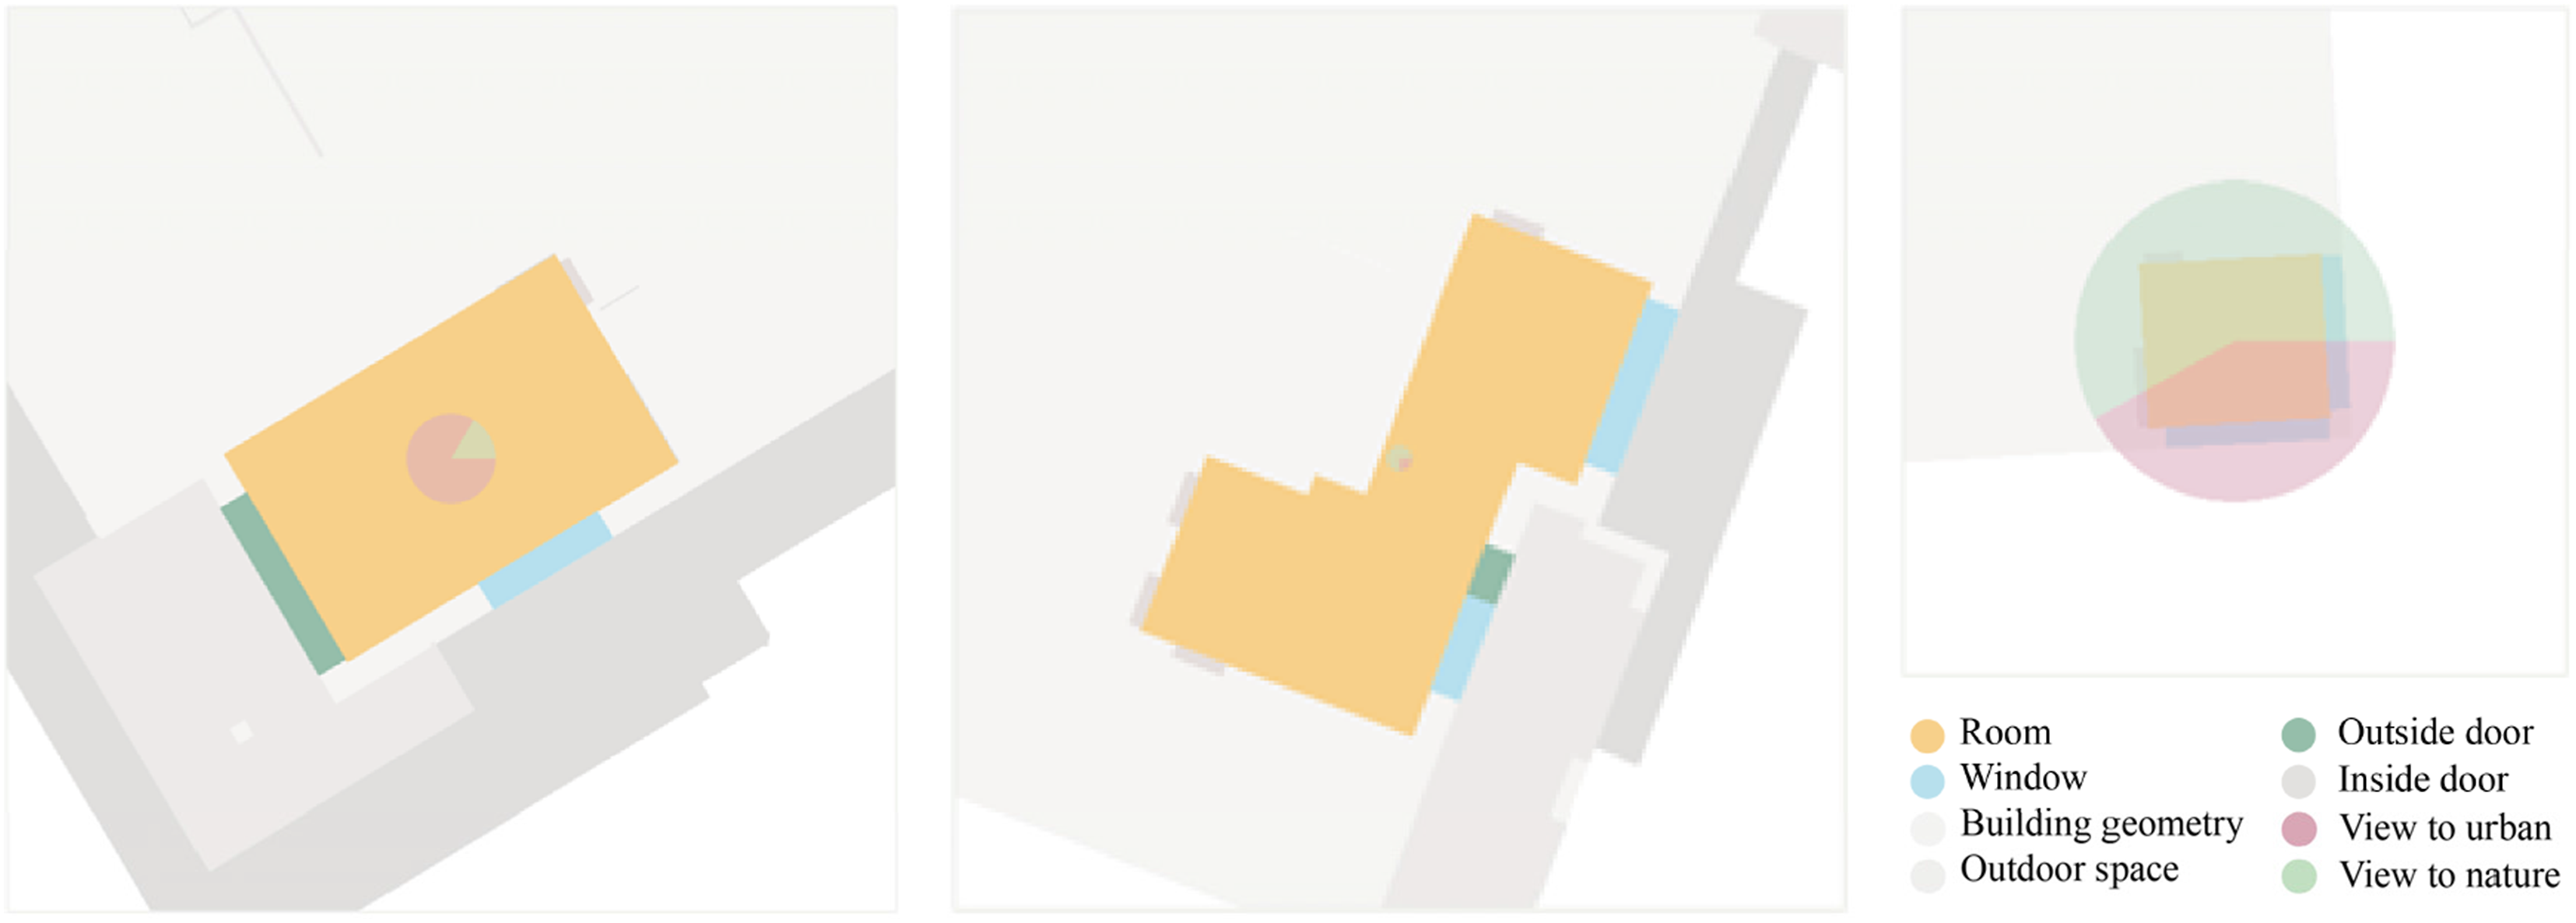
The intended layouts to be used for this research were selected through a step-wise data cleaning procedure, which can be ordered as follows: (1) As this study focuses solely on visual comfort in indoor environments, the spaces were limited to certain room types (e.g., living room, dining room, kitchen, bedroom, and studio), and therefore outside spaces (e.g., balconies, loggias, and winter gardens) were omitted. (2) Multistorey apartment units were removed from the dataset, as they accounted for a relatively small proportion of the whole dataset. (3) Layouts with inconsistent geometries, such as apartments with shared windows between the rooms were removed. (4) Rooms with missing or incomplete values for either view factors or daylight levels were disregarded, so that the final dataset would be consistent in the sense of data availability. (5) Apartments with outlier data for either of the five labels (i.e., three daylight metrics and two view metrics) were eliminated to ensure consistency. As a result, the cleaned dataset consists of roughly 140k rooms across almost 35k apartments.
For the following steps of training, validating, and testing the model, 55k rooms within 14k apartment layouts were selected from the full clean dataset using a randomizer to ensure the same distribution and conformity. From the cleaned dataset, 64% formed the training set, 16% for validation, and 20% for the initial testing phase. Two rounds of testing the trained model were conducted in this study using two distinct testing sets: first, an initial testing set as a result of random selection from the whole dataset. Second, a secondary testing set was collected from rooms in totally different sites that do not exist in the training and validation sets. More specifically, the secondary testing set is a portion of the dataset with approximately 2300 rooms located in 33 sites, which were initially separated with the purpose of avoiding the model from recalling specific layouts. The secondary test set introduces a wider variety of floor plans than the initial test set. Therefore, the secondary test set evaluates the model’s ability to extrapolate to larger data sets. Consequently, a slightly worse performance on the secondary test set is expected as it involves new data. Subsequently, to make the features and labels more reasonably comparable and equally important, the numerical features and labels were normalized in the range [0,1].
In the second phase of evaluating the performance of the trained ML model, aside from the secondary test set of 2300 rooms, two additional categories were created from the secondary testing set: standard apartment types and uncommon apartment geometries (Figure 3). Three standard apartment types were selected from the most repeated layouts across the buildings in the secondary test set, forming a total of 30 apartments with 149 rooms in total. Three geometrically uncommon sites were selected, featuring round facades, sharp-angled edges, or non-rectangular rooms, including 27 apartments, comprising a total of 91 rooms. A general apartment in the secondary test set and two representative apartment categories (from left to right: general, standard, and uncommon).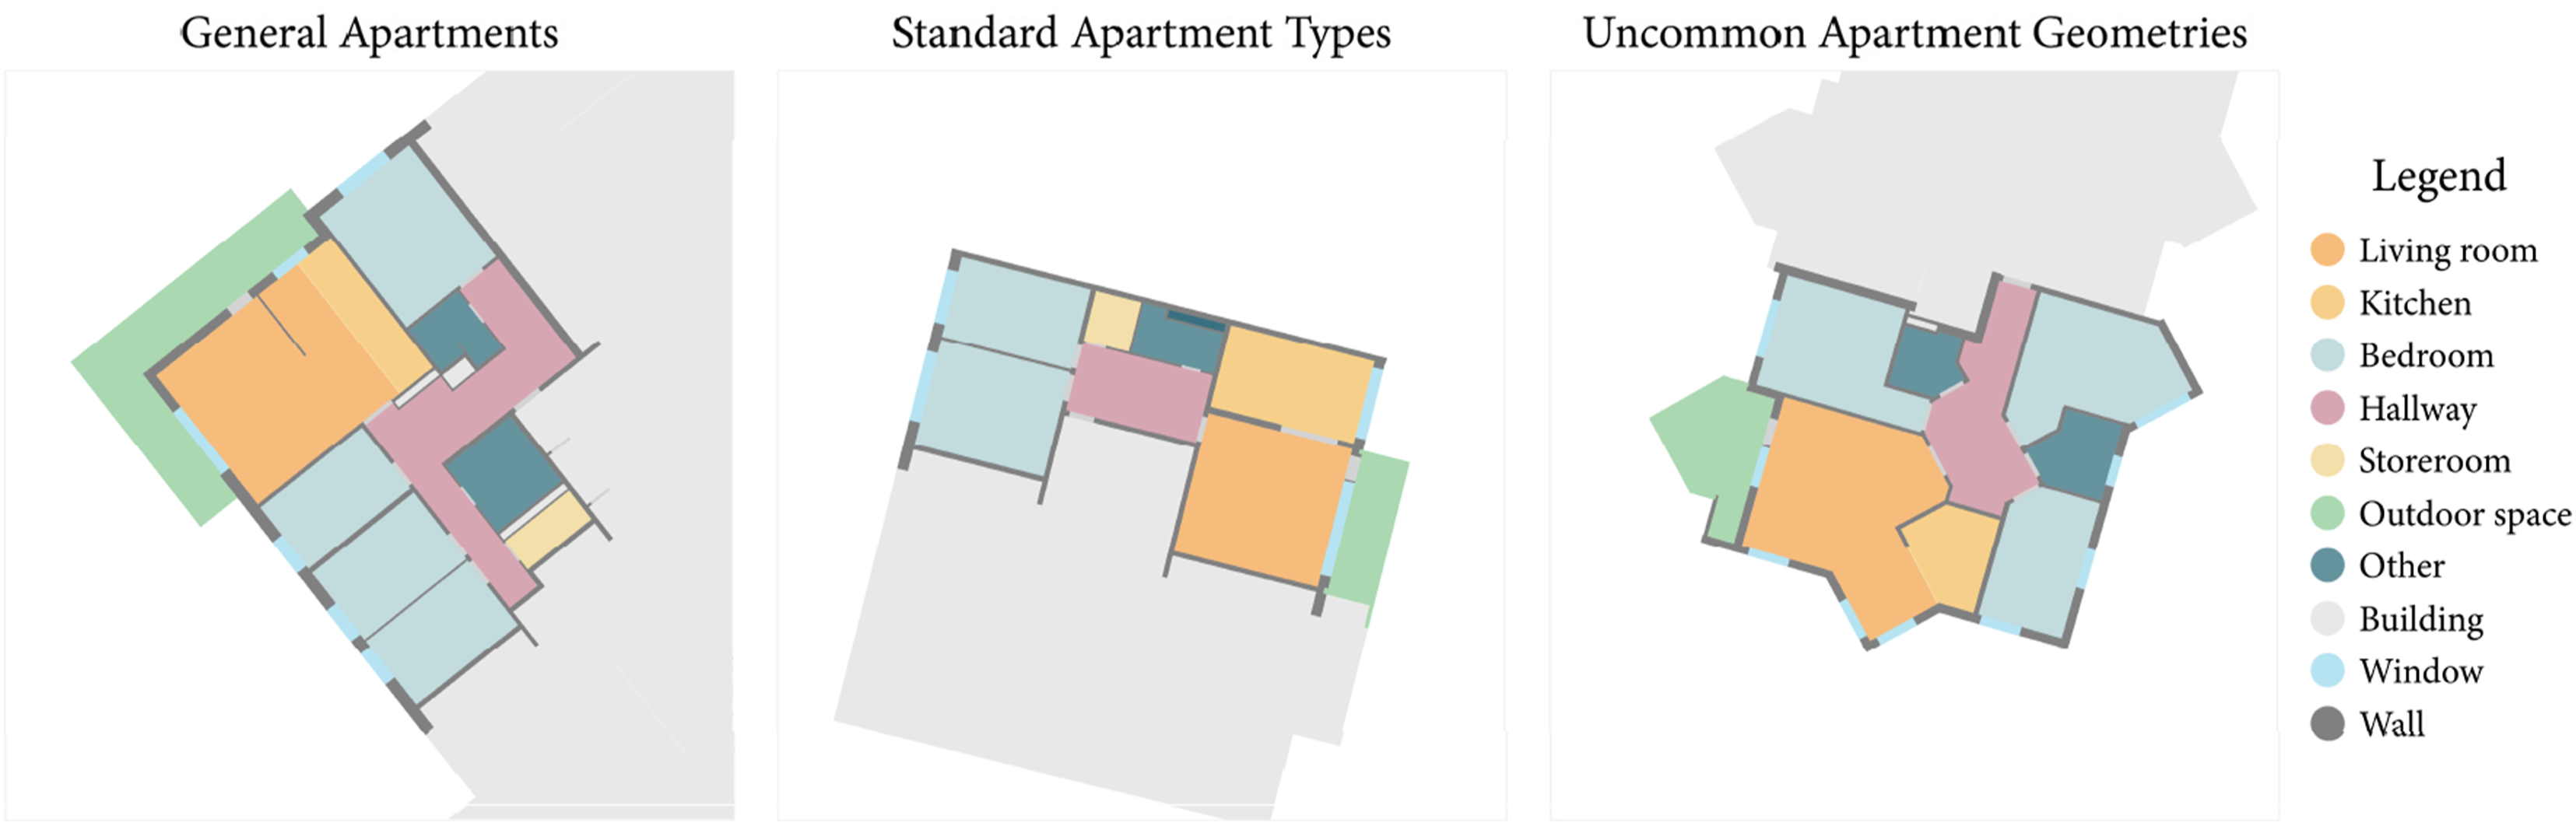
ML network architecture
With the aim of facilitating the training process of deeper neural networks, a residual learning framework called ResNet was introduced in 2016 with outstanding results in image recognition task.
28
In this study, the proposed network architecture consists of a multimodal model combining a ResNet50 and a fully connected network for using both image and numerical data to predict illuminance and view metrics in indoor residential spaces (Figure 4). To be able to measure the effectiveness of the multimodal approach, a baseline unimodal framework using ResNet50 was set up, predicting the daylight and view labels solely based on the input image features. In this way, subsequent models could be compared against the baseline. Subsequently, the proposed multimodal network architecture was trained twice, altering the ResNet50 model
38
pre-trained on ImageNet and a ResNet50 model trained on the multimodal input of the Swiss Dwellings dataset from scratch. Although the trained model outperformed the pre-trained one, both models still exceeded the performance of the baseline unimodal setting. Therefore, the experiments continued with the focus on fine-tuning the multimodal setting, using both image and numerical input features. The multimodal network architecture consisting of ResNet50 and fully connected layers.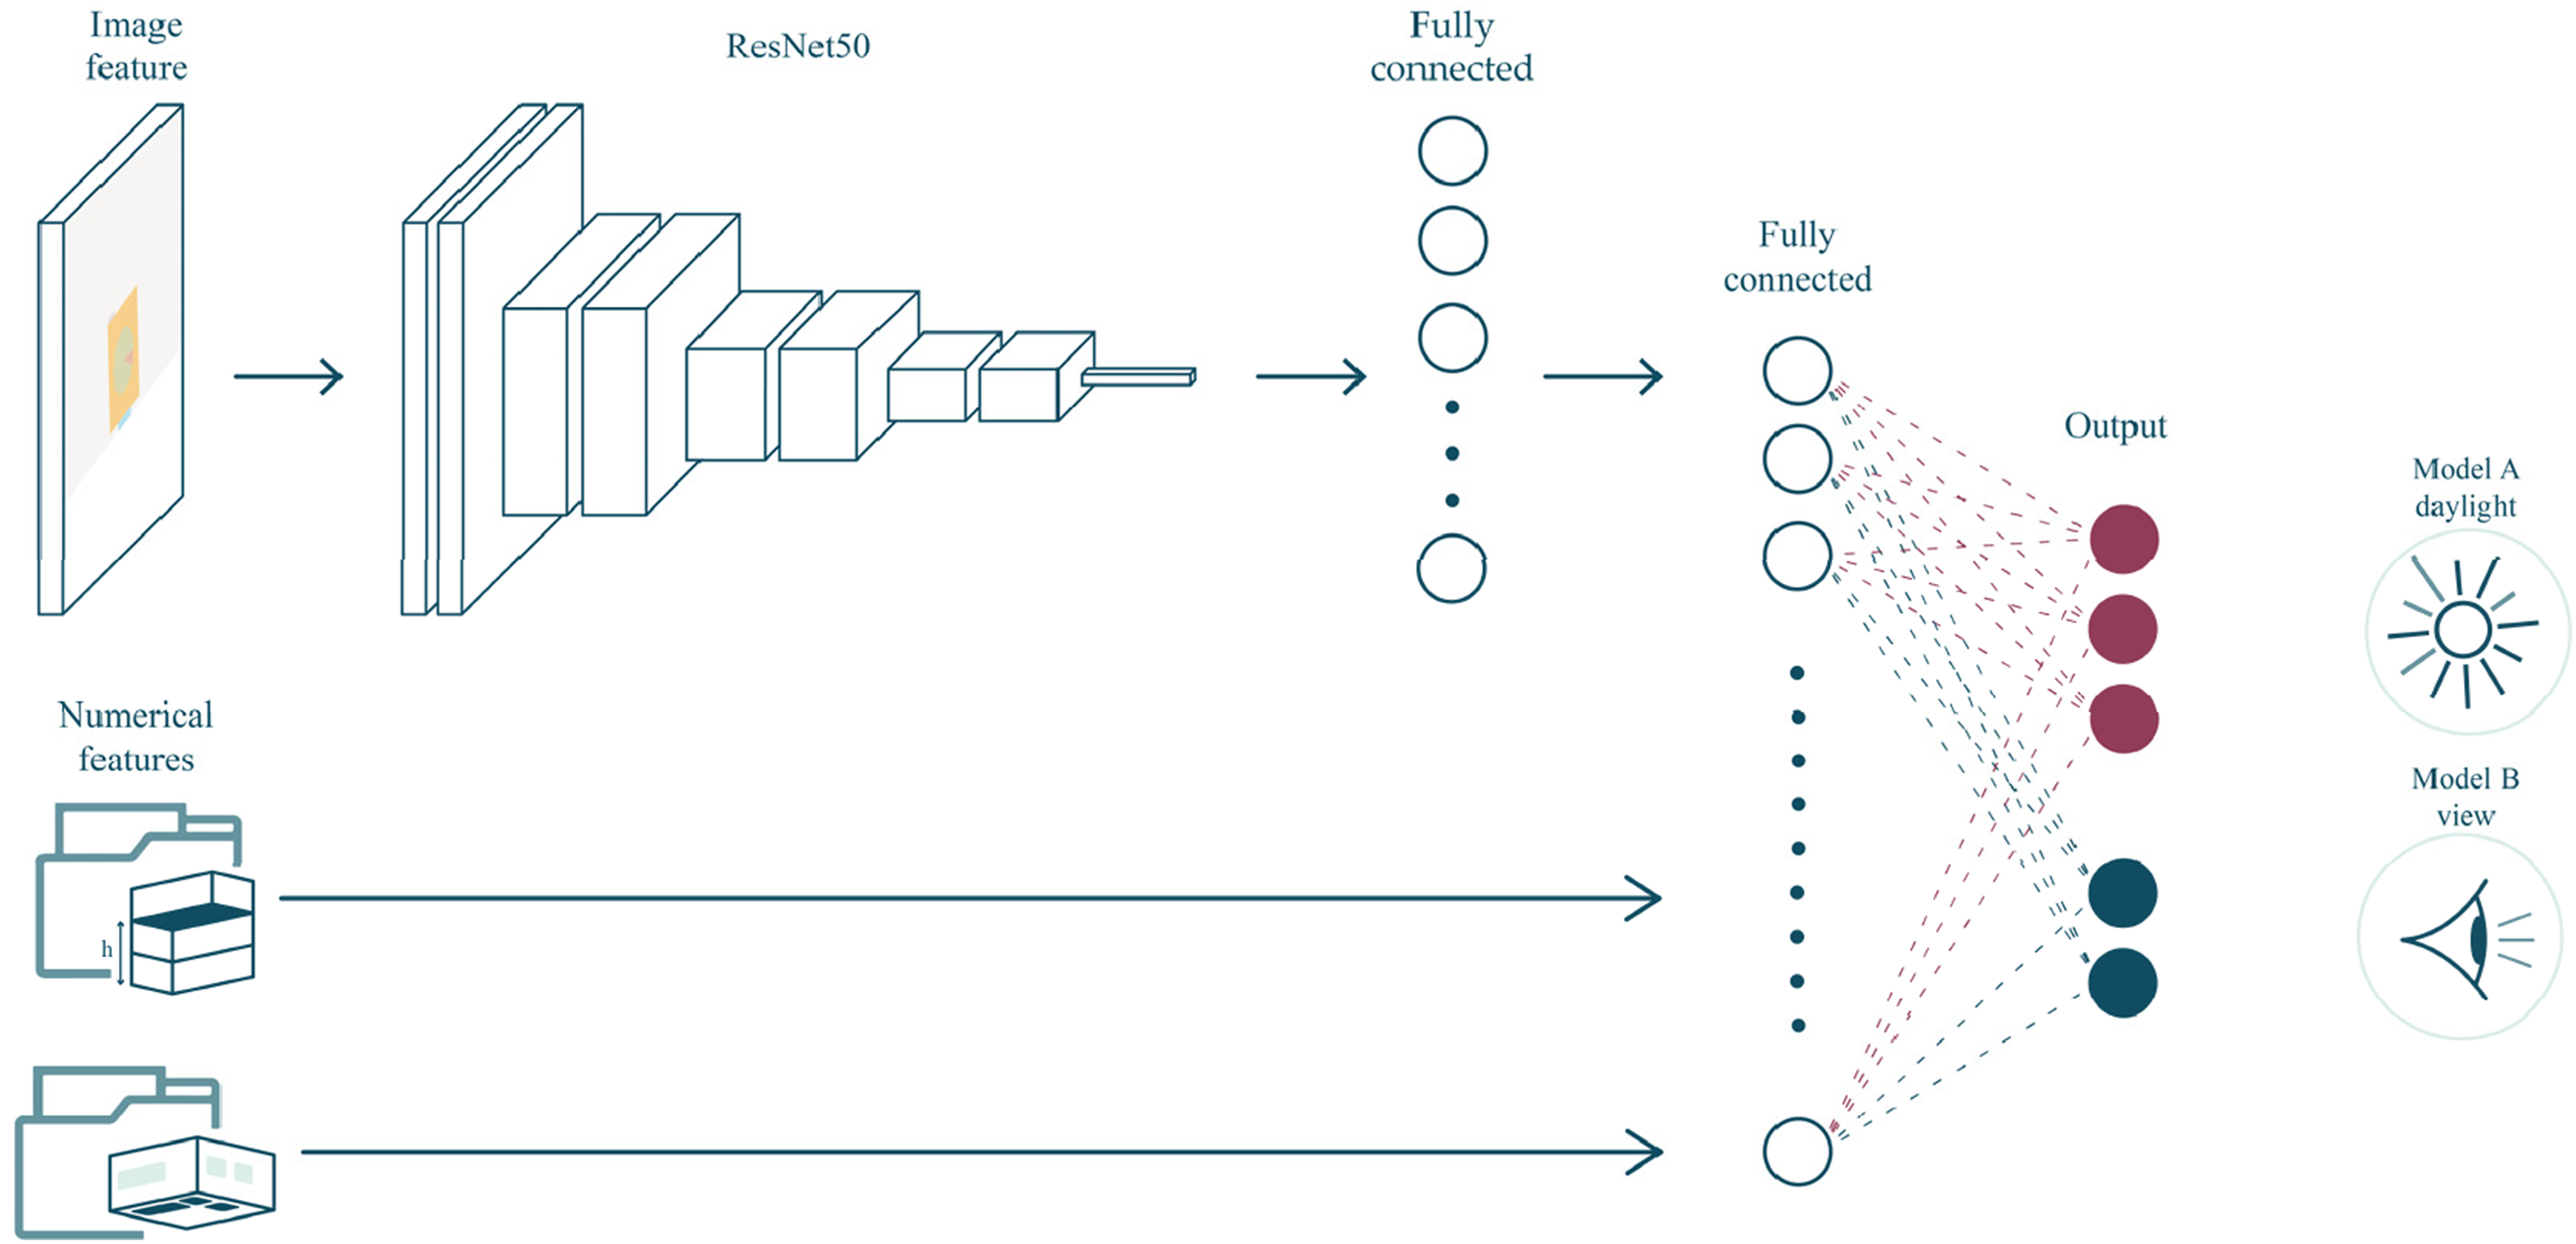
Further adjustments were performed on the network architecture and data to reach a fine-tuned multimodal setting. In the first experiment, the model was split into two sub-models, each of which dedicated to the prediction of either daylight or view metrics. The results proved this strategy to be effective, demonstrating more accurate daylight and view predictions. Further fine-tuning of the model architecture continued by adjusting the architectural layers, the fusing stage of the image features with the numerical features, and experiments on different ResNet50 base models. As a result, it was indicated that the last model with hybrid fusion and a lower regularization rate would improve the performance of the ML model. Ultimately, the hyperparameters of the best-performing model were fine-tuned.
The fine-tuned model was trained to learn from two input data streams: one image feature and two numerical features, utilizing hybrid fusion to concatenate the different feature types. After the extraction of image features by the ResNet50 model, the first fully connected layer was added to make the spatial information converge into a one-dimensional feature vector. Next, the numerical features were concatenated to the extracted features resulting from the first fully connected layer. Subsequently, a second fully connected layer was added to make a link to the output layer, a dense layer with either two or three output units and a linear activation function. The fine-tuned hyperparameters of the model resulted in a low dropout rate of 0.3 and a low L2 regularization rate of 0.0001. The Adam optimizer with an MSE loss function and a Mean Absolute Error (MAE) metric was also utilized. MSE is the average squared difference between estimated values and actual values, while MAE calculates the average absolute difference between predicted and simulated values. Moreover, a learning rate scheduler was built into the model with an initial value of 0.001 and gradually dropping over time. The limit of 200 epochs was set for training the model with a batch size of 64 and early stopping of 25 epochs to prevent overtraining.
Layout evaluation system and ranking
To comprehensively assess layout performance, a new layout evaluation system is introduced to quantify the daylight and view performance of entire apartments. Moreover, to optimize the layout design potential, an additional ranking system was included to evaluate the orientation of each room type in residential apartments. The orientation evaluation system systematically assesses room orientation quality for each room and subsequently evaluates apartment layout performance. The three aspects of daylight, view, and room orientation are combined to provide an overall quality assessment of the apartment layout.
Apartment label per performance metric requirements.
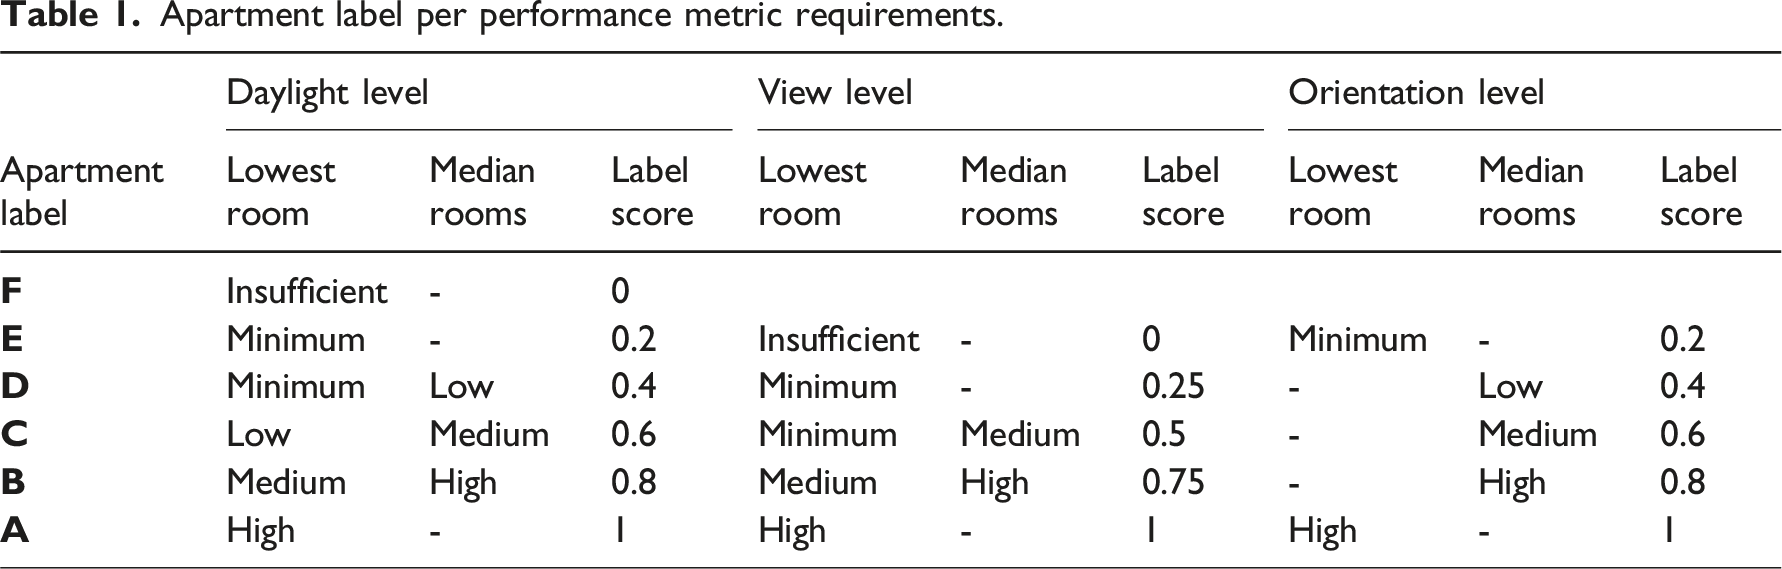
The overall apartment performance score considers the apartment performance label in each metric (i.e., daylight, view, orientation) using an average point system. Designers can adjust the weights of each of the metrics to comply with specific client needs or design specifications. In addition, a penalty score is introduced, which penalizes apartments containing one or more rooms classified as insufficient in terms of daylight and view according to the EN 17037 guideline’s minimum requirements. With the normalized apartment label scores, as shown in Table 1, an average equation with a penalty and optional weights calculates the overall apartment performance score:

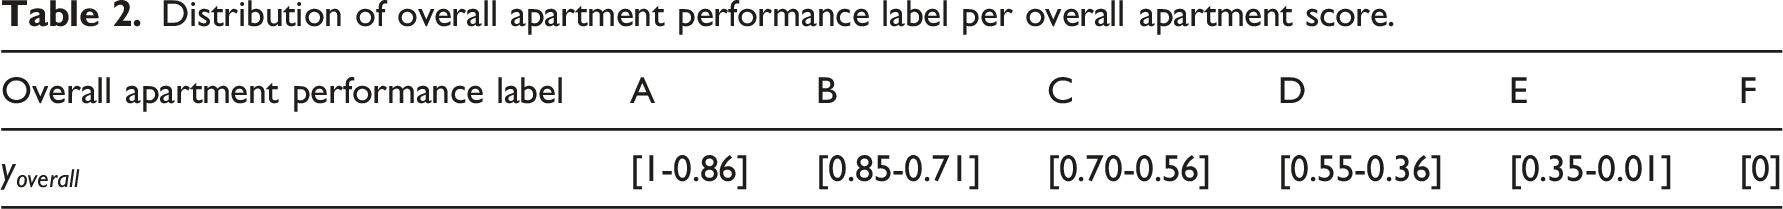
Distribution of overall apartment performance label per overall apartment score.
Results and discussion
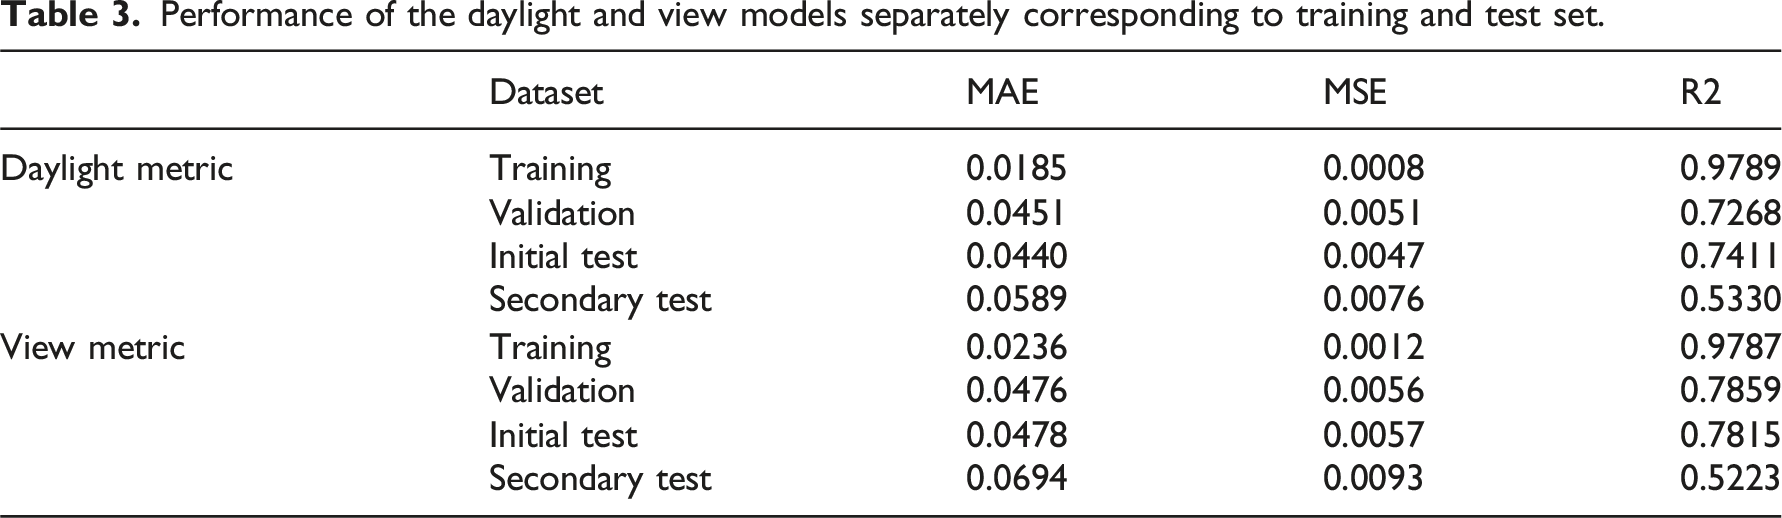
The multimodal model was trained twice, once for the three daylight metrics and once for the two view metrics, on the same training, validation, and initial test sets. The learning curves of the trained models are depicted in Figure 5. The MAE and MSE losses underwent a similar pattern for the two trained models, starting with a high initial value and then consistently decreasing. For both models, the validation MAE and validation loss decreased substantially but showed fluctuations until around 60 epochs, after which they stabilized and started to plateau. After no improvements in the validation loss for 25 epochs, the daylight and view models were both early terminated around 80 epochs. Learning curves of daylight and view models.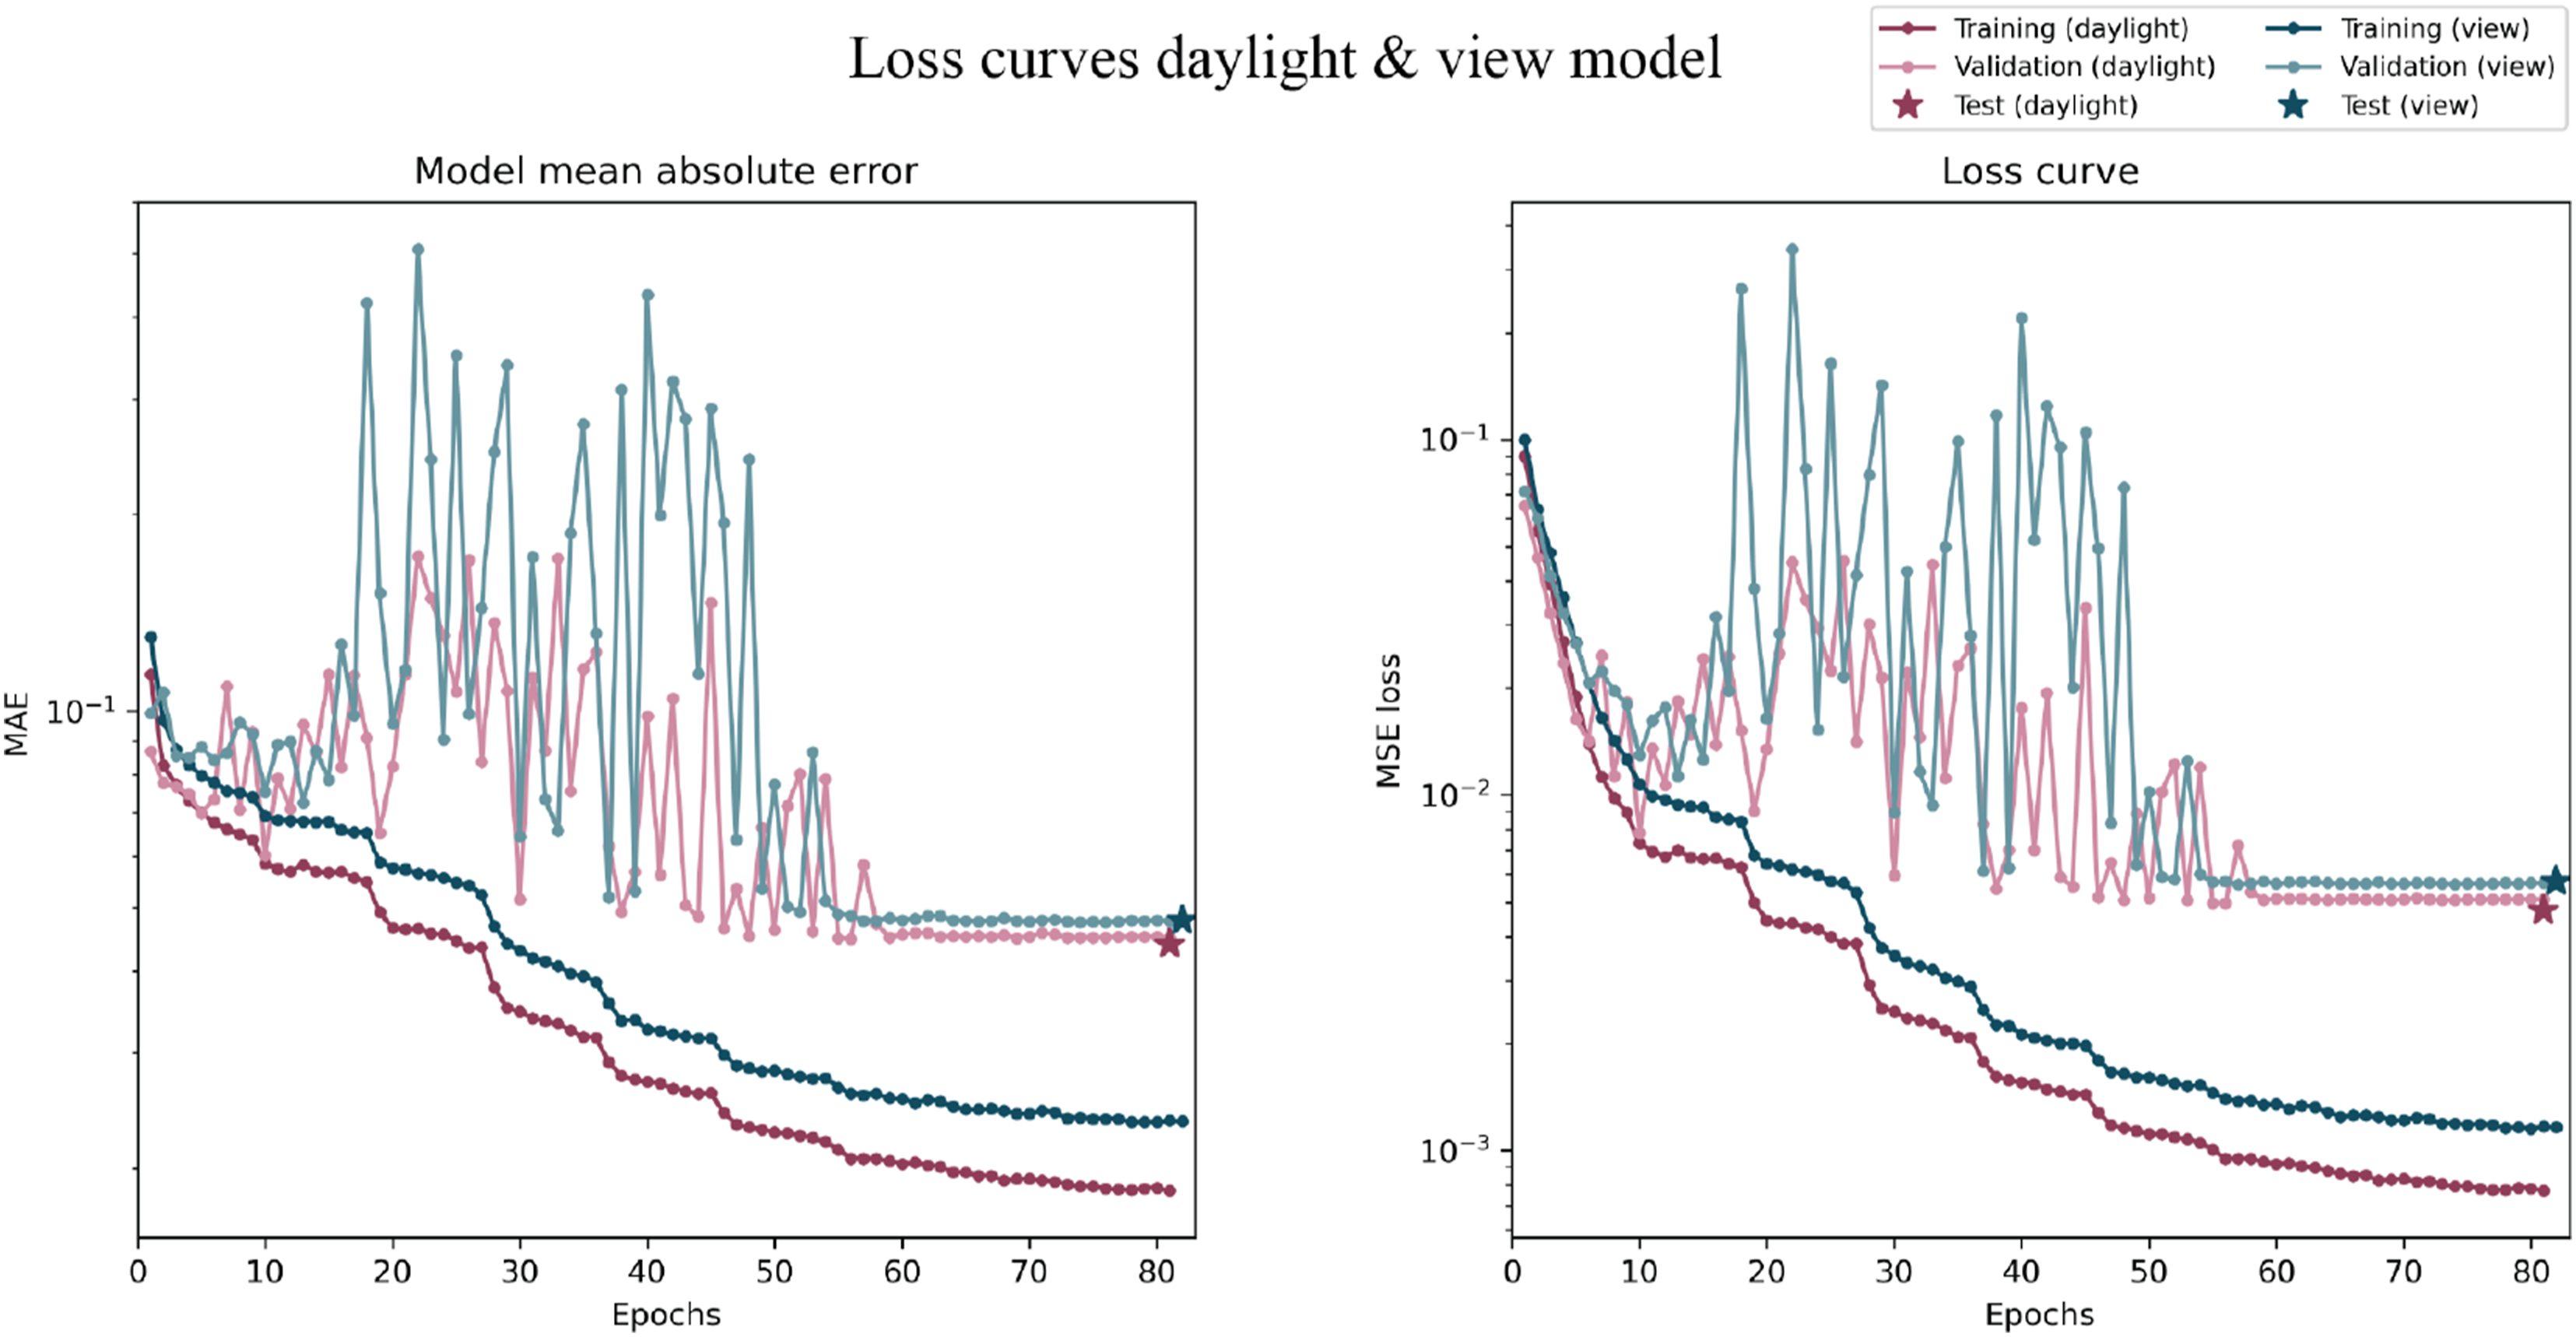
Performance of the daylight and view models separately corresponding to training and test set.
To evaluate if the model is able to make similar predictions for the same room type and handle uncommon data, three standard room types and three sites with uncommon geometries were selected from the secondary test set, respectively. Figure 6 shows a visual representation of the input image feature and the ML models’ predictions compared to the ground truth for the living rooms of the representative apartments for the secondary test set and the two evaluation categories, as shown in Figure 3. Predictions versus ground truth for daylight on the 21st of March and view to sky, for the living rooms of each category of the secondary test set.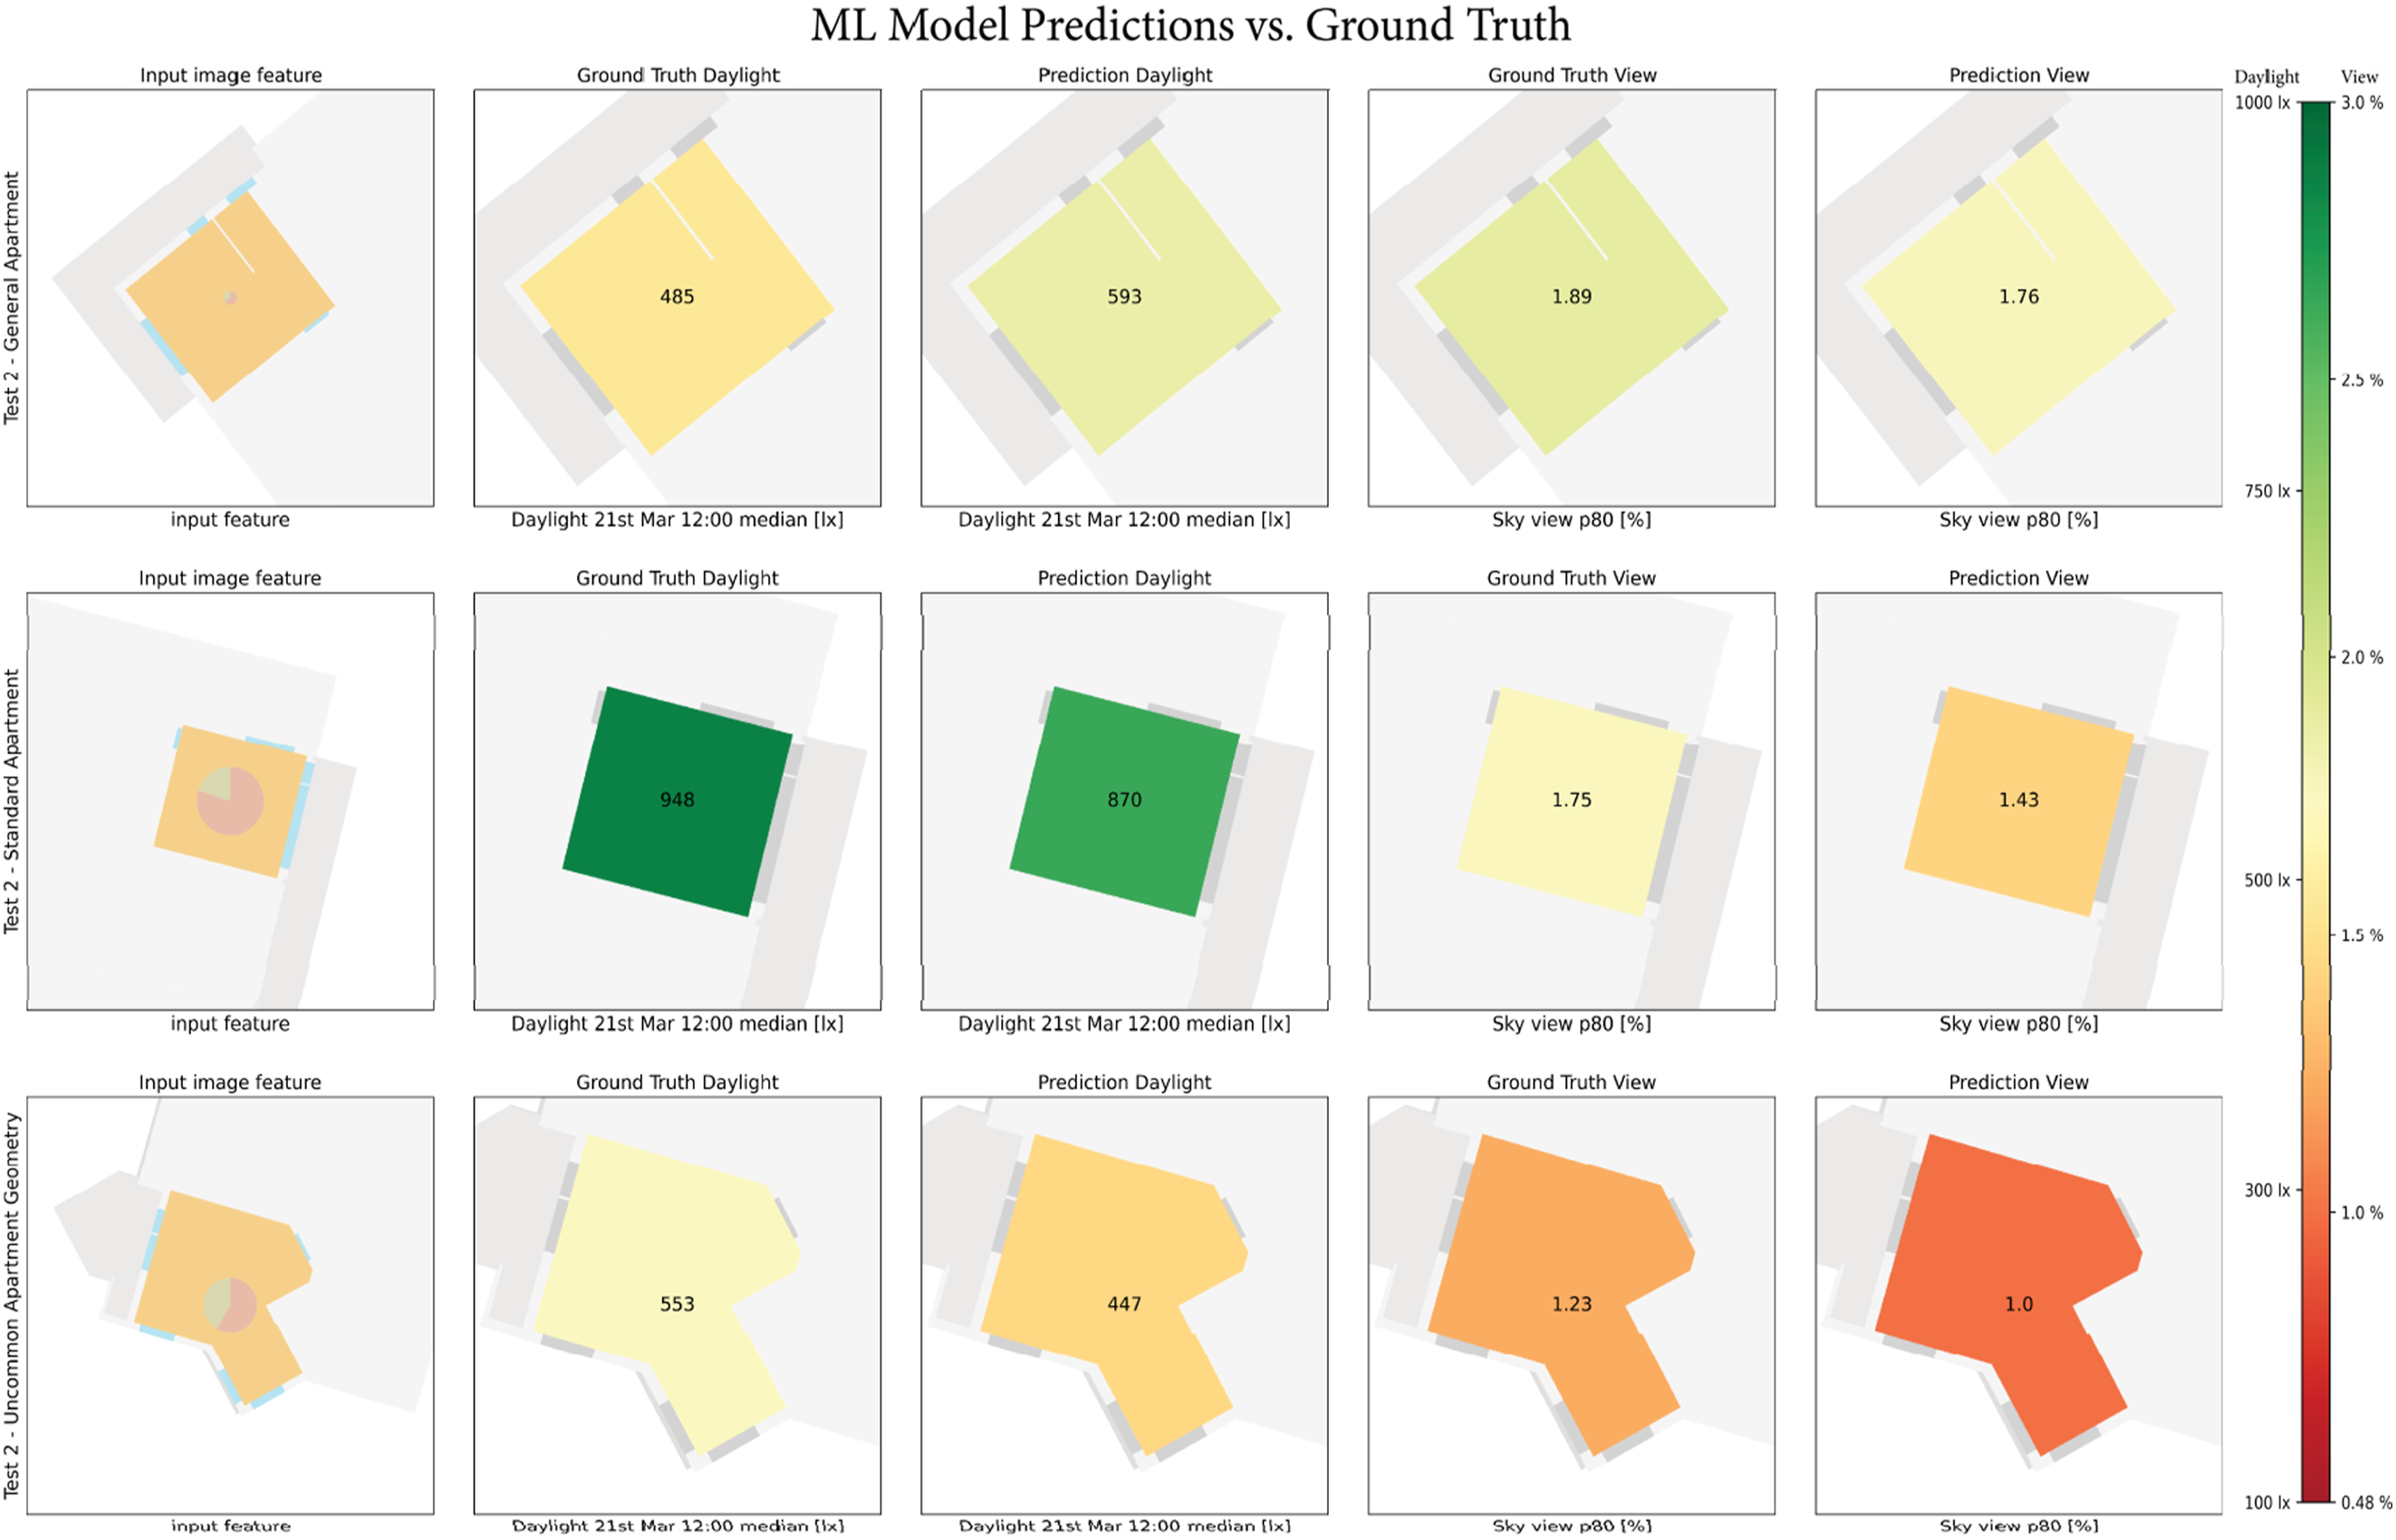
Daylight predictive model performance
The daylight predictions translated to the performance level per room compared to the ground truth, are illustrated for the total secondary test set and the two categories in Figure 7. The numbers in the matrix correspond to the room counts at each performance level, also color-coded in shades of red. While the predicted and true daylight values demonstrate a slight correlation for the standard apartment type category, the uncommon apartments resulted in the highest correlation among the secondary test set. Confusion matrix of model predictions translated to daylight performance label for the evaluation (a) total secondary test set, (b) standard apartment types, and (c) uncommon apartment geometries.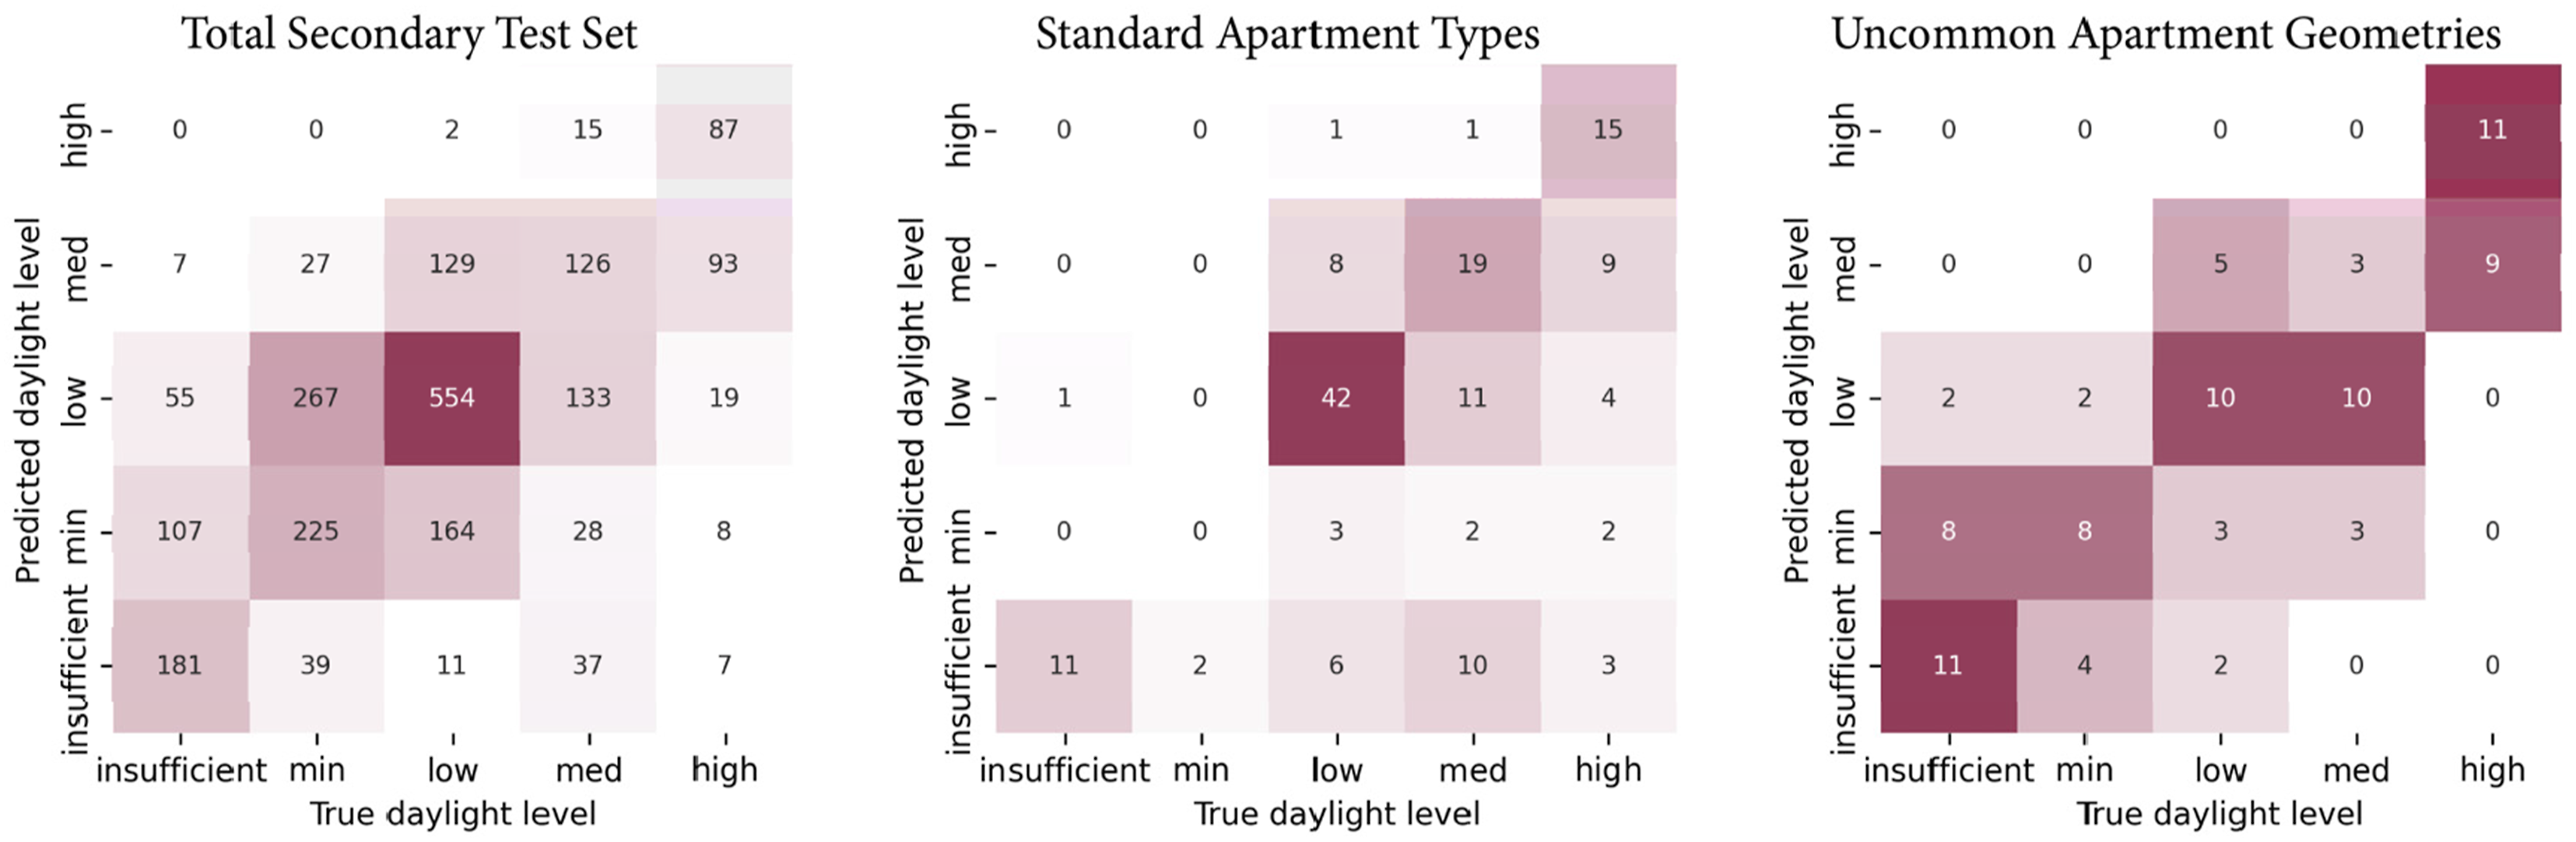
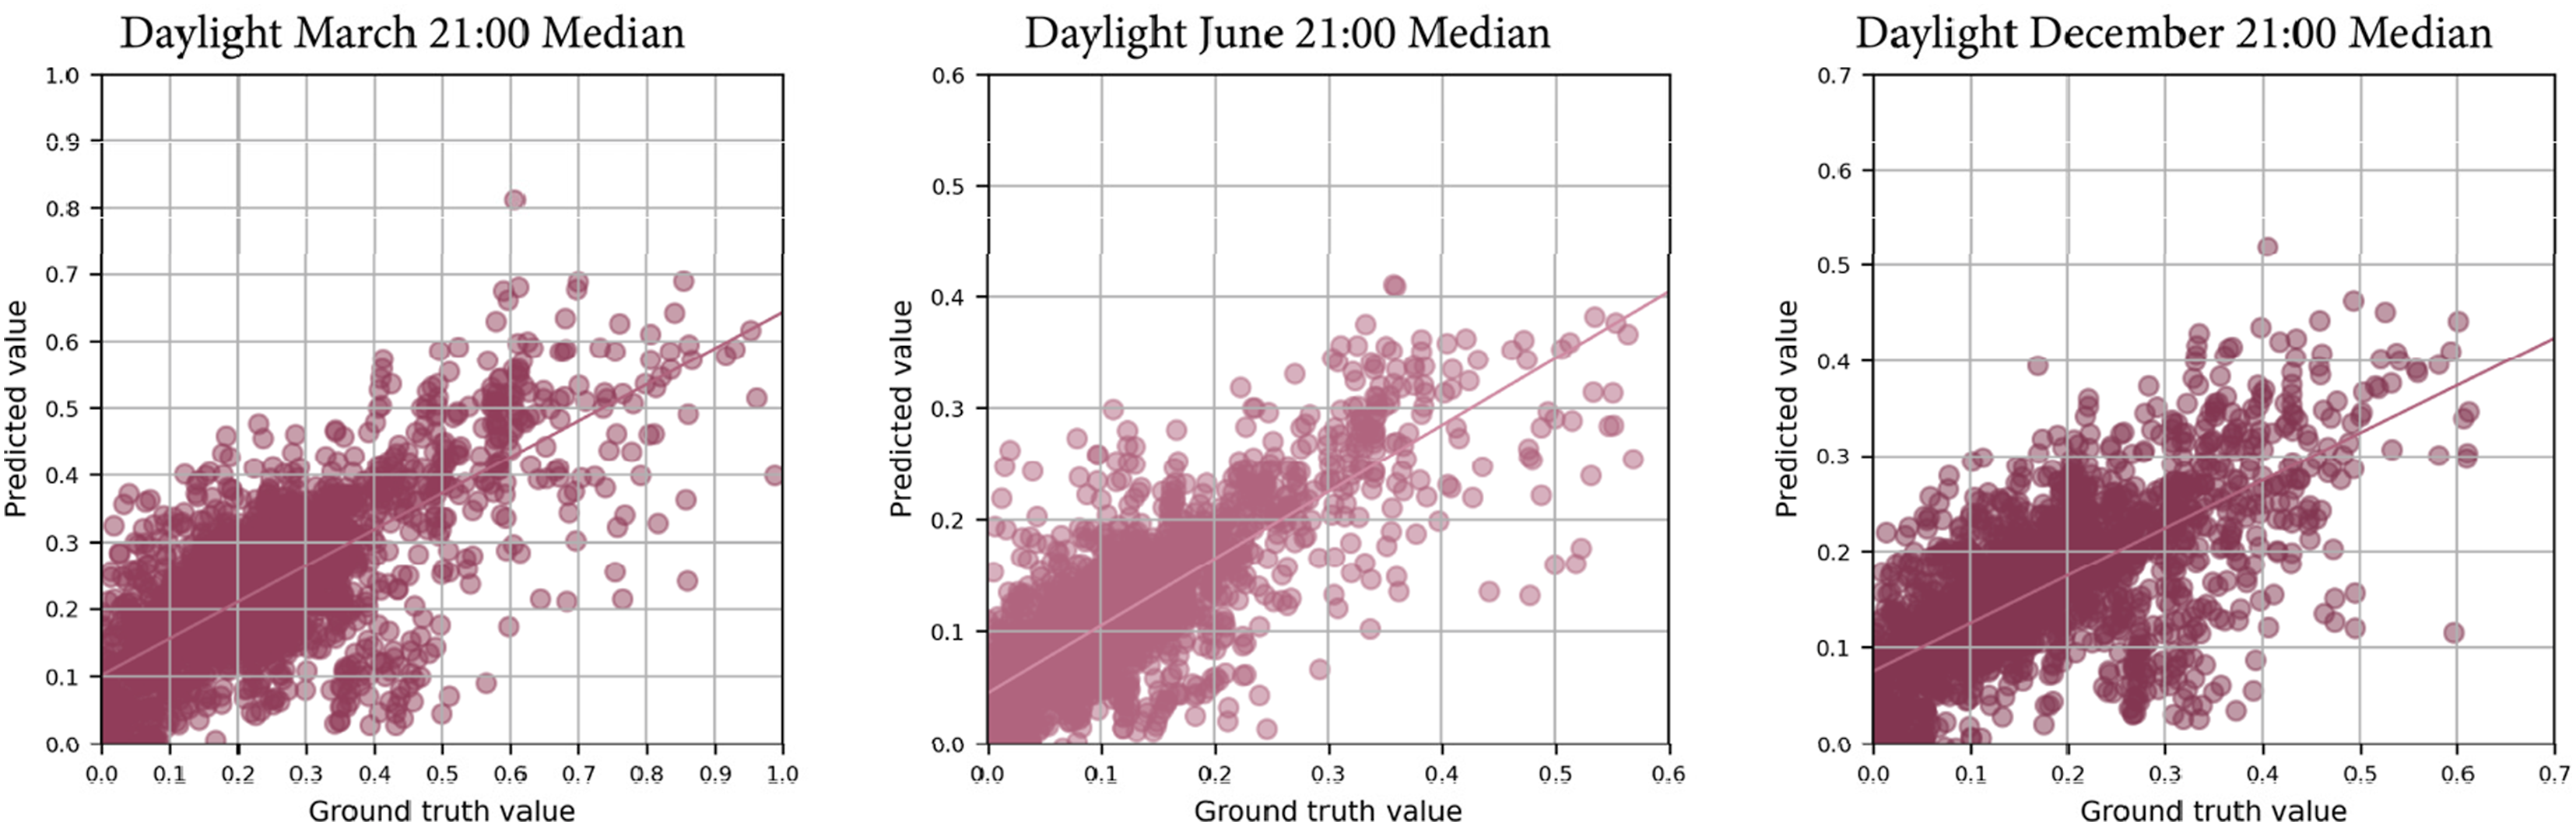
More specifically, the performance of the daylight predictive model on three selected days for the initial and secondary test set are illustrated in Figures 8 and 9, respectively. It is indicated that the predictions for the 21st of June are slightly more accurate than those for March and December for both test sets. Compared to the initial test, the secondary test set shows more underpredictions for all days. The daylight model slightly underpredicts the three daylight days, resulting in skewing the daylight performance levels towards lower classes in the broader ML design process framework. Similar diagrams are brought in the appendix for the standard apartments categorized by room types and for the apartments from sites with uncommon geometries. The results showed that the predicted daylight metric values are highly aligned with the true values for each room type (Figure a.1). This consistency in similar predictions for similar room types suggests that the ML model recognized geometrical patterns derived from the image feature. On the other hand, the daylight predictive model shows high variability predictions for the daylight metric values for most of the rooms in the uncommon apartment geometries category (Figure a.3). The performance of daylight predictive model on three selected days for the initial test set. The performance of daylight predictive model on three selected days for the secondary test set.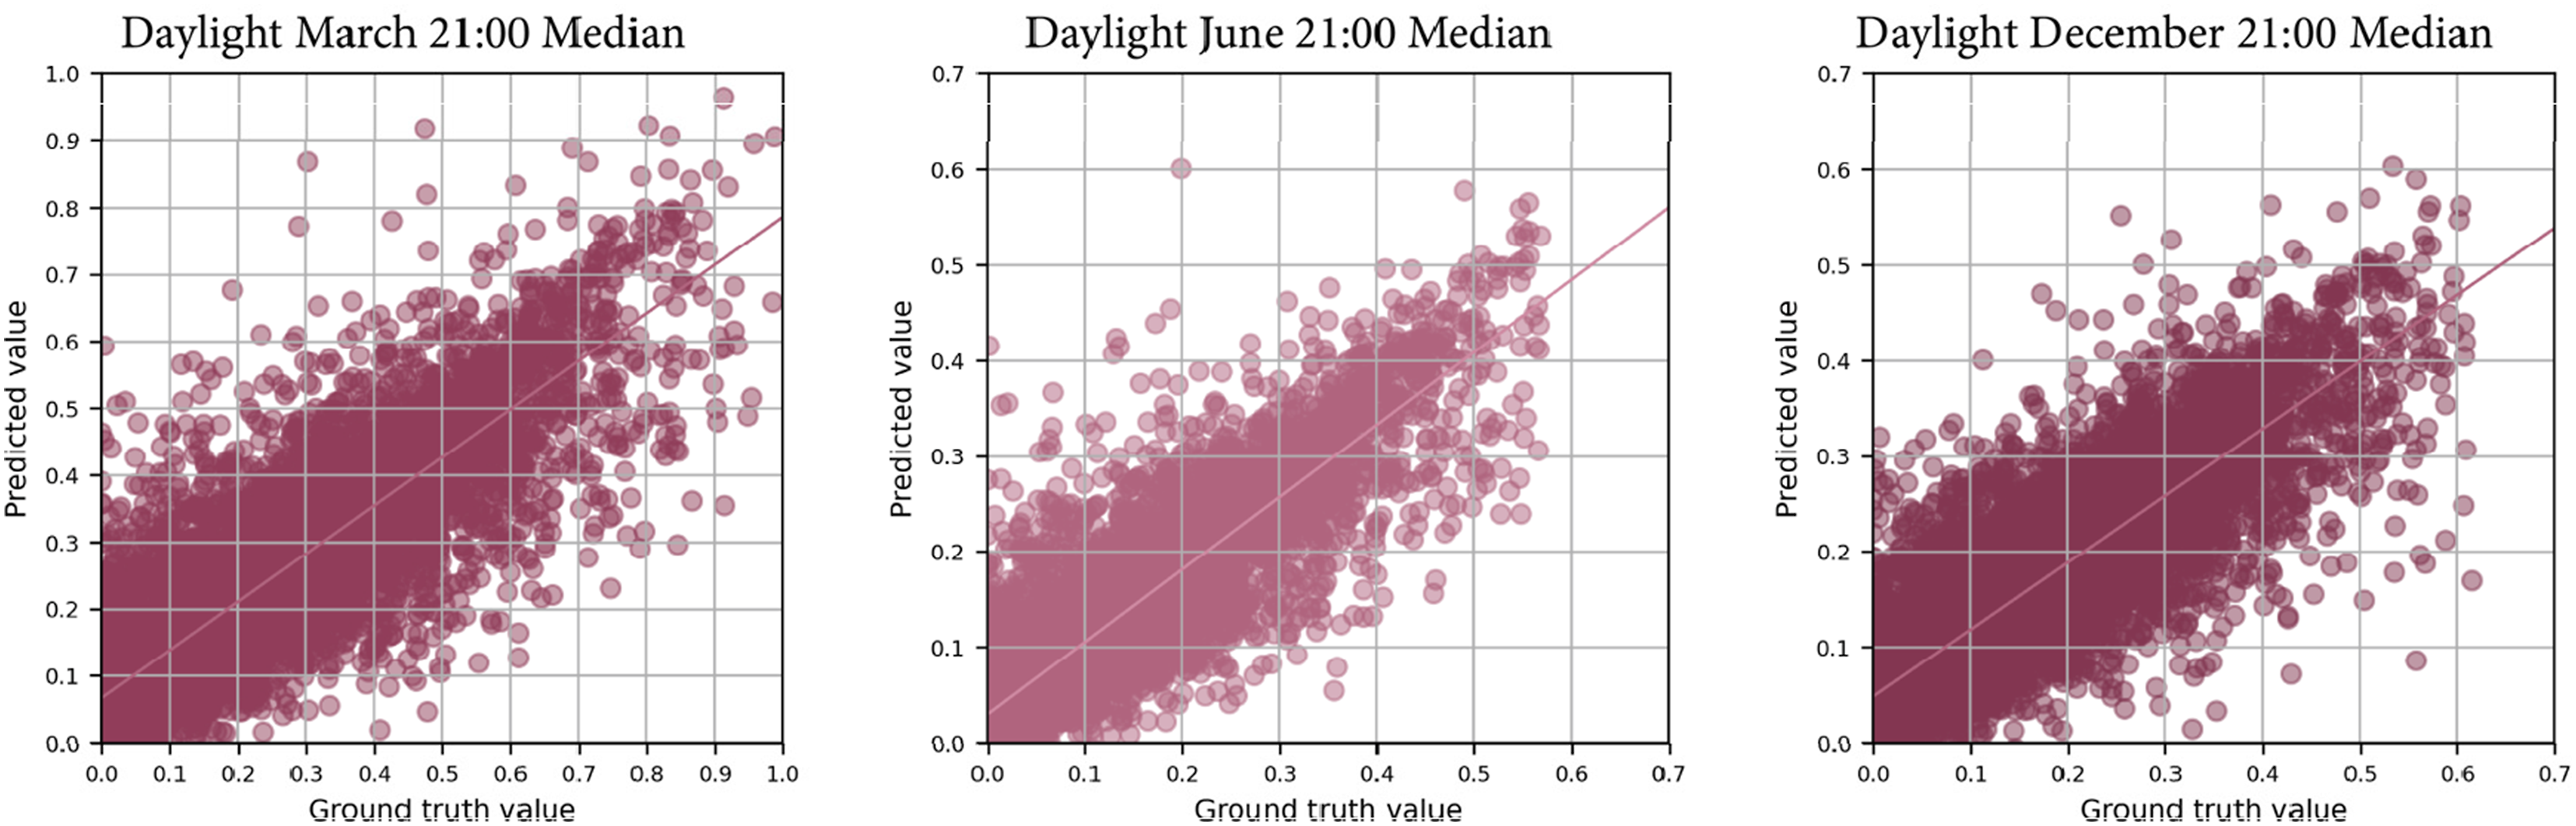
View predictive model performance
The view predictions translated to performance level per room and compared to the ground truth for the secondary test set and the two apartment categories are illustrated in Figure 10. The numbers in the matrix correspond to the room counts at each performance level, also color-coded in shades of blue. While the view predictive model shows a fair correlation for the uncommon apartment categories, the view metric values for a considerable number of data instances are not accurately predicted for the standard apartment type category. Confusion matrix of model predictions translated to view performance label for evaluation (a) total secondary test set, (b) standard apartment types, and (c) uncommon apartment geometries.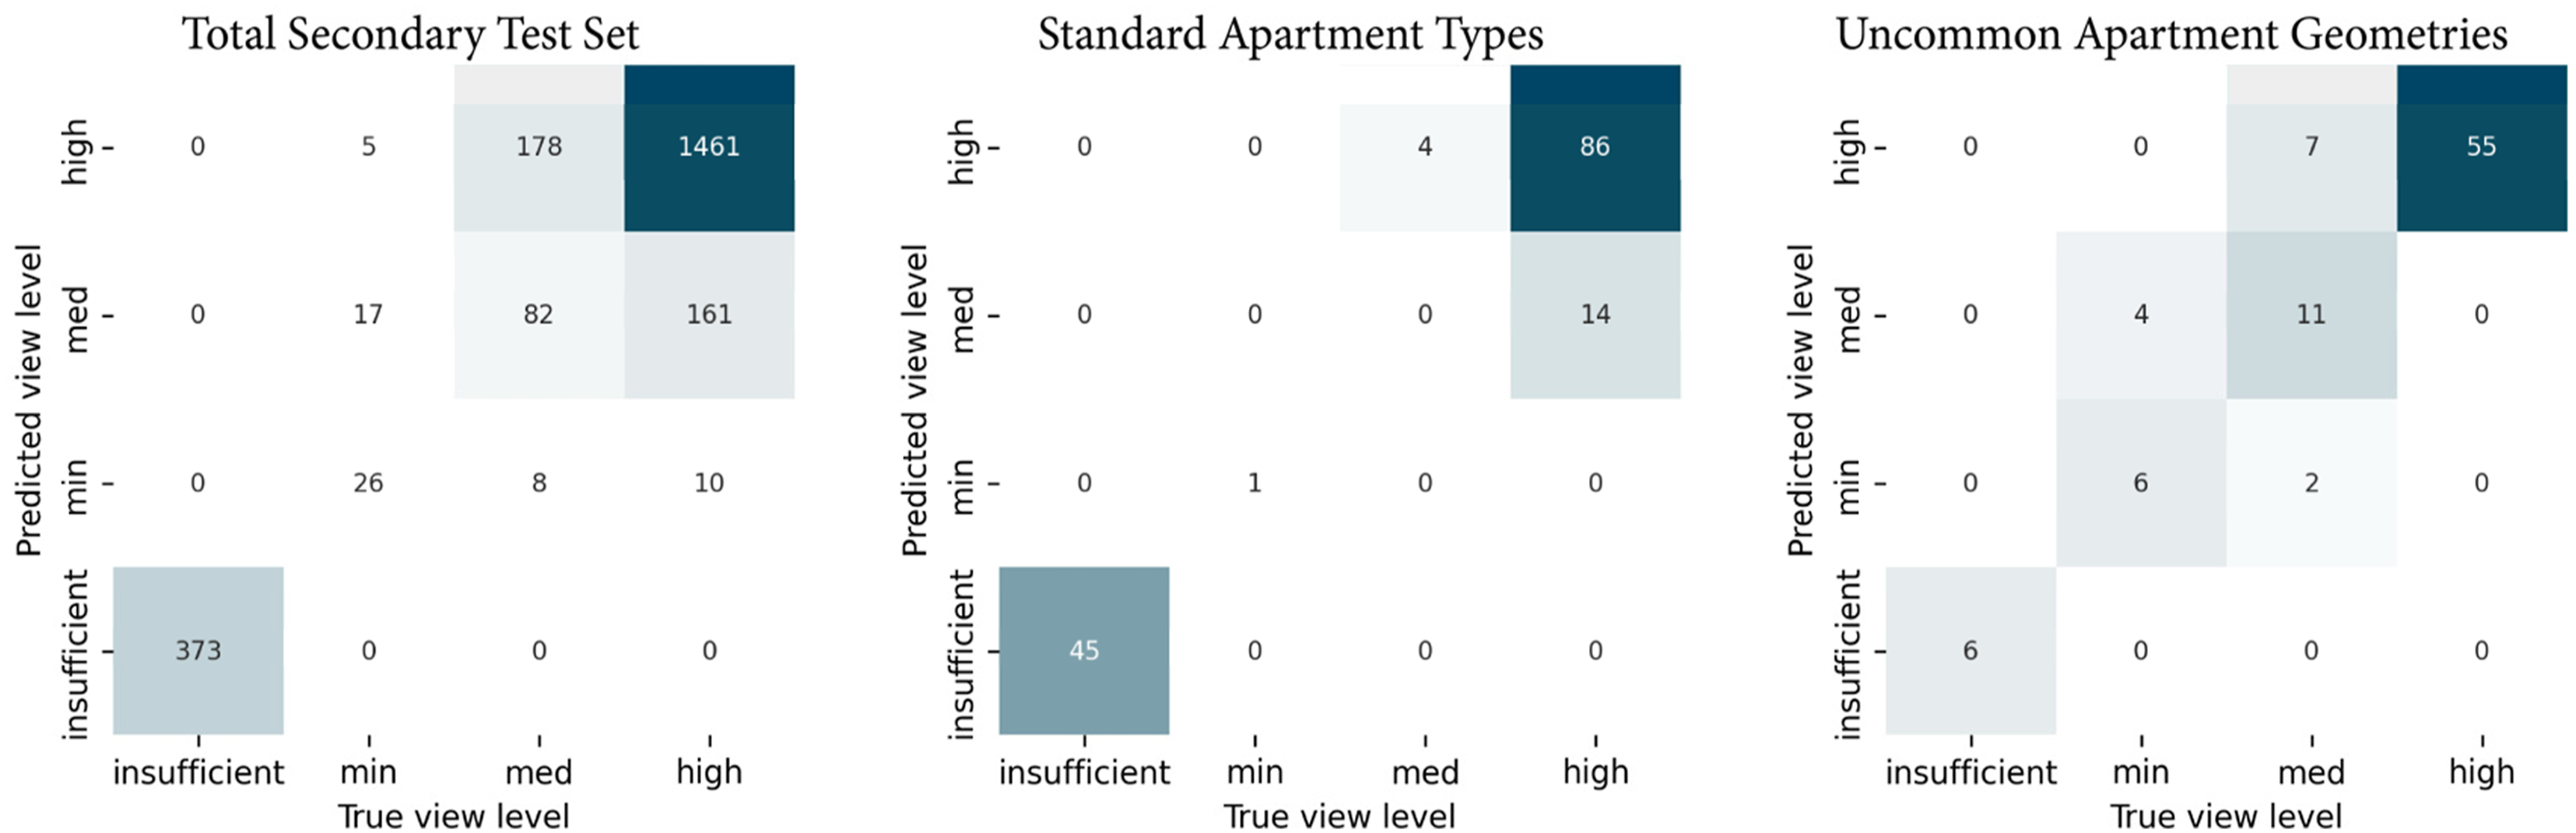
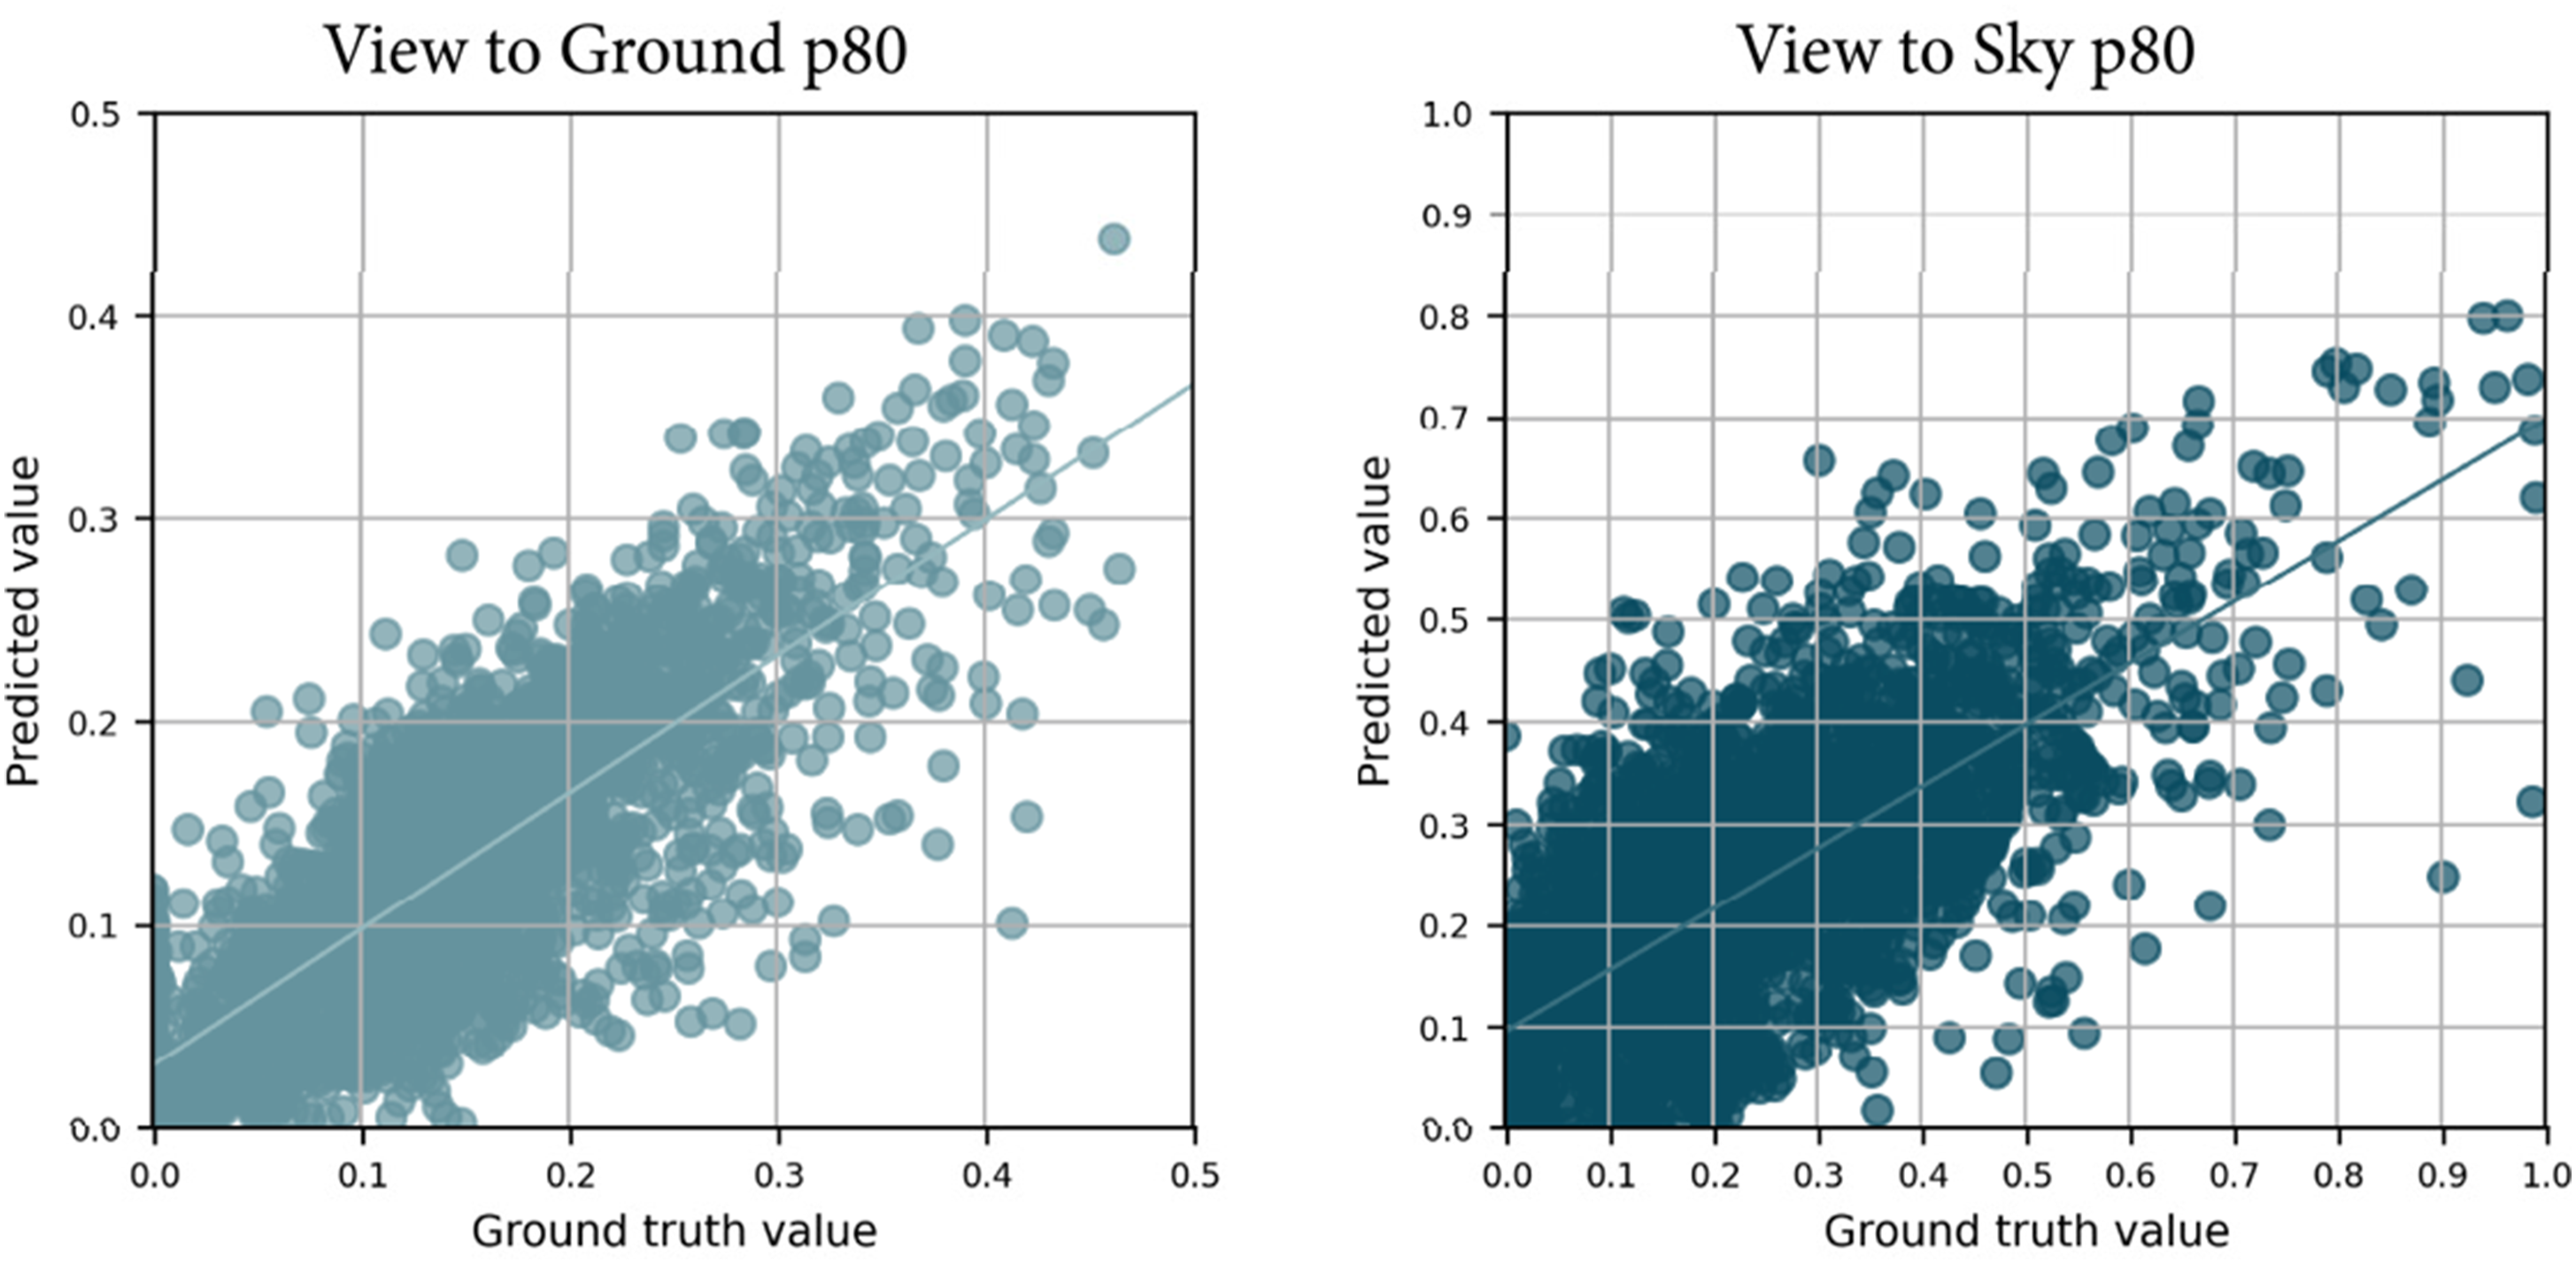
Particularly for the view to ground and view to sky metrics, the performance of the view predictive model for the initial and secondary test sets are illustrated in Figures 11 and 12, respectively. The results indicated that the ground view predictions are more accurate than the sky view predictions, for both the initial and secondary test set. Similar to the daylight metric, the secondary test shows more underpredictions compared to the initial test set. Comparable diagrams are presented in the appendix for the standard apartments categorized by room types and for the uncommon apartments. In contrast to the daylight predictive model, the predicted view metrics are not close to the ground truth values per standard room type (Figure a.2). While the view predictive model excels in the view to sky values prediction for the uncommon apartments category, the room-type-specific predictions for the standard apartments are not equally promising (lower diagrams in Figure a.2 and Figure a.4). The performance of the view predictive model separated by view to ground and sky for the initial test set. The performance of the view predictive model separated by view to ground and sky for the secondary test set.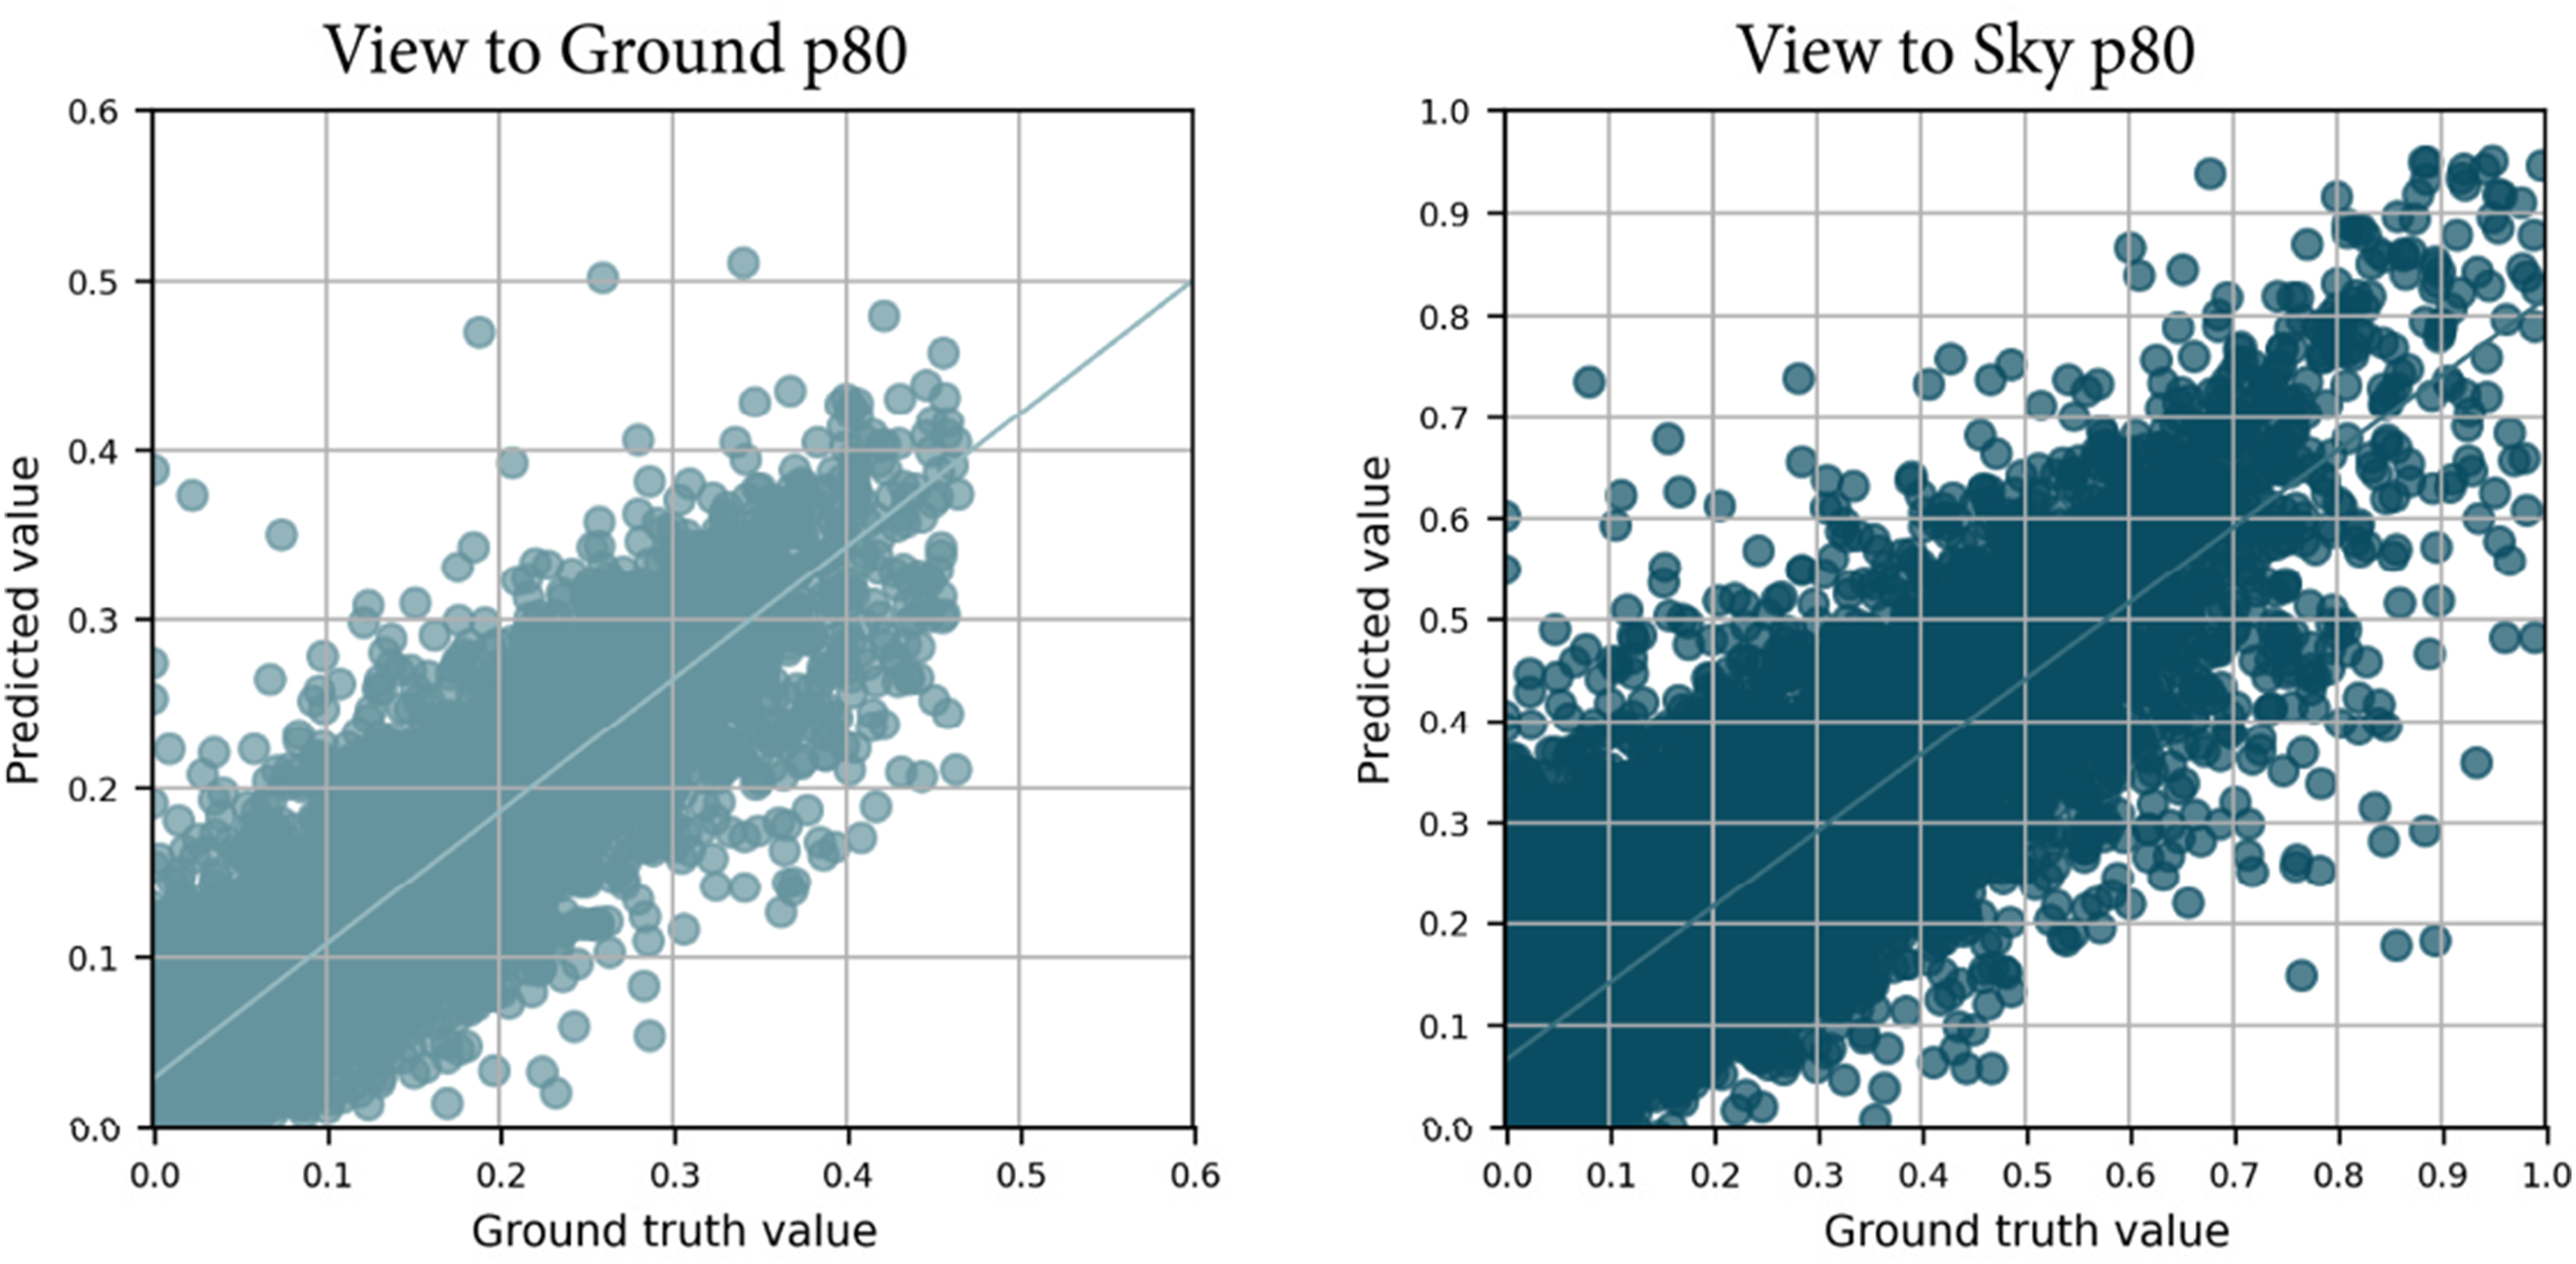
Layout evaluation system and ranking
The post-processing phase is initiated with the un-normalization of the daylight and view predictions of the ML models. Based on the daylight and view values, the layout evaluation system assesses the performance level per metric of each room in accordance with the thresholds of EN 17037. Subsequently, the apartment performance label per metric is determined as outlined in Table 1, after which the overall apartment performance label is calculated using equation (1). The final post-processing step creates practical visual representations of the four levels on the layout design option, as illustrated in the example of ranking process in Figure 13. Example of layout evaluation system and ranking for a layout design option.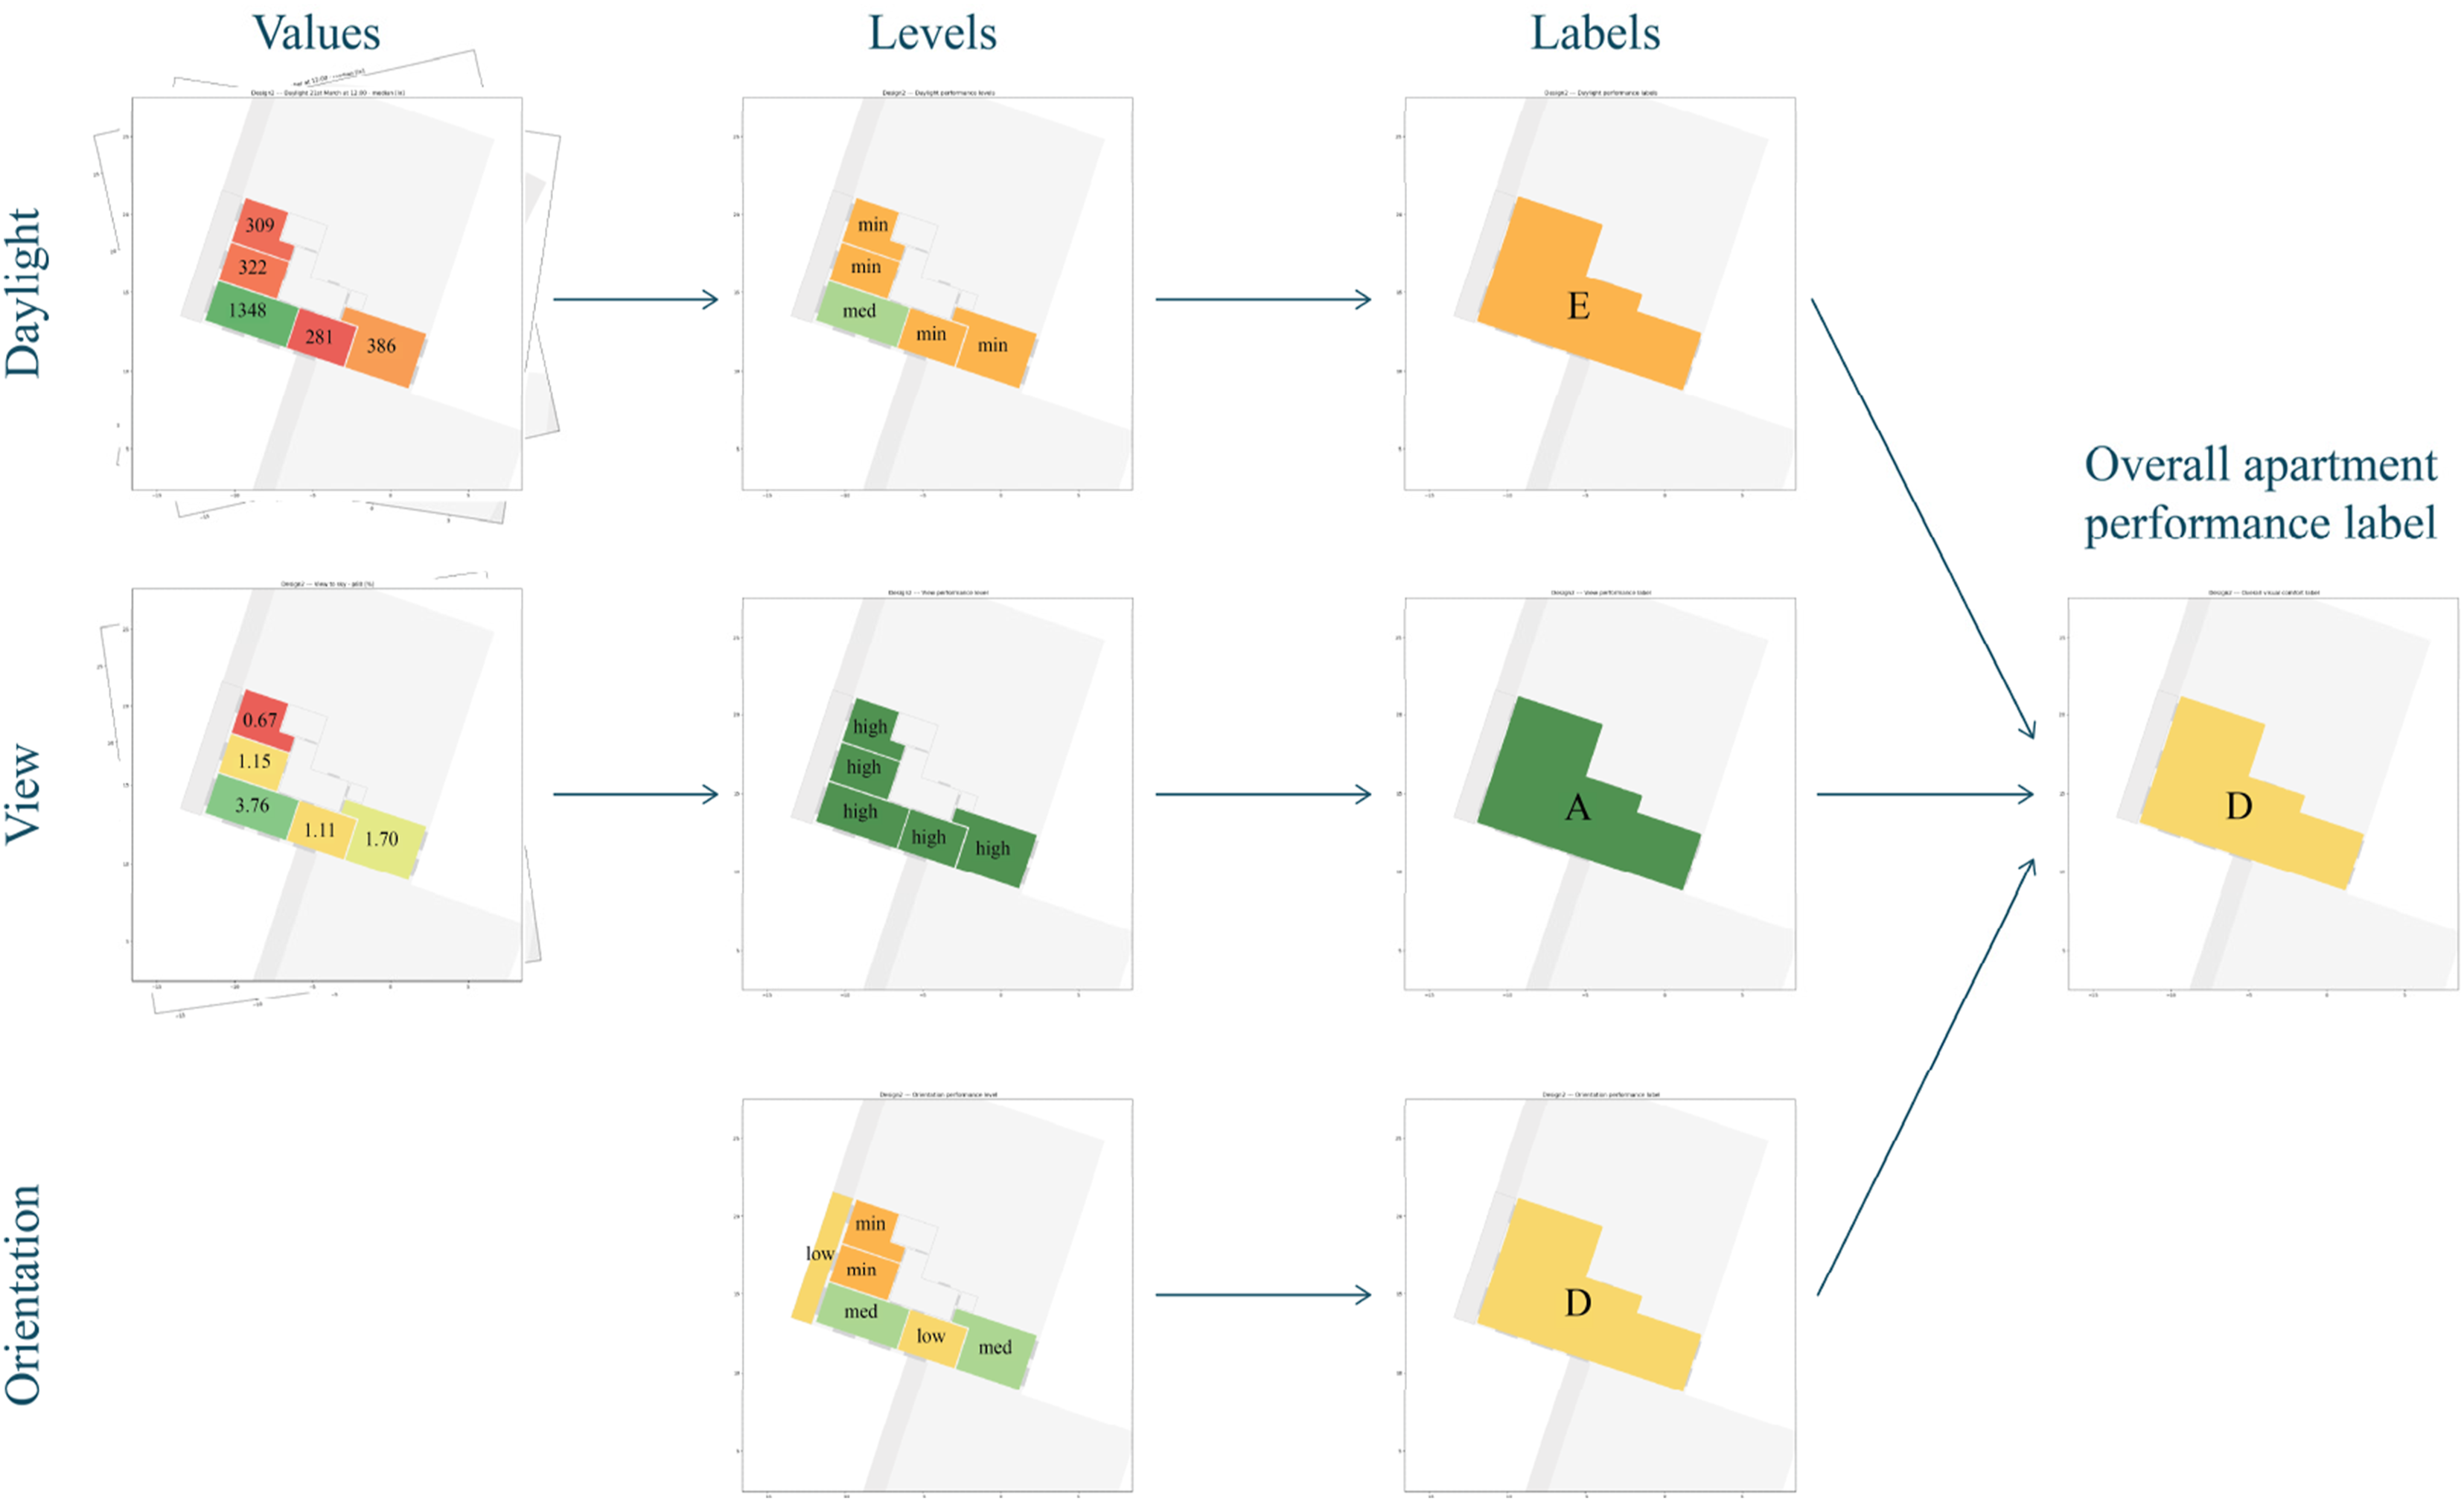
ML-based framework performance
The performance of the proposed framework in this study can be investigated through aspects of data quality, ML model accuracy, and evaluation logic. The quality of the utilized dataset plays a vital role in predictive models’ performance, as poorly constructed or biased datasets could potentially hinder a model’s precision by introducing bias into the model’s results. 39 Therefore, to increase the ML models’ application in a variety of learning-based tasks, it is imperative that the underlying dataset is constructed following practical guidelines and methods. In this research, a dataset that deviated from the standard procedures of the EN 17037 guidelines was used, posing challenges in comparing the outcome of the ML models with the daylight and view quality assessment outlined by the guideline. In this study, the number of rooms in the selected clean dataset (55k) is considerable compared to the majority of previous studies.17,18,25–27,30,35 Plus, all the layouts implemented in the experiments of the current study represent real world spaces. Although the fully cleaned dataset was not used in the current study, future research can benefit from it.
With regard to the accuracy of the ML-based models, a challenge relevant to the models’ specifications is the simplification of building geometries for alignment with the ML-based models, which limits the input variables to parameters such as room width, length, height, elevation, and window position. 18 In the current study, the input features were chosen in such a way that they could be a proper representative of geometrical and contextual conditions affecting daylight and view metrics. While room, building, and outdoor geometrical specifications were embedded in the shapes distinguished by colors, some other features, including window and door placement, as well as view layers, were represented more explicitly in the input image. This representation was mixed with two determining inputs of window-to-floor ratio and elevation, which are inherently numerical characteristics. Moreover, the performance of the daylight predictive model in this study is comparable to previous work in the field, 18 while proposing the advantage of a more comprehensive visual comfort assessment by also including view metrics. As a result of experimenting with different models during the training phase, the incompatibility of available pre-trained models on datasets of natural images 40 with architectural applications was pointed out. This can highly stem from the underlying differences between natural and architectural images due to the spatial relationships, color, texture, and geometrical discrepancies.
Regarding the evaluation logic, the effectiveness of the framework for assessing daylight provision, view quality, and orientation depends on the distribution of the performance label classes from the layout quality ranking system. A cluster at either extreme of performance labels can skew results and make the assessment less informative. Moreover, although the evaluations in the current study were based on EN 17037 standards, the proposed evaluation logic can be performed in the same way using different guidelines. In general, by implementing the ML-based setting in the framework, designers can make well-informed decisions that improve the performance of residential layouts as they move through the stages of the design process by utilizing the performance data and insights obtained from the optimizer. The implemented ML-based design framework does not replace designers, as the design options should be evaluated in the broader design context. The optimizer is not implemented in the framework to make decisions on behalf of the designer, but the implementation of the ML-based design framework functions as a tool integrated seamlessly into the current design workflow by operating alongside the designer and enhancing the designer’s work. However, it is important to note that occupant behavior, site constraints, and micro-climatic contexts also play a determining role in the visual comfort assessment of real-world situations.
Limitations & future work
In the scope of implementing ML-based models to predict daylight metrics, limitations have been reported in previous work, stemming from the constraints of using simulation tools to generate the data and the lack of diversity in the use of algorithms.
17
The current study provided a novel framework for assessing residential layouts based on specific daylight and view metrics with the integration of an ML-based approach. However, the research line can be further expanded by addressing the limitations of this study in certain aspects, listed as follows: • Data availability is a significant source of limitation in studies on big architectural data analysis and, more specifically, when building performance metrics are to be evaluated. Accordingly, besides the chosen metrics in the current study, other metrics representing different aspects of visual comfort, such as sDA, UDI, and glare, could be integrated into the same workflow in case of data availability. • Since the ML-based models in this study have been trained on apartment layouts and their corresponding daylight and view simulation results, the accuracy and generalizability of the same model in different climatic contexts are debatable. However, the same workflow can be adapted to provide models trained on simulated data in another climatic condition. • Although the combination of view assessment besides daylight evaluation is one step closer to real-world design situations rather than merely daylight metrics, the line of research can still benefit from extending these evaluative metrics with other aspects of performance-based design, such as heat gain and natural ventilation, as well as their relation to operational carbon emissions and energy consumption. • Several experiments have been conducted in the current study with the aim of finding the most suitable combination of ML model, data representation, and evaluation approach. However, future studies could more broadly look into other feature selection possibilities, diverse network architectures, or different evaluation metrics.
Conclusion
Adequate daylight and view quality significantly impacts residential spaces, improving human well-being by enhancing sleep patterns, mood, cognitive performance, and mental well-being, while also reducing energy consumption, costs and the carbon footprint. Design parameters including building orientation, window fenestration, and interior layout significantly impacts the daylight and view performance of dwellings. The proposed ML-based framework in this study represents a step forward in integrating ML models into architectural workflows by systematically evaluating daylight provision, view quality, and room orientation, providing visual feedback, and to improve residential layout quality and performance while adhering to current design standards and requirements.
The application of the ML-based model plays a key role as a lever in the proposed framework, injecting and further enhancing the designer’s objectives. The approach for assessing daylight provision and view quality of residential building layouts in this study is particularly novel in two directions. First, the engagement of the designer’s inputs and objectives is facilitated in multiple stages of the framework. This includes pre-processing the initial layout alternatives provided by the designer, post-processing the predictions made by the ML model to ease the evaluation process, and affecting the ranking process by choosing the dominant metric based on the design specifications. This difference is more bold when put in comparison to the previously conventional methods that lacked or less emphasized on the human-in-the-loop element of the iterative design process. Second, the insights brought by the proposed multi-modal assessment framework offer a practical way of infusing both visual and numerical design features, in contrast to the previous workflows that solely focused on one data modality.
The ML-based models in this study were enhanced through changing the infusion stage of the visual and numerical inputs, and fine-tuning hyperparameters through ablation studies. Ultimately, the best-performing daylight and view predictive models resulted in the initial testing MSE of 0.0440 and 0.0478, and an R2 score of 0.7411 and 0.7815, respectively. Additionally, the results of the trained models were translated into performance levels and evaluated based on two apartment typologies, namely standard and uncommon categories. Moreover, the daylight performance was analyzed in more detail on three selected days (i.e., 21st of March, June, and December) and view performance was investigated by two aspects (i.e., view to ground and view to sky). Overall, the daylight model more promising performance in the uncommon apartment category and on June 21st On the other hand, the view predictive models resulted in fair performance for both the standard apartment types and the uncommon geometries categories and excelled in view to ground prediction aspect. These results show promising training which indicates the viability of the proposed approach for predicting daylight provision and view quality in early design tools.
The advantages of the presented framework encompass multimodality, diversity in visual comfort metrics, and guideline-based evaluation criteria. The proposed multimodal model overcomes challenges of converting rough sketches into numerical data and unconvertible values during the early phases of architectural layout design by combining an image and numerical data. Moreover, by incorporating ML models into the early architectural design process, designers can benefit from quick design feedback guided by the EN 17037 guideline. Limitations of this study relate to the accuracy of the simulated data in the utilized dataset, the applicability of the trained models in different climatic contexts, and the specifications of the training process. Future developments in this topic can be done by enhancing the data and models’ quality, as well as adding more diverse metrics for a more comprehensive visual comfort assessment of floor plans. The presented framework can adapt to more diverse metrics, as well as different standard-based thresholds. The research data is available upon request.
Footnotes
Declaration of conflicting interests
The author(s) declared no potential conflicts of interest with respect to the research, authorship, and/or publication of this article.
Funding
The author(s) received no financial support for the research, authorship, and/or publication of this article.