
Abstract
Microscopic agent-based simulations promise the meaningful inclusion of crowd dynamics in planning processes. However, such complex urban issues depend on a multiplicity of criteria. Thus, an isolated model cannot represent the walk of pedestrians meaningfully in planning contexts. This paper reframes crowd simulation as collaborative experimentation and embeds it directly in the design process. Beyond the simulation algorithm, this perspective draws attention to user interactions, interfaces, and visualizations as crucial simulation elements. Through a prototype, we combine an agent-based pedestrian simulation with a hybrid physical–digital interface. Based on this configuration, we explore requirements of the early design stages and accordingly discuss concepts for interaction, simulation, and visualization. The prototype blends user inputs with intuitive design interactions, adapts the simulation process to qualitative and dynamic negotiations, and presents results immediately in the discussed context. Thus, it aligns crowd simulation with contingent collaborations and reveals its potential in the early design stages.
Keywords
Introduction
Planning in accordance with pedestrian movements is a many-faceted and complex issue. 1 Designing comfortable and safe spaces for pedestrians depends on multiple criteria, perspectives, and stakeholders—ranging from ergonomic studies to building codes and subjective experience. De Certeau describes “walking the city” as complex and unforeseeable practice. 2 Hence, the planners’ “strategic” perspective from “above” can never conceive the spontaneous movements and tactical ruses of urban crowds in their entirety. However, this foundational aporia did not discourage urban analysts from trying precisely this. Instead of denying the multilayered nature of urban systems, modelers embraced the idea of complexity, analyzing emergent local interactions in relation to macro-level patterns. 3 Analogously, advanced pedestrian simulations build upon hybrid “multi-scale approaches” to describe crowd dynamics. 4
However, this synthesis of strategic planning and urban complexity is considered too narrow. Complex—or notoriously “wicked”—problems cannot be black-boxed entirely into a simulation. Instead, they must be resolved through the iteration of different alternatives in multi-lateral negotiations. 5 Even simulation experts acknowledge the limitations of generalized pedestrian simulations regarding open-ended and multi-dimensional urban problems. 6 Interdisciplinary researchers like Beaulieau et al. turn toward this second-order complexity. 7 In a study of learning behavior, they address simulations as an open-ended socio-technical negotiation—comparable to design processes as described by Rittel. 5 Simulation in design contexts is not to be understood as the validation and accurate prediction of urban complexity but as the socio-technical creation and exploration of possible futures. Following this perspective, the modeling of pedestrian movement is not limited to an isolated and “as accurate as possible” algorithm. Instead, simulations in design combine human collaboration and digital technologies reciprocally. Therefore, we turn toward the intersections of this hybrid constellation. Besides simulation algorithms, interfaces, user interactions, and visualization techniques represent a critical part of knowledge generation and simulation practices. 8
Conventional pedestrian models separate the evaluation process clearly from the design interactions. Thus, they frame the simulation as a second validating step following the design work. While we acknowledge the motivation to validate final designs reliably, this paper explores a different approach toward pedestrian movement. We discuss the integration of pedestrian models into the early design stages focusing on collaboration processes and user interactions. Instead of trying to “simulate pedestrians” in the most reliable way, we ask how to design with the crowd.
For this reason, the article examines the conditions of collaborative design contexts and discusses adaptations to pedestrian models with respect to these requirements. By this, it extends the research from the existing paper “Designing Crowd Safety: Agent-Based Pedestrian Simulations in the Early, Collaborative Design Stages.” 9 We discuss how to adapt the simulation process to the contingencies, dynamics, and level of decision-making of open-ended design debates. Furthermore, we analyze how collaborative interactions can control the simulation model. Afterward, we discuss how to present simulation results so that they support the design process. Lastly, these concepts are evaluated technically. Thus, this paper presents an extended perspective on pedestrian simulation, including design studies, human–computer interaction, and visualization.
Related Work
Considering the apparent relevance of pedestrian movement for the design of buildings and public spaces, pedestrian simulations in planning contexts receive notably little attention. While extensive research on the behavioral and locomotive aspects of pedestrian movement exists, 10 relatively few studies discuss the challenges of integrating them in planning processes. Nonetheless, the existing research in this domain emphasizes the topic’s relevance. For instance, Aschwanden 11 shows the importance of pedestrian movement for healthy and well-designed urban spaces and discusses how to address this problem through simulation. In addition to this, Asriana and Indraprastha elaborate on the integration of crowd simulations in heterogeneous urban contexts and their potential to contribute to the early stages in planning. 12 Chen 13 discusses the adaptation of pedestrian models to specific behavioral patterns of urban streets. Furthermore, Wurzer 14 approaches the design of hospitals through pedestrian models and analyses how these can contribute to traditional methods of spatial programming. A recent study by Clever et al. discusses a BIM-based integration of pedestrian simulation in design scenarios. 15 The paper suggests a machine-learning approach to react responsively to frequent design input.
This existing research represents a valuable contribution to the topic of pedestrian simulation in design. However, these studies predominantly adapt crowd models thematically to planning tasks (relevant scales and criteria) and focus on the simulation model itself. This work does not cover idiosyncrasies of the early design stages like interactivity, vague input parameters, or appropriate visualization strategies. With respect to our topic, these aspects require further scrutiny.
At the same time, the integration of energy and environmental simulations in the early, collaborative design stages is well explored. This field poses similar challenges: computation heavy and effortful analyses are adapted to tactical decision-making and dynamic negotiation processes. An extensive corpus of research exists concerning topics like the low resolution of input parameters in early planning stages, 16 the integration of results into the design process, 17 and the effects of simulation tools on the structure of design processes. 18 In addition to this, research associated with the presented project investigated how simulations can support collaborative negotiations on urban heating networks, 19 how solar-potential analysis can inform interactive and dynamic design discussions, 20 and how digital tools can be incorporated into multi-modal design practices. 21
Project Setup
The presented project incorporates behavioral crowd simulations in the early planning phases. The project builds upon the existing pedestrian simulation crowd:it 22 and the CDP//Collaborative Design Platform (CDP) 23 —an interactive platform dedicated to the early design stages. Experimentally we couple these modules by means of a communication protocol.
crowd:it
The pedestrian model crowd:it resulted from Angelika Kneidl’s 24 research on pedestrian locomotion and navigation. In addition to this, the tool incorporates the “Optimal Steps Model,” which was developed by Michael Seitz and Prof. Gerda Köster.22,25 These concepts describe microscopic pedestrian interactions, biomechanical aspects, 26 as well as mesoscopic navigation behavior. 4 By this, the model simulates spatially indiscreet crowd movements and considers local events, like cueing or congestion. Currently, the tool is deployed to evaluate elaborated design proposals, for example, to prove a building’s safe evacuation or the performance of a highly frequented area. Integrating the tool into open-ended design processes poses several challenges: The simulation setup and the interpretation of results are cost-intensive and presuppose expertise. The accuracy and—related to this—the computation effort must be adjusted. Furthermore, the input and output target single-user desktop machines and should be modified to match collaborative discussions. Also, the simulation process should be revised to match unpredictable design interactions.
CDP//Collaborative Design Platform
Conventional desktop computer interfaces are inappropriate for dynamic collaboration.
27
For this reason, we propose controlling simulation models through intuitive multi-modal interactions. The employed Design Platform (see Figure 1) offers a touch—and object-sensitive screen on which physical models can be placed and discussed. The planning context is directly imported from OpenStreetMap.
28
Collaborators intuitively interact with the physical model on the table. Meanwhile, the platform recognizes these design interactions in real-time via a 3D depth camera and uses a recreated digital model as a foundation for simulation and visualization. The conceptual and technological base of this seamless physical-digital platform has been developed and optimized during the last 10 years and has been published widely. A detailed description of the Design Platform can be found in “Interaction Forms for Digital Design.”
23
By this, we combine qualitative (e.g., spatial and aesthetical) and quantitative (e.g., simulation) modes of decision-making. The Design Platform blends analog design tools like physical models with digital simulations and visualizations.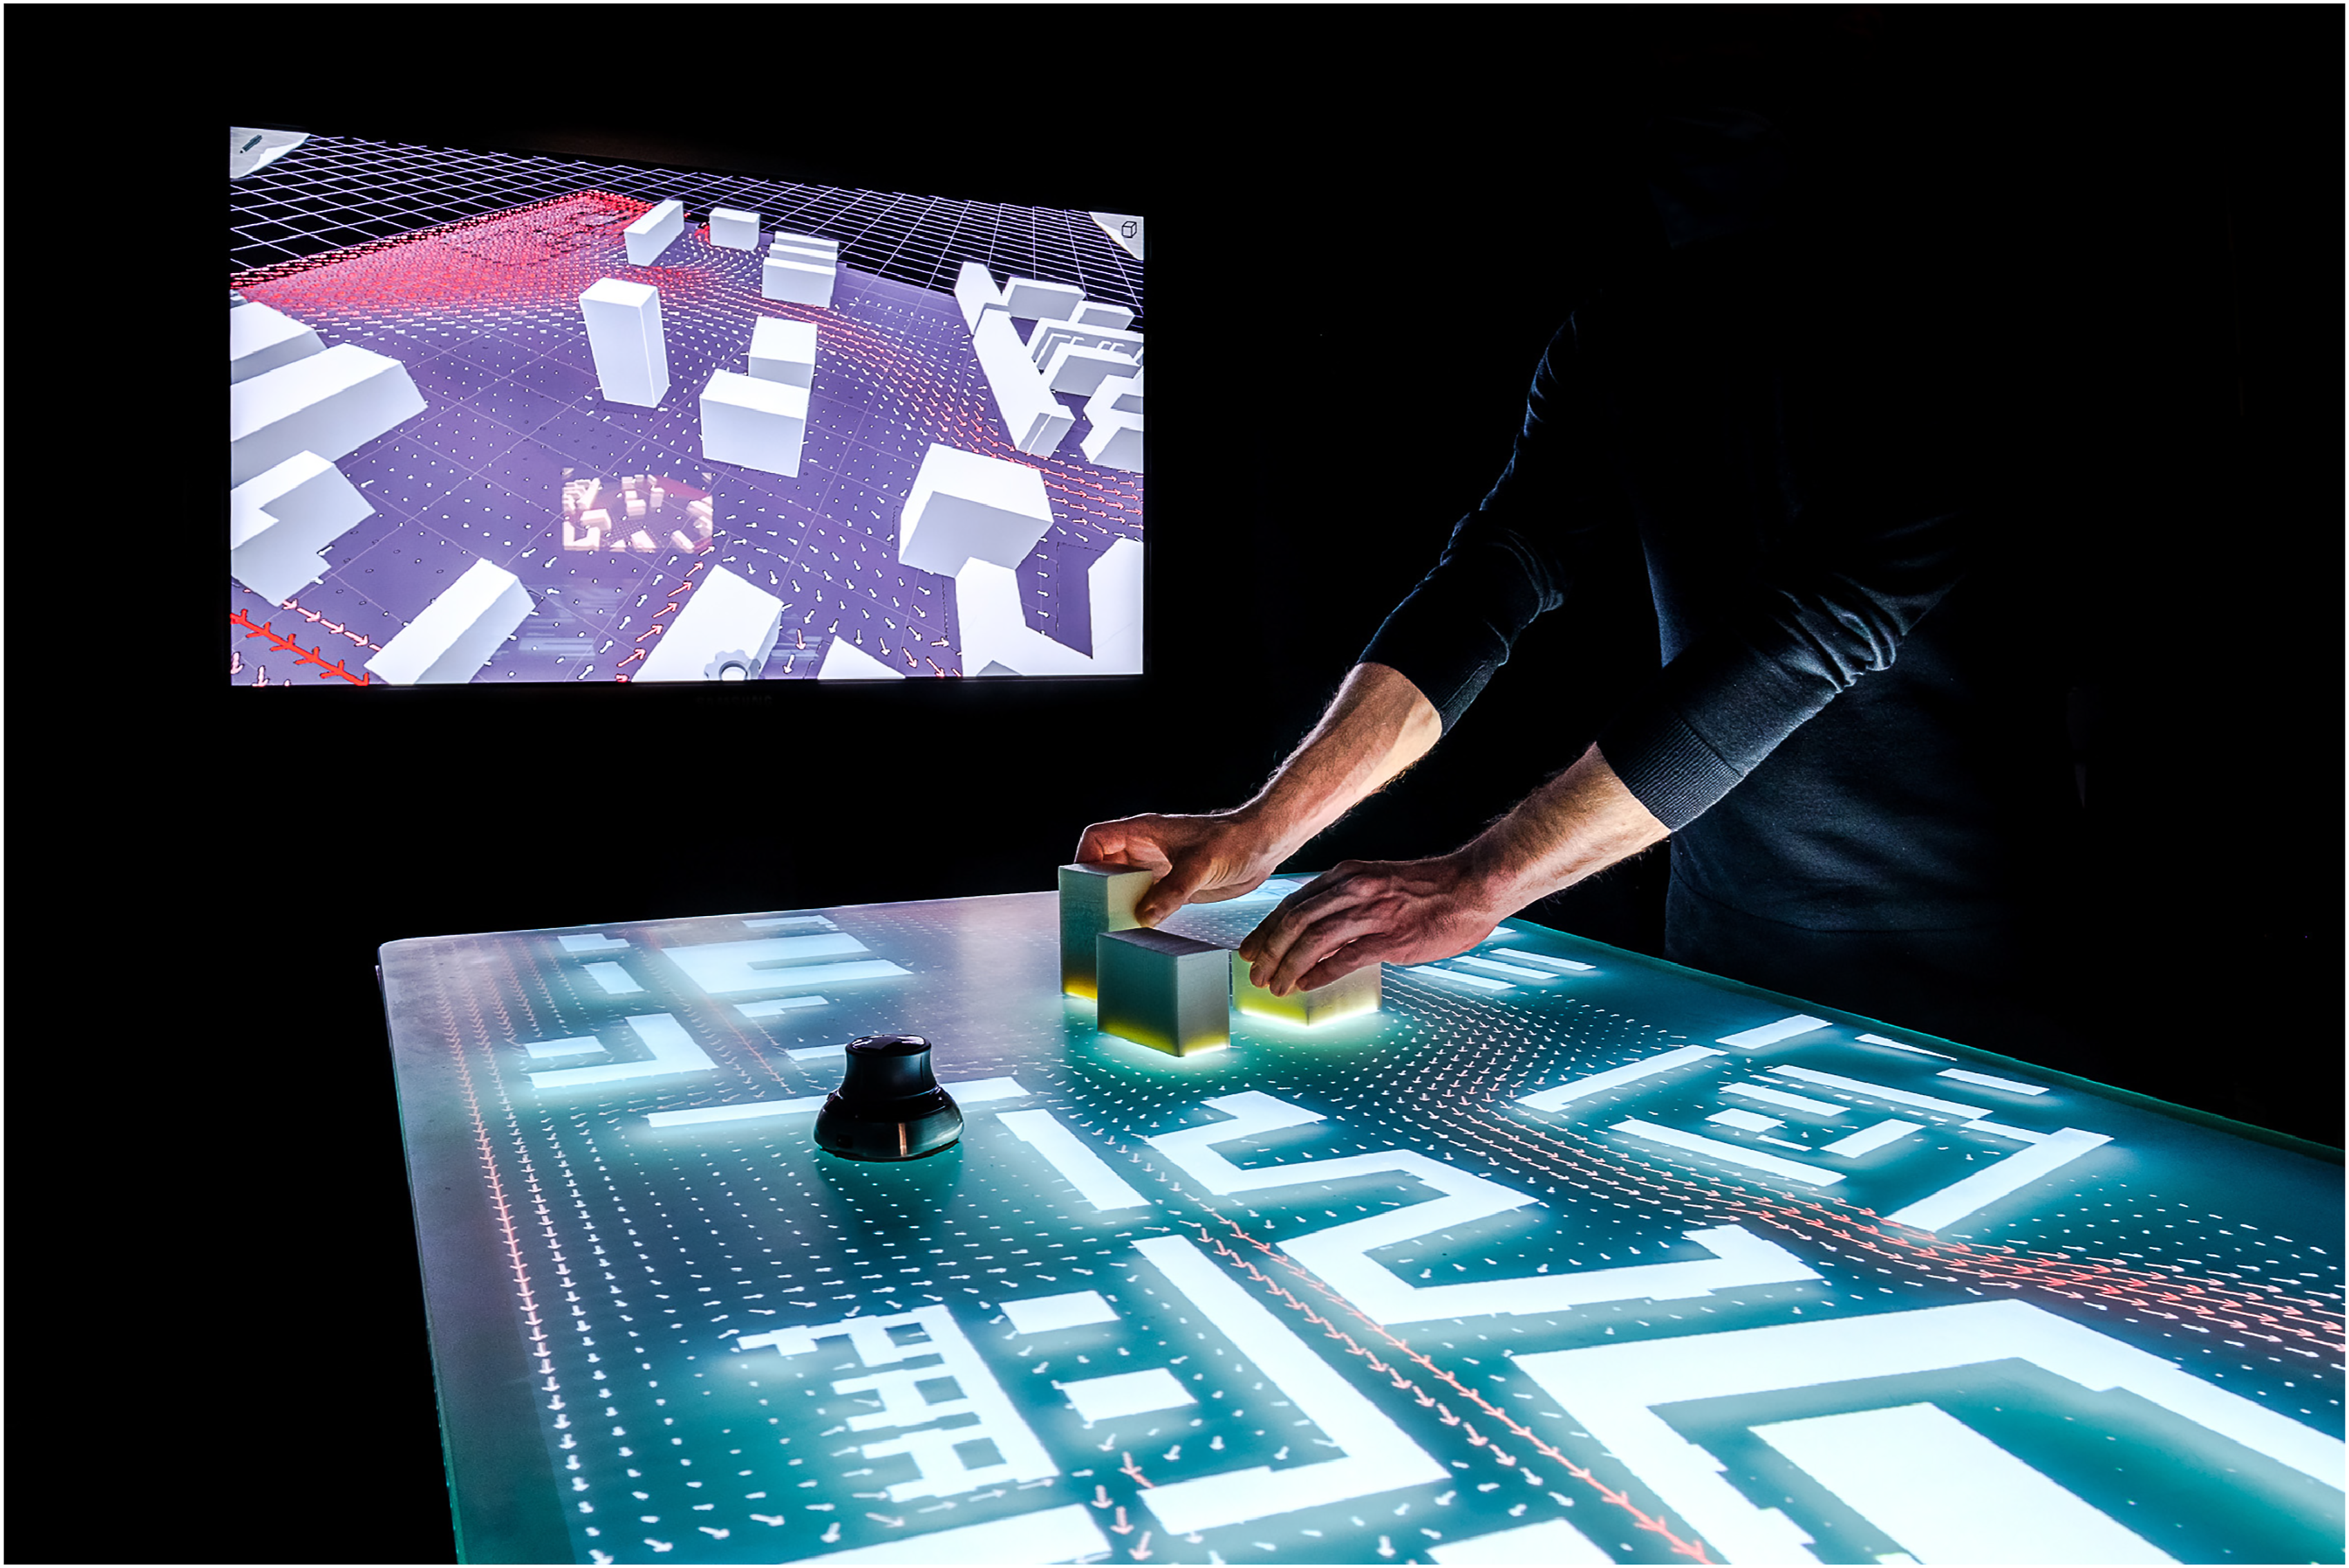
Communication Protocol
We introduce a software protocol that interconnects the platform as an input and output device with a server-based simulation (see Figure 2). This modular setup increases the prototype’s flexibility: adaptations to the simulation, the server, or the input devices are feasible with little effort. On the one hand, this setup allows the connection of existing software solutions with only minor modifications. On the other hand, it drastically reduces the performance requirements for the input device. Thus, extending the server’s capacity makes high computational capacities for extensive and fast simulations available. The prototype combines the Design Platform, a hybrid collaborative interface, with a server-based simulation by means of a communication protocol.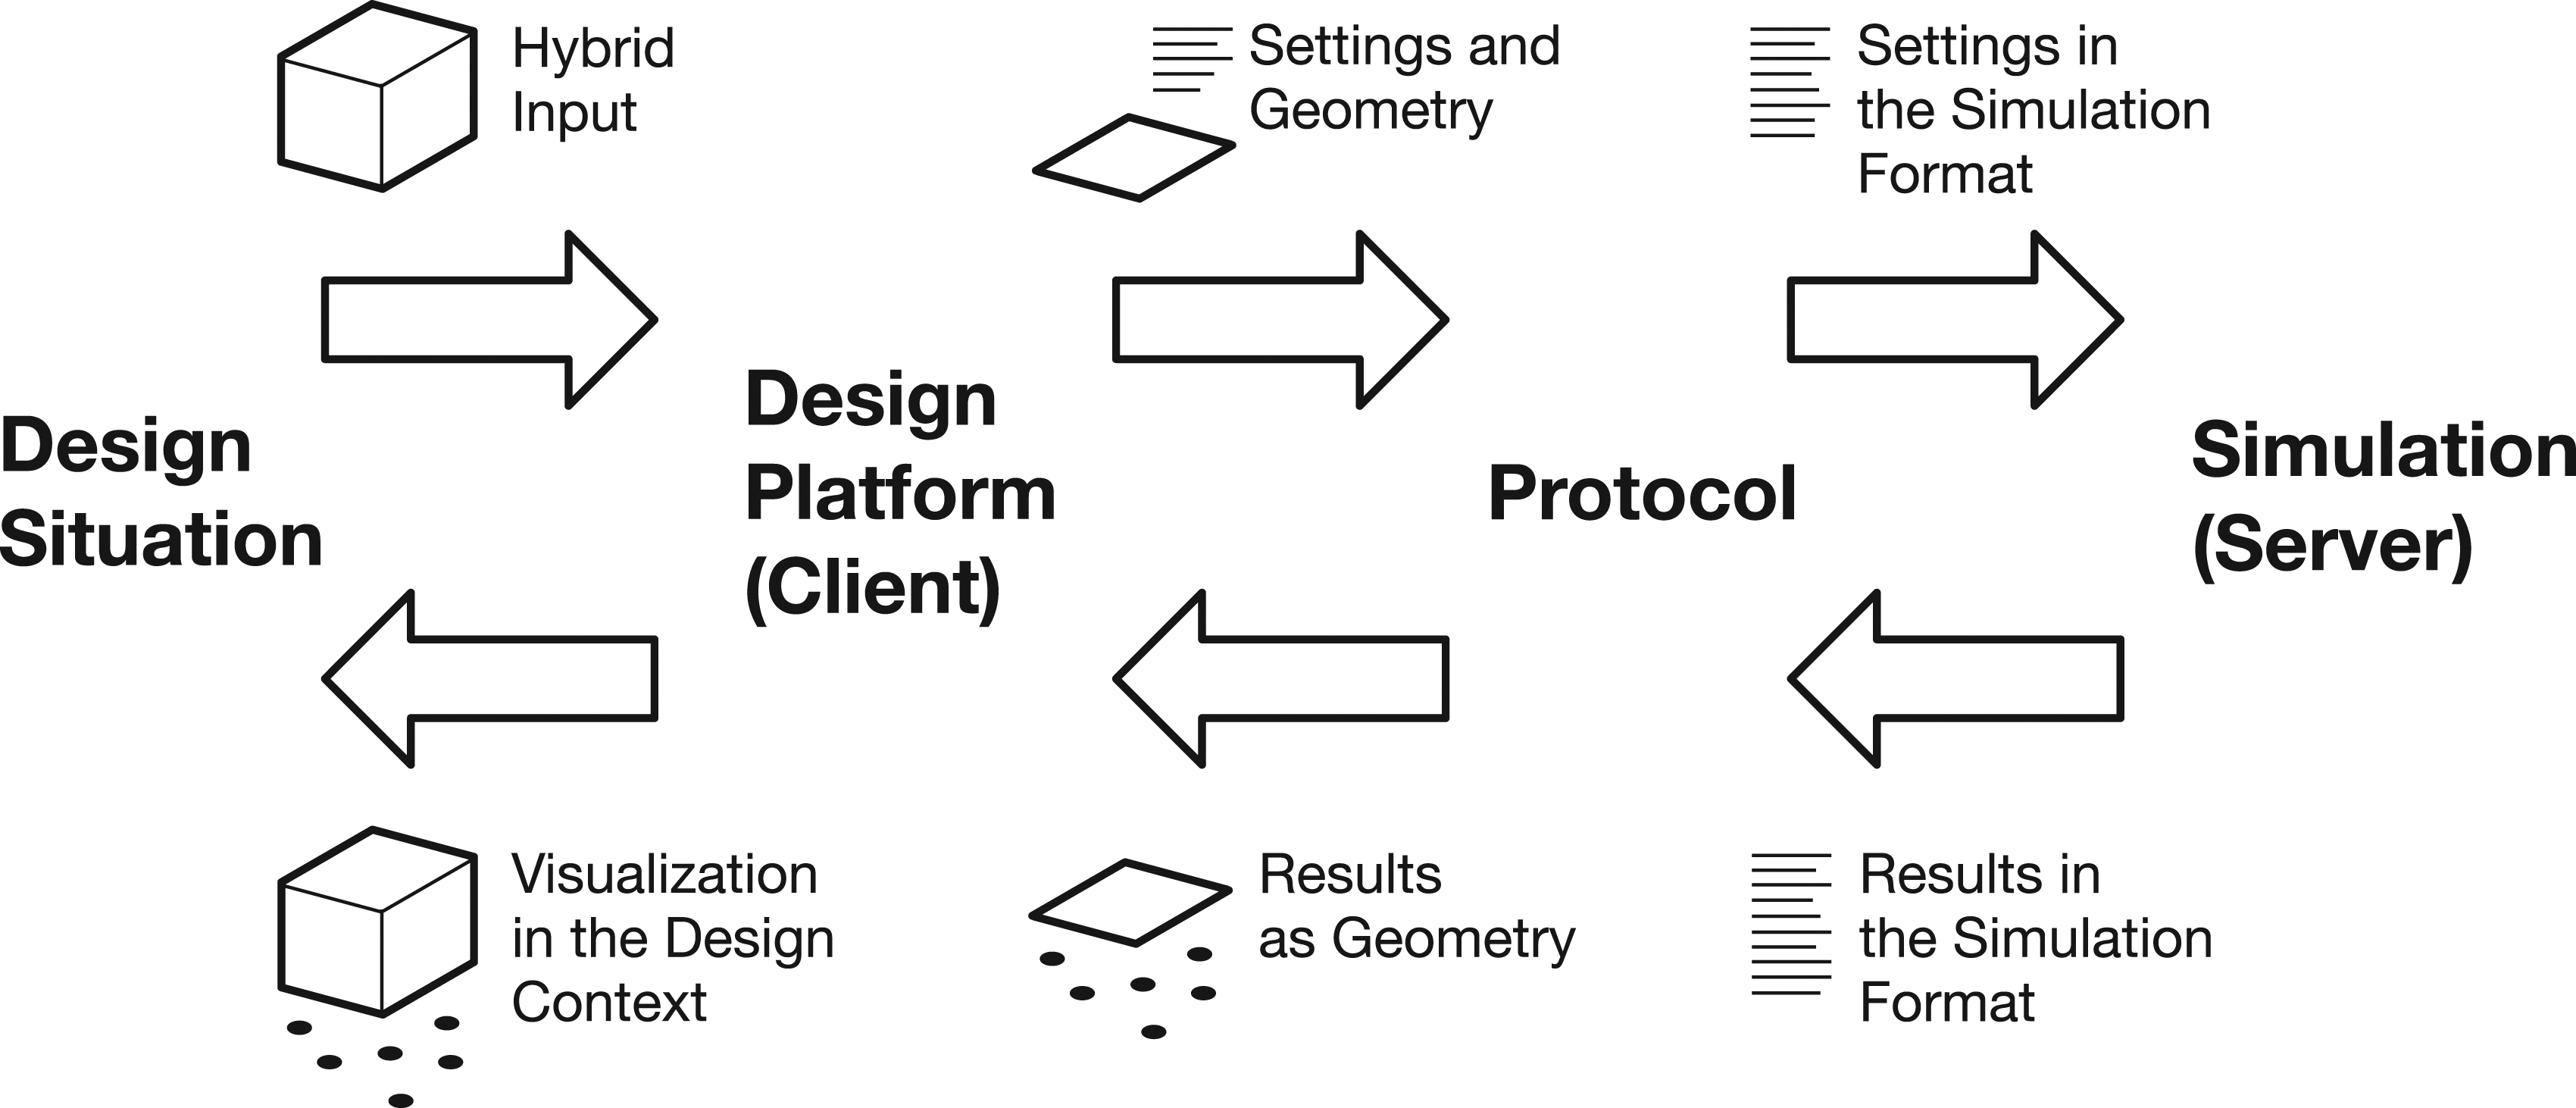
The protocol is implemented as a server–client architecture following the open-source standard ZeroMQ. 29 As the client, the Design Platform was extended with a C# plugin that structures user input and visualizes simulation output. An API was developed for the simulation model on the server-side, which allows controlling it through the protocol.
Concept and Prototype
Designers gather around the Design Platform and examine the planning site. While discussing, they move and modify styrofoam models on the table. Intuitive design interactions with the models presuppose no specific technical expertise and thus impose no additional hierarchies on the collaborators. These interactions happen spontaneously, experimentally, and simultaneously. They include several hybrid modes of expression like discussion and physical interactions. In this process, design proposals are articulated materially in several alternatives and co-exist as different fuzzy possibilities. 30
Instead of imposing a rigid technological structure onto these practices, the simulation must adapt to these dynamic and complex conditions. The tool follows the design interactions and responsively contributes information to the debate (see Figure 3). Instead of evaluating final results and returning “evidence,” the simulation contributes a continuous stream of hints and suggestions. By this, designers take pedestrian dynamics into account and juxtapose this information with other relevant design goals. Therefore, the simulation fosters a non-deterministic engagement with the factor of crowd dynamics. This setup allows designers to test the effects of adaptations and to improve their design in fast iterations. The project targets the integration of pedestrian simulation in the hybrid digital-physical design interactions of the Design Platform. The physical objects serve as sources and targets through which agents enter the simulation and leave the simulation space.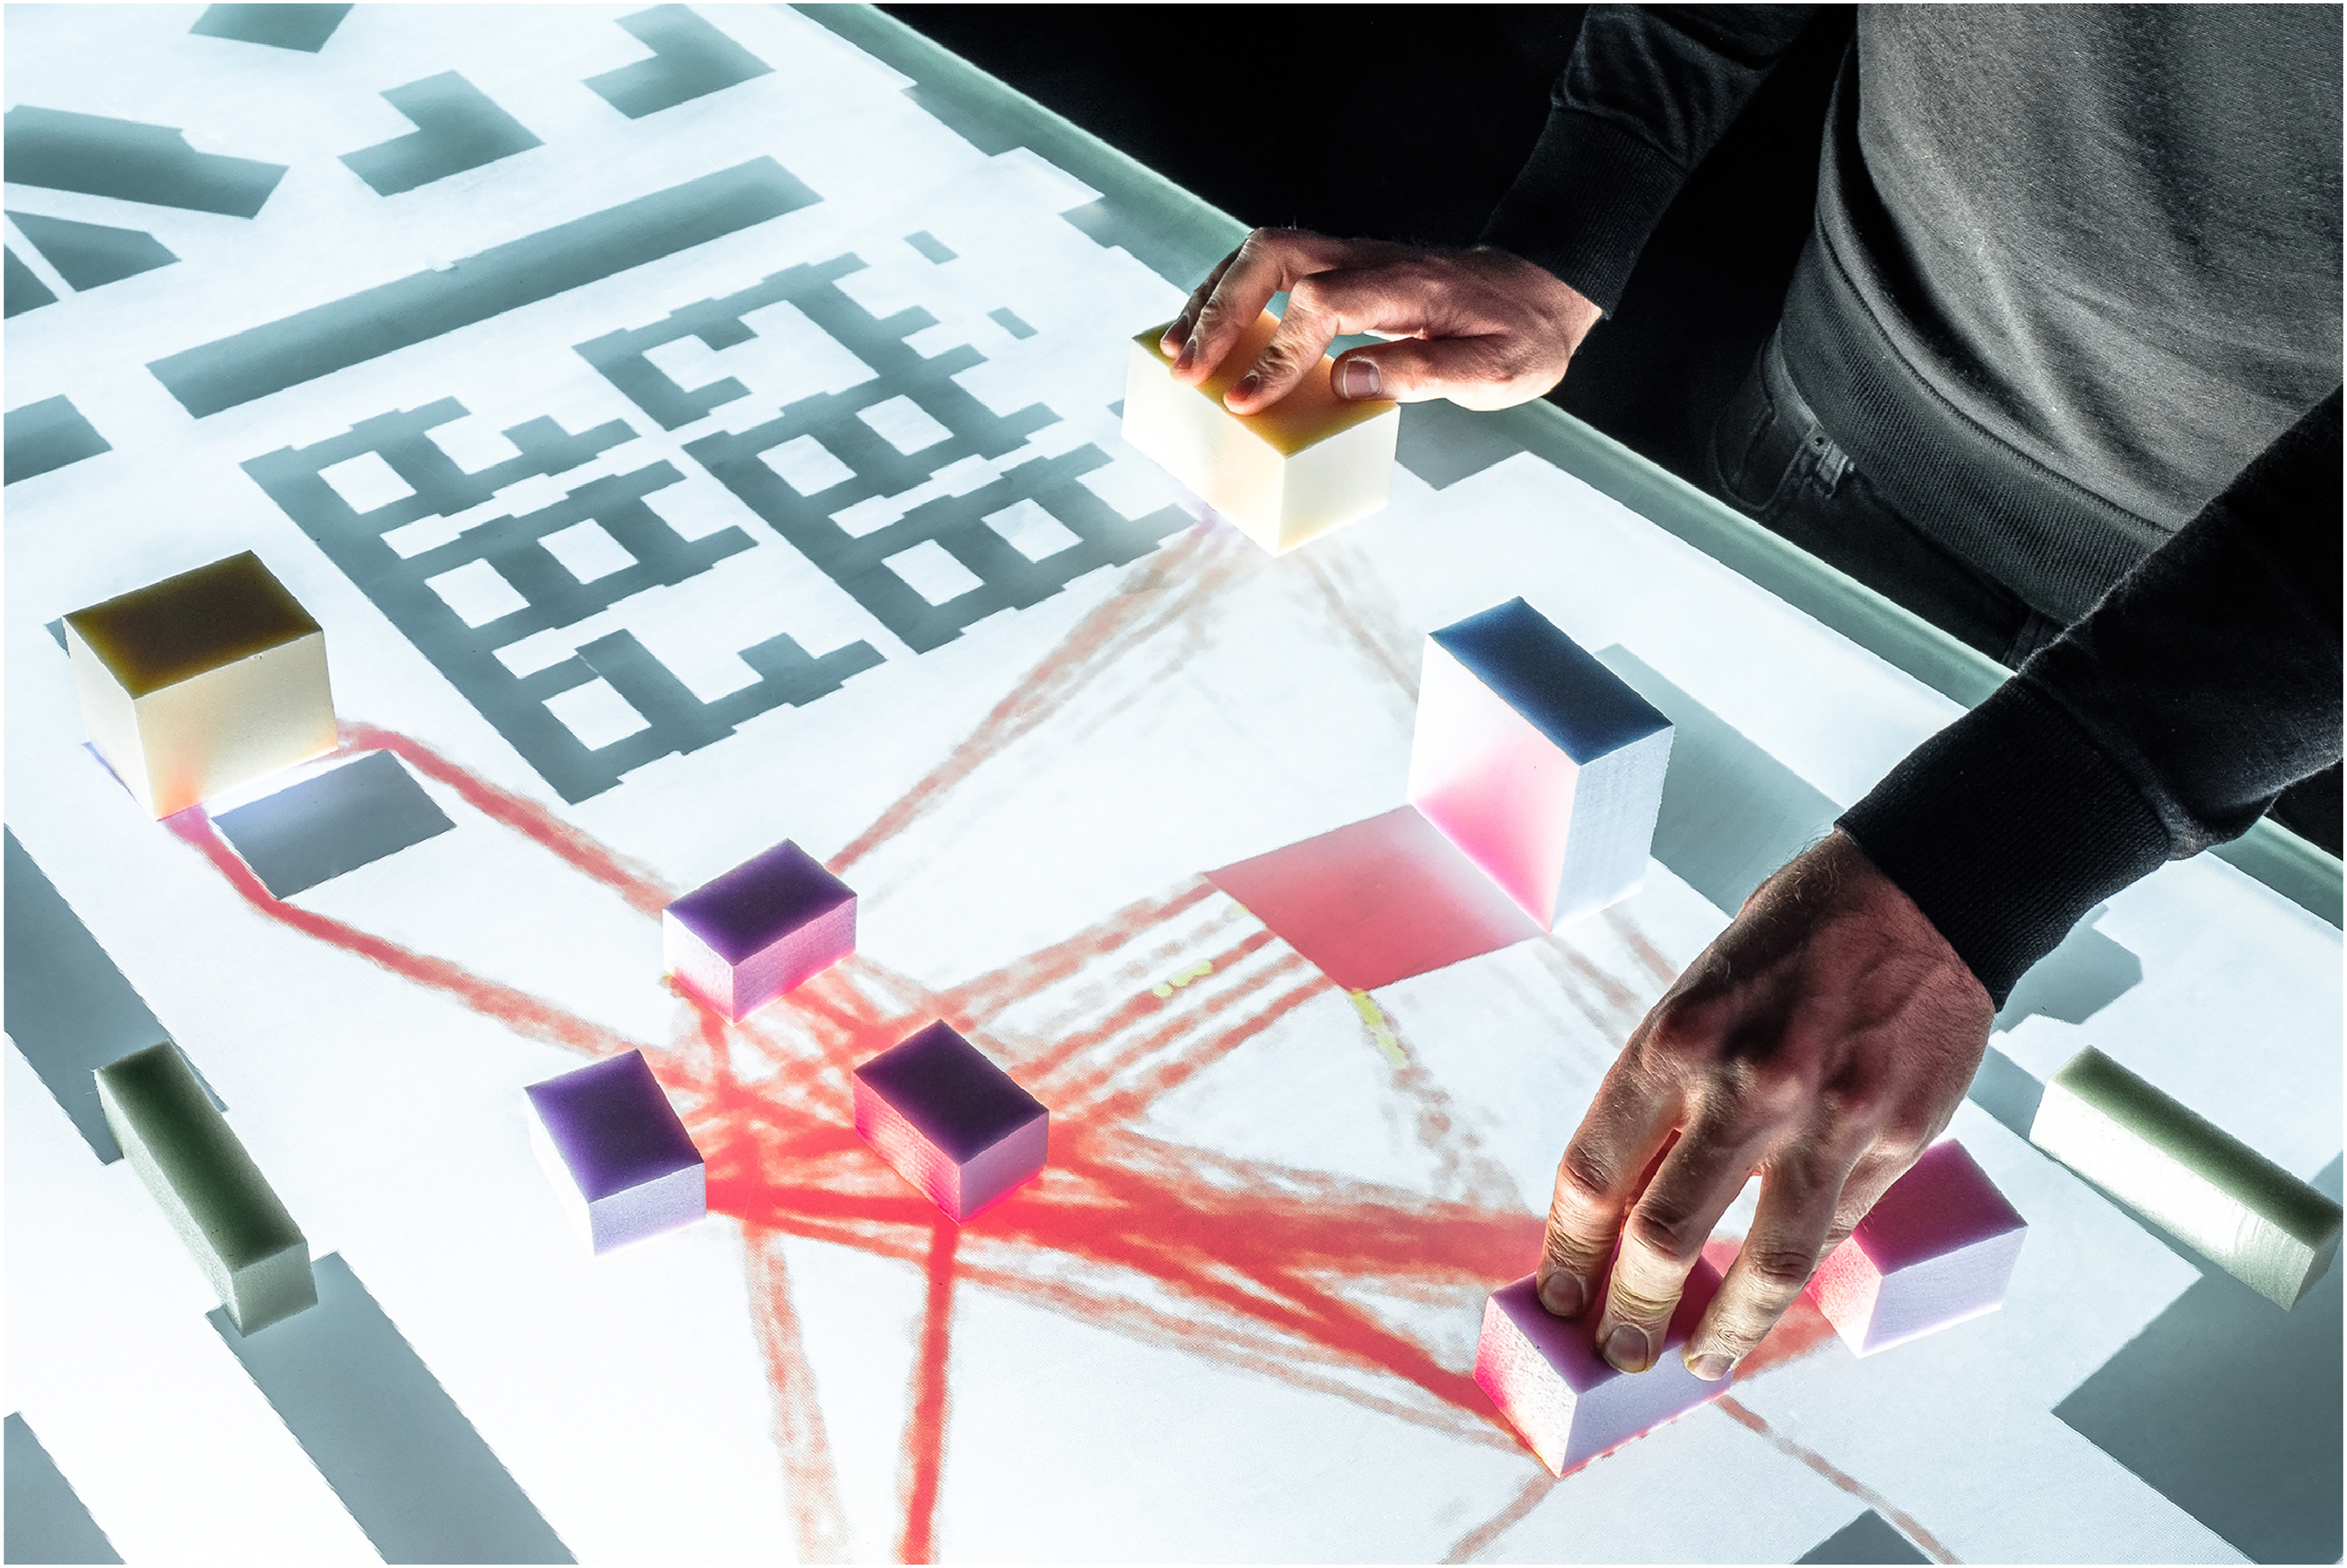
To achieve this goal, we explore the described combination of tools in detail regarding the simulation process, user interactions, and the visualization of results.
Simulation
As Petersen et al. show, advanced simulations tend toward detailed evaluation instead of constructive design support. 18 Conventionally, they imply long design iterations and subsequent performance evaluation. By embedding the model into the design process, it provides direct suggestions for planners. 19 However, conventional crowd simulations are designed for long iterations and after-design use: They imply a linear sequence of extensive input, black-boxed calculation, and finally, visualization of results. After receiving input, the model simulates the agents’ journey step-wise from their sources to their targets. During this process, the simulation stays passive and gives no feedback. Changing input parameters requires aborting and restarting the calculation.
Even on a highly performant server, this process endures several minutes for extensive simulations. In heated debates, these calculations are likely to be interrupted by design interactions. Therefore, we propose an adapted “continuous” simulation process that immediately reacts to changed user input and constantly supplies feedback.
After design interactions, the communication protocol flexibly starts a new simulation and aborts the running one. Thus, the model allows interactions during runtime and reacts directly. This approach was preferred over changing input objects live during the simulation. It is important to clear the simulation history after changed input to keep averaged simulation results conclusive (like the “mean density” of an area or the agents’ trajectories). Thus, the model stays interactive but still provides accurate results.
Furthermore, the protocol must return intermediary feedback as soon as it becomes available. For this reason, we implement an observer-class through the simulation-API. After each simulation step, this class transmits all agent positions to the plugin on the client side. Thus, design interactions entail direct feedback. When a variant rests on the table and is discussed in more detail, the simulation proceeds and contributes more information.
Thus, we have found an interactive way to control the simulation and provide constant feedback. Nonetheless, the simulation still restarts after interactions: pausing, clearing the simulation area of all agents, and restarting them at their sources. We propose two measures to compensate for this issue.
Conventional pedestrian models generate a specified number of agents in source areas and simulate how they move toward their targets where they ultimately leave the simulation (see Figure 4). For this reason, the agents initially “evaluate” areas close to their sources and later on the target areas. The simulation treats the design space anisotropically, which is misleading in design debates. Whereas the standard simulation model simulates a “progressive” movement of agents with a fixed start and endpoint, the proposed model aims at an instantaneous and “continuous” distribution.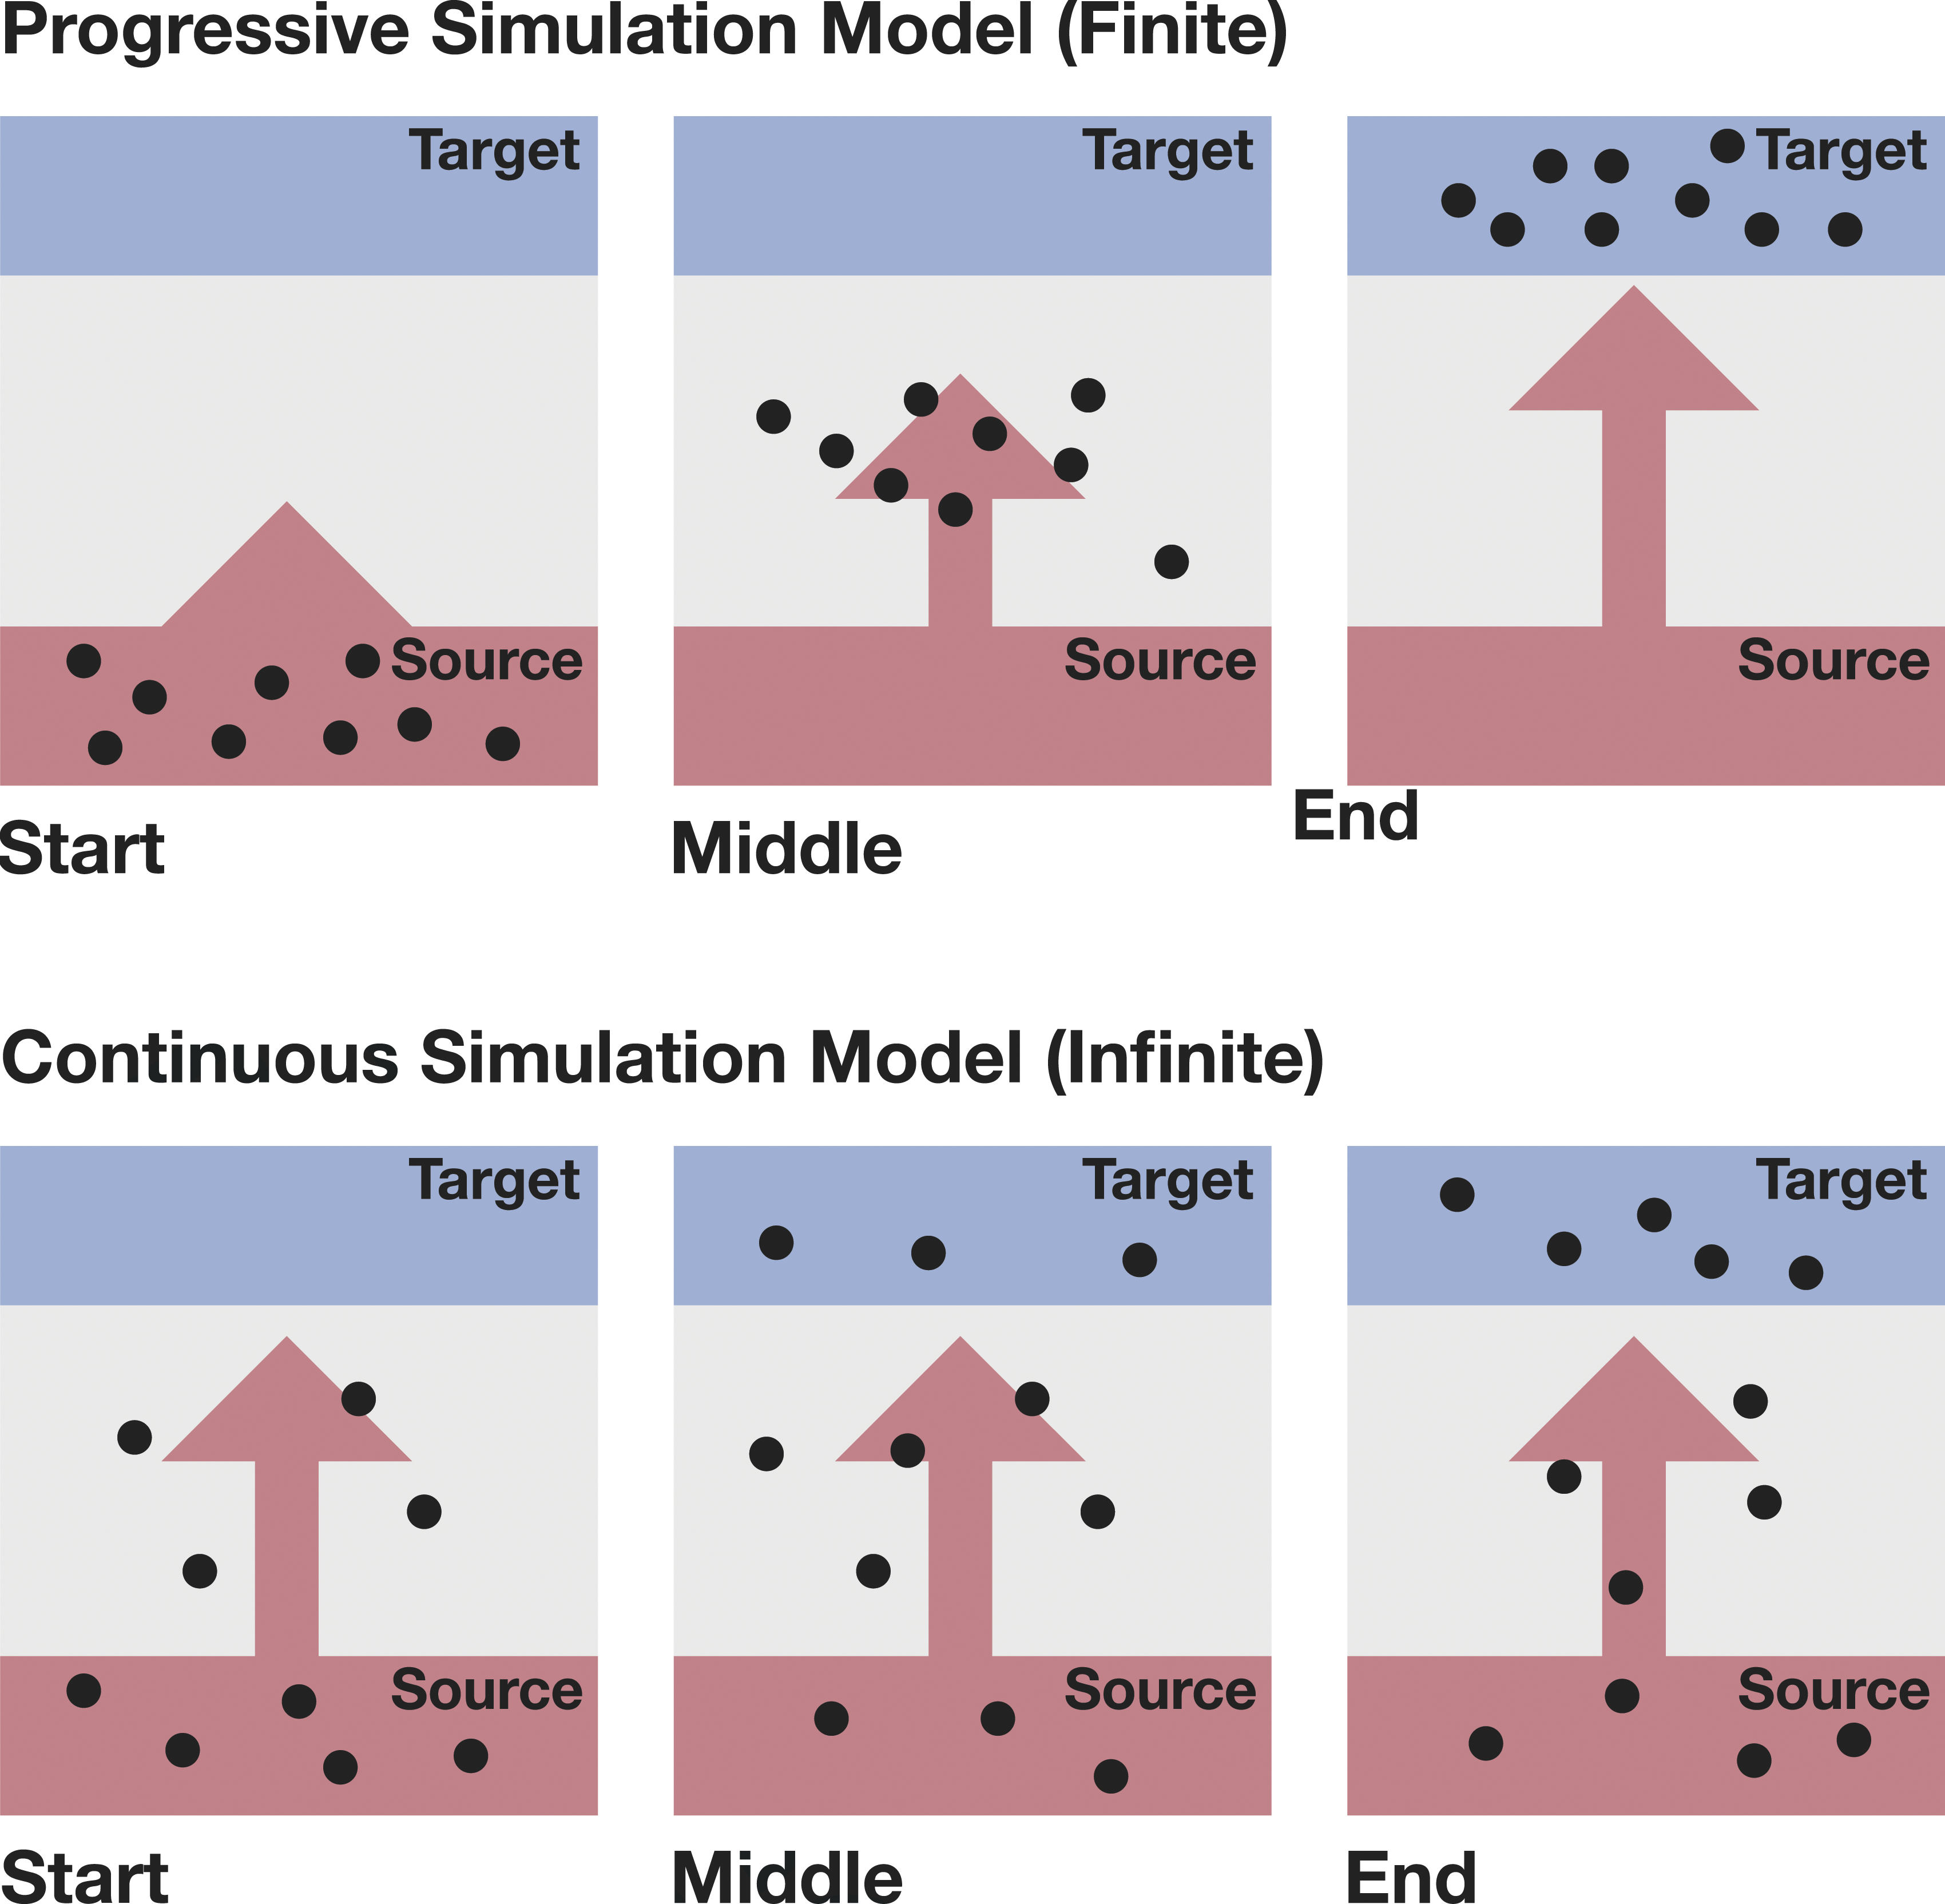
Whereas the described linear simulation process is accurate concerning absolute evacuation or entrance times, early design discussions rather profit from spatial feedback on problematic areas and qualitative movement patterns. Thus, we need to achieve a continuous distribution of agents in the relevant design areas. For this reason, we adjust the generation of agents: Initially, agents spawn not only in the source areas but also in the field between sources and targets. When a simulation is aborted, agents are re-spawned in their former position and keep moving toward their respective targets (if unmodified). The protocol treats each simulation as one “topic” on which it communicates messages with simulation results. Instead of stopping a simulation instantaneously after user interaction, the old simulation keeps running for a short time while the new one initializes. This strategy allows blending the simulation results of new and old simulations, enabling a more continuous user experience.
Interactions
Earlier studies on digital tools in collaborative design processes suggest connecting simulations with multi-modal design interactions like sketching and modeling. 21 Instead of effortful settings, the simulation must be controlled with the intuitive geometric interactions of the Design Platform. Though, how to control an intricate simulation algorithm through styrofoam blocks? For this purpose, we conduct two translations: On the one hand, we categorize settings as front and back end parameters. On the other, we investigate how to mediate design interactions to control these settings. We must consider an appropriate level of detail in the early design stages regarding inputs and feedback: Overly specific input parameters are not available in the early design stages 16 or require a complicated setup process. Too detailed results are unnecessary for early decision-making or may even distract the users.
Front and Back End Parameters
The protocol communicates three types of input data to the simulation server: • Geometric input (the simulation objects); • Agent settings (agent properties and their way paths); and • Foundational simulation settings (e.g., accuracy).
Regarding the relatively low precision and large scale of early design stages, agent settings like size and speed can be assumed as a standard distribution regardless of the specific context. All design-specific setup derives from intuitive geometric interactions and the choice of a benchmark scenario. Geometric interactions influence where pedestrian agents spawn and go, whereas the benchmark scenario defines how they move through the geometry.
Geometric Interactions
During the design process, stakeholders test spatial compositions, examine consequences, and respectively adapt the design setting. Thus, geometric operations represent one of the primary activities during the design process. For this reason, they are the most “natural” way to structure user input during the design process.
The Design Platform allows importing urban contexts directly from OpenStreetMap. Physical objects on the table represent elements that are subject to the design process. They serve as a haptic interface. The platform’s 3D scanner recognizes each object with its RGB-D sensor and assigns it a unique ID. By this, the platform interprets changes in the design model automatically as adapted user input.
Hence, designers work with the physical design and the simulation model simultaneously (see Figure 5). Each object’s height defines its significance for the pedestrian simulation—its “attraction.” The styrofoam color specifies the element type: entrances/exits are red, minor attractions (e.g., info-points) yellow, major attractions (e.g., festival stages) blue. As soon as the platform recognizes a simulation object, another option for interaction appears: A bold contour surrounds the object-perimeter on the table. The selection of these lines sets the respective edge as a barrier. By this, a simulation object can be given a specific direction. Other barriers can be created via hand gestures: A long touch on a free area sets a marker that tracks the finger’s movement. After releasing the gesture, this path is translated into a barrier. Intuitive design interactions with physical objects serve as simulation input. The objects’ colors and sizes represent their significant in the planning context (e.g., red = entrance/exit and yellow = minor attraction).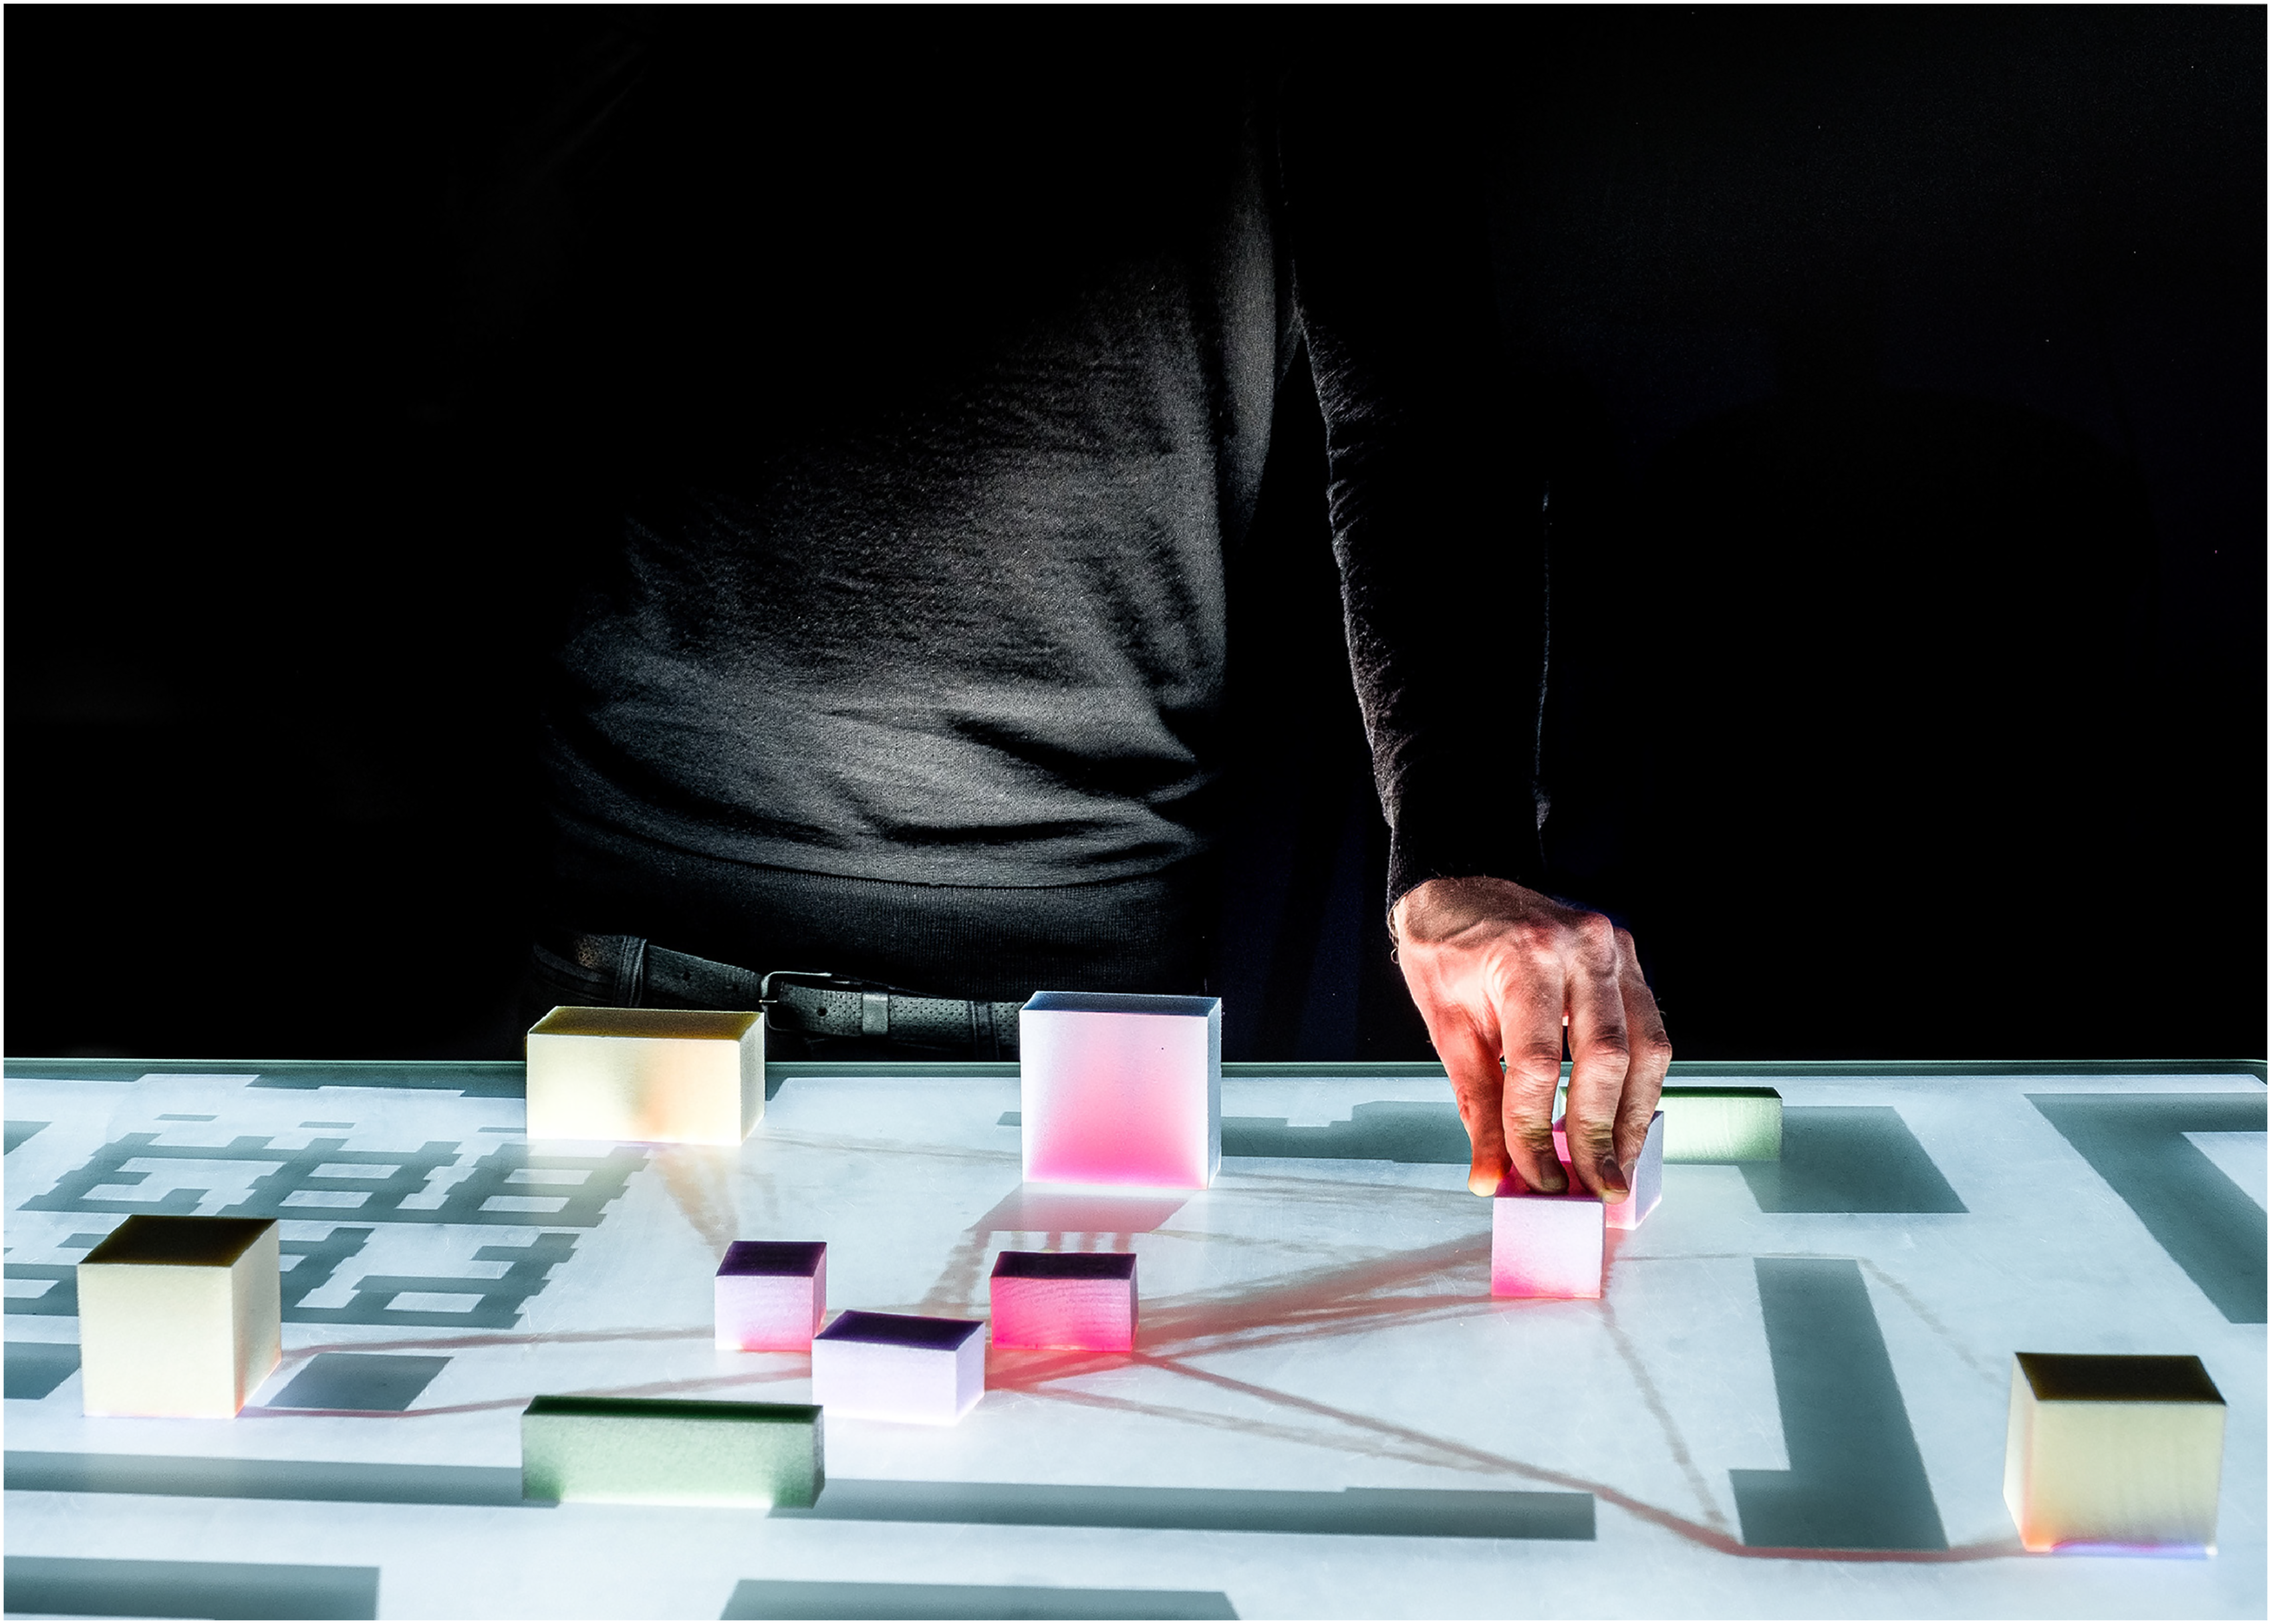
Reduction to Benchmark Scenarios
While the geometric setup defines the examined space, other settings configure the agents’ movement between entrances/exits, major and minor attractions. Conventionally, this setup entails manually assigning agents to sources, several intermediate targets, and main targets. However, such extensive parameters often are unavailable or insecure in the early design stages. 16 In a study on energy evaluation tools, Attia et al. 17 suggest that un-intuitive user input often overcharges designers as well as laypersons. Therefore, he argues that the early design stages instead profit from “benchmarking and the possibility to compare alternatives” than “evaluating absolute values.” 17 Hence, we simplify and condense the complicated simulation setup to few crucial “benchmark scenarios.” This allows the examination of a design variant from few crucial perspectives. This strategy is also followed by Roetzel, 16 who reduces the complex calibration of occupant behavior to a best and worst-case scenario in the early design stages. Instead of these extremes, we test design variants against foundational movement patterns: entrance, exit, and stay. Thus, we reduce the effortful configuration of way paths to three foundational scenarios. Instead of accurate quantitative results like evacuation time or absolute building performance, the simulation contributes spatial information about pedestrian movement, comfort, and safety.
Based on this scenario selection, the plugin of the Design Platform interprets recognized design objects as specific simulation objects—agent sources, intermediate targets, main targets, and barriers: During an entrance scenario, agents spawn at an entrance/exit, move toward the minor attractions, and finish at the main attraction. An (emergency) exit simulation interprets main attractions as starting points and the entrance/exit as the target—all other objects become obstacles. During a stay scenario, agents start at the entrance/exit, move toward minor and major attractions and finally return to the entrance/exit.
From this classification, we generate way paths automatically: A recursive algorithm creates several branching paths from each source. Based on a list of unvisited targets, their “attraction” (the physical object’s height), their distance, and a minimal amount of targets to visit, the algorithm semi-randomly weights different targets and composes a list of targets for each agent. As soon as the Design Platform recognizes a source and a target, it automatically generates way paths and spawn intervals. These intervals are created for an extended interval of 8 h— so that a complete simulation run would depict 1 day, which is divided into 48 spawn intervals of 10 min.
Visualization
In a study on design simulation in the early design stages, Attia et al. describe several requirements to embed simulation results in the early design stages. They suggest that analytical results must be presented intuitively and directly in the design context.
17
The simulation must provide responsive feedback to be informative during the decision-making process.
17
Furthermore, conventional simulation results are hard to interpret for laypersons and even for designers. Therefore, we need to scrutinize visualization methods that are intuitively understandable in the planning context. Instead of accurate results, they must indicate design problems and provide spatial suggestions. The Design Platform allows the presentation of simulation results on the table: They directly augment the design model (see Figure 6). Hence, results are well visible for all collaborators. Furthermore, the relationship between input adaptations and simulation output is comprehensible. The visualization of simulation results directly augments the design model. Clouds of congestion events agglomerate between sources and targets.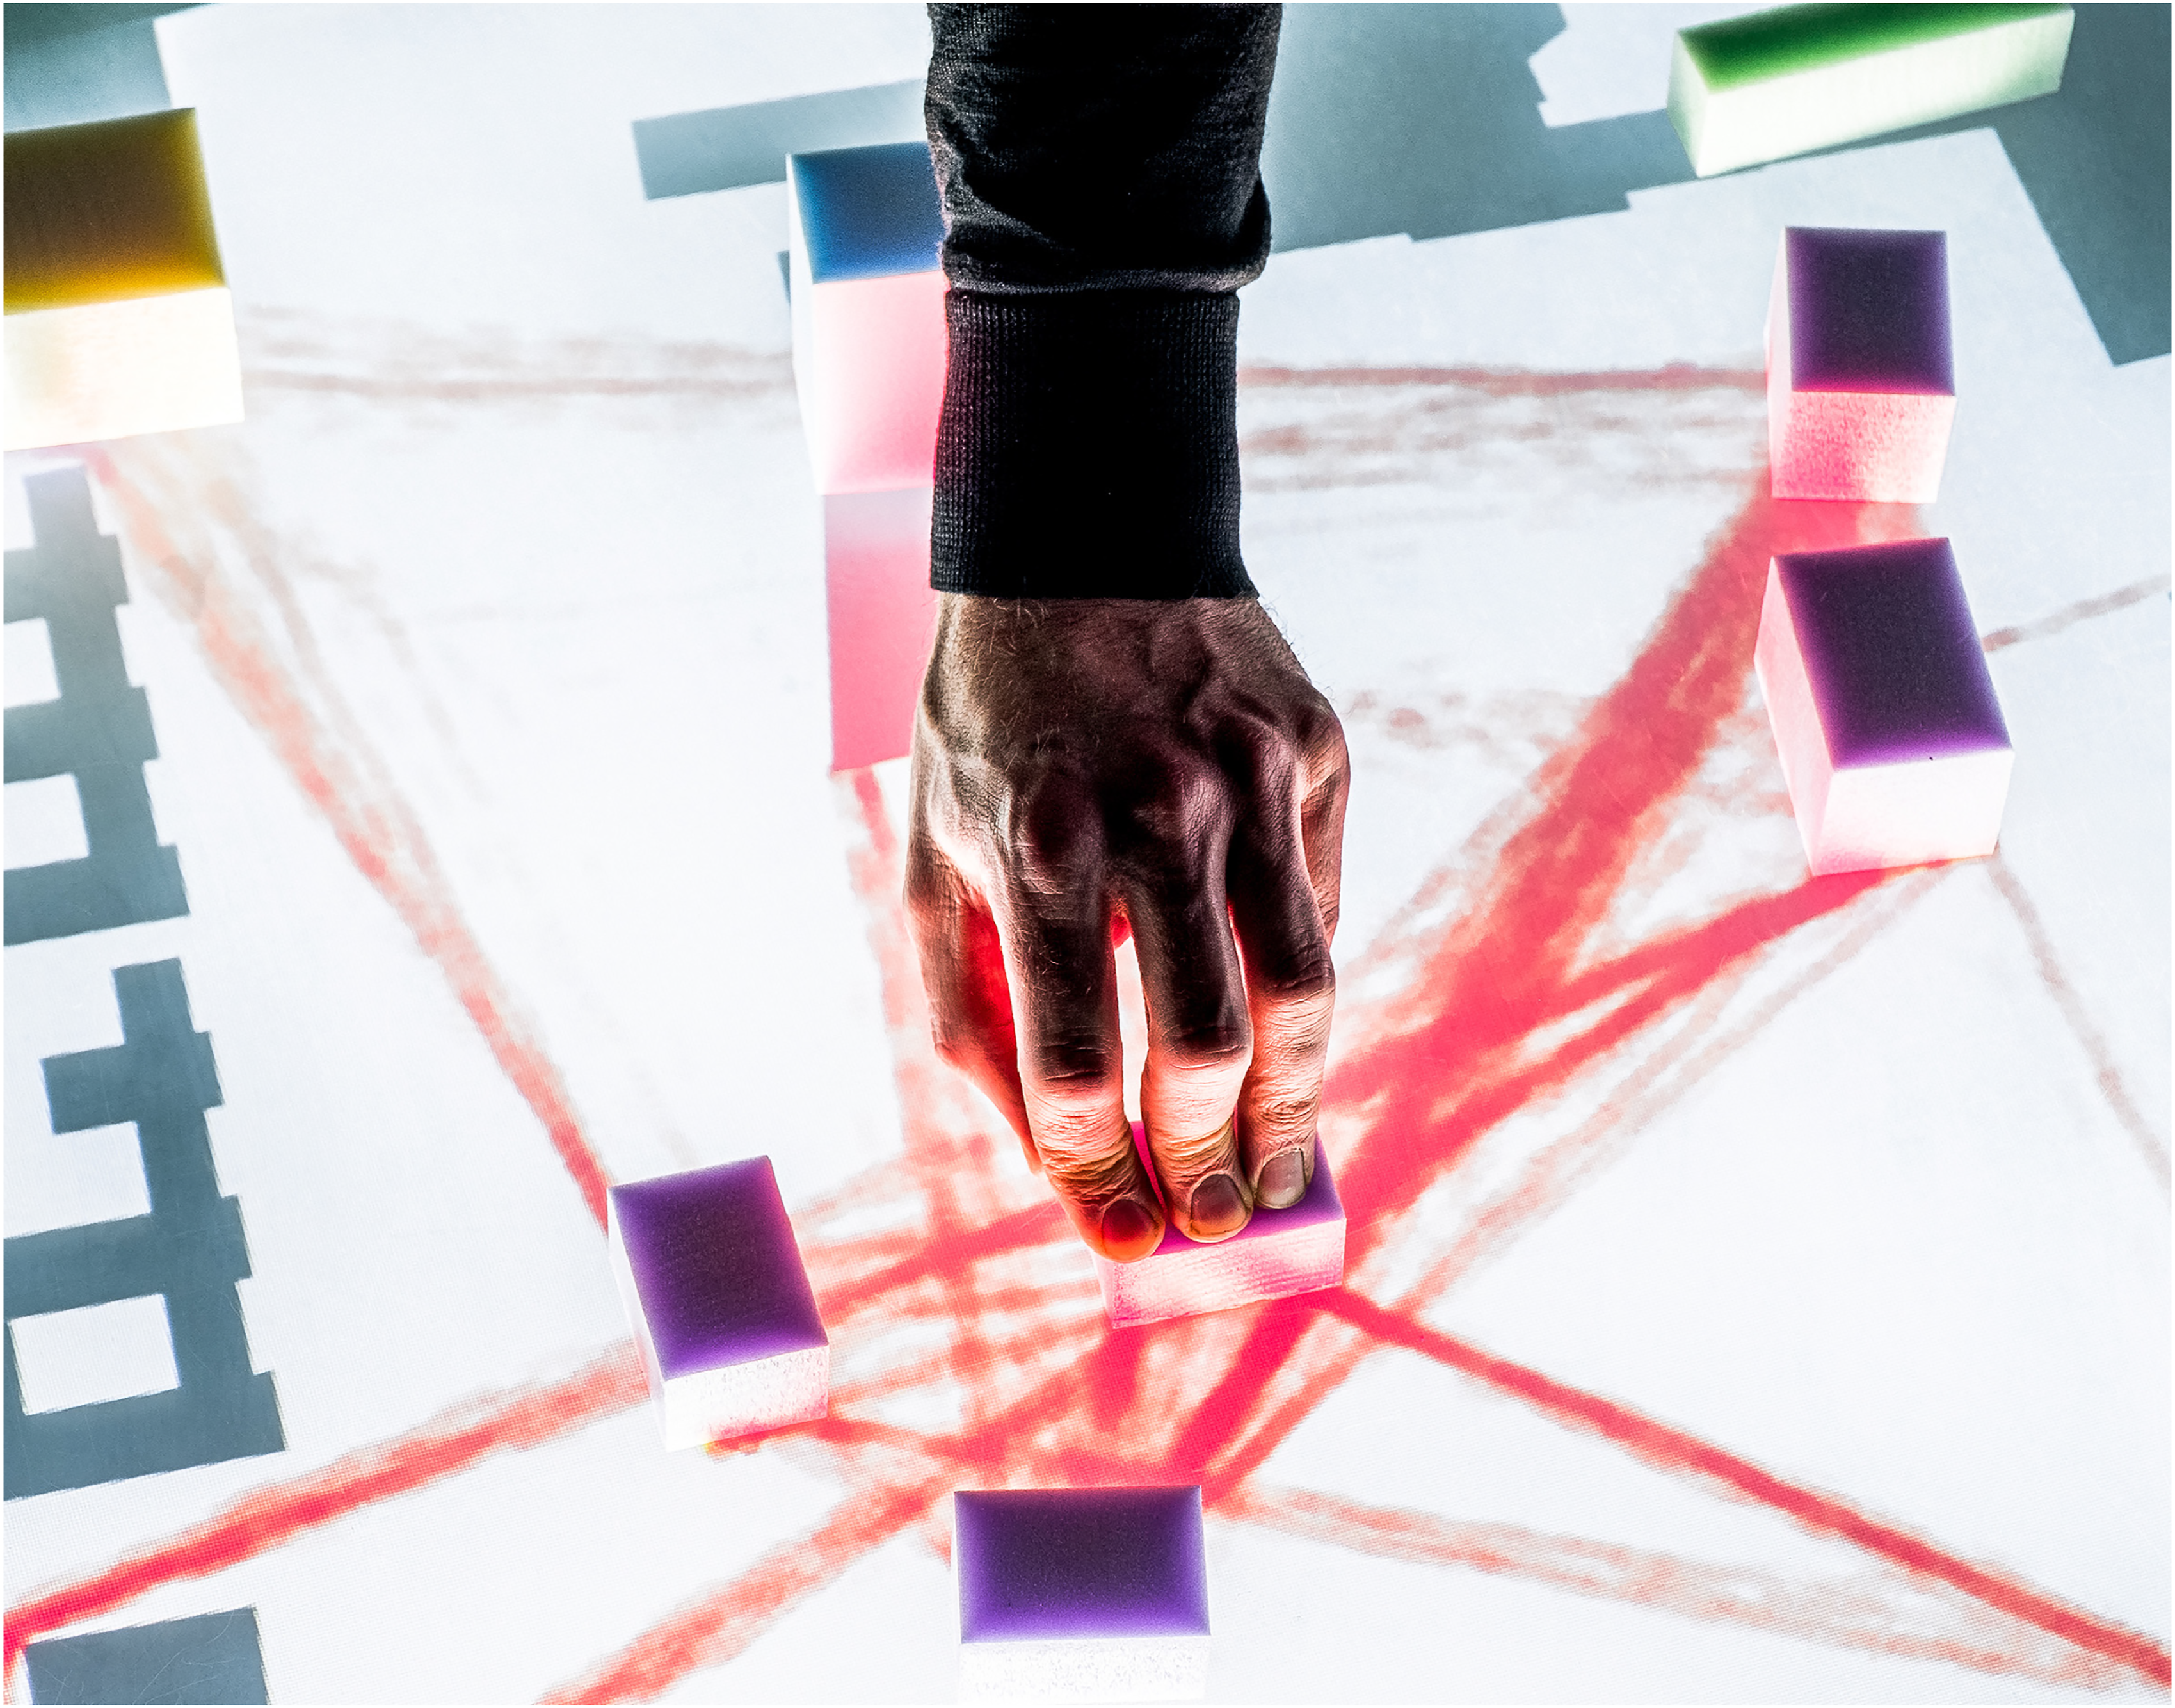
In the chapter “Simulation,” we have shown how to achieve continuous stream of results. For each simulation step, an XML file containing all agent positions is provided. Since this format is not intuitively readable, we explore visualization methods to support the planning process. Furthermore, we discuss how to generate preliminary ad hoc results as responsive feedback.
Heat Cloud
Absolute numbers and precise graphs are not directly related to the design context and cannot be interpreted easily as planning suggestions. 17 Furthermore, they imply a sense of definitiveness, which is inappropriate for the contingent exploration of design variants. Thus, we need to engage critically with the topic of visualizations to make pedestrian simulations relevant in collaborative situations. Simulation results need to be selected and translated regarding the key factors of our benchmark scenarios. Instead of absolute numbers, Roetzel 16 suggests representing complex processes by “ballpark figures” to make results comparable to other quantitative and qualitative criteria. Following this perspective, designers should receive spatial information that is commensurable with the design process.
The visualized indicator must represent different design targets relevant in our benchmark scenarios: pedestrian comfort, safety, velocity. Thus, we introduce the “Level of Service” indicator, which is a foundational concept in traffic planning31,32 and relates density with velocity. 33 Therefore, it concerns pedestrian movement, comfort, and safety and is relevant in all three benchmark scenarios. Five Levels of Service are differentiated, ranging from a free flow of pedestrians to potentially dangerous congestion. 34
This information must be presented spatially and directly in the design model. Crowd movement patterns become visible and spatial issues like bottle-necks or building performance can be discussed. Classical visualizations for crowd flows are “animated agents,” “movement paths,” and heatmaps (see Figure 7). Following the moving agents gives an immediate insight into the simulation. However, it is hard to compare relevant features such as the velocity and density at different locations. “Movement paths” display each agent’s trajectory as a curve and reveal general movement patterns. Other information like density and dynamic factors stays incomprehensible. Lastly, heatmaps represent average values in a discreet areal grid. Thus, they can depict various information types such as occupancy, significant congestion, or “frustration.”
35
In the design process, heatmaps demonstrate potential problems and make different areas easily comparable. Nonetheless, the areal discretization is not ideal for the representation of fluid crowd movement. Furthermore, covering the entire simulation space with a heatmap may allege a false sense of completeness when only preliminary results are presented. Visualization approach: Classical display methods for crowd simulations are combined. The Heat Cloud correlates information on agents’ movement, their trajectories, and local pedestrian densities.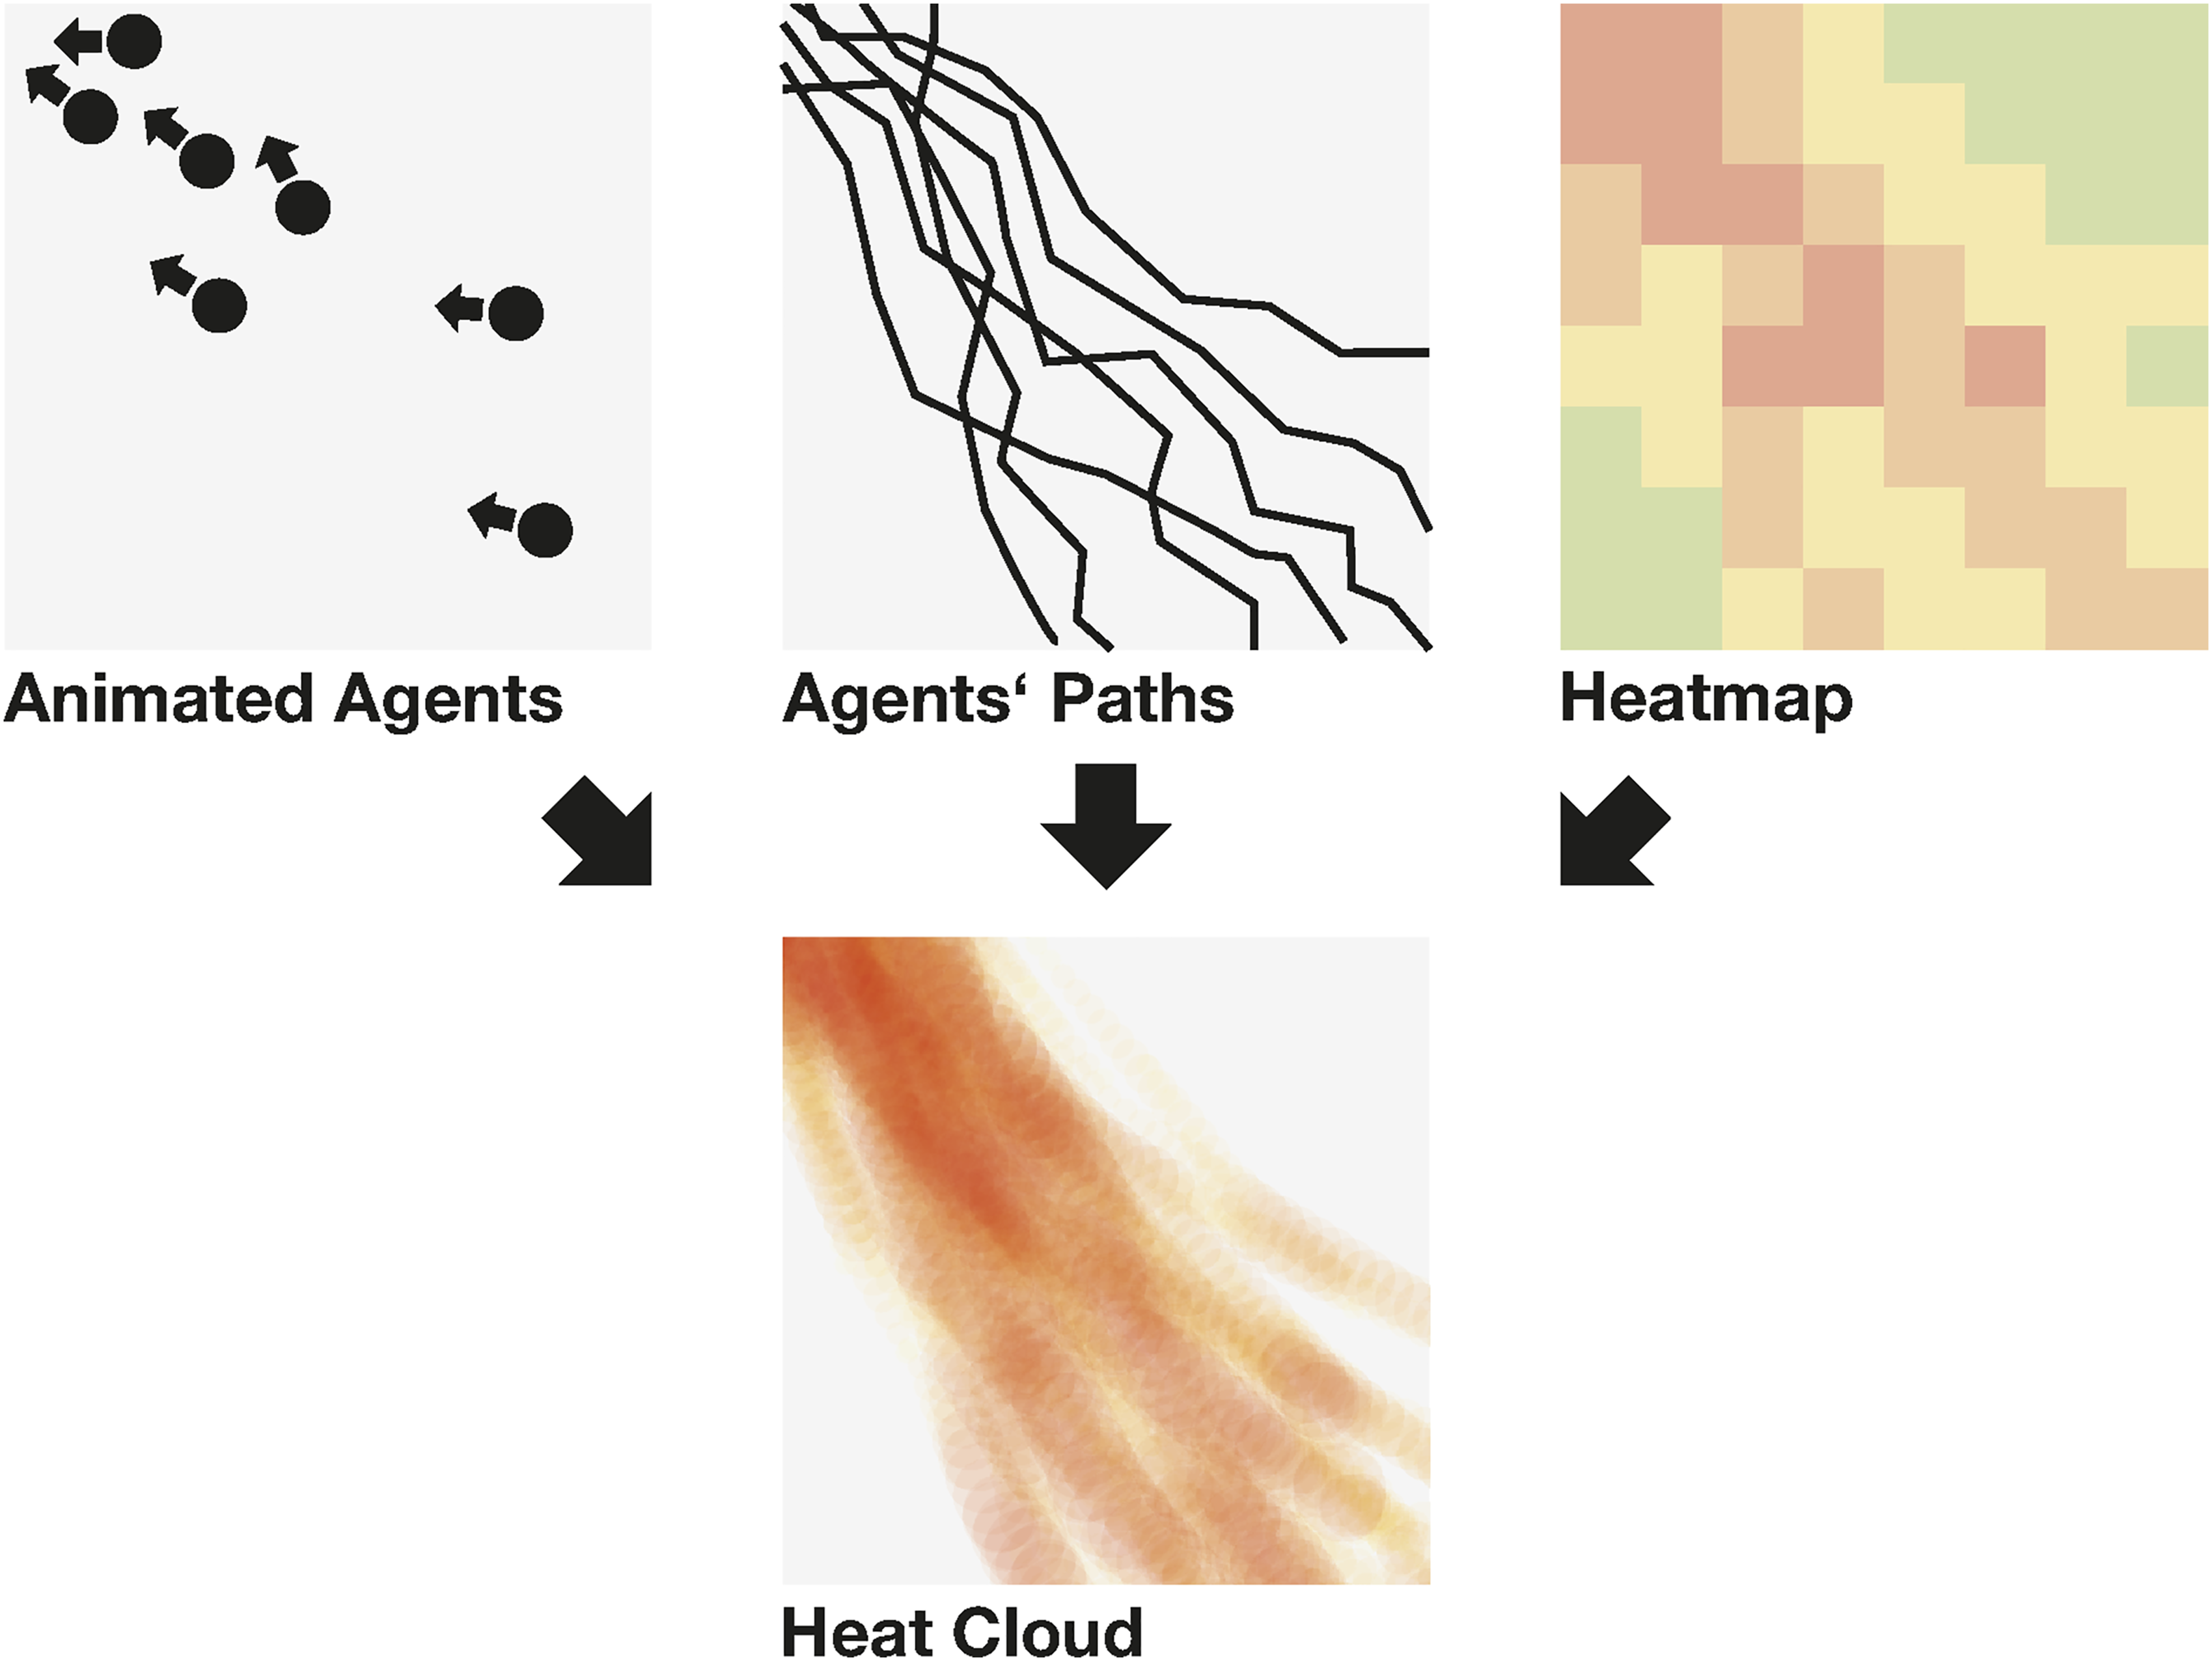
The reviewed visualization methods reveal different relevant aspects of crowd movement. However, switching and comparing them is complicated and confusing. For this reason, we combine these approaches to a “Heat Cloud” visualization, which presents the Level of Service indicator, as well as spatial crowd dynamics (see Figure 7).
The protocol communicates each simulation step to the plugin on the client side. For each agent, the number of agents in a radius of 1 m is counted. This result signifies the local pedestrian density and the agent’s respective Level of Service. When the agent is congested, its position is added to the Heat Cloud. Instead of generating a heatmap over the entire design space, the Heat Cloud stores one point for every congestion event. They appear as tiny spheres in a hue representing the congestion level: Low densities (1 person) are yellow, while red represents grave congestion (6 persons). This visualization method not only demonstrates problematic areas but also reveals the crowd dynamics leading to these situations (see Figure 8). Mockup of the Heat Cloud: The visualization method gives insights into movement patterns as well as pedestrian densities in the design context.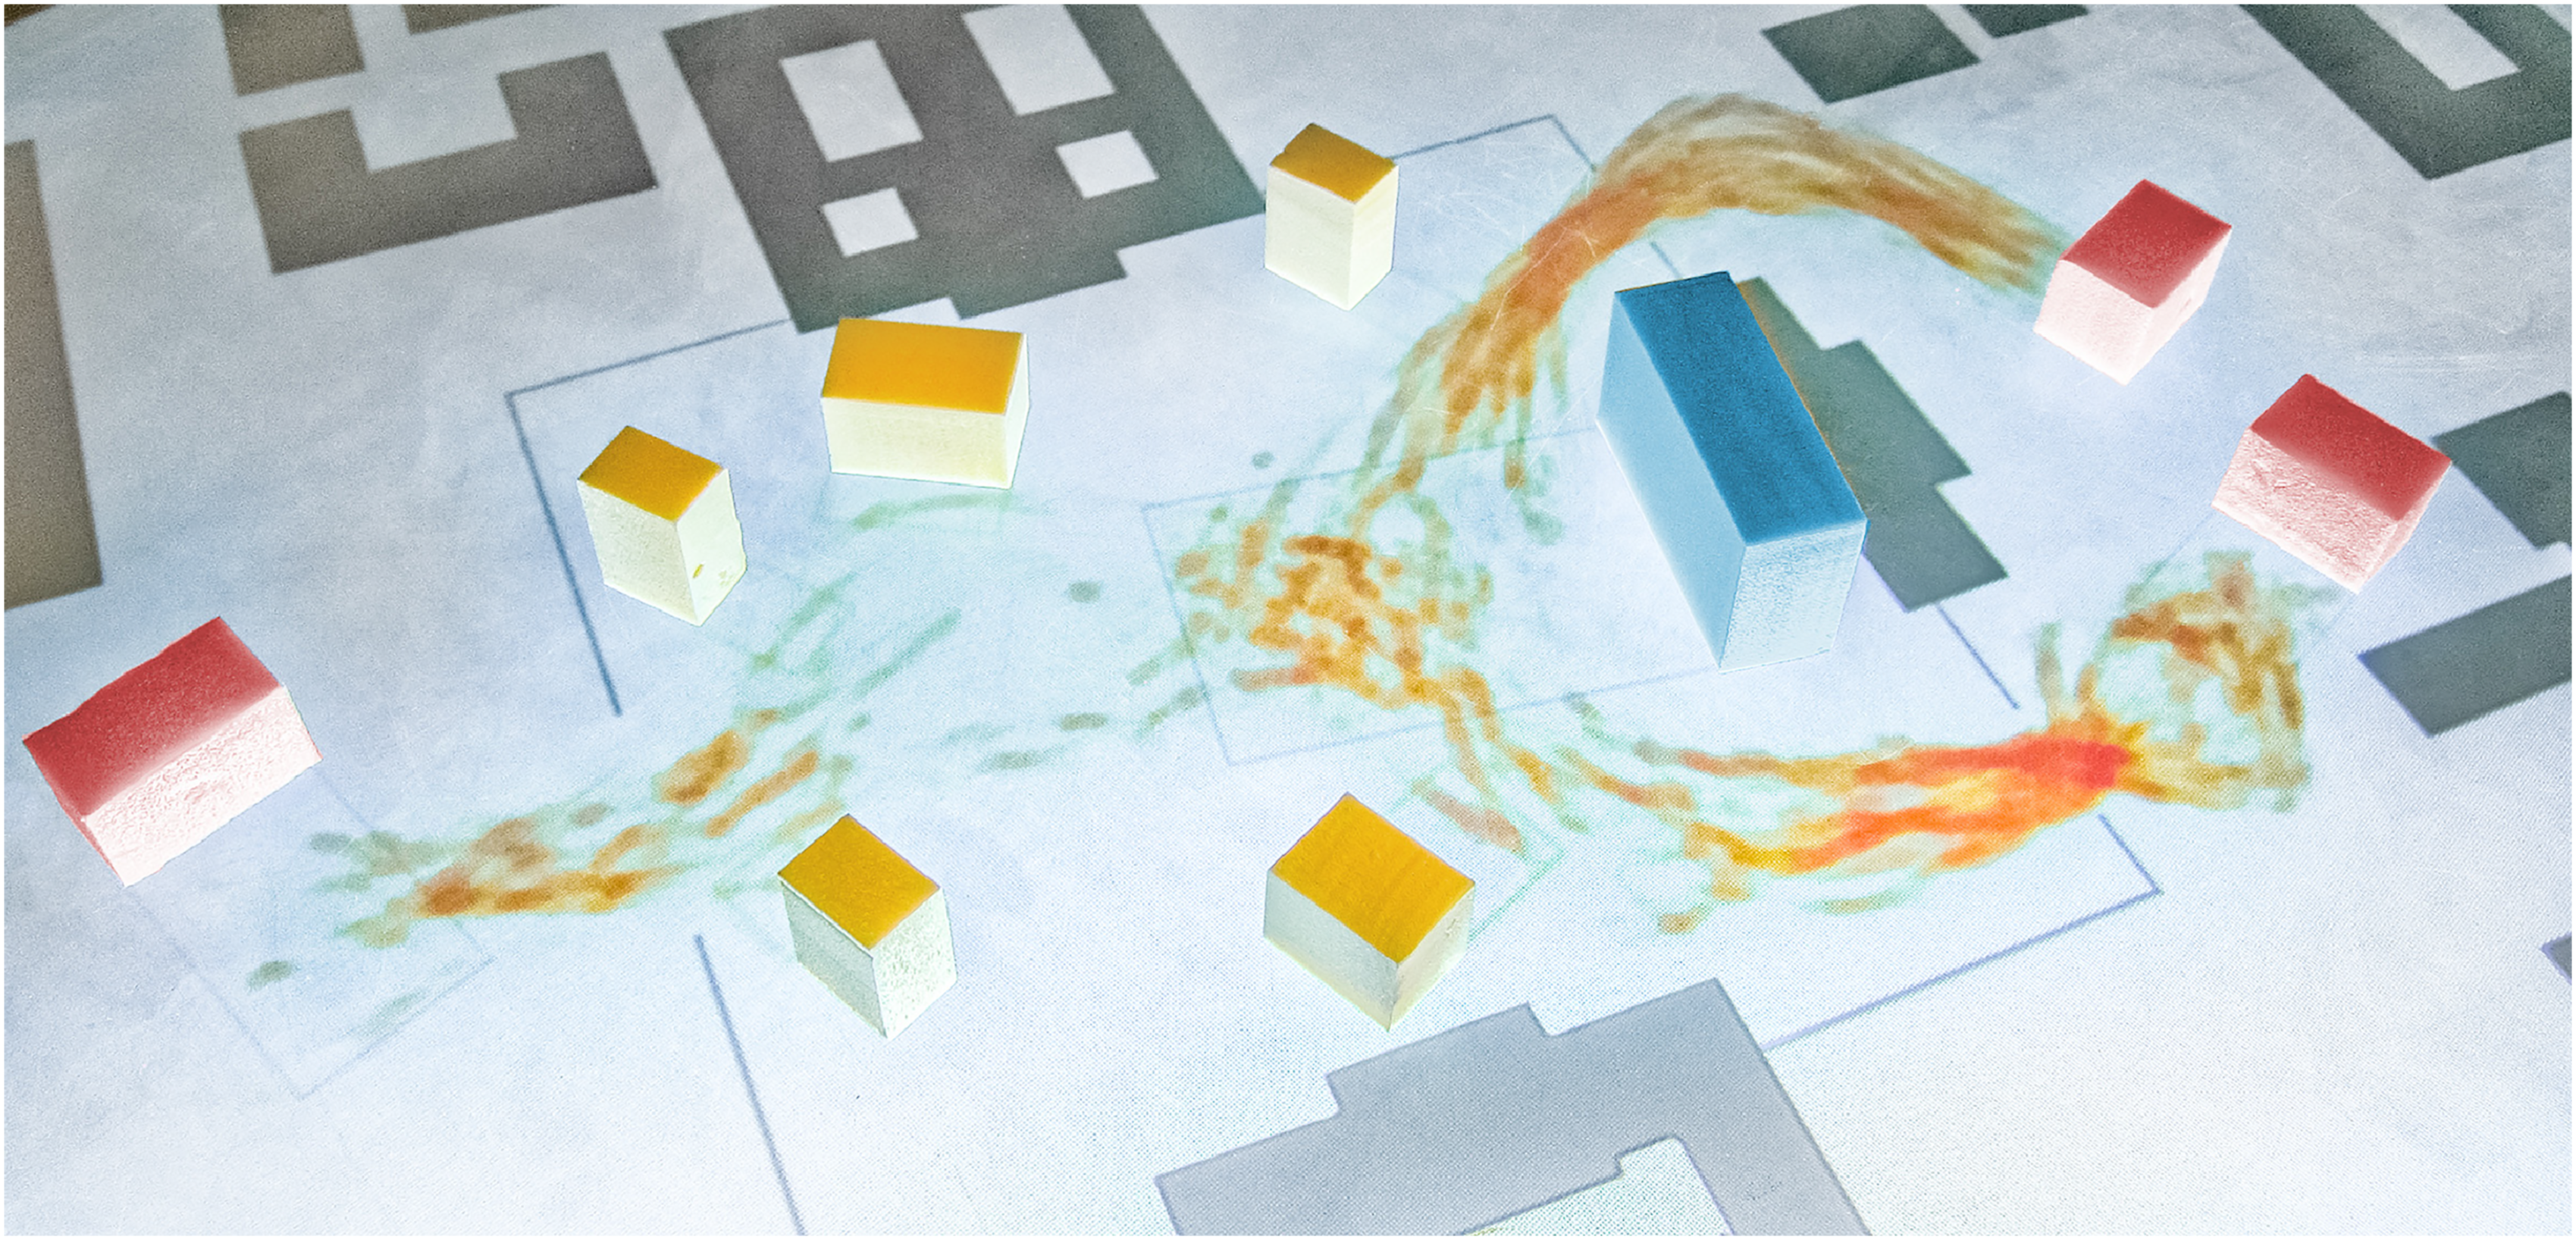
As soon as more than one simulation step is calculated, each sphere is rendered with transparency equal to 1/n, where n is the number of simulation steps already received plus 1. The transparency range is defined from [0, 1]. This approach allows increasing the resolution of simulation results gradually. After a simulation restart, initial events indicate problematic spots and soon conglomerate to finer-grained patterns.
While the Level of Service concept categorizes congestion events on an absolute scale—making it easier to understand the gravity of each event—the events’ relevance is relative to the simulated time. By this, we avoid a false sense of exhaustiveness.
Display of Preliminary Results
The Heat Cloud is refined more and more with each simulation step. Depending on the size of the scenario, however, the simulation does not deliver responsive feedback. However, early decision-making processes entail experimental and frequent interactions. This open-ended and contingent solution finding must be supported with instantaneous feedback. By this, simulation results become a hint for tentative design adaptations and support agile problem-solving. 18
Studies concerning solar models in the early design stages propose using multiple calculation processes of varying accuracy—and therefore computation time. 20 Thus, the first results can be visualized ad hoc and are replaced with accurate feedback later. Besides the step-wise calculation of agents’ movement, the pedestrian simulation entails two additional processes: The generation of way paths (see chapter Interactions) and the calculation of navigation fields.
These way paths are calculated on the client side and are available instantaneously and independently from the simulation process. These polylines connecting the agents’ targets can be subdivided with respect to the agents’ step length and indicate “virtual” agent movement (see Figure 9: step 1). This gives the first impression of global movements and density. Before the first simulation step, the model creates the navigation field which directs agents toward their targets. Based on this field, the first estimation of pedestrian movement can be refined (see Figure 9: step 2). As soon as the server returns the actual simulation steps, these virtual positions, which do not take into account interactions with other agents or complex locomotion, are updated (see Figure 9: step 3). By this, the model responds immediately with initial results and refines the output successively. Thus, it answers design interactions directly with first hints instead of interrupting the collaboration with passive waiting time. Based on the results of the initial calculation steps—targets, navigation, and intermediate movement steps—preliminary feedback can be presented. User interactions entail responsive feedback, which becomes more accurate step by step.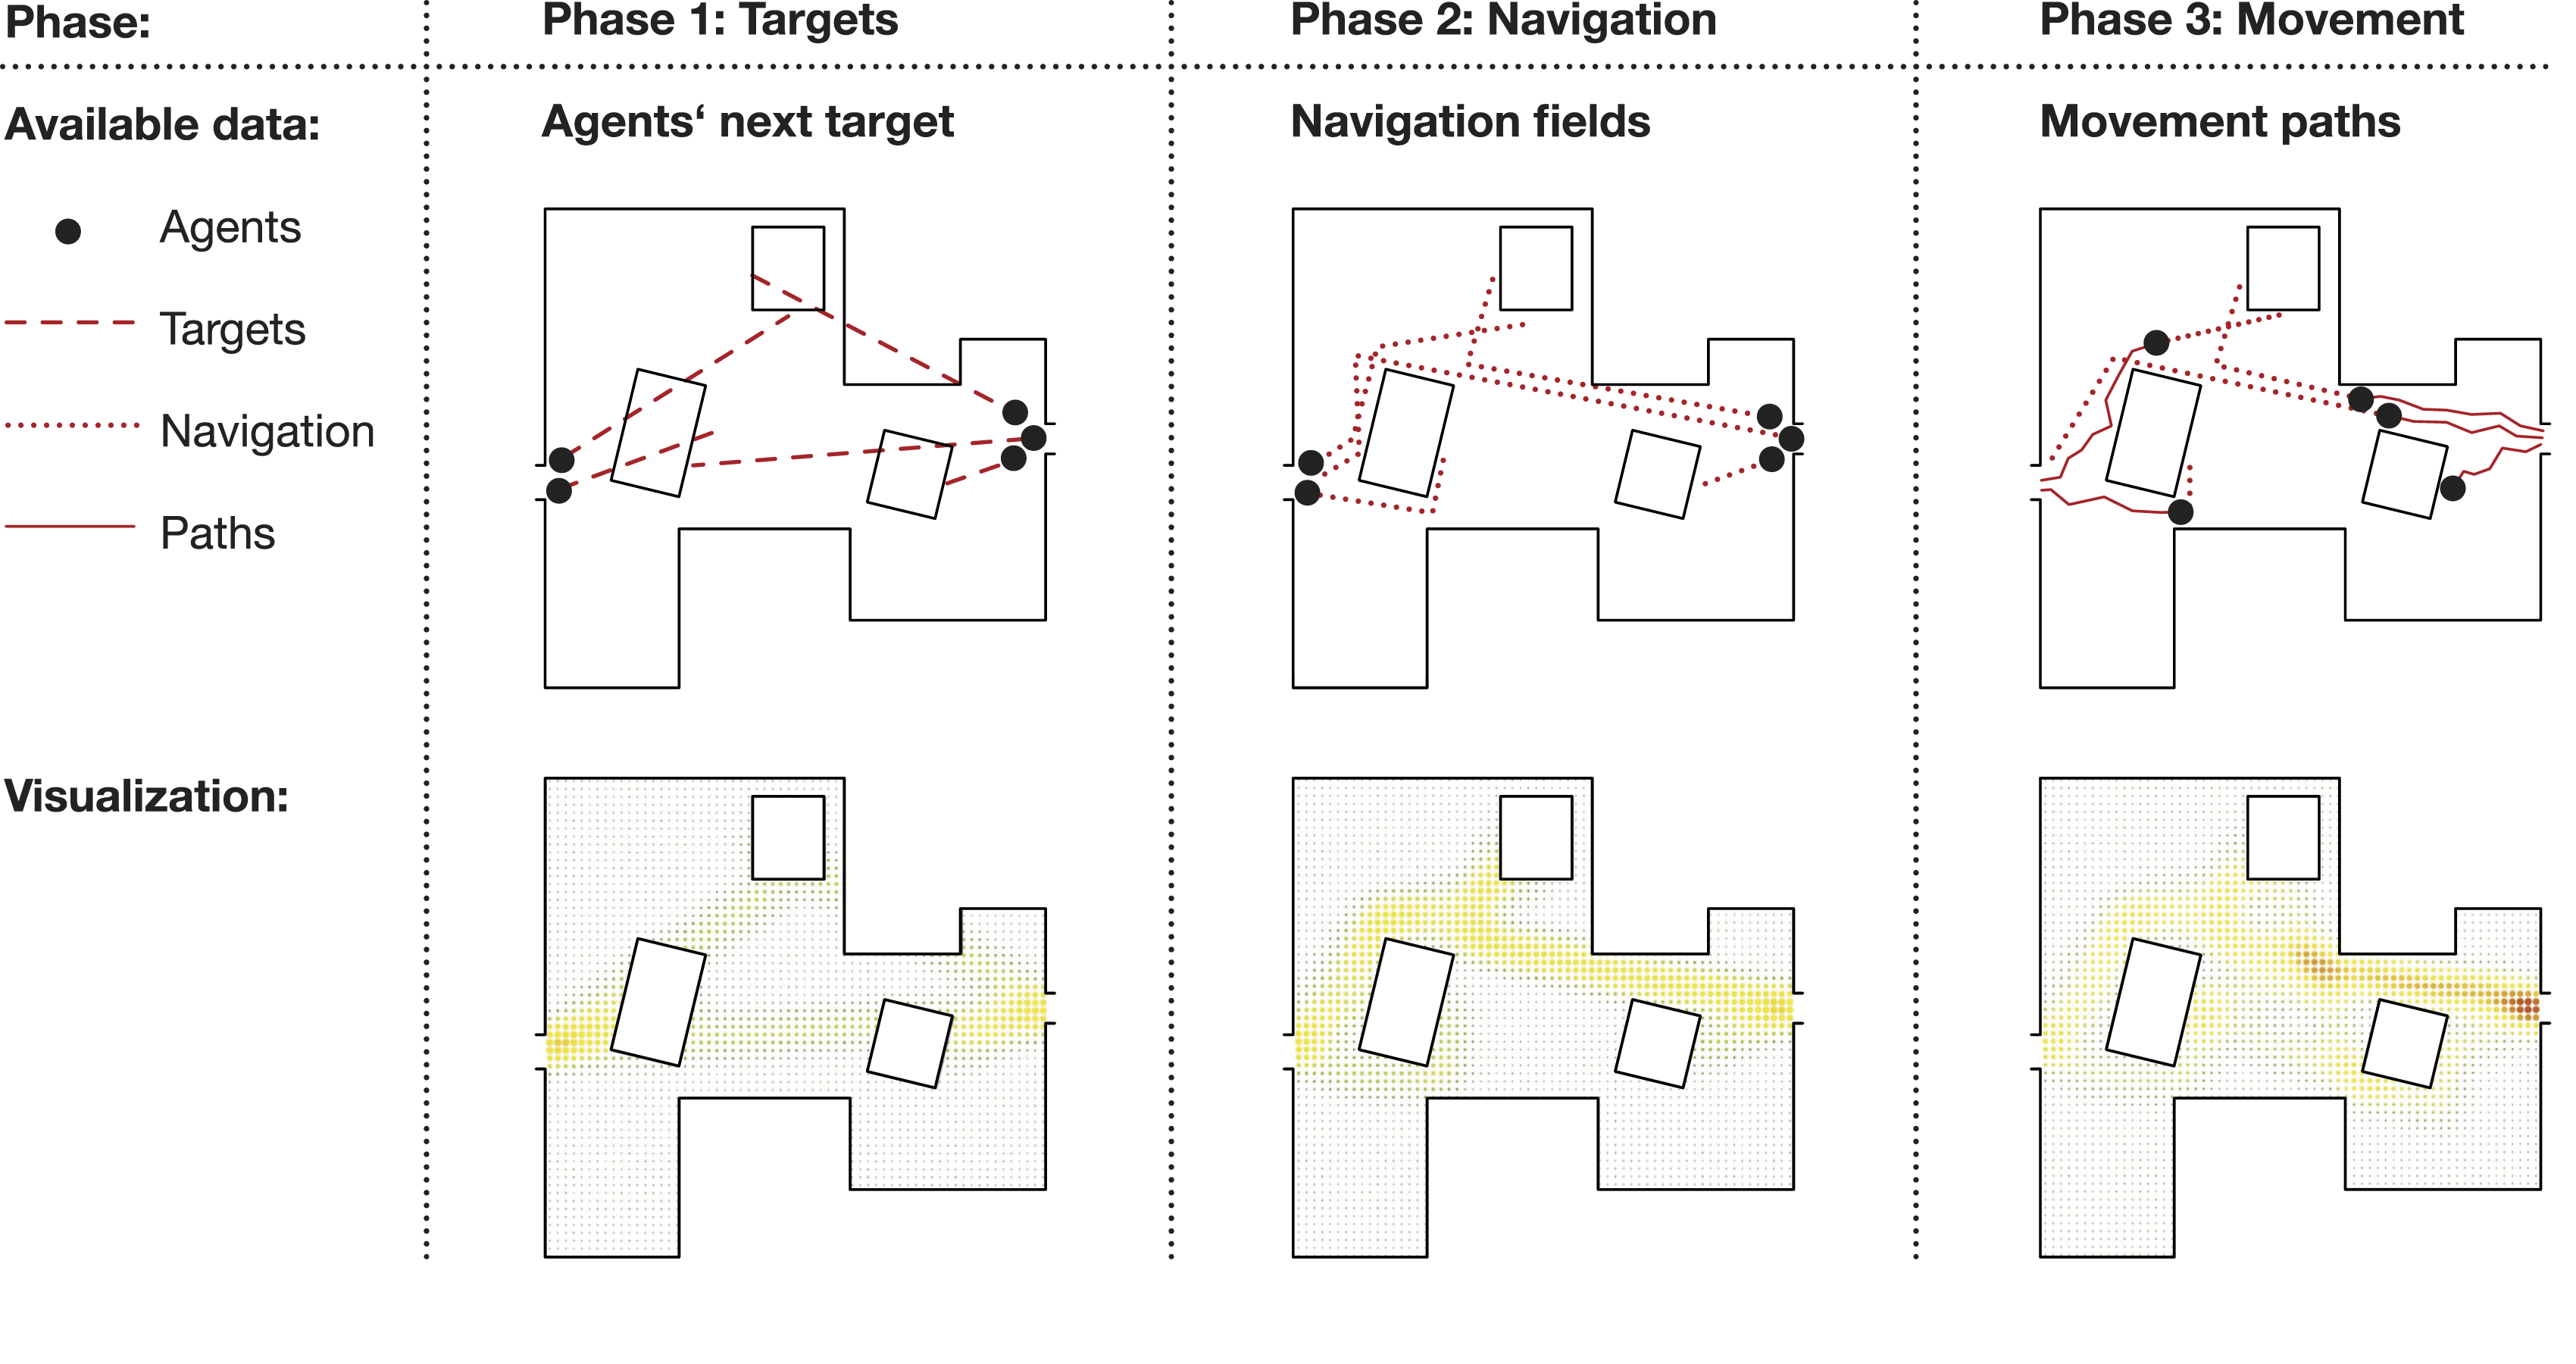
Evaluation
We have described concepts to integrate pedestrian simulations as collaborative tools using design interactions as simulation input and reacting with direct and instantaneous feedback. We delegated computation heavy calculations to an external server, adapted the simulation process to dynamic design situations, and examined appropriate and responsive visualization methods. Consequently, we conduct a technical evaluation of this prototype, focusing on its performance in relation to design interactions.
Regarding the meaningful and non-interruptive usage of simulations in collaborative processes, we scrutinized the following questions: When is an interaction answered with relevant feedback? Where in the proposed server–client configuration emerge delays? Can these delays be compensated through the concepts elaborated in the earlier chapters?
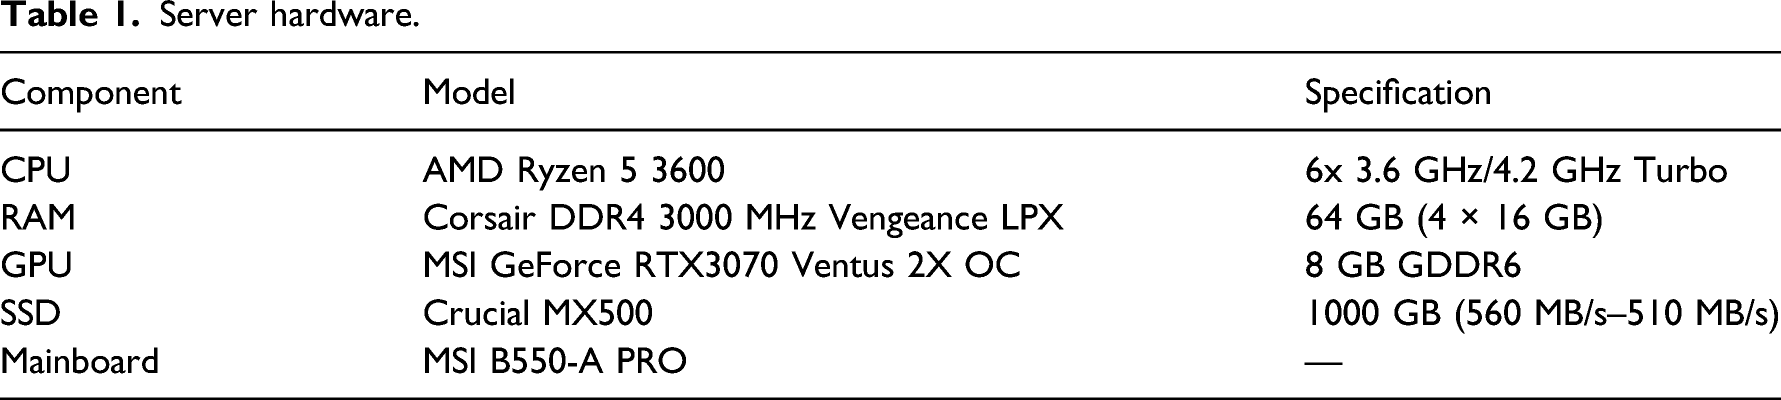
Server hardware.
Client hardware.
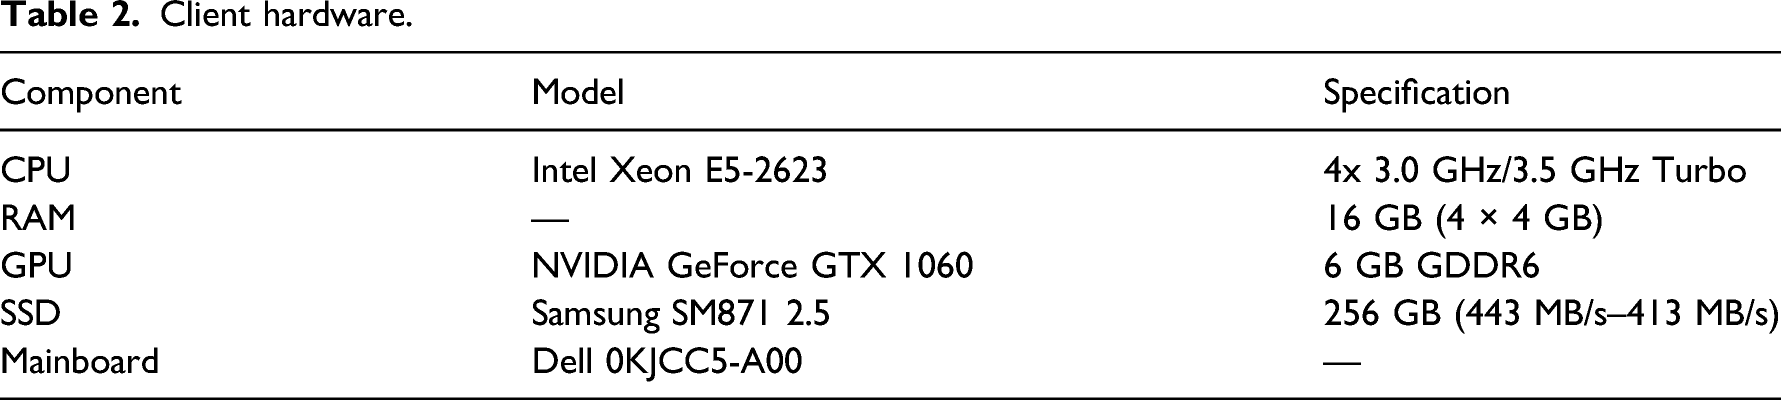
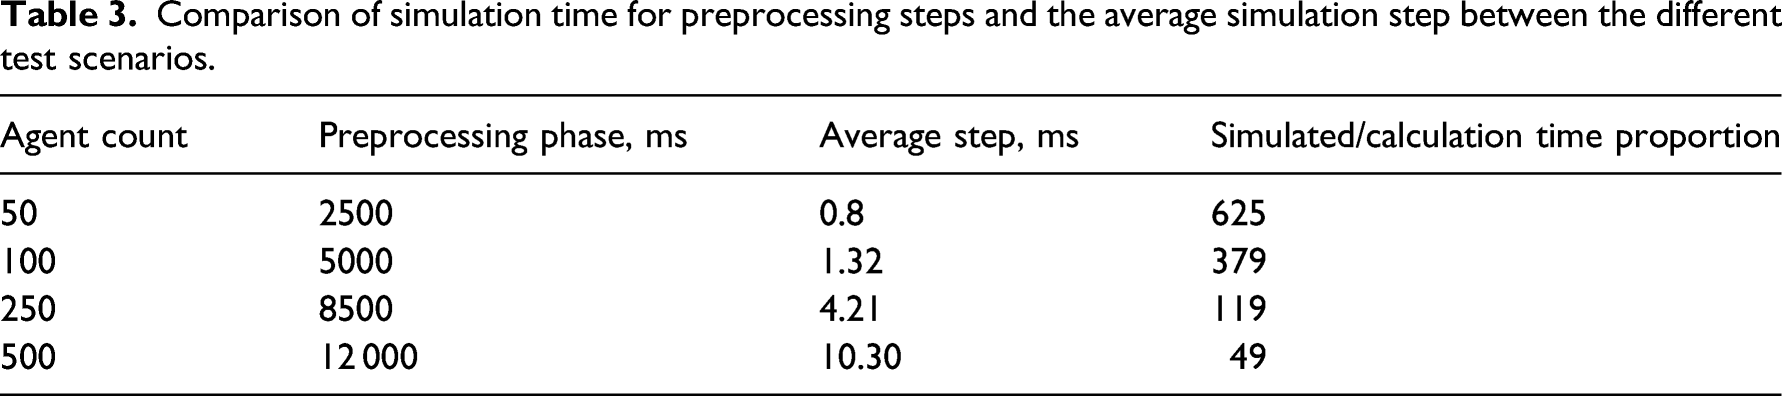
Interactions with the physical objects of the Design Platform entail a change in the simulation settings. These are communicated via the protocol, which initializes a new simulation on the server-side. As Figure 10 shows, this initiation causes a significant overhead for the server performance. These preprocessing steps include creating the navigation field as well as the allocation of memory needed for the simulation’s overhead. In total, these steps took between 2500 ms and 12,000 ms for the described test scenarios (see Table 3). Server computation time per simulation step for four test scenarios: The first computation-intensive steps are part of the initialization, while the following, faster steps represent the agents’ movement. Comparison of simulation time for preprocessing steps and the average simulation step between the different test scenarios.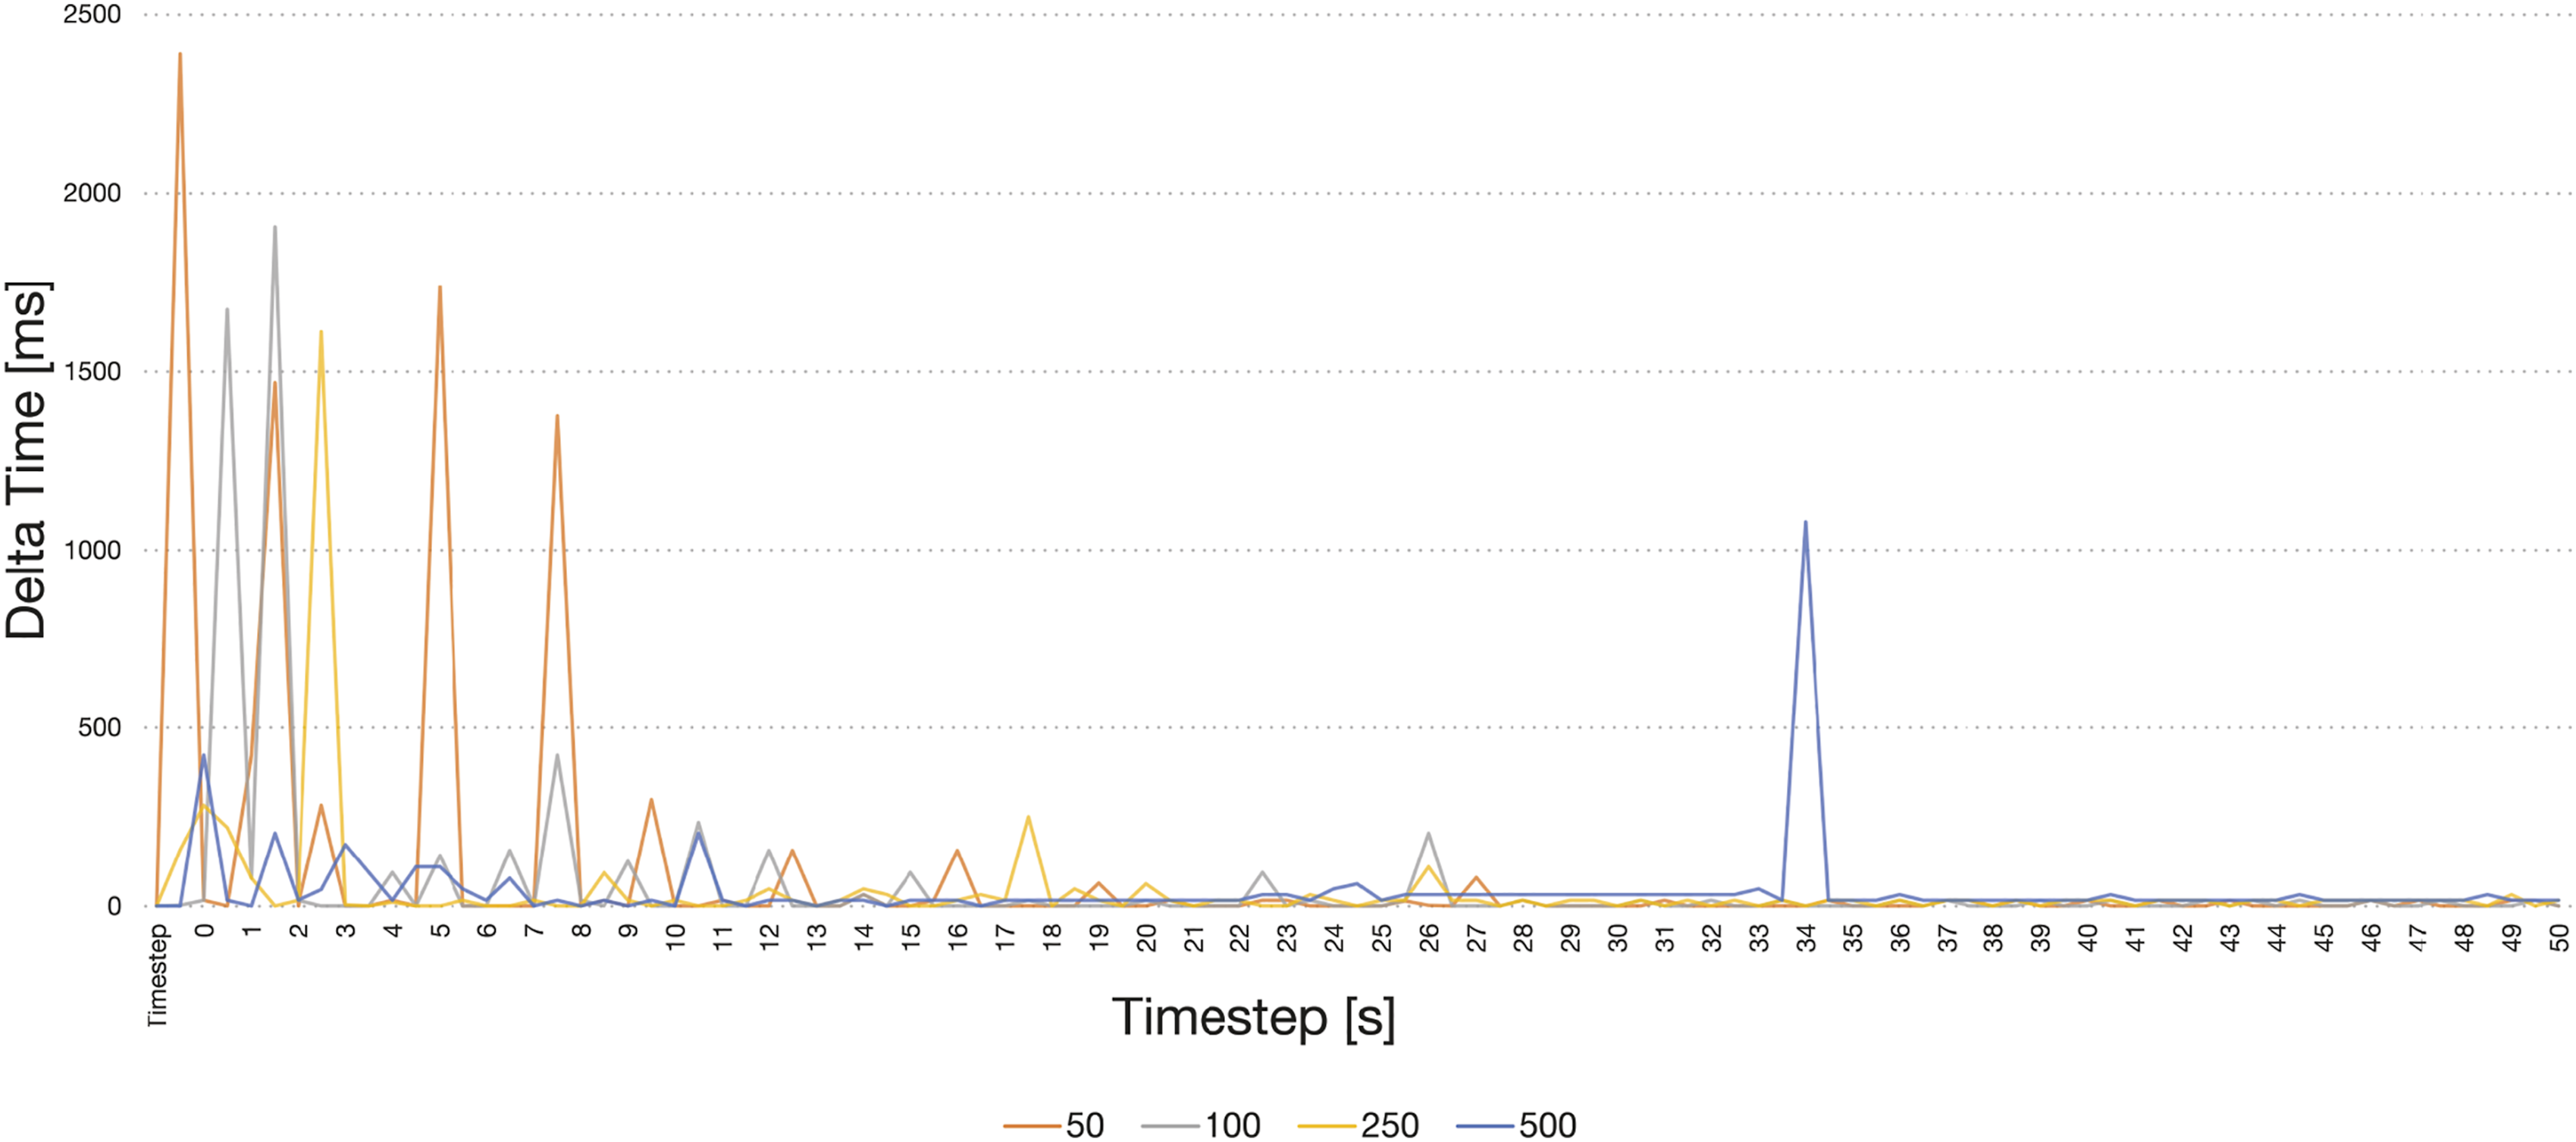
This interruption of several seconds after each interaction represents a problematic break in the user interactions. Therefore, initial feedback is given using the agents’ targets (as described in the Visualization chapter). Because this information is generated on the client side, it is instantaneously available as feedback. This displayed tendency bridges the gap until simulation results become available.
After the preprocessing phase, the server simulates the agents’ movement round-wise. In the scenario with 500 agents per spawn interval, one timestep was computed in 10.52 ms on average with a deviation of 11.18 ms. Consequently, a full-day simulation of 8 h requires around 600 s to complete. In comparison, a simulation with only 250 pedestrians spawning in regular intervals would require 256 s since it has an average computation time of 4.45 ms per timestep. We observed some additional delays during the first few steps due to the lazy initialization of simulation parts. Figure 11 indicates that the computation speed of each step linearly correlates with the number of agents in the simulation: The computation time for one step is given as f(x) = x*0.02 where x is the number of currently active agents in the simulation. This limitation stems from the simulation software used, which does not fully exploit multi-core machines and largely depends on the java virtual machine configuration setup. Dependency Comparison between active pedestrian agents and computation time per simulation step: The partial graph for the fourth scenario (500 agents per spawn interval) indicates a direct proportionality.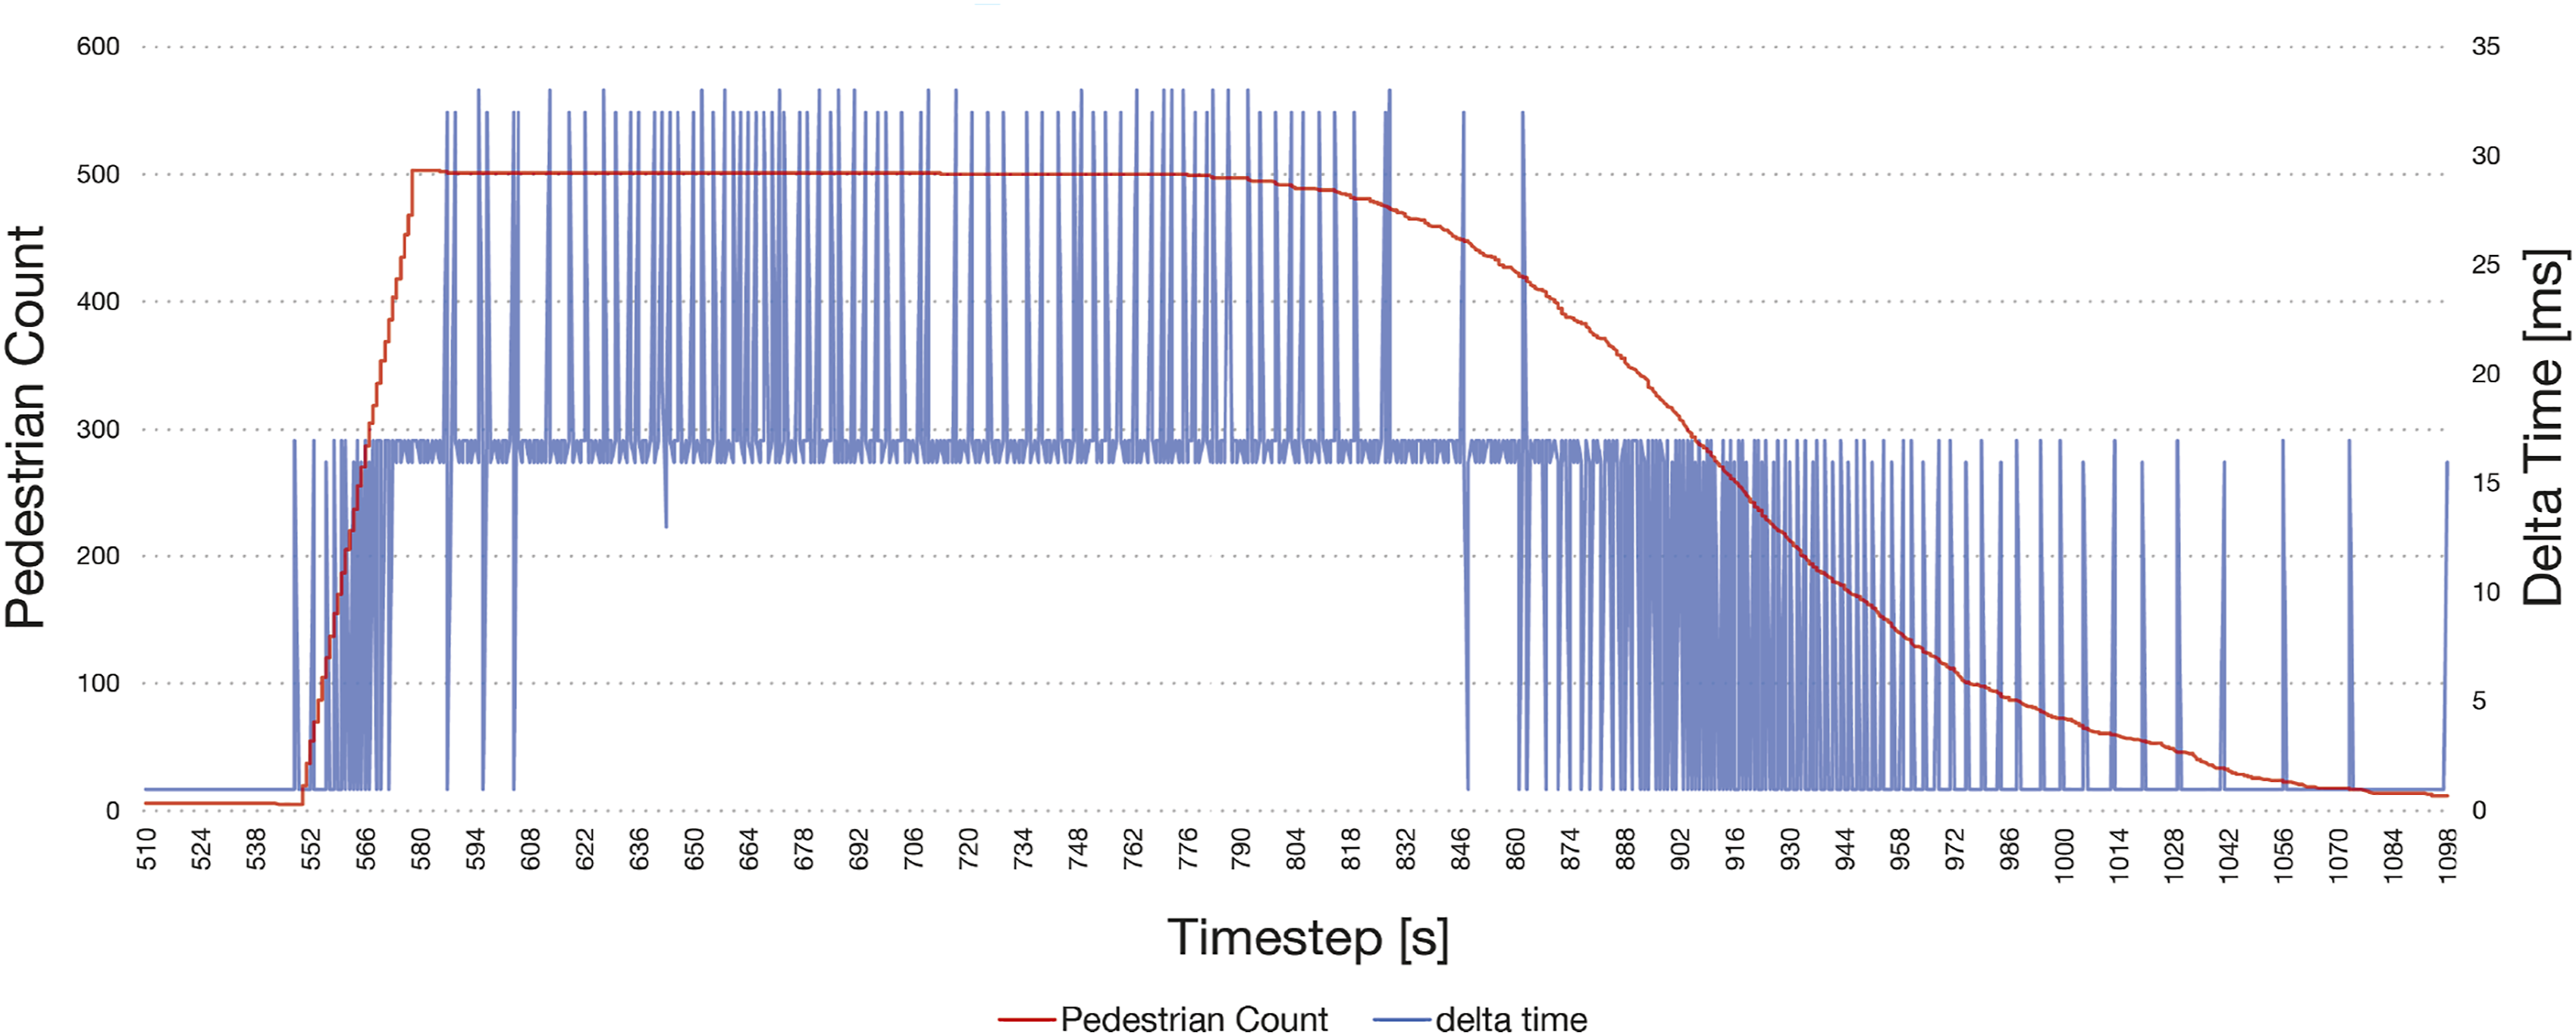
Several minutes of computation time is an unacceptable delay in the design process. Therefore, we have introduced the visualization of intermediary simulation results. After each simulated timestep, the protocol returns the agents’ movement steps to the client. There it is presented as intermediary feedback, which extends as the simulation continues. In the test scenario with 500 agents, the server simulates 1 minute of agents’ movement in approximately 1 s computation time. With an agent speed of 1.4 m/s, after 1 s of computation time, the agents moved about 80 m in the simulation space. Since the agents are initially distributed between the sources and targets (as described in the Simulation chapter), results for the whole simulated area become available fast. This feedback could be enhanced through visualizations based on the navigation graph, which is available after the preprocessing phase (as discussed in the Visualization chapter). However, this visualization method was not part of the technical evaluation.
Finally, we measured the protocol performance on the client side. Figure 12 demonstrates that the server requires a similar time as the simulation to receive the results for each step. Consequently, the protocol itself introduced no detrimental overhead in the communication process. The most significant disruption of the simulation occurred due to small instabilities in the network connection, which appear as the random peaks in the graph. Client side processing time of received simulation steps, including data transfer from the server. Compared to the server computation time, no significant delay is noticeable.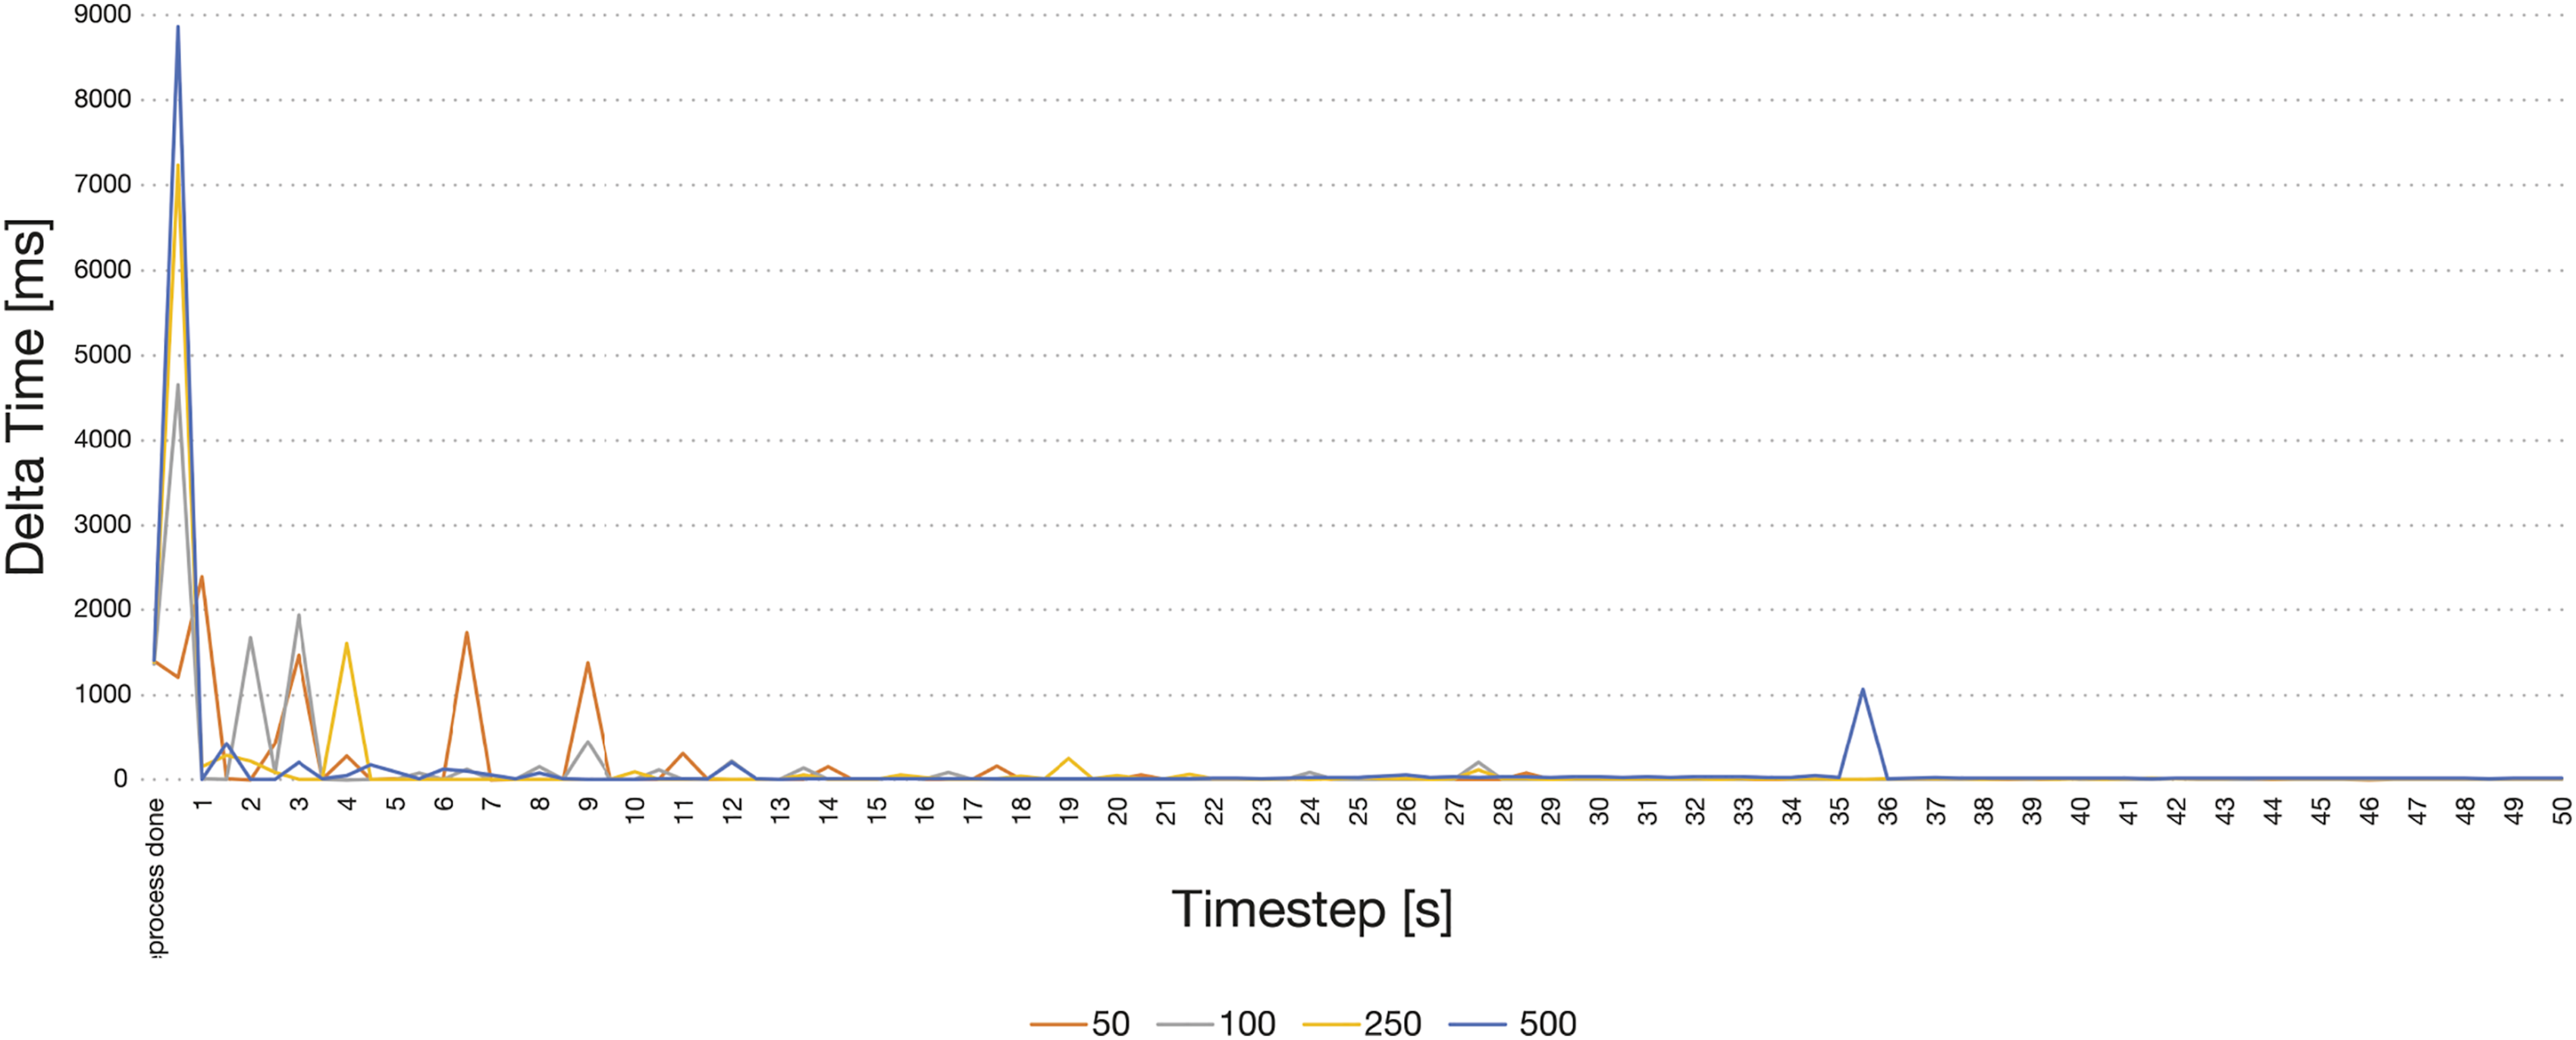
In conclusion, the initialization step causes a delay of a few seconds, which can be compensated by visualizing preliminary results based on the agents’ targets. The following rounds of agents’ movement compute fast but still endure several minutes. We can return intermediary results as instantaneous feedback through the suggested adaptations to the simulation and the proposed visualization methods. The protocol itself causes no problematic delays. In total, this allows for real-time integration of the pedestrian simulation into dynamic planning processes.
In addition to this performance-focused analysis, the proposed methods should be evaluated in design processes in a future step. This could be achieved in collaboration with our research partner, who also consults in planning processes. Two projects could be compared—one conducted with external simulations and one employing the presented integrated methods. Besides a qualitative evaluation of the tool in collaborative situations, we could compare these planning processes and assess their progress regarding pedestrian movement and related criteria.
Conclusion
Based on the understanding of simulation as a collaborative process of generating and exploring possible design variants, this paper investigated an alternative perspective on crowd models. Acknowledging the inherent complexity of urban practices—such as the walk of pedestrians—we emphasize the necessity to include different perspectives in the reciprocal process of design and simulation. Following this sensibility, we focus on the requirements of collaborative design: intuitive interfaces, the dynamics of the design flow, and adequate presentation of inputs and results. Building upon the existing Design Platform and the simulation crowd:it we have shown how to embed pedestrian simulation in the early design stages. By connecting these elements with a communication protocol, we created an experimental setup to test and investigate the challenges and potentials of microscopic crowd simulations in collaborative design processes. The presented research makes information on crowd movement available in the early design stages. It empowers planners to integrate this knowledge into their foundational planning decisions and enhance their design regarding pedestrian comfort and safety. Thus, these criteria can be brought into accordance with other relevant aspects. Including this perspective in the initial design decisions prevents effortful changes in later planning phases.
The resulting concepts and prototypes form a foundation for further exploring the integration of crowd simulation in design processes. On the one hand, this approach could be extended by an in-depth study of the user perspective—considering collaboration and participatory design in more detail. By this, the study could specifically focus on the role of the adapted simulation in concrete design discussions. On the other hand, the project’s modular setup allows experimentation with different simulation approaches and interfaces. For instance, studies like the mentioned one of Clever et al. 15 suggest improvements to the simulation core. Such methods could be integrated into the presented prototype to test their potential combined with specific interfaces and user interactions. Thus, the presented protocol becomes an infrastructure to explore crowd simulations and their integration in collaborative design scenarios.
Footnotes
Declaration of conflicting interests
The author(s) declared no potential conflicts of interest with respect to the research, authorship, and/or publication of this article.
Funding
The author(s) disclosed receipt of the following financial support for the research, authorship, and/or publication of this article: This project was funded by the research initiative “Zukunft Bau” of the German Federal Office for Building and Regional Planning (Aktenzeichen: SWD-10.08.18.7-18.12) and accu:rate GmbH, Munich, Germany.