
Abstract
The aim of this study is to find a building form and plan layout that can be used in the early stages of architectural design, where criteria such as daylight, view, sun-hour, sales area, and cost are optimized according to the different expectations of different housing type users. This study proposes a multi-objective early-stage design optimization for a real estate development project based on the NSGA2 genetic algorithm, considering weighted user preferences for different housing types. The framework is implemented using the platforms Rhino and Grasshopper; Wallacei is used for NSGA2, and Viktor.ai is used to deploy the app. Tested on six sample plots, the model was able to find architecturally optimized results that respond to different user expectations. While the model successfully demonstrated responsiveness to parameters, its focus on Pareto-optimal solutions limited the diversity of unit mixes generated. The model has been tested by professionals on a sample plot and is found to be important for architects and investors to generate ideas at an early stage of architectural design.
Keywords
Introduction
Multifamily residential housing projects are an important part of the built environment, accounting for a significant portion of construction projects. In 2023, 36,175 residences with a total usage area of 66 million square meters were built in Turkey. Residential buildings consist of 77.1% of the total building permits, with the highest share. 1
Environmental factors have long been a central theme in architectural research. Scholars and researchers have traditionally focused on critical environmental considerations such as sun hour analysis2,3 and daylight analysis.4,5 Property developers, on the other hand, have long sought to maximize saleable area within their construction projects.6,7 Along with optimizing saleable areas, increasing real estate value is a critical goal for developers.
Developers and contractors strive to maximize the number of residential units and living area within the constraints of the parcel and project. 8 In these contexts, real estate value is predominantly valued based on square footage, with buildings constructed to conform to regulatory constraints, often bypassing critical environmental design factors. It is questionable how much the aspects that elude tangible measurement, including heating efficiency, solar gain, green space access, noise levels, and scenic vistas, are considered in the early design phases of multi-family residential projects.
Another important criterion that is often overlooked during the development phase is the variation in value criteria among different user profiles. Factors such as the location of the apartment units, 9 the floor they are located on, daylight access,10–12 green space,13,14 view access, 15 and noise 16 all affect the value of each unit. The weights assigned to these factors may differ depending on the user profile and the condition of the land. For example, daylighting may be a more important criterion than view access for a 3 + 1 apartment type, while view access may be more valuable than daylighting for a 1 + 1 user. Similarly, daylight may be a more important criterion for users than street view, but if there is a sea view on the land, this criterion may have more weight than all of them.
All these parameters and their weights may vary according to both the user profile and the site location. To optimize the design in the early stages of a project, it is essential to scientifically analyze all of these variables that affect the value of each housing unit from the perspective of the housing users. Optimizing housing projects, which account for 77% of total building production, in terms of these values will ensure that both users have access to the right product and developers develop the right product.
Optimization studies have been extensively employed in various aspects of the Architecture, Engineering, and Construction (AEC) sector, aiming to address challenges and enhance project delivery. A literature review reveals a multitude of research efforts across diverse areas, including design optimization, construction scheduling, and resource allocation. Notably, Ekici (2019) provided a comprehensive review of optimization studies in the AEC sector up until 2019, highlighting key trends and methodologies. Ekici’s review (2019) revealed that building skin optimization dominated, accounting for 58% of studies. Sustainability was the primary focus, with energy efficiency leading the way, followed by daylight and solar radiation. Lifecycle cost optimization also received significant attention. Window-to-wall ratio, shading, and building orientation were the most common form-finding parameters. Interestingly, office buildings dominated the studied typologies, followed by residential. Notably, 44% of studies employed single-objective optimization, while genetic algorithms and NSGA2 were the preferred optimization methodologies.
Following Ekici’s review in 2019, we conducted a comprehensive search on the Web of Science and identified studies published between 2019 and 2024 employing genetic algorithms for architectural and building optimization. This search utilized the terms “optimization,” “architecture,” “building,” and “genetic algorithm” within all fields and publication years.
For studies after 2019, many studies have conducted optimization studies with genetic algorithms. When these studies are analyzed, it is seen that the research topics have not changed much after Ekici’s research. Again, most of the studies are mostly office.17–19 The other optimization studies are, respectively, housing,20–25 school,26–28 and dormitory. 29 As for genetic algorithms and multi-objective optimization methods, it is observed that an increase in studies with NSGA2 and Energyplus as well as ANN (artificial neural networks). In terms of performance objectives, it is seen that not much has changed, and the most researched topics are energy performance, energy consumption, daylight, thermal comfort, and lifecycle cost. In addition to these, one study also studied visual performance optimization. 19
The existing studies on building performance optimization (BPO) primarily focus on technical aspects like energy efficiency, thermal comfort, and daylighting. However, there’s a notable gap in considering both occupant and developer perspectives to maximize overall housing value. Current research lacks a holistic approach that blends environmental performance with user-centric factors like preferences and comfort. Future studies should bridge this gap, aiming for dwellings that are not only environmentally efficient but also optimize housing value, benefiting both occupants and developers.
A review of the existing literature reveals that there are no studies that examine housing from the perspective of housing users and optimize according to the needs of different housing users. In addition to environmental optimization from the end-user perspective, there is a need for optimization studies based on users’ value criteria. In the existing literature, there are no studies that examine architectural design optimization from the perspective of different housing users and optimize according to their needs. From the end-user perspective, there is a need for optimization studies based on the value criteria of users as well as environmental optimization.
This research aims to answer the following questions: Are existing housing projects architecturally optimized? If so, which factors, such as view, daylight, illumination, cost, and sales area are, more prominent in housing development? Is it possible to design housing that fits the different preferences of different housing types?
This study’s focus is on applying genetic algorithms to optimize multi-family residential projects. The optimization study was carried out on residential parcels in the Istanbul Kadıköy district. Kadıköy was chosen for the study because its flat topography consists mostly of single-plot, single-building multifamily residential blocks with diverse land sizes, geometries, and relationships with the environment. To validate the optimization, the opinions of project developers and architects in this region were solicited. Various inputs were used to run this model. Minimizing cost, increasing saleable area, increasing sunlight intake, maximizing daylight, and increasing view access objective functions were used.
The next section of the paper includes the methodology of the multi-objective optimization method. The results of the study are discussed in Section 3. Finally, in Section 4 discussion and in Section 5, conclusions are drawn.
Methodology
The methodology of the study is shown in Figure 1. The genetic algorithm population and fitness functions were set up in the Rhino Grasshopper environment. Various Python workflows and Ladybug as a custom plugin were used for fitness functions. For the NSGA-II algorithm Wallacei evolutionary solver plugin
30
is used. The plugin was selected from a range of available optimization tools available for the Rhino3D/Grasshopper platform, including Galapagos, Octopus etc. Wallacei was chosen because of its detailed analytical capabilities and comprehensive tools for solution space selection and visualization. Methodology.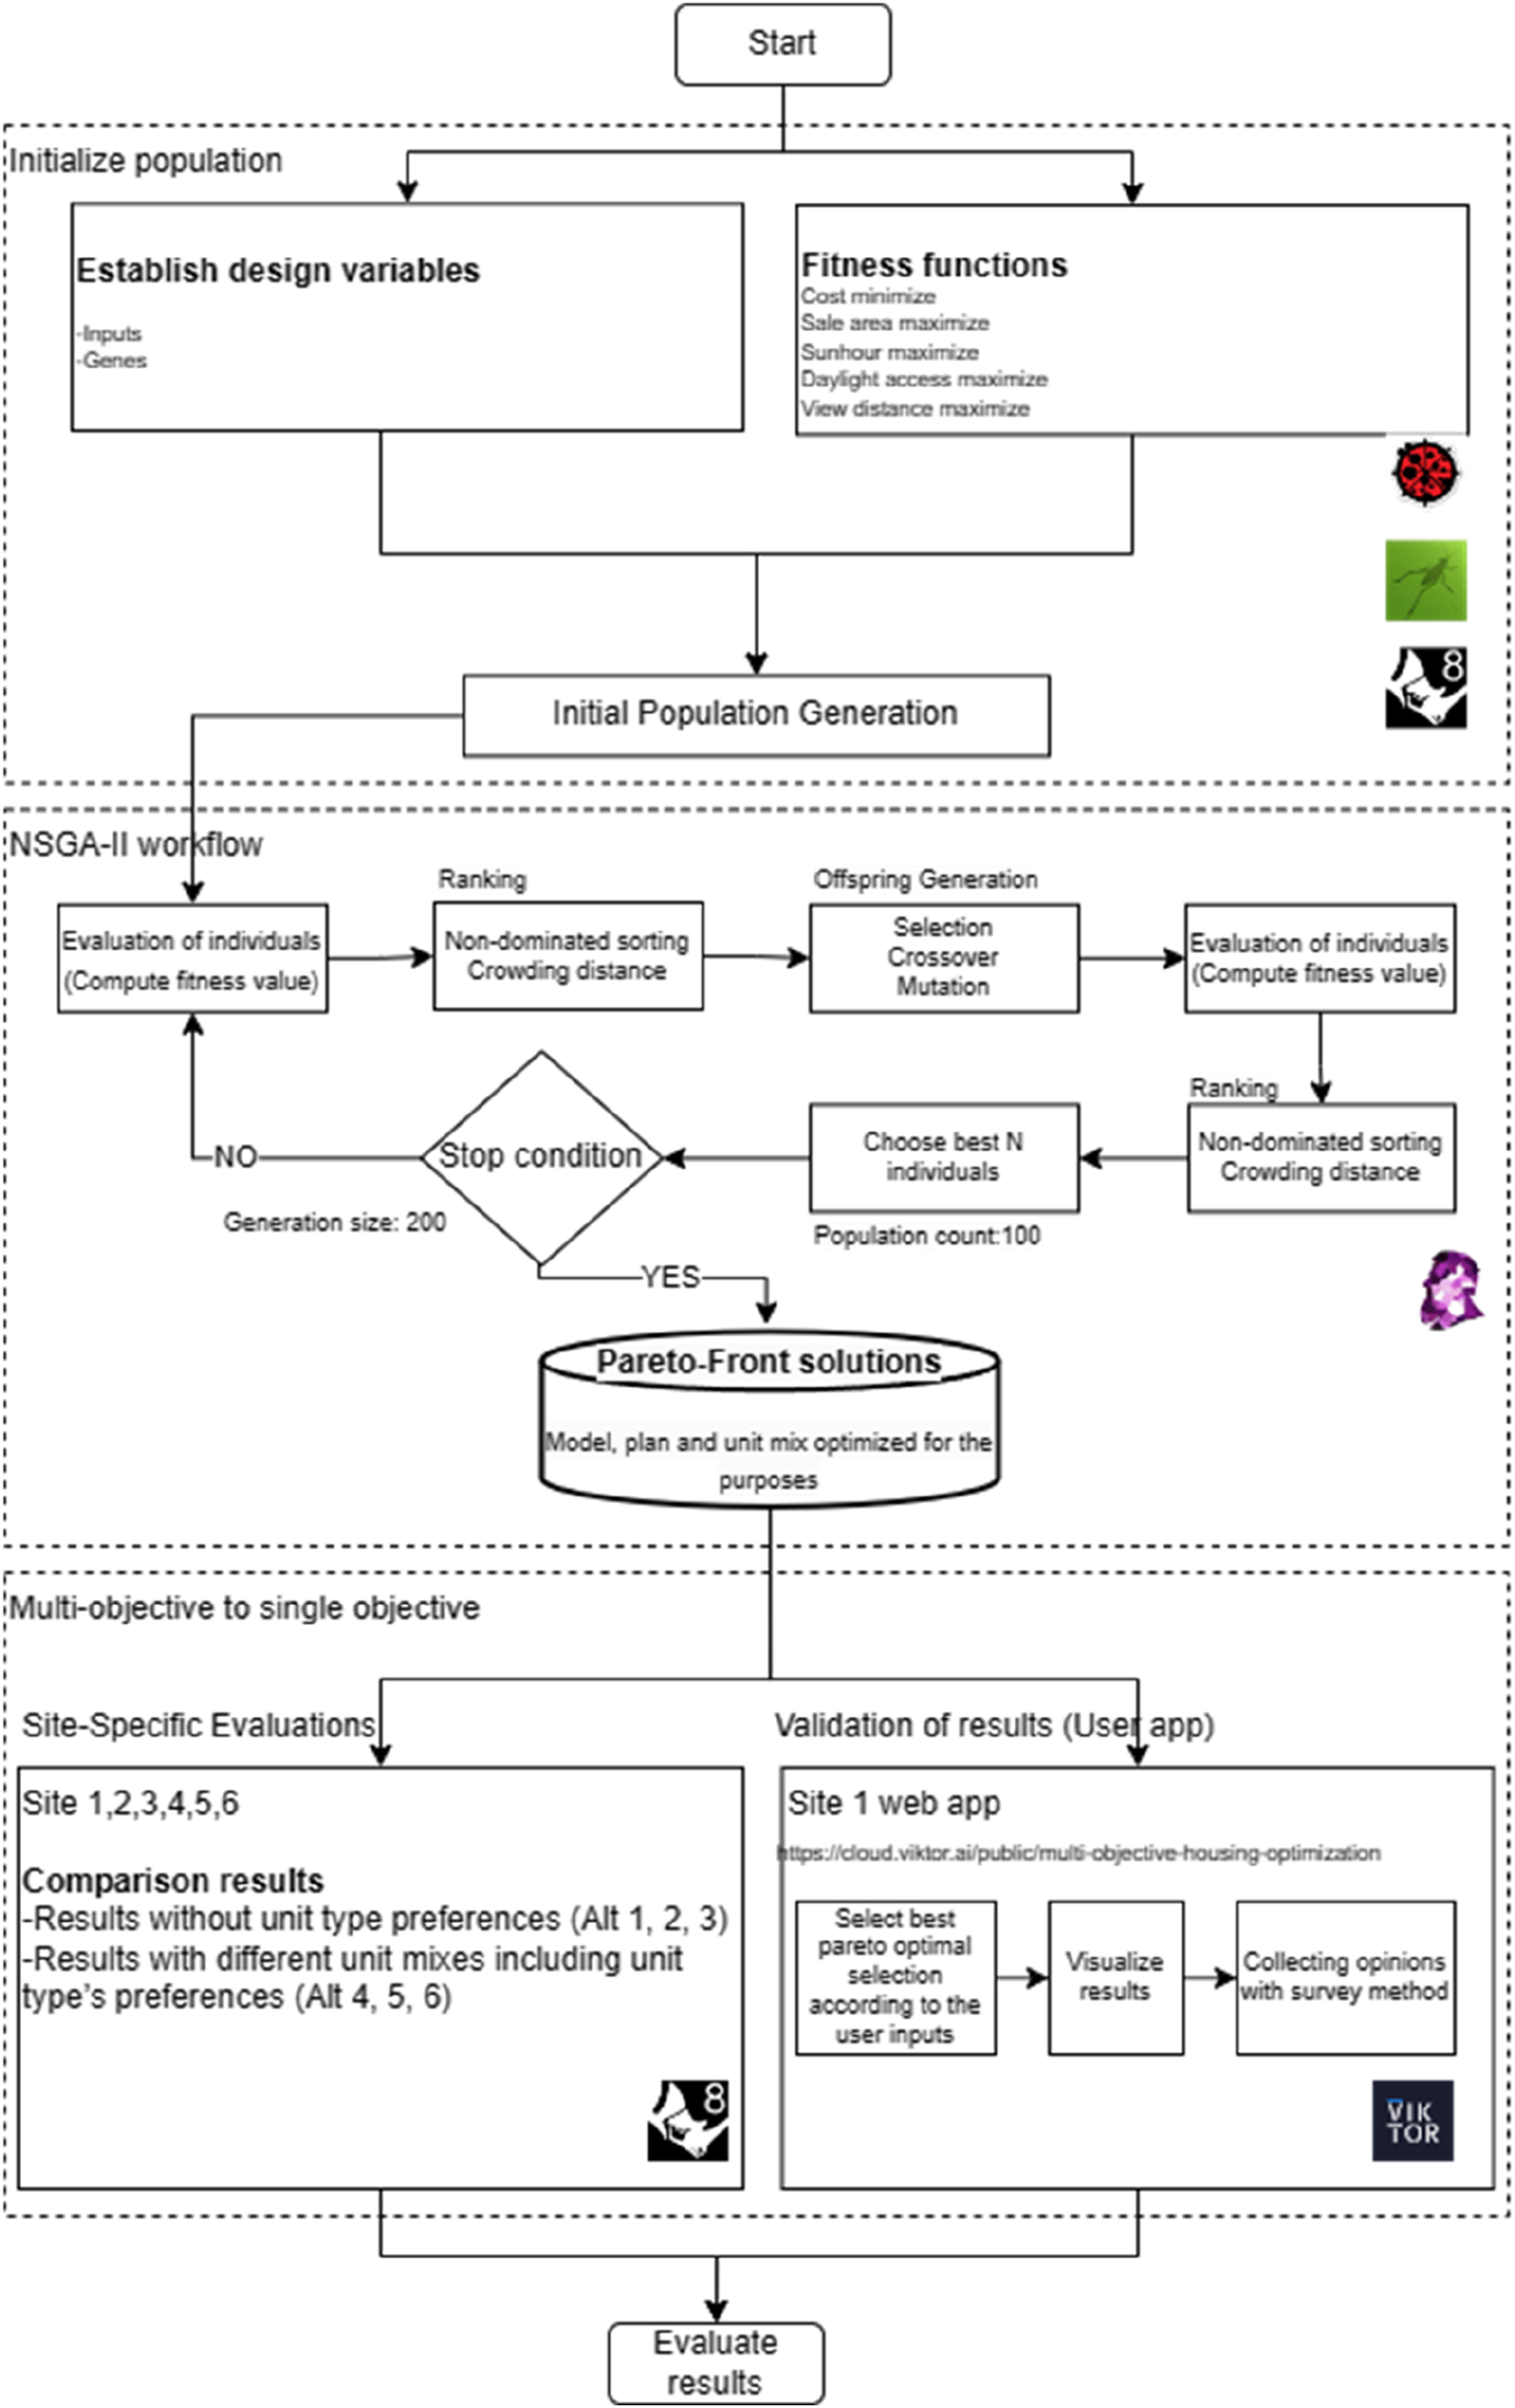
The NSGA-II algorithm starts by establishing design variables (modifiable inputs) along with fitness functions to quantify solution performance across multiple objectives. An initial population is randomly generated, and each individual solution is evaluated using fitness functions. Subsequently, a combination of non-dominated sorting and crowding distance calculation is employed to rank solutions, prioritizing those that excel across objectives and exhibit diversity. The algorithm then selects superior solutions, applies crossover and mutation operators to generate offspring, and iterates this process until a predefined generational limit is reached.31,32
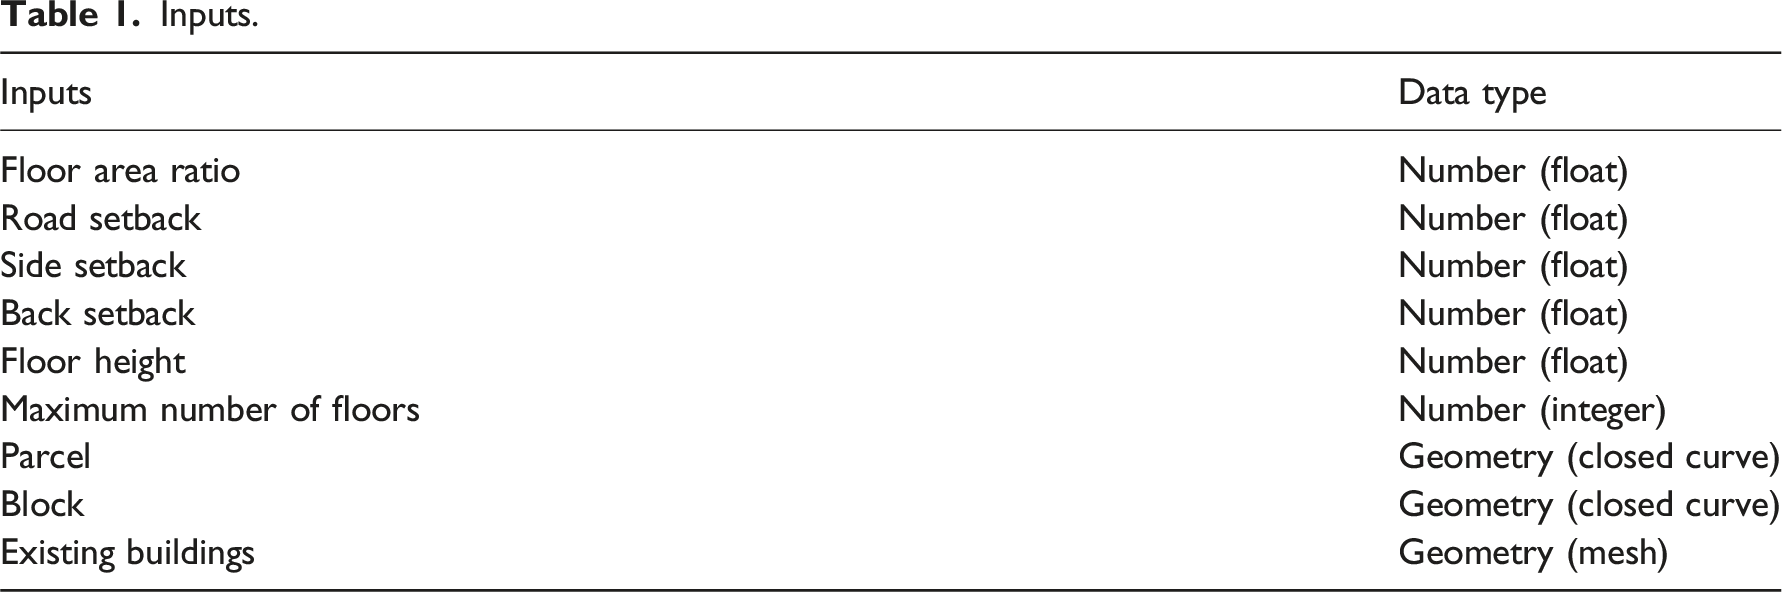
Inputs
Inputs.
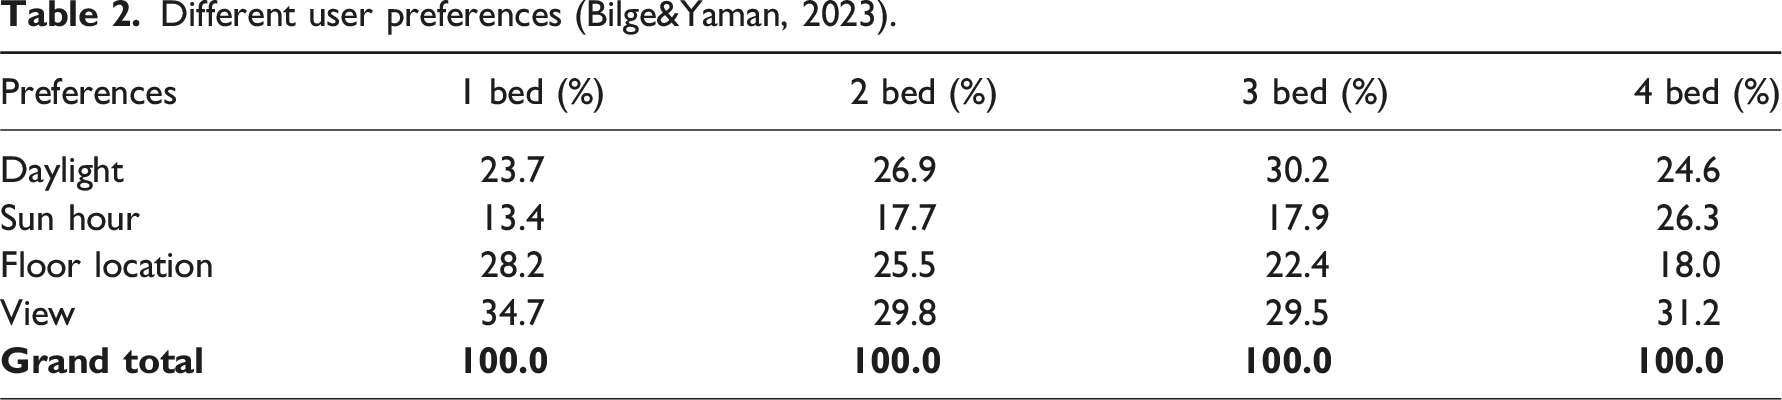
Different user preferences (Bilge&Yaman, 2023).
Genes
Genes.
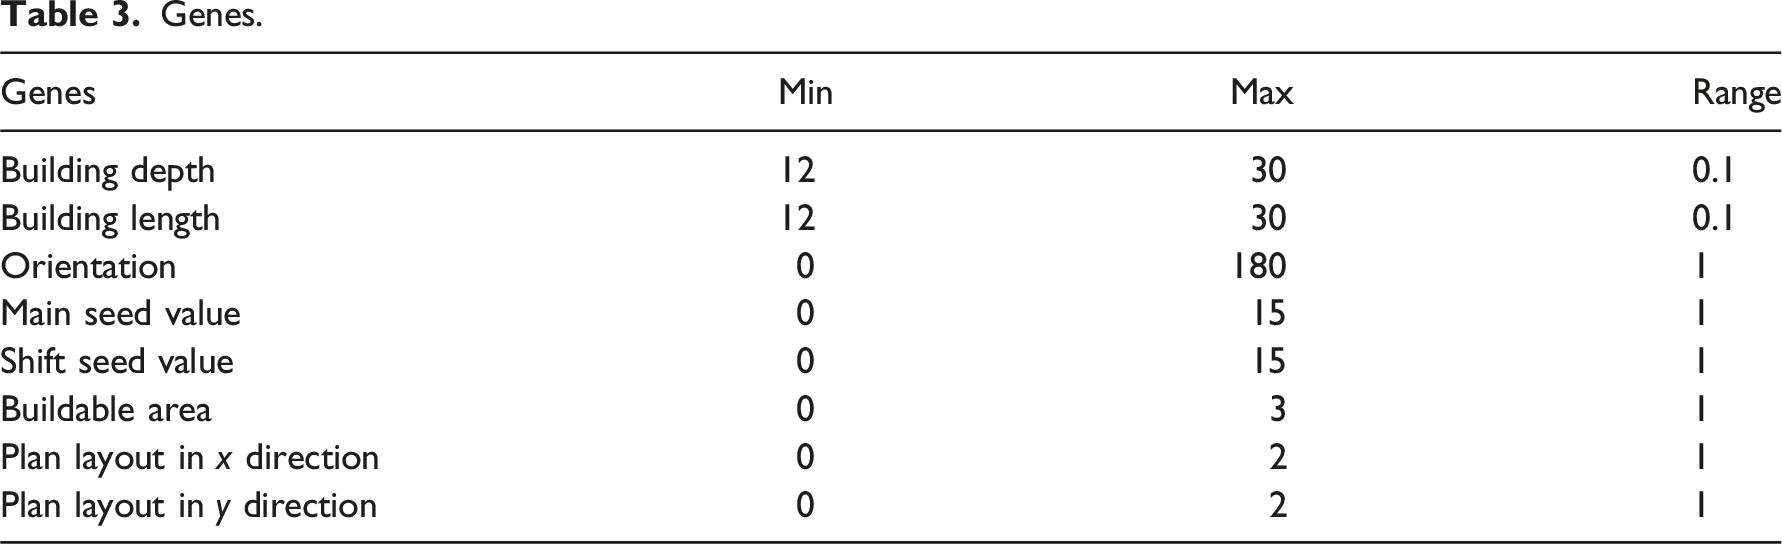
In this model, genes are building depth, building length, orientation, and buildable area, main seed value (for different layouts between floors), shift seed value (for different layouts within floors). Two seeds (Plan layout in x and y direction) were also used to adjust the square meters of the apartment blocks Table 3 A seed, also known as a random seed, is a number or vector used to initialize a pseudorandom number generator (PRNG). A PRNG is an algorithm that generates a seemingly random sequence of numbers but is actually determined by the seed. 34
For building length and depth, a minimum of 12 m was taken to ensure a proper building form. There are two rationales for using this number. First, this 12-m number was found by examining the exterior dimensions of 100 buildings built after 2017 in the Kadıköy region by examining the orthophoto drawings. In addition, a maximum of 30 m was taken for these two parameters. The reason for this is that houses without courtyards are not built at this distance for reasons such as getting light to the apartment sections. To verify this generalization, randomly selected 100 houses currently built in the Kadıköy region were examined and measured from satellite photos and no building exceeding this distance was found.
Design objectives (fitness functions)
Cost minimization
The cost parameter was determined based on the calculated facade surface area and the total volume of the building. It is assumed that a lower facade surface area/volume parameter corresponds to lower costs, while a higher parameter indicates higher costs. The model outputs were evaluated collectively and subsequently normalized.
Saleable area maximization
The saleable area parameter is calculated by subtracting the building core and circulation area from the total building area. In the generated form, an increase in the core and circulation area leads to a decrease in the saleable area ratio, and conversely, a decrease in the core and circulation area results in an increase in the saleable area ratio.
Sun hours maximization
The analysis of sunlight on the facade of a building, both for the proposed structure and surrounding buildings, is crucial. This is particularly significant for the eventual occupants of the building. The presence of sunlight can significantly influence the value of a residential unit.
To compute the hours of sunlight on the site, we initially establish the position of the sun relative to the location of the site. Once the sun’s position is ascertained, we calculate the hours of sunlight for points on the facade of structures and the terrain of the site.
Ladybug is used for sun hour analysis. Ladybug is a free and open-source environmental analysis plugin for Grasshopper3D, which is a graphical algorithm editor for Rhino, a 3D modeling tool. Ladybug streamlines the analysis process, automates calculations, and adds visualizations to the 3D modelling interface. It enables users to work with validated energy and daylighting engines and supports decision-making during simulation in a parametric environment. 5
The “LB SunPath” component of Ladybug was utilized to compute the quantity of direct sunlight received by geometry, taking into account sun vectors and inputs such as the weather file and simulation period. In this research, the simulation period was established from 8:00 to 16:00 on June 21st Reference points were positioned at intervals of 1 m on the facade, with sunlight hours measured at a height of 1 m above the ground. Ultimately, the mean sunlight hours across all reference points in the block were calculated to assess the overall daylight performance of the block (Figure 2). Sun hours maximization.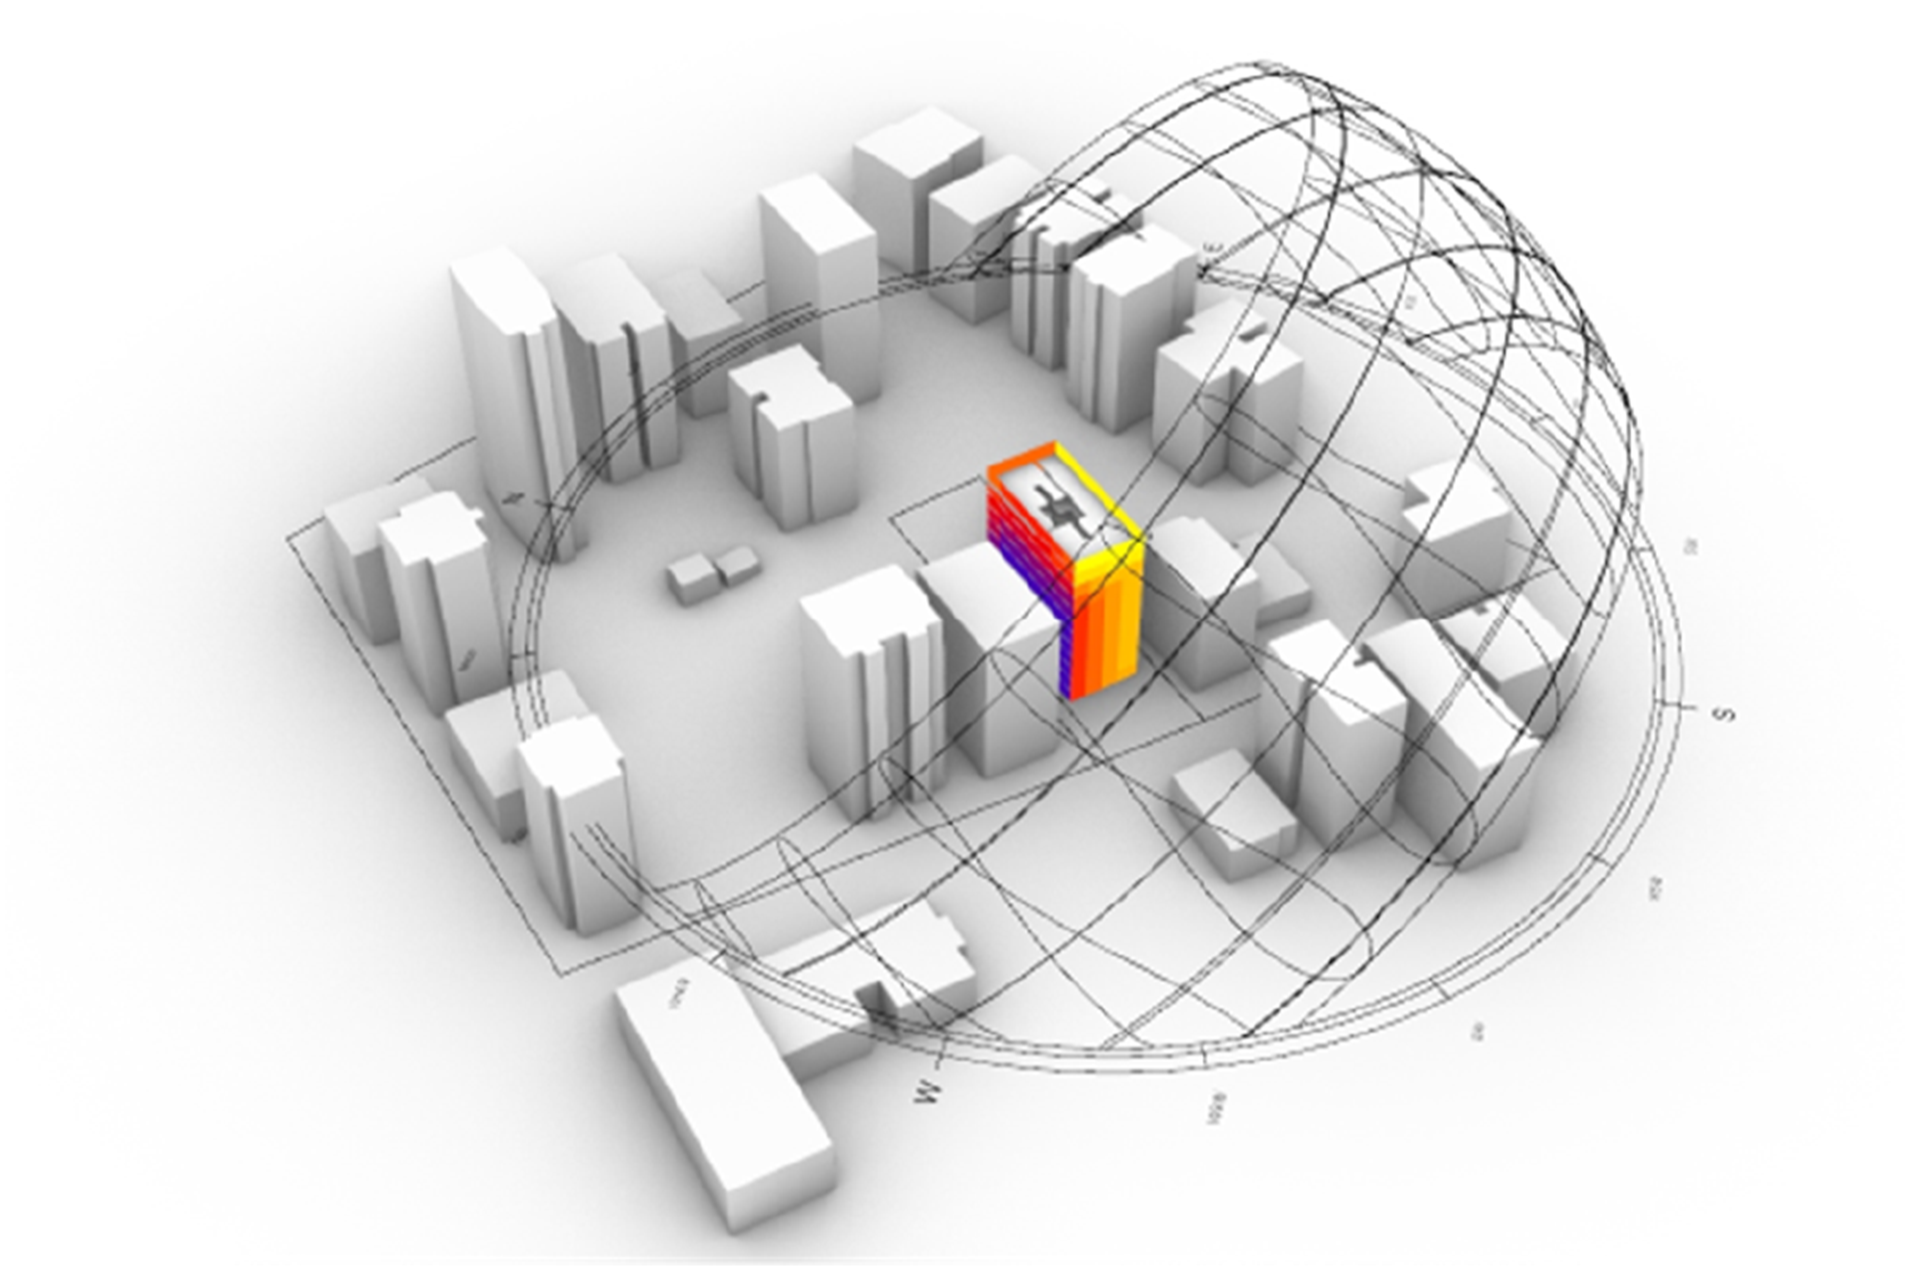
For both the site and the building, points are arranged on a grid. Measurements are taken every 10 min. At each point in time, it is determined whether the grid point is in shadow. The average number of sunlight hours for an apartment is computed by taking the mean of the sunlight hours of the measurement points within the facade of the apartment.
Daylight maximization
Daylight is an important factor in valuing housing units. It is an important detail that increases the comfort of the housing user. For daylight analysis, the vertical sky component metric is introduced. The vertical sky component analysis identifies daylight potential for facade points. It measures how much light from the sky reaches the facades in comparison to available light on an unobstructed horizontal surface. 35
The Vertical Sky Component (VSC) is quantified at specific points on building facades, serving as an indicator of the degree of illumination each point receives from the sky. This metric provides insight into the potential amount of light that could permeate through windows situated at these points, thereby demonstrating how a facade might enhance indoor daylight conditions.
The UK Building Research Establishment (BRE) defines the Vertical Sky Component (VSC) as the proportion of direct sky illuminance that strikes a vertical wall at a specific point, compared to the concurrent horizontal illuminance under an unobstructed sky. 36 The BRE further specifies that the Standard CIE Overcast Sky model should be employed for the distribution of sky illuminance. Consequently, the reference value for the VSC percentage is essentially the unobstructed horizontal sky component.
We used Ladybug View percent Sky View component to evaluate the percent view to the outdoors or sky from input geometry through context. The percentage of the sky that is visible from the geometry surfaces. Sky View, as can be seen in Figure 3, weighs the portions of the sky according to their projection into the plane of the surface being evaluated. Daylight maximization.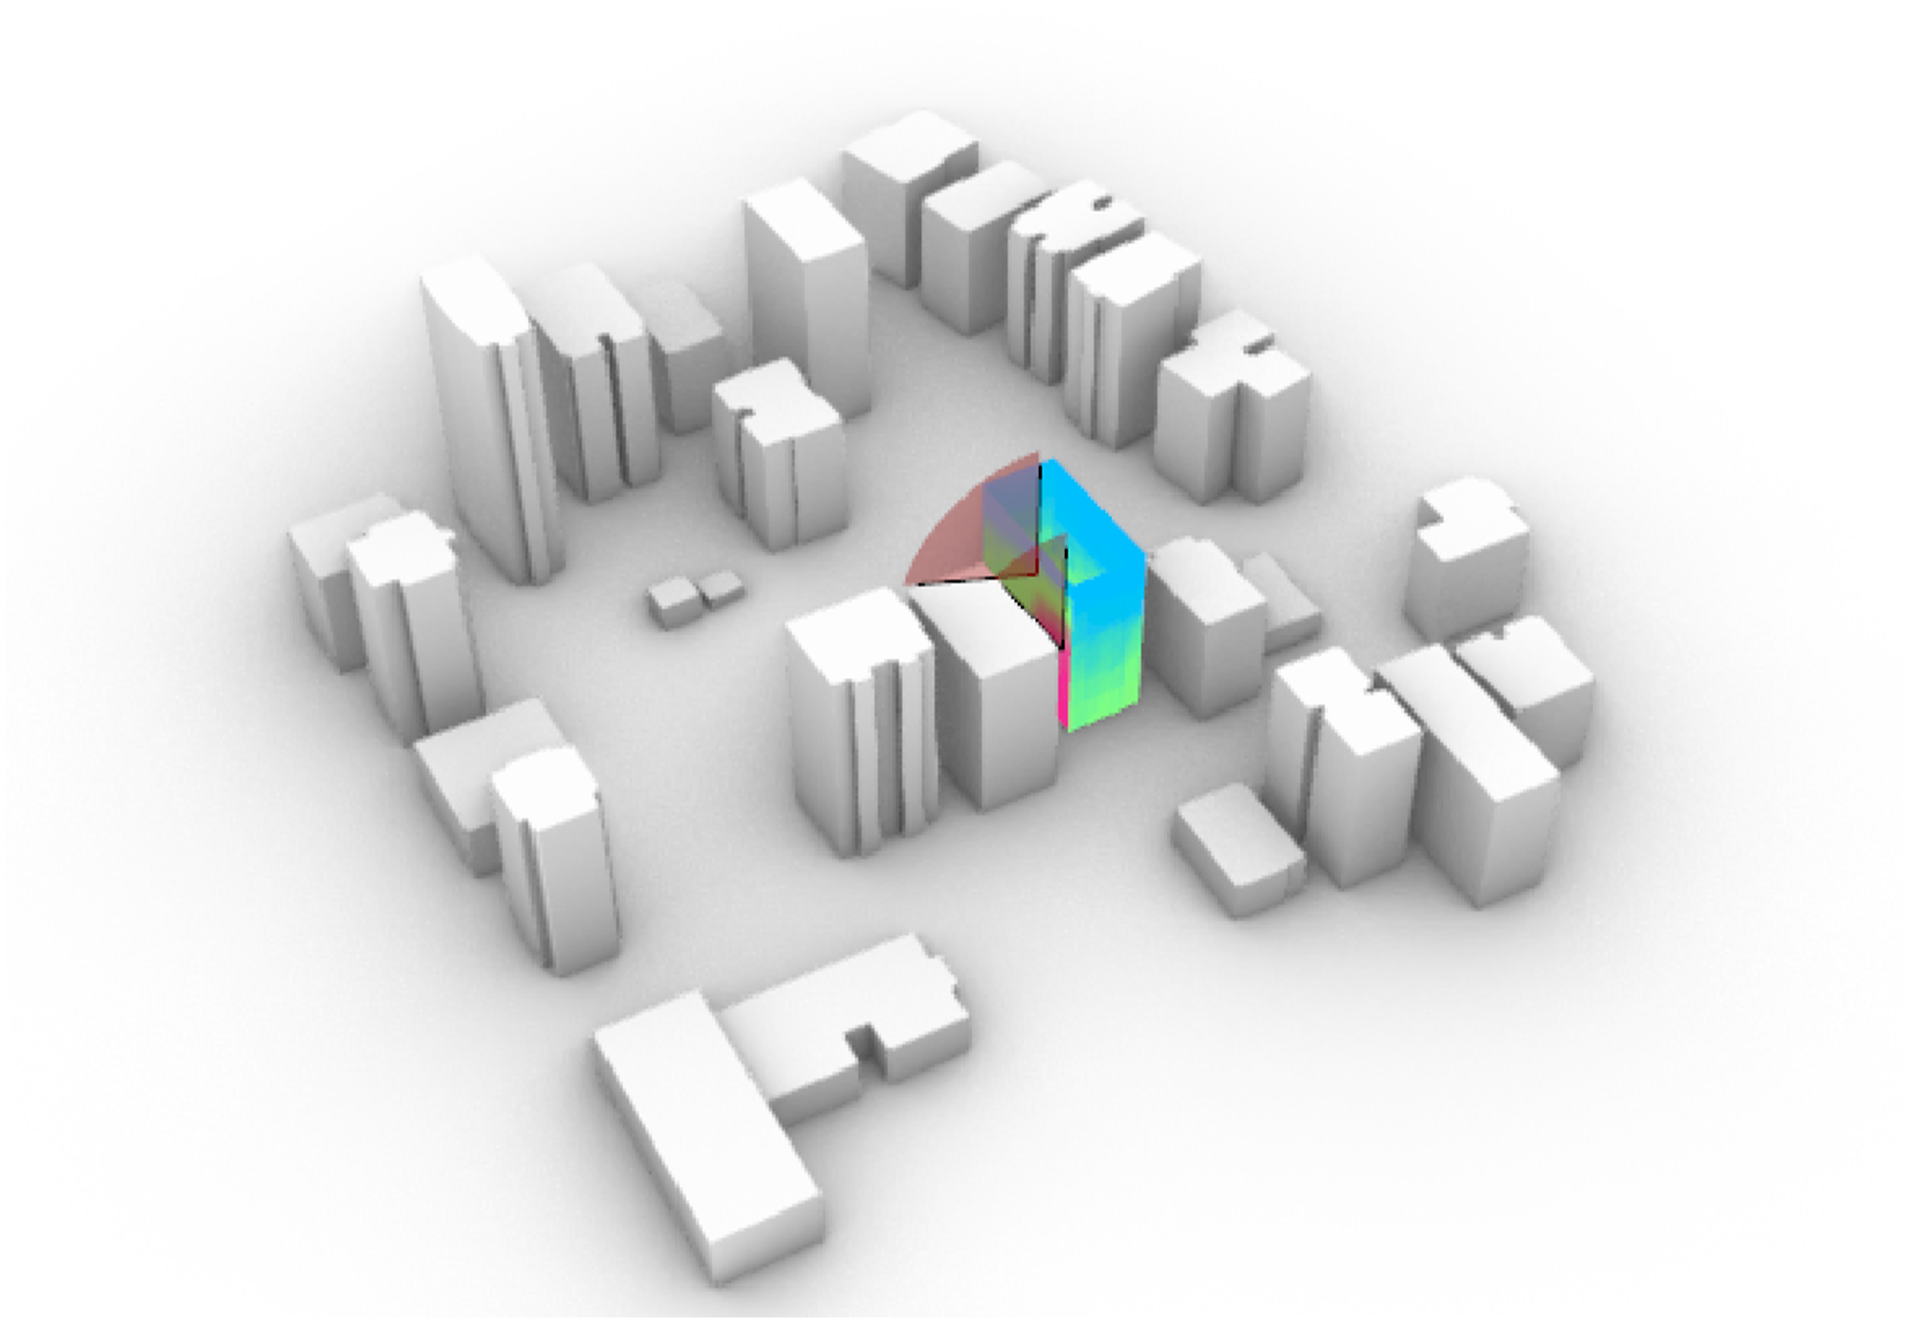
View distance maximization
The view distance metric, a quantifiable measure of a site’s spatial openness, is calculated based on the placement of specific points on the facade. These points are used to compute a distance score. The computation of this score involves the use of the mean view length spanning a 180-degree horizontal and 60-degree vertical field of vision from the point. The cumulative view distance for an apartment is ascertained by aggregating the distance scores of the points situated within the apartment’s facade outline. The measurement points on each facade are positioned within a Cartesian grid on the facade itself.
View distance calculation involves projecting rays from a designated facade point within a 180-degree horizontal and 60-degree vertical field of view. A schematic representation is shown in Figure 4. These rays extend towards a pre-defined site context, potentially encountering obstructions from adjacent structures or terrain. Obstructions reduce the average view distance, providing a metric to quantify a site’s visual openness and spatial quality. Grasshopper’s vector analysis and intersection tools were employed to facilitate this evaluation. View distance maximization.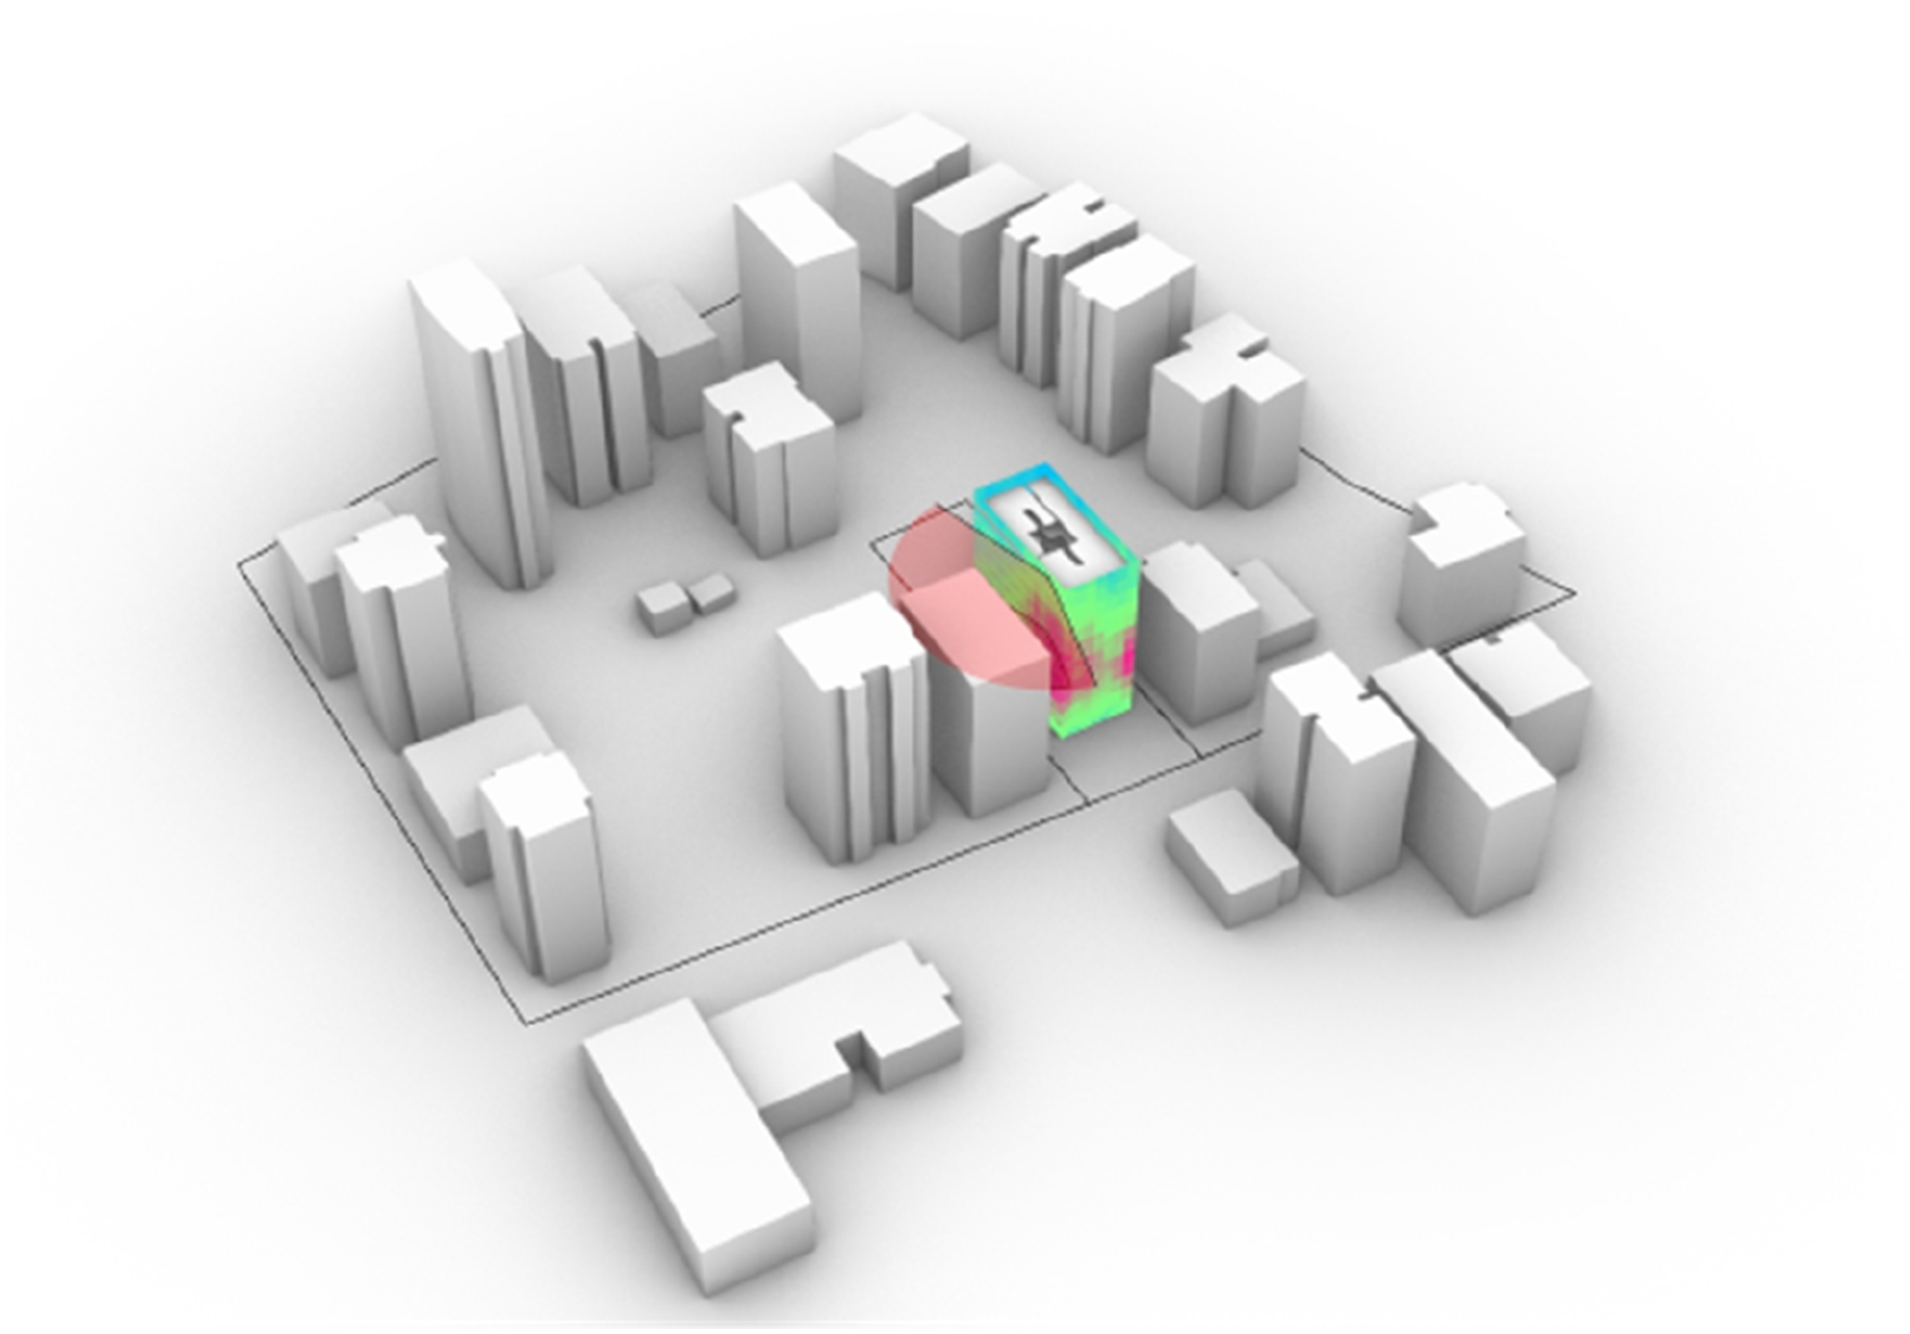
Genetic algorithm parameters
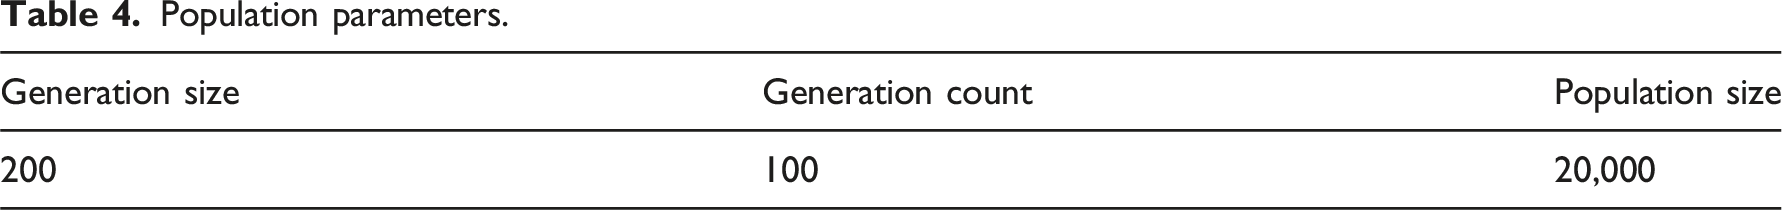
Population parameters.
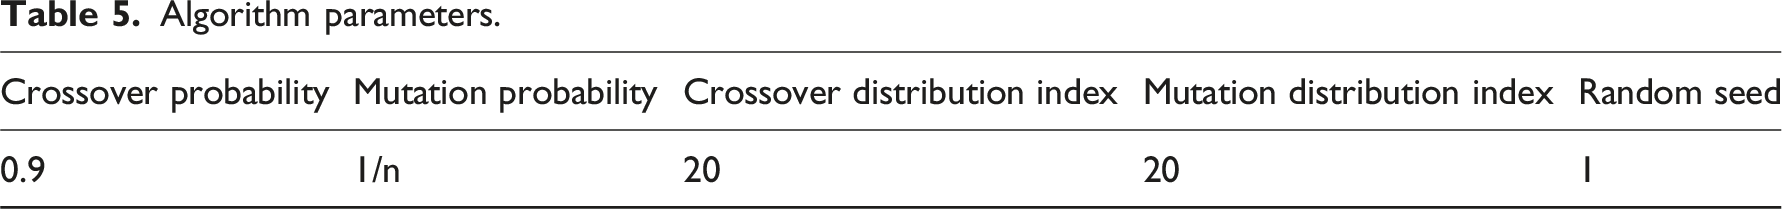
Algorithm parameters.
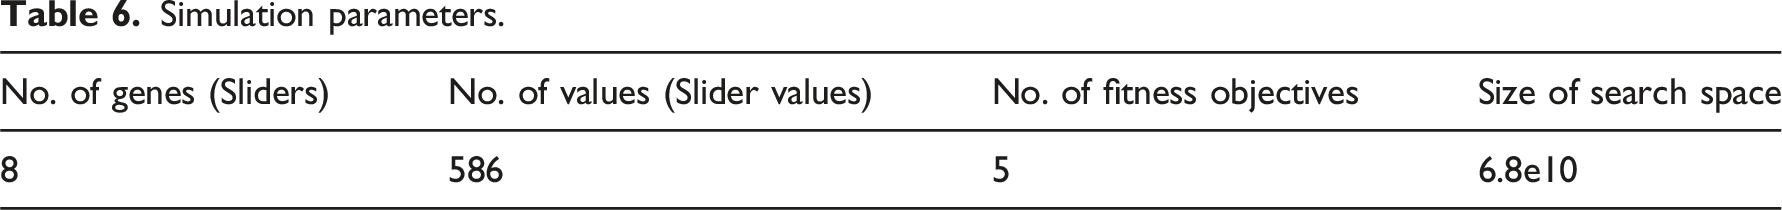
Simulation parameters.
The population size influences the diversity of solutions in the population. A larger population size generally promotes better exploration of the search space, but it also increases the computational cost. The number of generations determines how many iterations the algorithm will perform. In this model, the generation size is set as 200 and generation count is set as 100. The simulation runtime took approximately 20 h for each sample site. According to this simulation, a population of 20.000 valid results with a generation size of 200 and a total of 100 generations was generated for each site.
Multi objective to single objective optimization
Multi-objective optimization is the optimization of a system with multiple competing goals that must be balanced. NSGA-2 (Non-dominated Sorting Genetic Algorithm 2) is a multi-objective optimization algorithm that identifies a set of non-dominated solutions to a given optimization problem.
Sometimes it is necessary to convert a multi-objective optimization problem to a single-objective optimization problem. This can be accomplished using a scalarization method, which entails combining multiple objectives into a single objective function via a weighting or scoring system. Scalarization weights or scores can be chosen based on the relative importance of the various objectives.
Multi-objective optimization to single-objective optimization was performed among pareto optimal solutions. Pareto front solutions for each site were collected. Since fitness objectives have different values in their own categories, a normalization process was performed on pareto optimal solutions. From these solutions, six alternatives were tested for each site. For Site 1, a user app was created, and users were allowed to enter different options among the pareto optimal solutions (Figure 5). The multi-objective to single objective optimization was performed in two stages. One of them was user preferences on fitness functions, and the other was to create the desired composition of the unit mix. User app interface.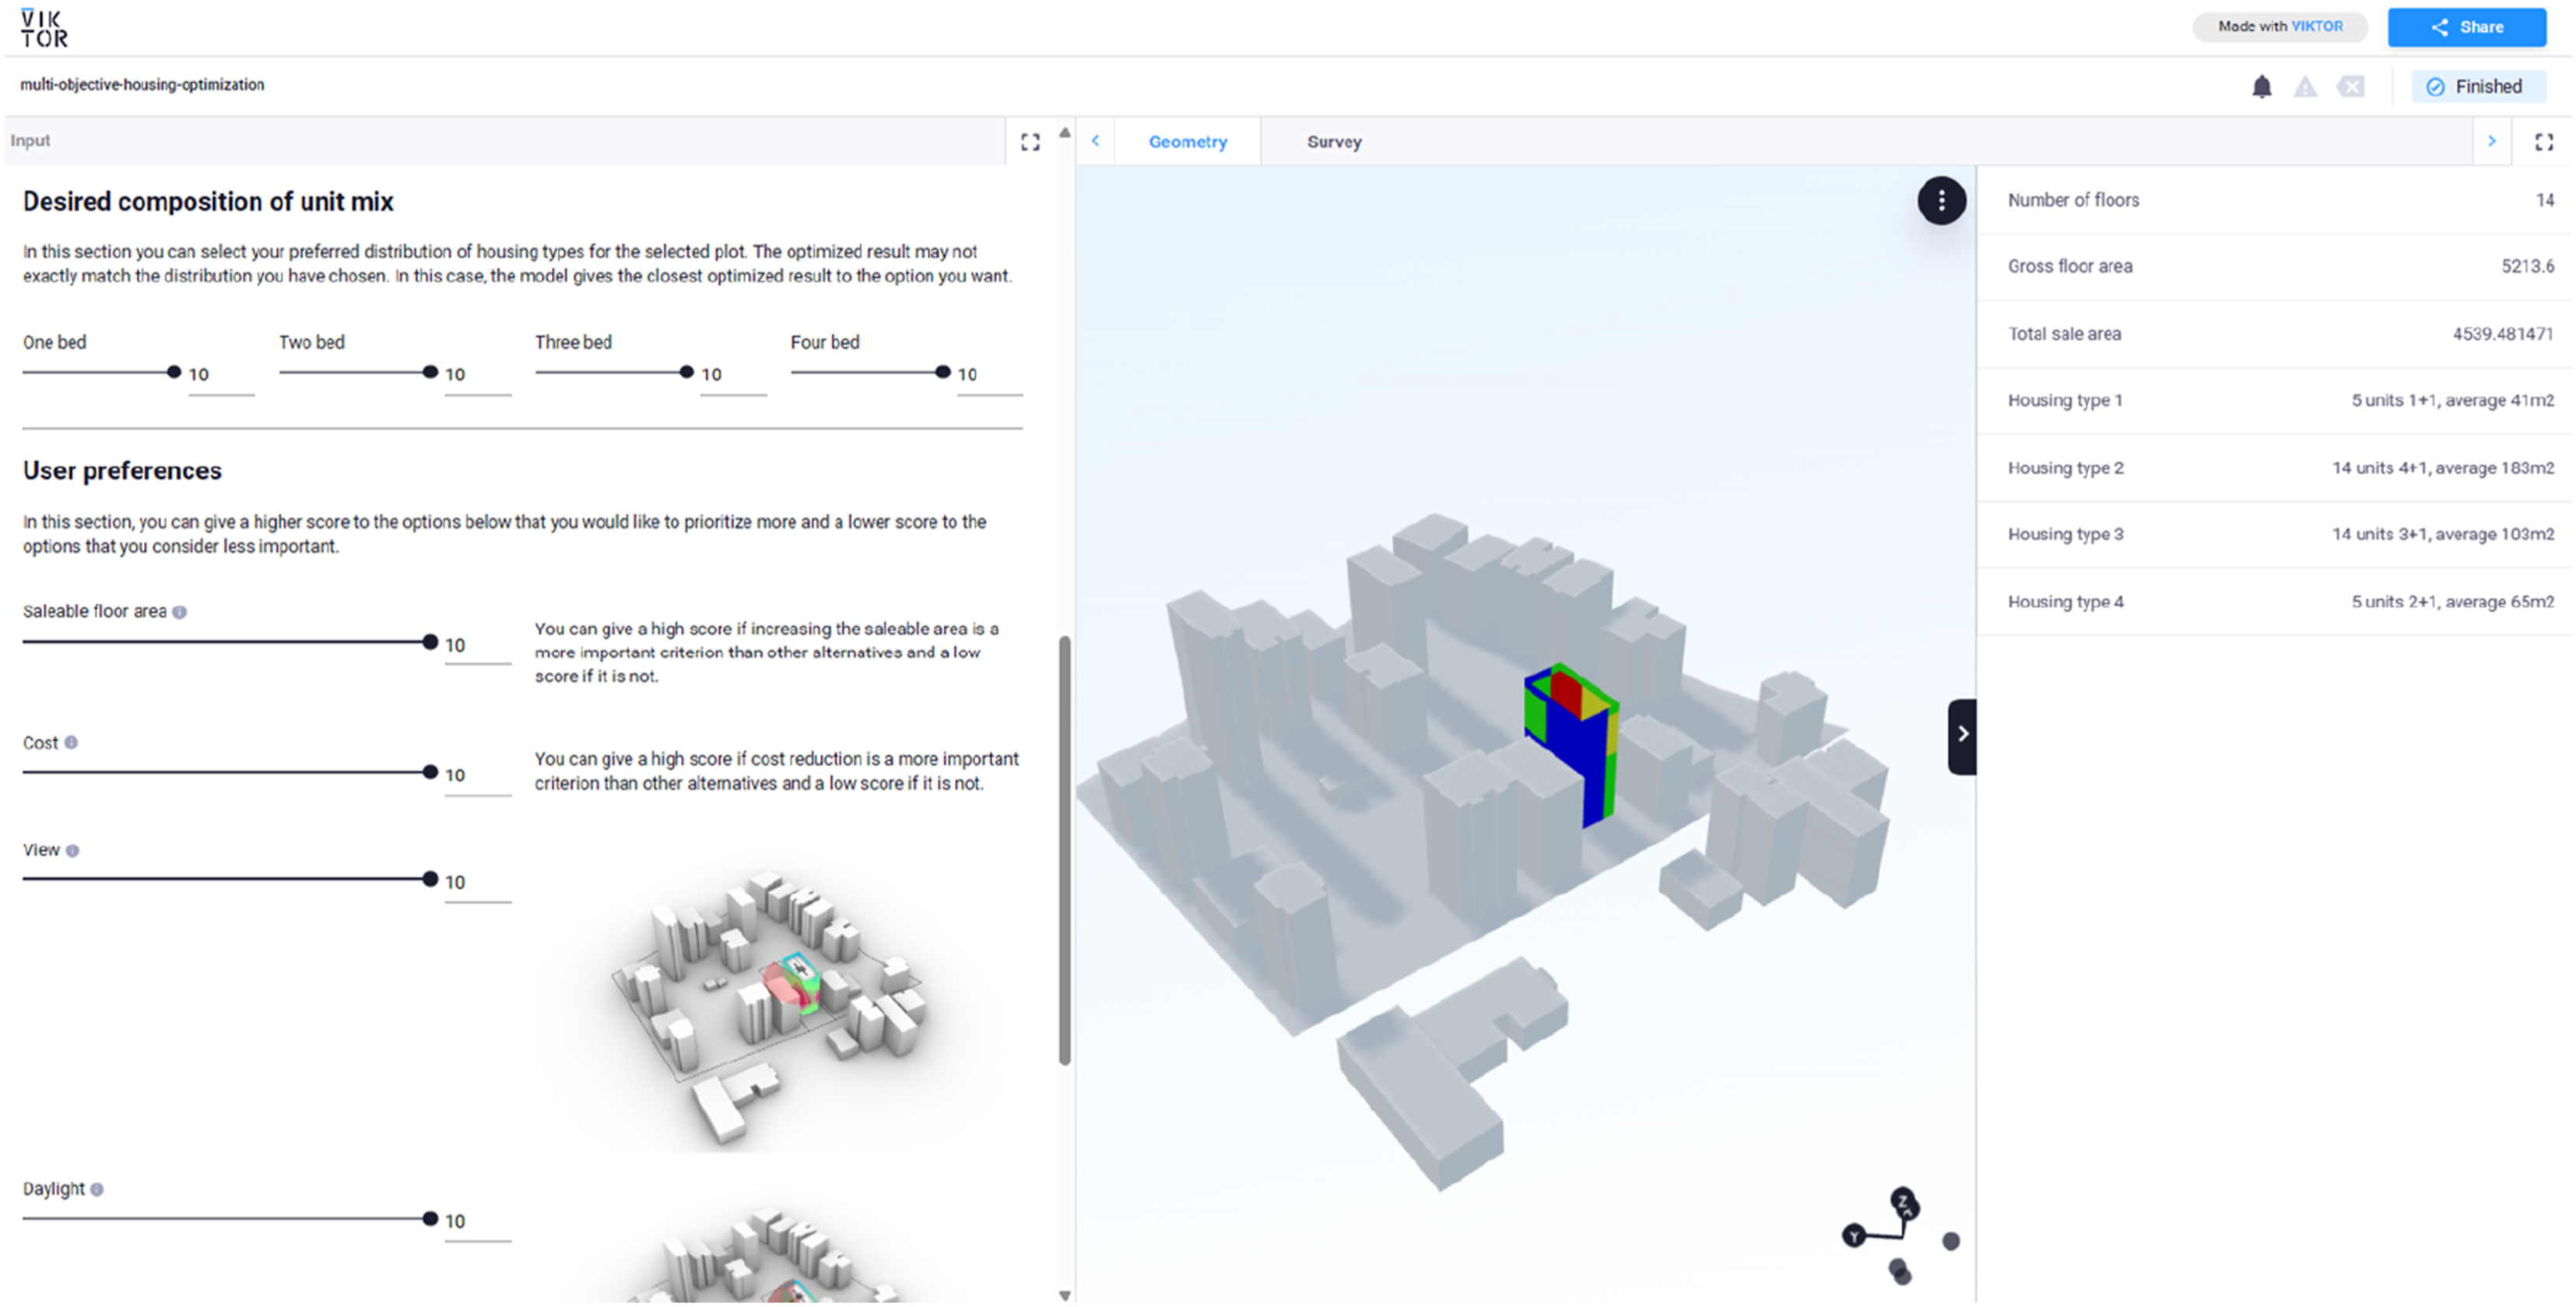
For user preferences a total of five design objectives were weighted with a total of 100%. For the user app, these values were made with the help of a 0 to 10 Likert scale and the process of completing 100% and proportioning was done in the background. After weighting, a single value was found by multiplying the weights with the normalized fitness functions.
For the desired composition of unit mix, four different options, namely 1-bedroom, 2-bedroom, 3-bedroom, and 4-bedroom, were entered such that their weights sum to 100%, and a 0 to 10 Likert scale was created for the user app. A similarity function was required to match the unit mix provided by the Pareto front solutions with the unit mix selected by the users.
When unit type ranges are selected, a similarity function is used to match the desired unit mix with the one produced by the genetic algorithm model. There are many similarity functions used by researchers. Using different methods such as Manhattan Distance, Euclidian Distance, intersection similarity and cosine similarity, the similarity of inputs to the reference input can be measured. These methods can often be used to assess the similarity of numerical data, such as when the sum of four variables is 100. As a result, since our data is numerical, we did not need a system that also makes sense of textual data such as cosine similarity. Manhattan distance, the most widely used tool to measure the similarity of numerical data, was used. The Manhattan distance can be calculated by summing the differences of the inputs from the reference input. The Manhattan distance is the sum of the horizontal and vertical distances between two points. For example, the Manhattan distance between Input one and the reference input is calculated as follows:
|20 - 20| + |20 - 30| + |20 - 30| + |40 - 20| = 10 + 10 + 10 + 20 = 50.
Among all Pareto-optimal solutions, the option with the lowest Manhattan distance (i.e., closest to the selected unit mix ratio) is chosen. Since this choice is made among Pareto-optimal options, the unit mix ratio entered by the user might not always perfectly match their desired outcome.
Results
Results were evaluated in two stages. In the first stage, an analysis was conducted among the Pareto optimal solutions. In the second stage, the model was made available to external users via a user app to validate its effectiveness. Professionals were invited to utilize the model, and their opinions were collected through a survey.
Site-specific evaluations
In the first stage, six test plots were randomly selected from post-2017 buildings within Kadiköy. The genetic algorithm model was applied to these plots, adhering to existing construction and zoning constraints (FAR of 2.07, GFA of 0.35, and a 15-story limit). A 0-10 Likert scale was used for weight assignment, with minimum values receiving a weight of 0 and maximum values receiving a weight of 10.
Six alternative cases were compared for each site. The first three alternatives focused solely on optimization model and fitness function comparisons. Alternatives 4, 5, and 6 assumed equal importance of fitness functions and tested four distinct unit mix scenarios. All the results given by the genetic algorithm model are pareto-optimal results and non-pareto-optimal results are filtered out. Analyses were conducted for the six selected sample plots in Kadıköy, Figure 6 and presets for these alternatives can be seen in Table 7. Sample sites results. Comparison results Likert scale.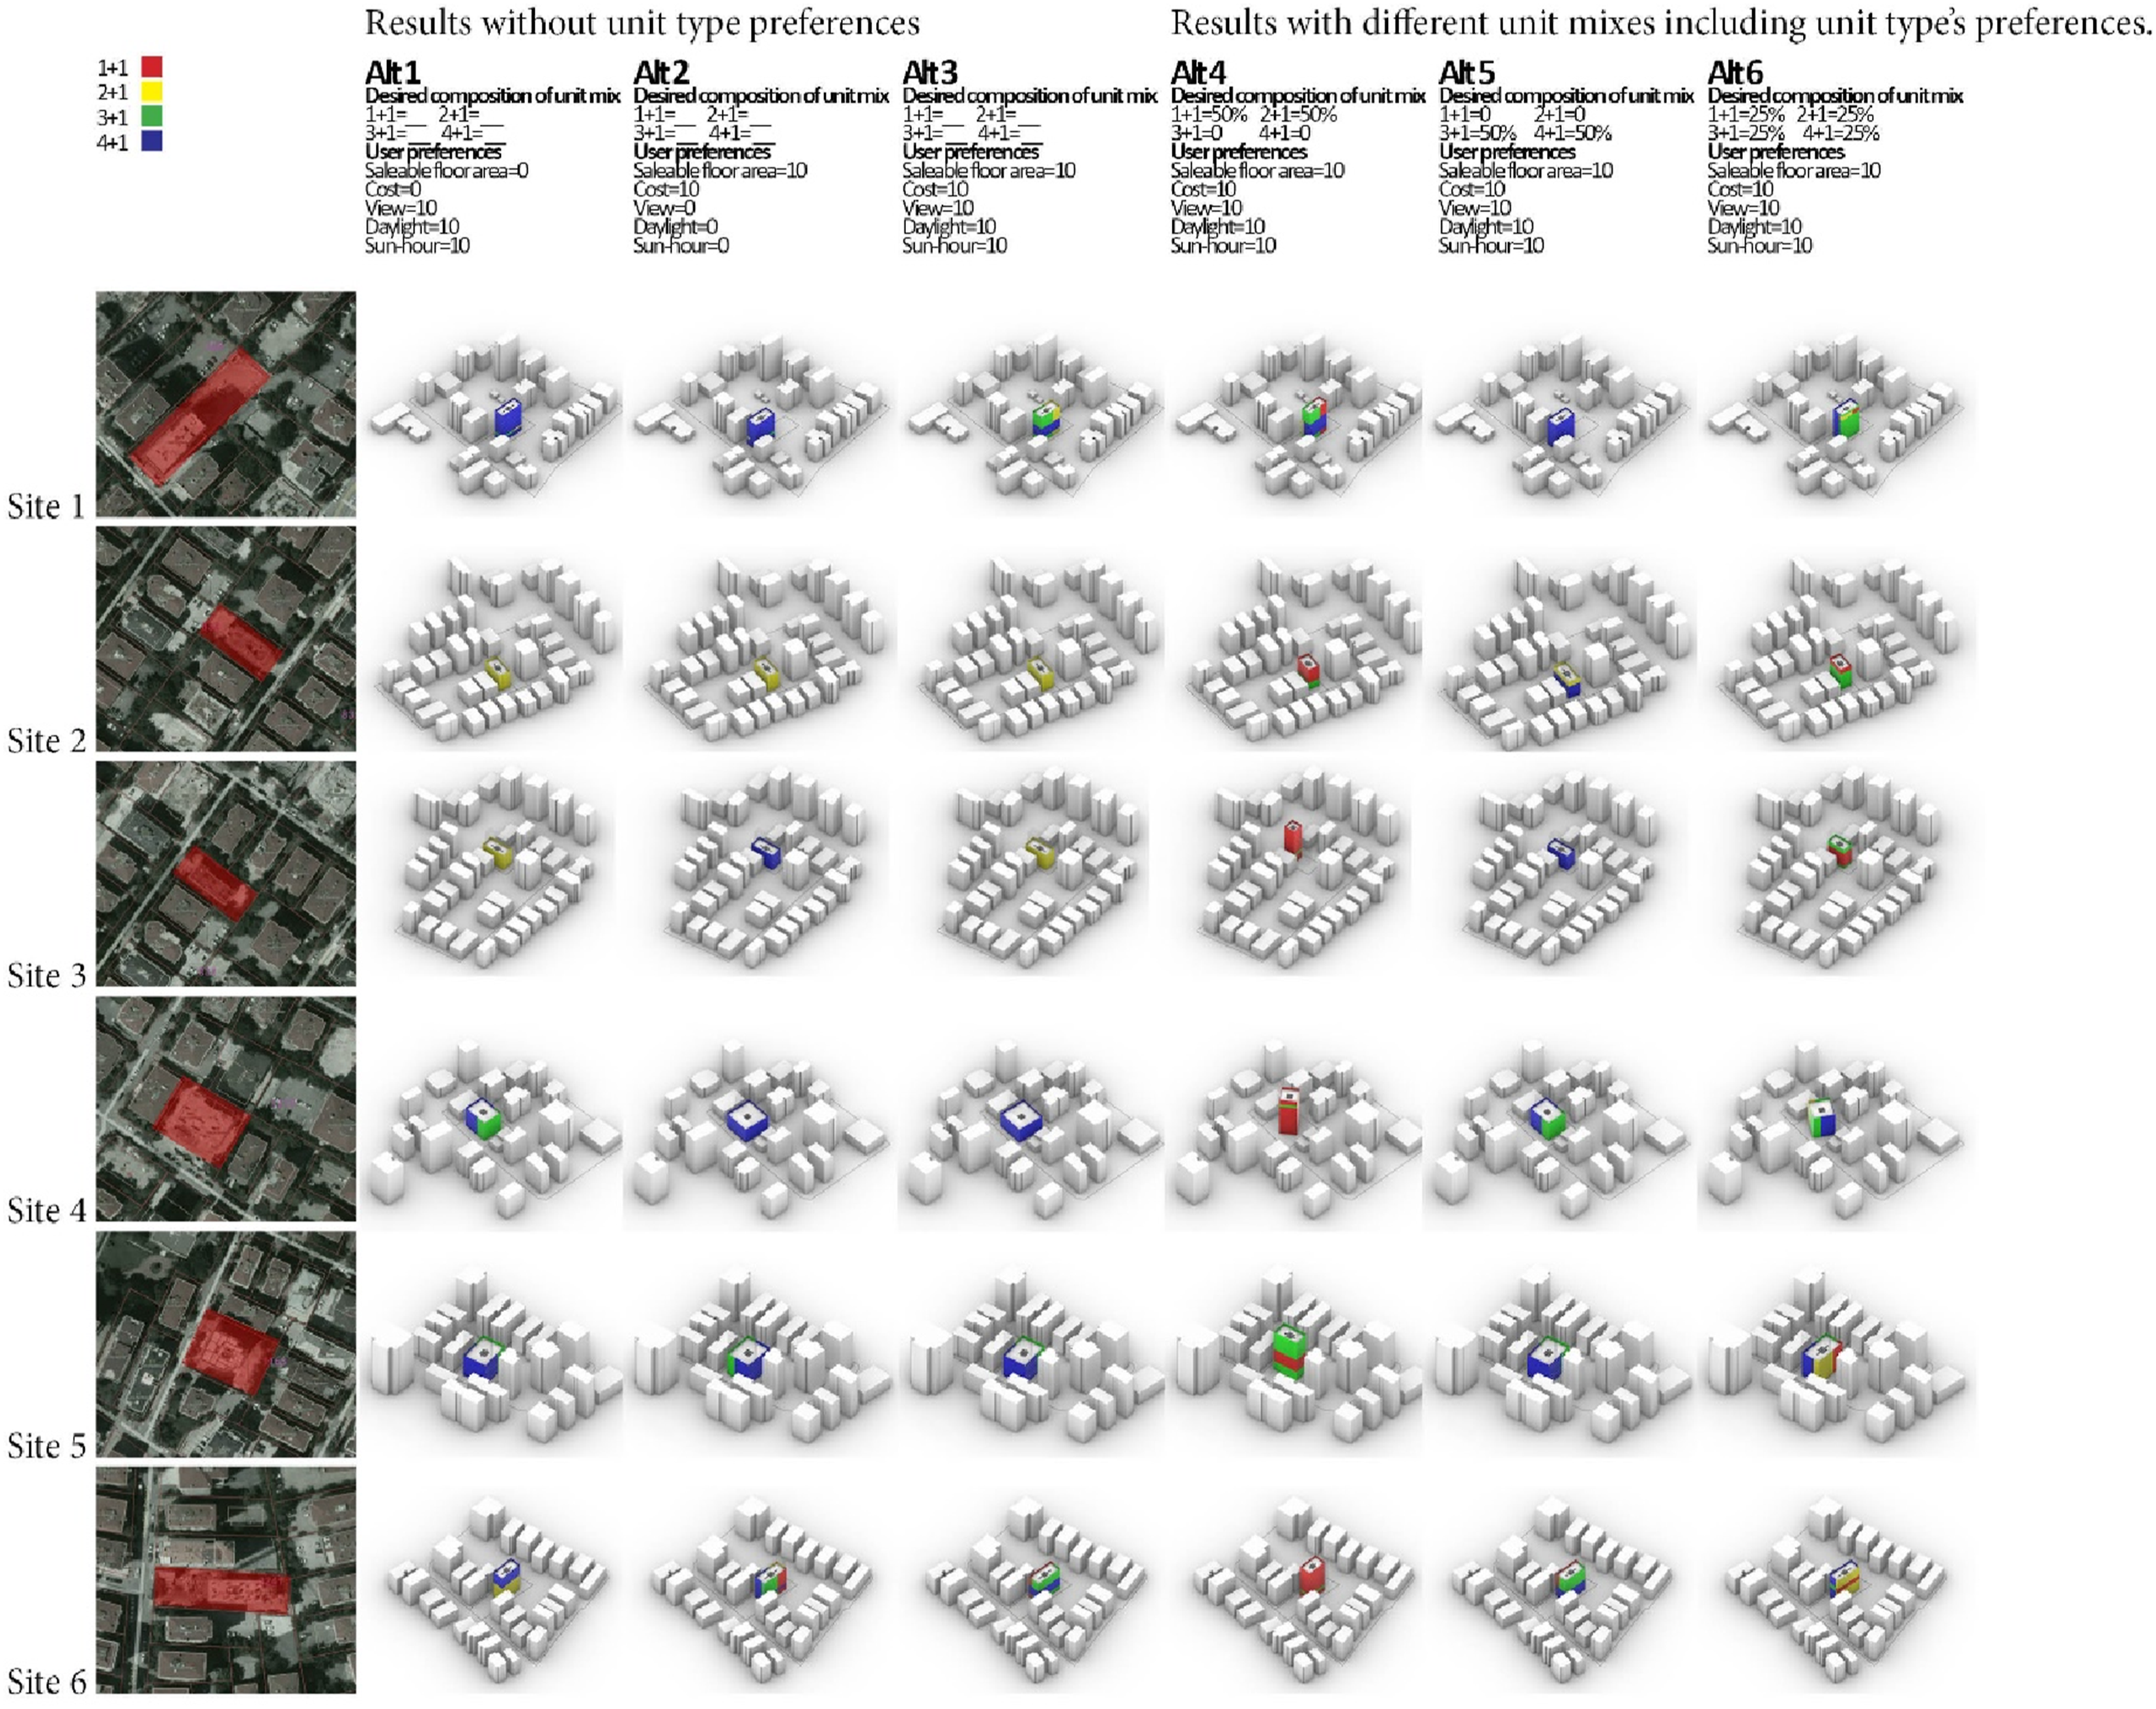
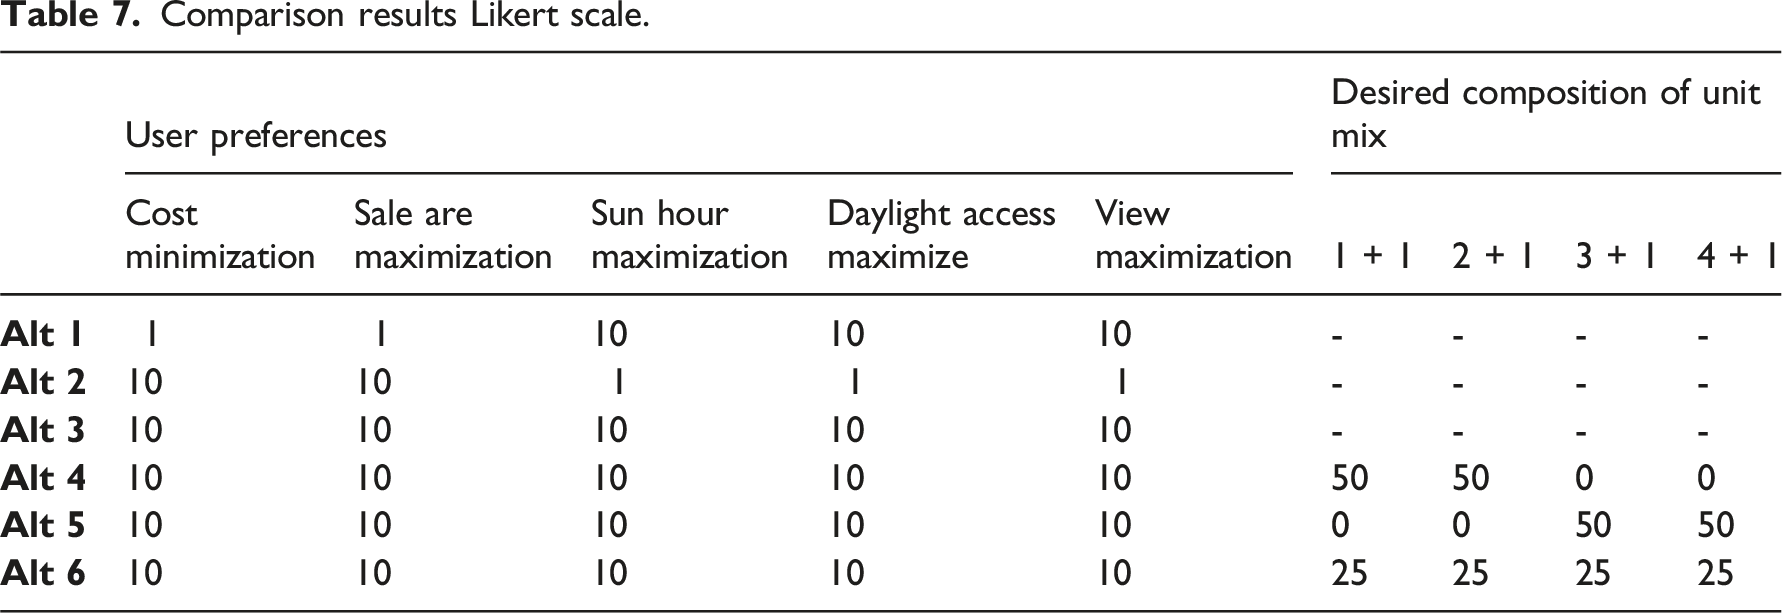
Site 5: Site 5 has an area of 1174 m2, approximately similar in size to Site 4. The results are also similar to Site 4. Again, since the land is large, the first three alternatives feature relatively low-rise forms. For Alternatives 4, 5, and 6, the model finds the most optimized form according to different options and offers us options close to the desired ratio.
Site 6: Site 6 is proportionally like Site 1. Site 6, which has an area of 1286 square meters, was built by stepping back from the street, unlike Site one and many apartment buildings in Kadıköy. In alternative 3, which is the most optimized according to the model, the current state is similar to the most optimized form. The building’s unusual placement (stepping back from the street level) suggests a deliberate emphasis on increasing criteria such as daylight and view. Again, the model demonstrates responsiveness to unit type preference and provides the most optimized solution for the desired unit mix. When unit type preferences are added, the best scenario remains compatible with the current state in terms of positioning. Compared to the current state, only the best scenario produced by the model has a slightly lower floor area. This implies that the developer may have had a different unit mix in mind or prioritized cost minimization.
Overall model performance evaluation
Evaluation of the model’s performance demonstrates responsiveness to the parameters provided, yielding expected results. However, there were cases where it did not give the desired ratio in unit mixes because it only took Pareto-optimal solutions covering all fitness objectives out of 20,000 results. Parcels with a small land area tend to favor smaller units, such as 1 + 1 and 2 + 1 units. In larger parcels, optimal results include more 3 + 1 and 4 + 1 units with larger square meters. One reason for this can be considered the fact that the model places a maximum of only four apartments on each floor. The underlying reason for this is that the apartments seen in Kadıköy parcels are either one apartment, two apartments, or four apartments on the floor. However, if the model is reworked in the future, a solution with more alternative flats on the floor should be developed.
Validation of results (user app)
This study was presented to professionals as a web application on the VIKTOR.ai platform (https://cloud.viktor.ai/public/multi-objective-housing-optimization). VIKTOR is a low-code platform enabling engineers to build and share user-friendly web apps using Python (Viktor, 2023). Three professional participants were selected for their expertise; architect specializing in urban transformation projects within Kadıköy, design coordinator for a large-scale real estate development company and an architect with experience in urban-scale competitions and single residential projects. The application was presented, and participants’ opinions were collected. The interview focused on the following questions: • Your position in the company/Profession • What do you think about the overall usability of the app? • Would you consider using the optimized designs offered by the app in your real projects? Why? • Were the app’s results in line with your expectations? Please outline both favorable aspects and any shortcomings you identified. • Do you have any additional feedback or suggestions to contribute?
Responses of the participants can be summarized as follows:
The usability of the app is positive, offering a simple interface for early building design orientation and alternative perspectives. However, more specific information on the definition of saleable area is needed. The app can be used in real projects, taking into account urban decisions, regional character, and user demands. It offers a practical solution for parcel evaluation by providing zoning information, regulations, and plan note constraints.
Although the solution offered by the application seems to be consistent with the parameters used in the optimization, it is possible that more parameters may enter the algorithm and change the results bidirectionally. It is therefore recommended to improve the implementation.
In the project phase, issues have arisen that pose challenges and have likely been considered. These issues need to be addressed in terms of expectations. The data on the results page provides insight into the parcel’s potential. However, during the project stage, variations in function (such as ground floor shop usage) and the impact of topography (such as an exposed or partially used basement) will influence the outcomes.
In the current municipal processes, elevation information is received long after the calculations, although it is crucial data for the program. A preliminary assessment of the parcel has been made, assuming no construction on the parcel. In such cases, the architect's task is relatively straightforward, allowing for interventions based on each owner's land share.
However, there is a high likelihood of dealing with a parcel containing an existing building or a demolished one. Sociological issues need consideration in the later stages of implementation. The source of capital for the project, whether it’s the owner or a contractor, becomes significant. If it involves a contractor, the agreed-upon rate with the owner and which floors belong to the contractor are essential data points.
Each owner’s habits related to the building, such as the orientation of the living room and the adjacency of rooms to neighbors, can pose challenges. In previous calculations, a portion of the 30% off-peak areas could be deducted from common areas and some from apartment areas, affecting land shares. The program likely relies on minimal data for core solutions, and more data on 30% of areas is needed during the project stage.
While the program evaluates the building as a whole, there are aspects that require customization for each user in the process, considering the impact of supply and demand on the construction field. Additionally, floor height is crucial, with regulations imposing limitations. The choice of a static system is important, and considerations for clean floor height, fire escape staircases, and closed service staircases depend on the specific situation. These factors need attention as they may influence the maximum construction area calculated by the program under parcel construction conditions, particularly in the initial phase.
Discussion
Real estate development projects involve a complex interplay of user requirements, developer perspectives, and site constraints. Identifying the optimal scenario is challenging, as “optimal” can vary across stakeholders and contexts. This optimization model demonstrates how different variables yield diverse outcomes, providing a framework to optimize across these alternatives. Site-specific analyses suggest that while some developers achieve optimized results based on specific needs, others may opt for non-optimized building forms, deviating from established norms.
This model advocates optimization beyond traditional cost or sales area metrics. It incorporates parameters such as view access, daylight, and sun exposure—all of which significantly impact value. The integrated user app further empowers users/developers to assign custom weights to these parameters.
Examined buildings display optimization according to specific criteria, although developer intentions cannot be definitively inferred. Additionally, some buildings exhibit no clear alignment with optimized results. This model empowers users and developers to make well-informed decisions backed by data-driven insights. More accurate fieldwork and granular user preferences will enable the model to produce the most value-optimized building forms.
This research has answered the research questions it posed, but it has also raised many new research problems. Is it possible to change the model from a genetic algorithm model to an ANN model and to obtain faster results and examine the entire building stock with this model? Can developer behavior and decisions be revealed from examinations on the entire building stock? Is it possible to improve the existing model and work on multiple buildings on large parcels instead of single parcel, single building? As these new research questions are answered, the importance of value-driven and data-driven design from the user perspective in academic research will increase.
Conclusion
This study presented an optimization model that optimizes all parameters, such as view, daylight sun hour cost, and sales area, and does this according to different user expectations. Results of the study revealed some of the existing buildings that deviate from optimized solutions according to the model. This suggests the model’s potential to guide real estate developers towards data-driven decision-making, leading to more user-centric and potentially higher-value projects. Beyond the model’s inherent parcel parameters, user preferences for unit types can be integrated via comprehensive market research specific to a developer’s region. This allows generating alternatives that cater to diverse user demands within different locations.
The professional participants emphasized the model’s value in generating preliminary estimates and exploring optimization alternatives during a project’s early stages. This empowers developers with crucial data-driven insights for informed decision-making. However, it is crucial to acknowledge that architectural design involves a complex interplay of factors beyond the model’s current scope. Investor preferences, shareholder structures, sociological considerations, and regional demographics all introduce layers of complexity that can influence design parameters. In future studies, the model can be further enriched with inputs and parameters to be added to this model. The more inputs and layers of market research or architectural design that go into the model, the stronger it will become. The model layers can also be strengthened by adding view criteria, noise, and other parameters related to architectural design and development goals.
While the current model incorporates a cost parameter, further research is needed to refine its representation of construction costs. In practice, the relationship between cost, floor area, and volume is complex. Building codes and regulations can significantly impact costs as building height increases, necessitating upgrades to various systems. This highlights an opportunity for future studies to develop more nuanced cost modeling.
One current limitation is the model’s plan layout restriction – currently, it can only accommodate one, two, or four units per floor. This may have skewed optimized solutions for larger parcels towards 3 + 1 or 4 + 1 units. Additionally, the model is limited to single-building solutions on single parcels. Future research could address these limitations by exploring flexible plan layouts by developing a model that accommodates a wider variety of unit configurations per floor and multi-building parcels by expanding the model’s capacity to optimize building form arrangements on larger parcels with multiple structures. By addressing these limitations, future iterations of the model can provide an even more comprehensive and adaptable tool for real estate developers.
Footnotes
Author contributions
Eymen Çağatay Bilge: Conceptualization, methodology, data collection, analysis, and writing of the manuscript. This work forms part of the PhD thesis under the supervision of Prof. Dr. Hakan Yaman. Hakan Yaman: review and editing, supervision
Declaration of conflicting interests
The author(s) declared no potential conflicts of interest with respect to the research, authorship, and/or publication of this article.
Funding
The author(s) received no financial support for the research, authorship, and/or publication of this article.