
Abstract
As we strive to improve efficiency and minimise environmental impact in the construction industry, it is important to consider how these objectives impact the work and productivity of designers. This article presents a tool to assist designers in matching reclaimed building products with design intent. The demonstration is based on an actual design project of a two-storey public building made of reclaimed timber from disassembled barns. The algorithm’s objective is to propose optimal matching in terms of a structure’s environmental impact without overloading the user with additional work or excess information. The impact includes emissions embodied in material and related to the transportation from the donor site. The algorithm is integrated into the Grasshopper interface for easier use. All the inputs and objectives are quantitative and fully customisable. The user can still assess qualitative characteristics thanks to a graphical representation of the result. The demonstration shows how automation can simplify the design process with reclaimed elements, support traditional design workflows and enable improvements towards a more sustainable construction industry.
Introduction
The Industrial Revolution and technological advances in the 18th century facilitated economic growth and an unprecedented pace of construction, mainly using steel and concrete. Unfortunately, these developments have come at the cost of depleting natural resources and emitting large amounts of greenhouse gasses. These days, close to 9% of those emissions are related to construction and building materials. 1 Despite global initiatives, such as the 2015 Paris Agreement aimed at limiting the global temperature increase, emissions from the building industry continue to rise. 2 As further growth in the building industry is expected in the years to come, 3 and given international commitments to improve, the way buildings are constructed needs to change. One approach to lessening new buildings’ environmental impact is reusing elements reclaimed from disassembly.4,5 Reuse fits into the circular economy model by prolonging the material flow and replacing a linear, single-use approach. 6
Reuse design challenges and strategies
When designing, several considerations can make future disassembly easier. The ISO 20887 about design for disassembly and adaptability 7 supports such a proactive approach with guidelines on accessibility and reversibility of connections, repetitiveness and independence of elements. However, most existing and newly built buildings are not designed with disassembly in mind.8,9
Several new challenges are imposed upon the designer when dealing with reclaimed materials, preventing the broader adoption of reuse. Existing studies show barriers related to legislation, economy, procurement, documentation, missing infrastructure, socio-culture and logistics.10,11
Addis 12 described how incorporating reused goods differs from usual building design, depending on the availability of the materials. The process becomes increasingly complex and includes several redesigns to accommodate the available elements and interdependencies between them. 12 This significantly increases the design price, as confirmed by the interviews with industry representatives. 8
We identified distinct design strategies for incorporating reclaimed elements in the design. The first strategy – design-driven – is to design as usual and then search for reclaimed elements that could be applied in the building. Such an approach does not require designers to change their workflows. Design-driven strategy is usually applied to repetitive, often standardised elements such as bricks or tiles. In the case of other building components, it might be harder to find relevant products once the design is completed.
Another design strategy – supply-driven – is to document available elements first, and then design using such a collection of pieces. This approach is similar to designing modular buildings from a catalogue of prefabricated modules. It has the advantage of high utilisation of available elements but is constrained by their availability and data quality. It often also requires ordering and storing the elements in advance for the duration of the design process.
Computational methods can aid both strategies. The supply-driven approach can benefit from parametric modelling, enabling the manipulation of design parameters such as heights, span lengths and grid spacing to propose an optimal design based on the geometry of available elements. Brütting et al. 13 demonstrate how design can be optimised based on boundary conditions, loads and limited stock of supply elements. This strategy leads to highly optimised results. However, it requires an entirely diverse approach to the design, affecting the choice of tools, freedom and role of a designer in shaping a building. Moreover, all aspects must be defined as numerical parameters to be included by the algorithm. Something especially hard with aesthetics, human comfort or normative compliance.
In addition to the design process, another major challenge in the construction industry is the low productivity 14 and slow technological advancement 15 in the assembly process. The introduction of circularity considerations further complicates the issue. Both sourcing the old products and the assembly of structures are highly manual and time-consuming. Novel research projects aim to increase assembly automation using robots on- and off-site. Recently, Lauer et al. presented their latest research within the Cluster of Excellence Integrative Computational Design and Construction for Architecture, developing robotic on-site assembly of complex structures, 16 aiming to increase efficiency and reduce the strain on industry workers. Pedersen et al. present a methodology combining on-site robotic manufacturing with manual workers for the fabrication of timber joinery. 17 Robeller and Von Haaren combine digital manufacturing and circularity with their work on a gridshell constructed from CLT cut-offs. 18 Trummer et al. developed a circular floor slab using timber and earth, showcasing the potential for a reduced environmental impact in construction combined with robotic manufacturing. 19
This paper focuses on the design-driven approach supported by automatically matching the design with a documented stock of available elements. It aims to preserve and enhance a typical design approach. The study by Huang et al. 20 shows the feasibility of the matching implemented in a visual programming environment to design a geodesic dome structure. Thanks to the reduced time to perform the matching, the technology can provide immediate feedback to the designer at early stages, allowing to make changes to utilise the reclaimed elements better. 21
Algorithms aiding reuse matching
Several examples exist of using different mathematical problem formulations to assign reclaimed elements to new structures. Brütting et al. published a series of papers demonstrating the use of a Mixed-integer problem formulation to design steel truss structures using reclaimed elements.13,22,23 Parigi has investigated the creation of reciprocal frames from timber cut-offs, 24 while Amtsbert et al. and Huang et al. use a Hungarian algorithm for unprocessed timber,20,25 and Baukauskas et al. use a Greedy approach 26 to allow for reclaimed elements.
Most of these algorithms are created in a closed environment separate from the designers’ familiar software. These algorithms should integrate with tools already familiar to designers for broader adoption. This can help reduce the entry barrier by adding up to their existing experiences, allowing for enhancing typical design routines. Huang et al. provide an example of embedding Hungarian algorithms to create dome structures from the reclaimed elements of a single-family house in the visual programming tool Grasshopper. 20 Warmuth et al. use the same software for implementing a Mixed integer solver for stock-constrained design. 27 Similarly, our research integrates algorithms developed in our previous paper 21 inside Grasshopper and tests them in a design project.
Case study
As a case study, we use an ongoing design project in which the authors are actively involved – the extension of the Sletteløkka community house in Oslo. 28 The architects aim to develop an extension for the thriving community house and enhance the space to make it easier for neighbours from different cultures to connect through engaging activities. The idea started with the architects’ intention to create a façade reusing elements for the third time. Original elements were reclaimed from a disassembled Japanese house from the 1950s and used at the 17th Venice Biennale in 2021 as part of the ‘Takamizawa House’.29,30 Then, the elements were brought to Norway to serve for a third time. Striving for even greater reuse, the designers wanted reclaimed elements also in the load-bearing structure. To achieve this, the team sourced reclaimed materials and created a material bank of available elements. Using a matching algorithm, we intend to support designing load-bearing structures made from reused material.
Research objective and paper structure
This paper demonstrates how a computational design methodology effectively facilitates the designer reusing reclaimed elements to create a more environmentally friendly structure. By demonstrating this methodology in a case study, we aim to answer the question: how can we utilise computational design to assist architects and engineers in transitioning to a circular economy?
The following section explains how we worked with reclaimed elements and the technology used. We then discuss the development of the algorithm since its initial publication and how it is used as a tool inside McNeels’ Grasshopper and Rhinoceros (Rhino) software. The tool includes a library and interface allowing interaction and visualisation of the results of substitutions in the architectural model. Then, we present the results, including the environmental benefits of reclaimed elements and the visual changes after their insertion. Lastly, we discuss the advantages and disadvantages of introducing the matching algorithm into the design process.
Method
The tool demonstrated in the case study is based on the code library developed and covered in the work of Tomczak et al. 21 In this research, the tool is developed to allow designers to use the code within the user interface of Grasshopper. The tool handles data processing and allows non-coding users to apply the matching solution.
In the following subsections, we cover the key aspects of the tool, from the collection and processing of data, technical aspects of the tool implementation and the output and communication of results. We also describe the new features built on top of the existing code, including data conversion, evaluation of transport, custom score functions and capturing user preference for the matching.
Data collection
Demand element specification
The information about elements needed to construct the design – demand elements – can be taken from an early-stage design model or an almost-finished project with a high detail level. The information for the matching algorithm can include, for example, the cross-section, material and length. In many design software, this information is readily available; sometimes, we are only given the geometry of elements. In this work, we propose how to solve the lack of such information in the case of rectangular timber elements.
This work focuses on the load-bearing structure, which comprises timber beams and columns, metal plates and fasteners used for the connections. Using this as a basis, a Grasshopper script is employed to select only the essential components required for the matching algorithm and then extract the necessary attributes for solving the matching problem.
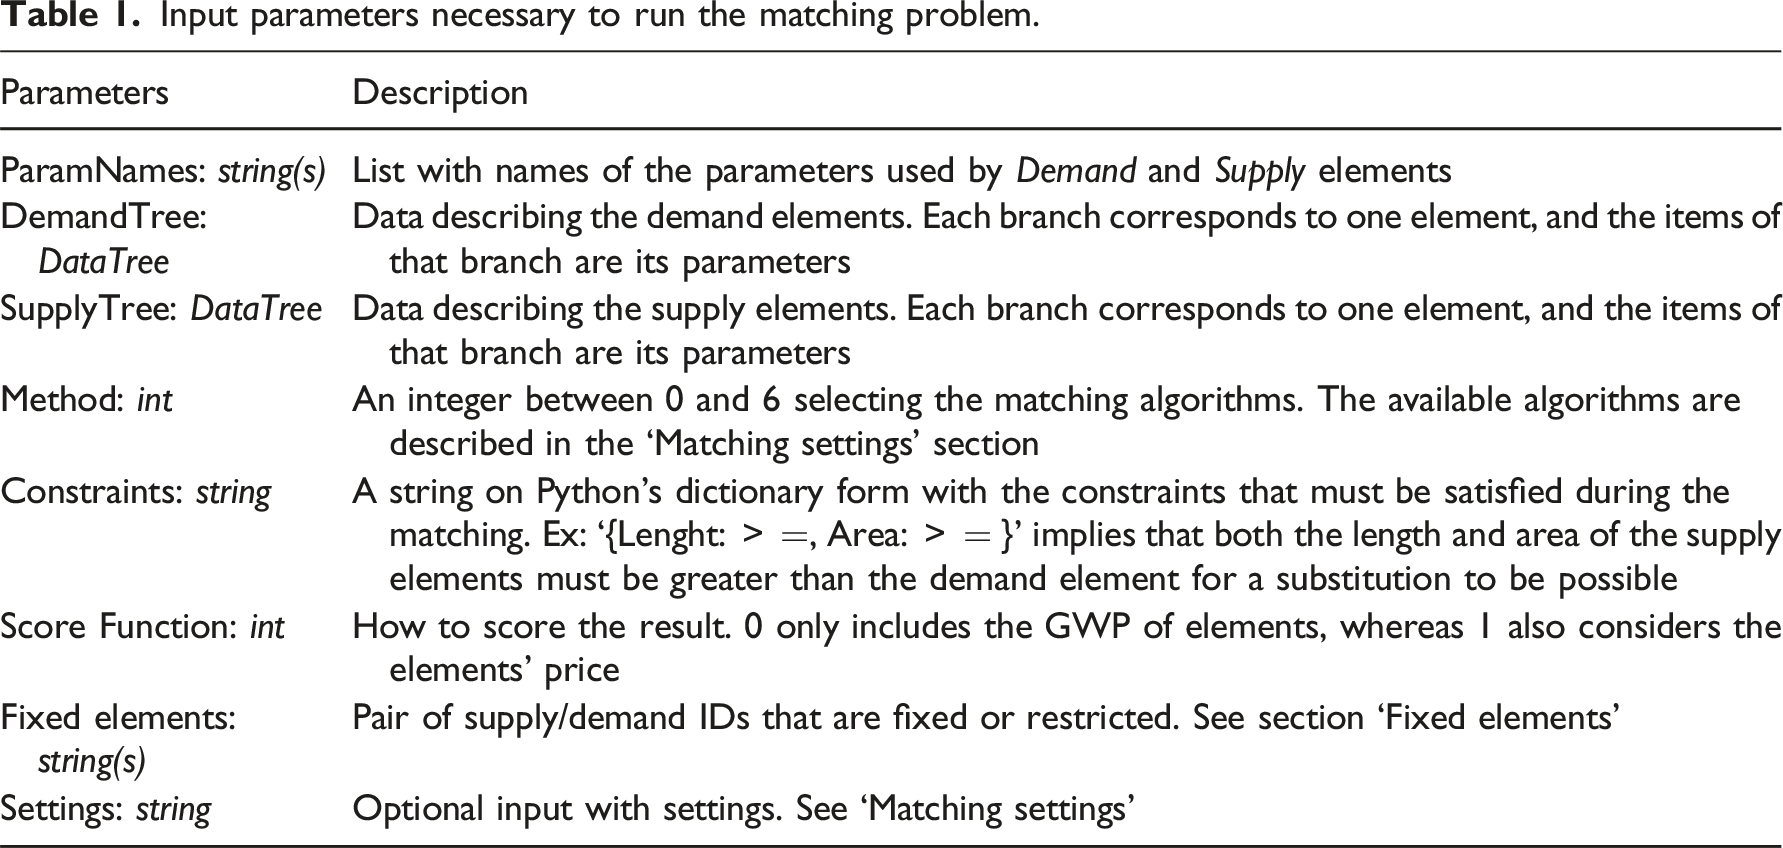
First, the elements are filtered by their volume to remove metal fasteners from the selection. With only the elements of interest remaining, the next step is to obtain the ‘original’ unprocessed elements. A minimum bounding box in the local coordinate system is calculated for each element using all the vertices of its geometry, from which their length and cross-section can be derived. The process is illustrated in Figure 1, where Figure 1(a) shows a connection with detailed members containing cuts and holes; Figure 1(b) contains the ‘original’ elements before processing and their cross-sections in blue. From the bounding boxes and cross-sections, the data used for the matching algorithm is extracted and used as input to the matching algorithm, as described in Table 1. Minimum bounding boxes are used to extract the length and cross-section properties from the demand model. (a) Original geometry from design model, (b) Bounding boxes and element sections (blue). Input parameters necessary to run the matching problem.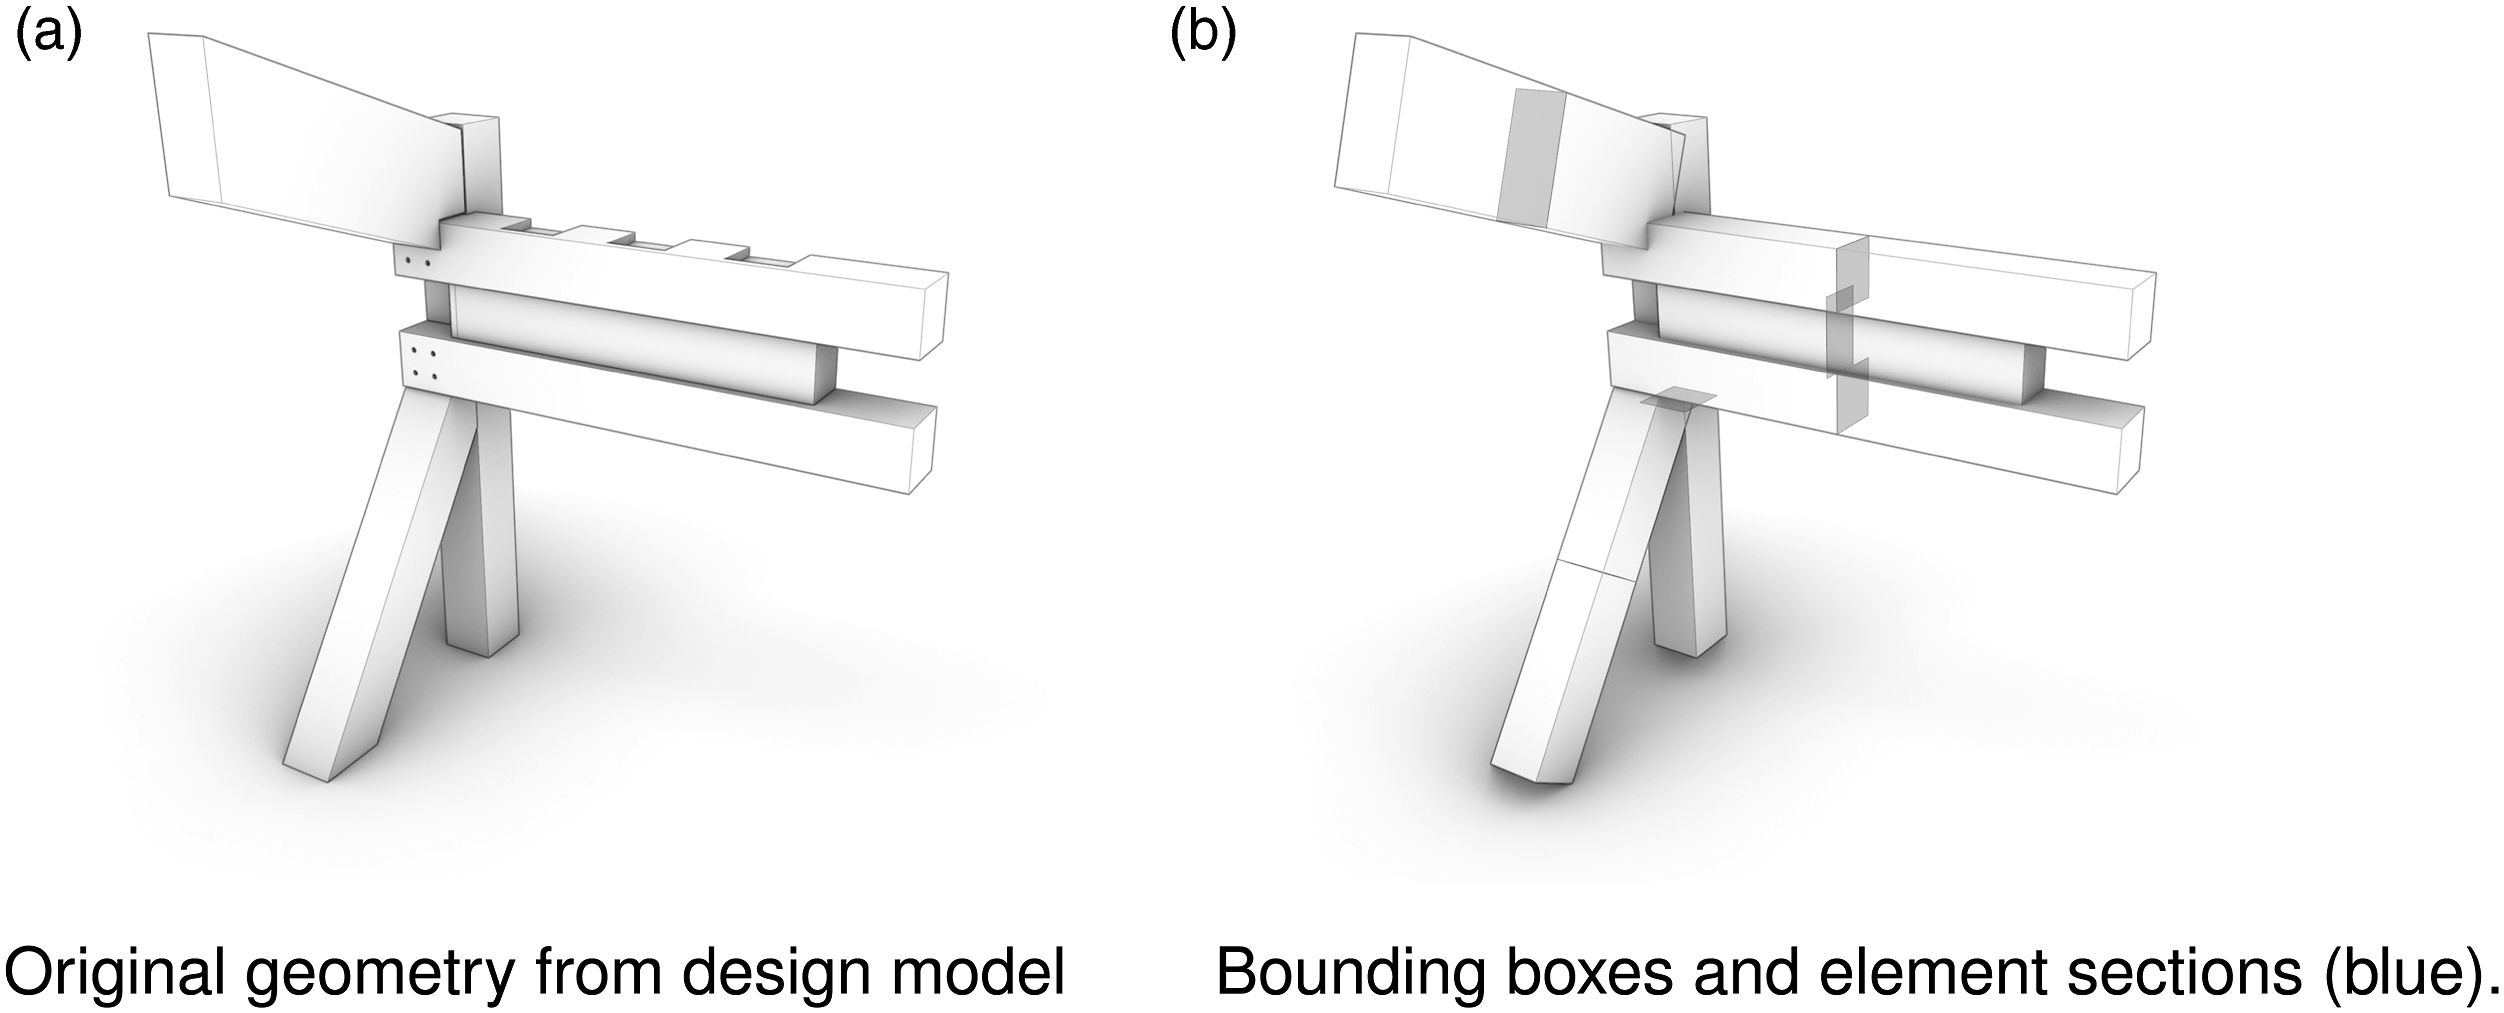
Documenting supply elements
Whereas the demand elements from the designer’s model are digital and do not yet exist, the supply elements are a digital representation of physical objects. Therefore, gathering data from physical elements that can be reused and digitised in a database is necessary. This process involves assigning numbers, taking measurements, visually inspecting the elements, assessing their quality and potentially 3D scanning. Even though there are hundreds of reused building components resellers in Europe, not many provide an actual database of available products. 31
This work uses two approaches to digitise the elements to be reused. The first method is a visual inspection, manual measurements and photography of each element, with the results stored in a spreadsheet. The information can then be used to create a digital model with approximately the same geometry and some information about the assumed quality of the material. The second and preferred method is to scan each element to obtain an accurate three-dimensional mesh with the texture of the physical object. The scanning was done using a hand-held Structured Light 3D scanner, ‘Einscan Pro HD’ from ‘Shining 3D’. The obtained cloud points had to be processed in a dedicated ‘EXScanPro-3.7.3.0’ software to align and match scans, remove redundant points and generate meshes with textures that could be used in the modelling software.
From the mesh representation of supply elements, the numerical data is extracted from the digitised supply elements and inputted into the matching algorithm. This is performed with a script; the steps are illustrated in Figure 2. Firstly, a line is fitted through the mesh’s vertices to approximate the centre line. Then, n perpendicular planes are created along the centre line. These planes help find the cross-section curves derived at intersections with the mesh. By a Boolean intersection of the projections of the n cross-section curves into the centre plane, we obtain the minimum useful cross-section of the irregular beam. Subsequently, the relevant attributes of the cross-section are obtained and inputted into the matching tool along with the length of the centre line. By changing the number of intersection planes along the centre curve, the algorithm’s accuracy is increased at the price of additional computational time. The mesh from 3D scanning, with four cross-sections (red) along the derived centre curve (yellow) and a minimal cross-section (yellow).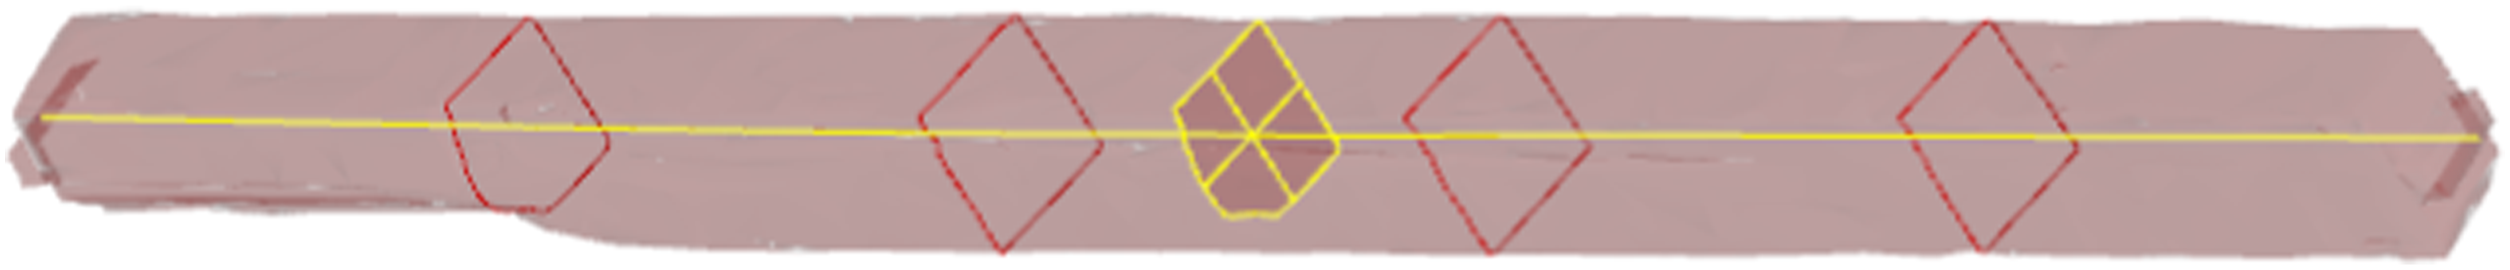
The matching tool
Visual programming interface
The backbone of the tool is the open-source code available at Zenodo. 32 Because it lacks a user interface to interact with, we integrated it into the visual programming interface of Grasshopper by wrapping the Python code inside a custom component for the software written in C#. The two languages use different data structures to store nested data. While the first uses DataTrees, the latter uses nested lists. Before running the Python scripts, all input data is converted to native data types, although the user can supply native data and external files or resources. Table 1 lists all inputs to the custom component that feeds the matching tool. After receiving its inputs, the wrapper writes the data from the two DataTrees of demand and supply elements to JSON files stored temporarily in the tool’s folder. Then, the Python code is executed from the terminal with the user inputs and JSON file paths as arguments. After completion, a new JSON file with the results is generated. Then, the wrapper reads the result and returns it in Grasshopper as a DataTree; the supply index is the branch path, while the index of the elements substituted by that supply element is the list of integers within that branch. In cases where no elements are matched for a supply element, the branch contains an empty list. The second output of the wrapper is a string with information about the results. It includes useful information such as run-time, the method used, the number of substituted elements, the total change in volume after the substitution, the final score and the contribution from transportation if included.
Environmental impact of transportation
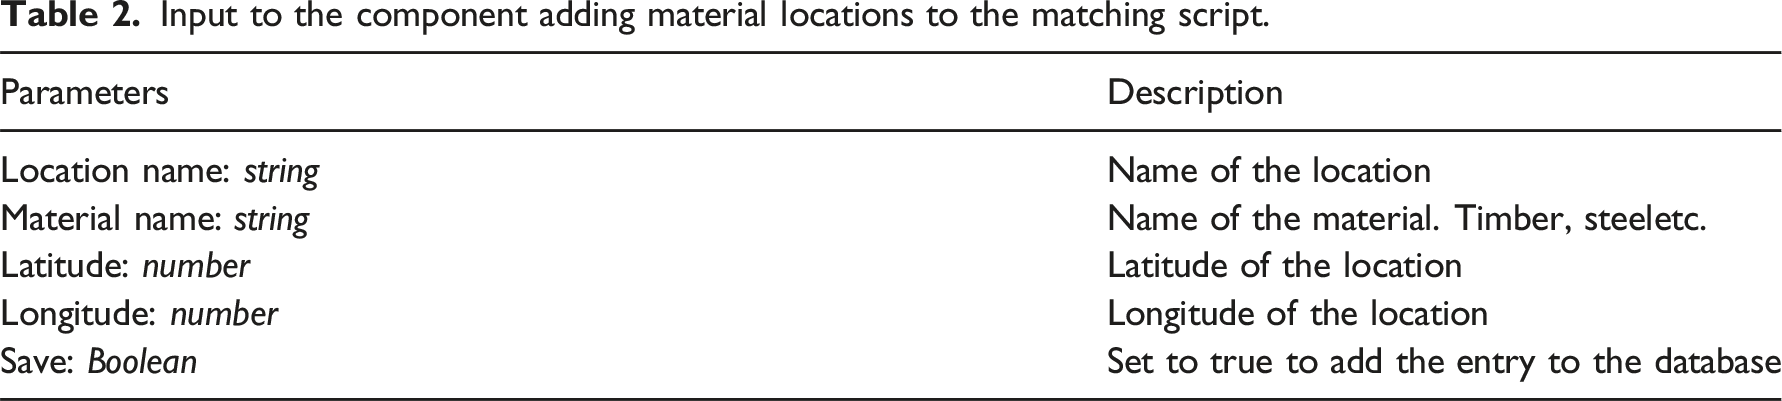
When deciding whether or not a reclaimed element should substitute a new one in the demand model, the distance that element needs to be transported influences the decision. To account for this, the user can add the coordinates of demand and supply elements before running the matching algorithm. The current version multiplies each element’s weight with the driving distance and a transportation constant. This constant can be overridden in the global settings. The driving distance is calculated using the Open Source Routing Machine API. 33 To add coordinates to the elements, the user inputs two additional values named ‘Latitude’ and ‘Longitude’. If these columns are present in both DemandTree and SupplyTree, the score of the driving distances from the materials’ location to the building site is included when selecting substitutions. The coordinates for the demand elements should all be set to the location of the building site, while the coordinates of the supply elements should be their actual location.
Input to the component adding material locations to the matching script.
Matching settings
In cases where the user wants different values for the GWP scores, cost of material, cost of transport, etc., the pre-defined settings in the algorithm can be modified using the ‘Settings’ component. The user overrides the default settings in the component inputs and connects it to the tool component.
The ‘Method’ input takes by default the greedy algorithm capable of utilising cut-off elements (plural assignment), but several algorithms are available to users: (1) Greedy algorithm with single assignments. (2) Maximum Bipartite with single assignments. (3) Maximum Bipartite with plural assignments. (4) Genetic Algorithm with single assignments. (5) Brute Force with single assignments (small problems only).
User preferences as input
After running a matching procedure and visualising the results in the architectural model, there may be certain parts of the results that the designer wants to replace. For example, discolouration of an element may be unwanted in visible locations. This is addressed by the ‘Fixed elements’ input. Users can lock in place elements that are matched well and specify those whose matching is unwanted before re-running the algorithm. This field takes as input a list of strings corresponding to the identifiers of the demand and supply elements. If elements are to be restricted from a possible substitution, the user inputs ‘D i ! = S i ’. On the other hand, given that the substitution adheres to the global constraints, a supply element can be fixed to the supply element by adding ‘D i == S i ’. To improve the user experience, the user could select desired and unwanted elements instead of providing a list.
The matching procedure
The matching algorithm first establishes the problem’s incidence matrix with dimensions n demand × m supply . This matrix describes all the possible substitutions based on the applied constraints. The value at index ij is 1 if demand element i can be substituted by supply element j; otherwise, it is 0. Next, the possible substitutions are weighted according to the selected score function, resulting in the weighted incidence matrix. Finally, the selected matching method uses the weighted incidence matrix to find a combination of substitutions, giving the greatest score reduction compared to the initial structure. For an exhaustive explanation, refer to our prior paper. 21
Visualising the result
After the matching, the information about matched elements is used to enrich the design model to communicate the results beyond numbers and graphs about savings, contributions from transportation, environmental reduction, etc. With the architectural model and digitised supply elements in CAD software, we can position the ‘twin meshes’ of reclaimed elements to the parts of the architectural model selected by the matching algorithm. This way, we can introduce the information of scanned meshes about textures, colours, cracks, deformations, holes and pockets in the architectural model. Thereby adding value and information when convincing designers and stakeholders about the effects of using such elements. It is also useful during the matching process to identify elements that might fit particularly well in one place or others that should be limited to appear in another. To keep the texture otherwise lost when referencing objects to Grasshopper, a final algorithm working directly on objects in Rhino is used to split supply elements and move them to the correct location in the designed model. Figure 3 illustrates the split and transformation of a supply element to multiple demand elements in a model. Illustration of one supply element mapped to five demand elements using the mesh of the scanned object.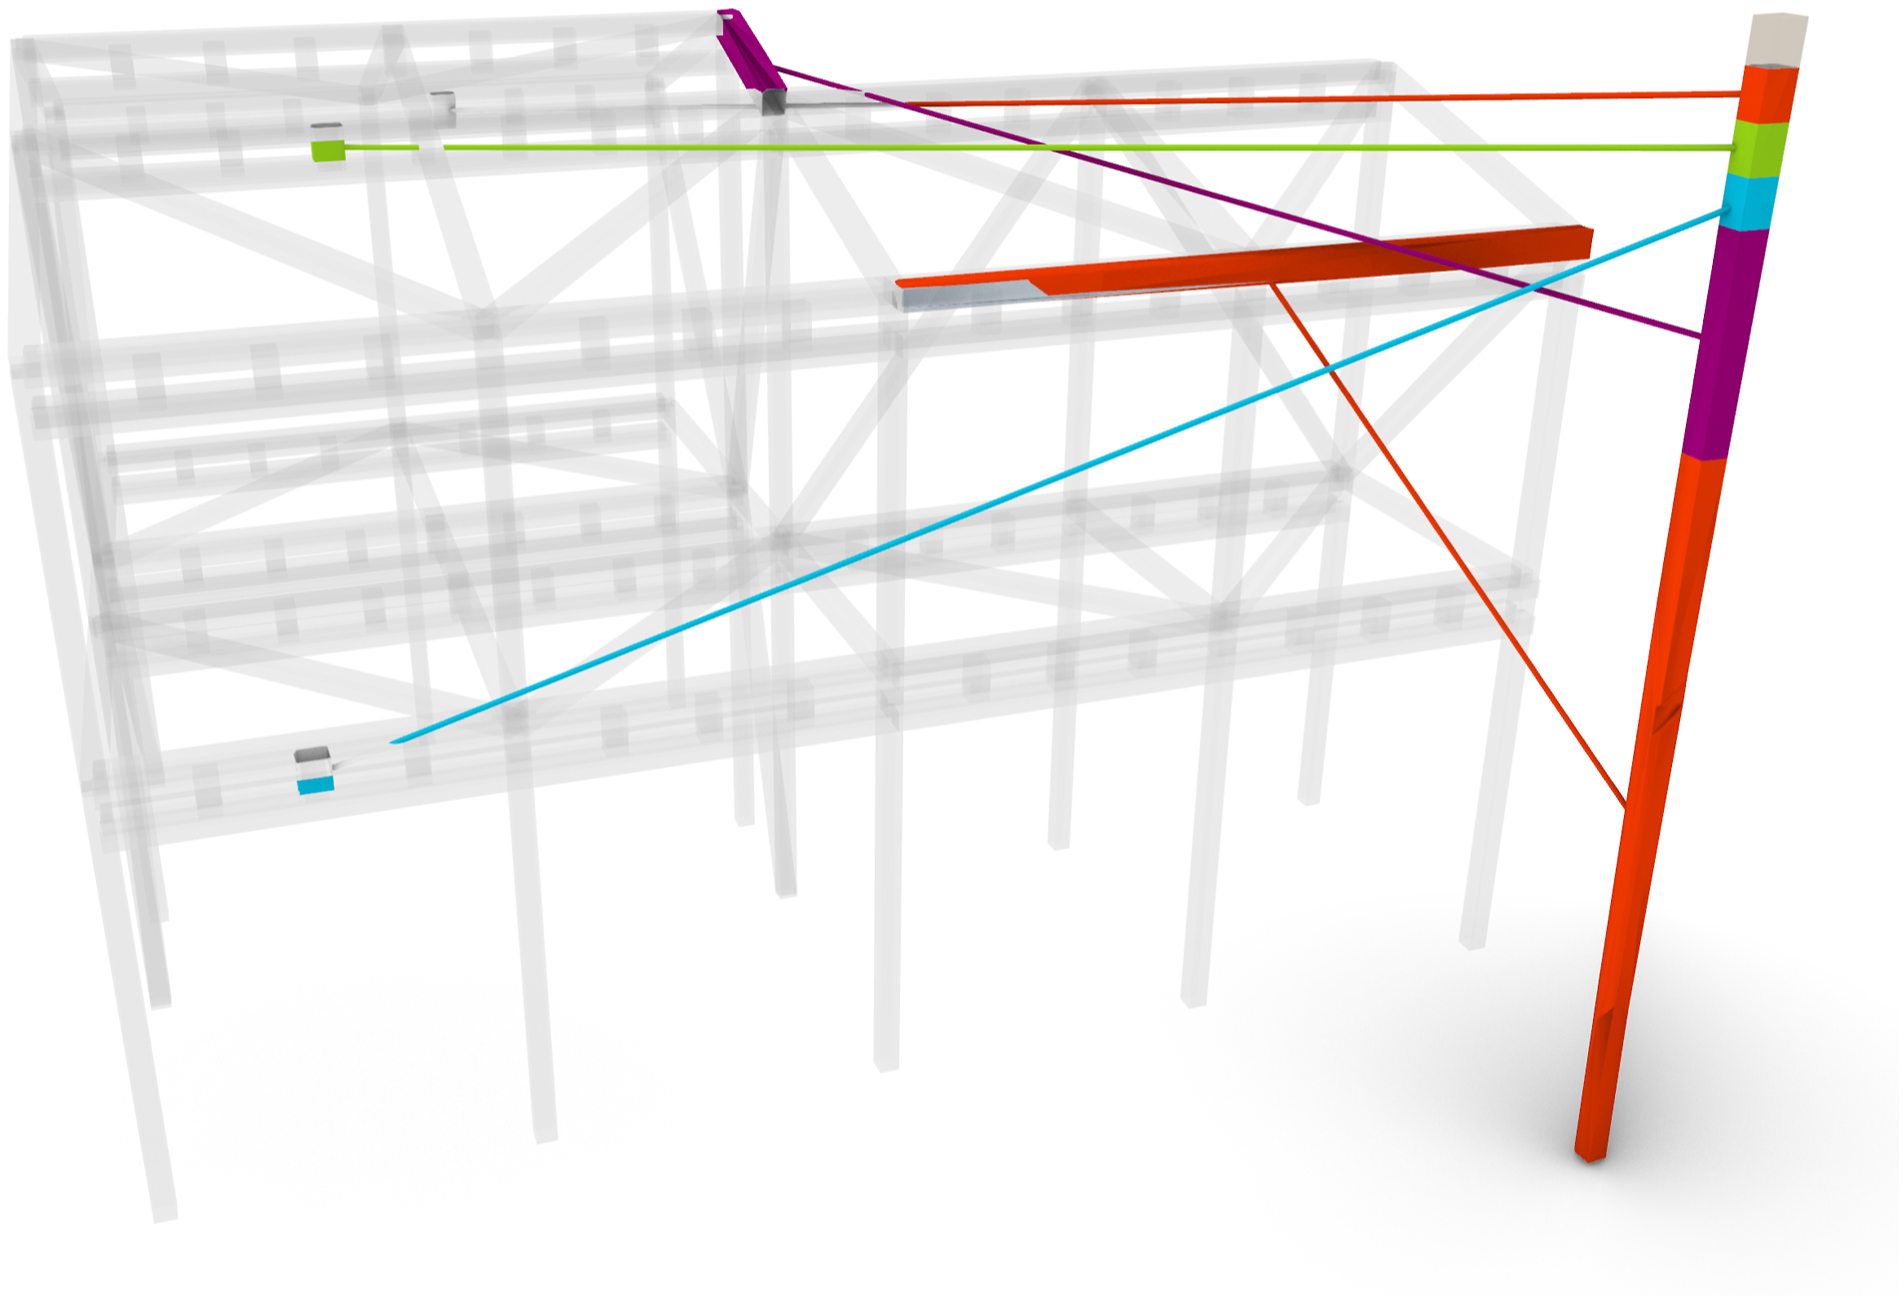
Case Study – A community house in Oslo
The presented methodology is demonstrated on the building pictured in Figure 4. Although it is a relatively small building project, it takes considerable time for the designer to manually explore all possible substitutions between demand and supply elements. Automating the assignment of reclaimed material significantly simplifies designing with reused elements. Architectural model of the case study. The façade is reclaimed Japanese timber, and the structural system is Norwegian timber.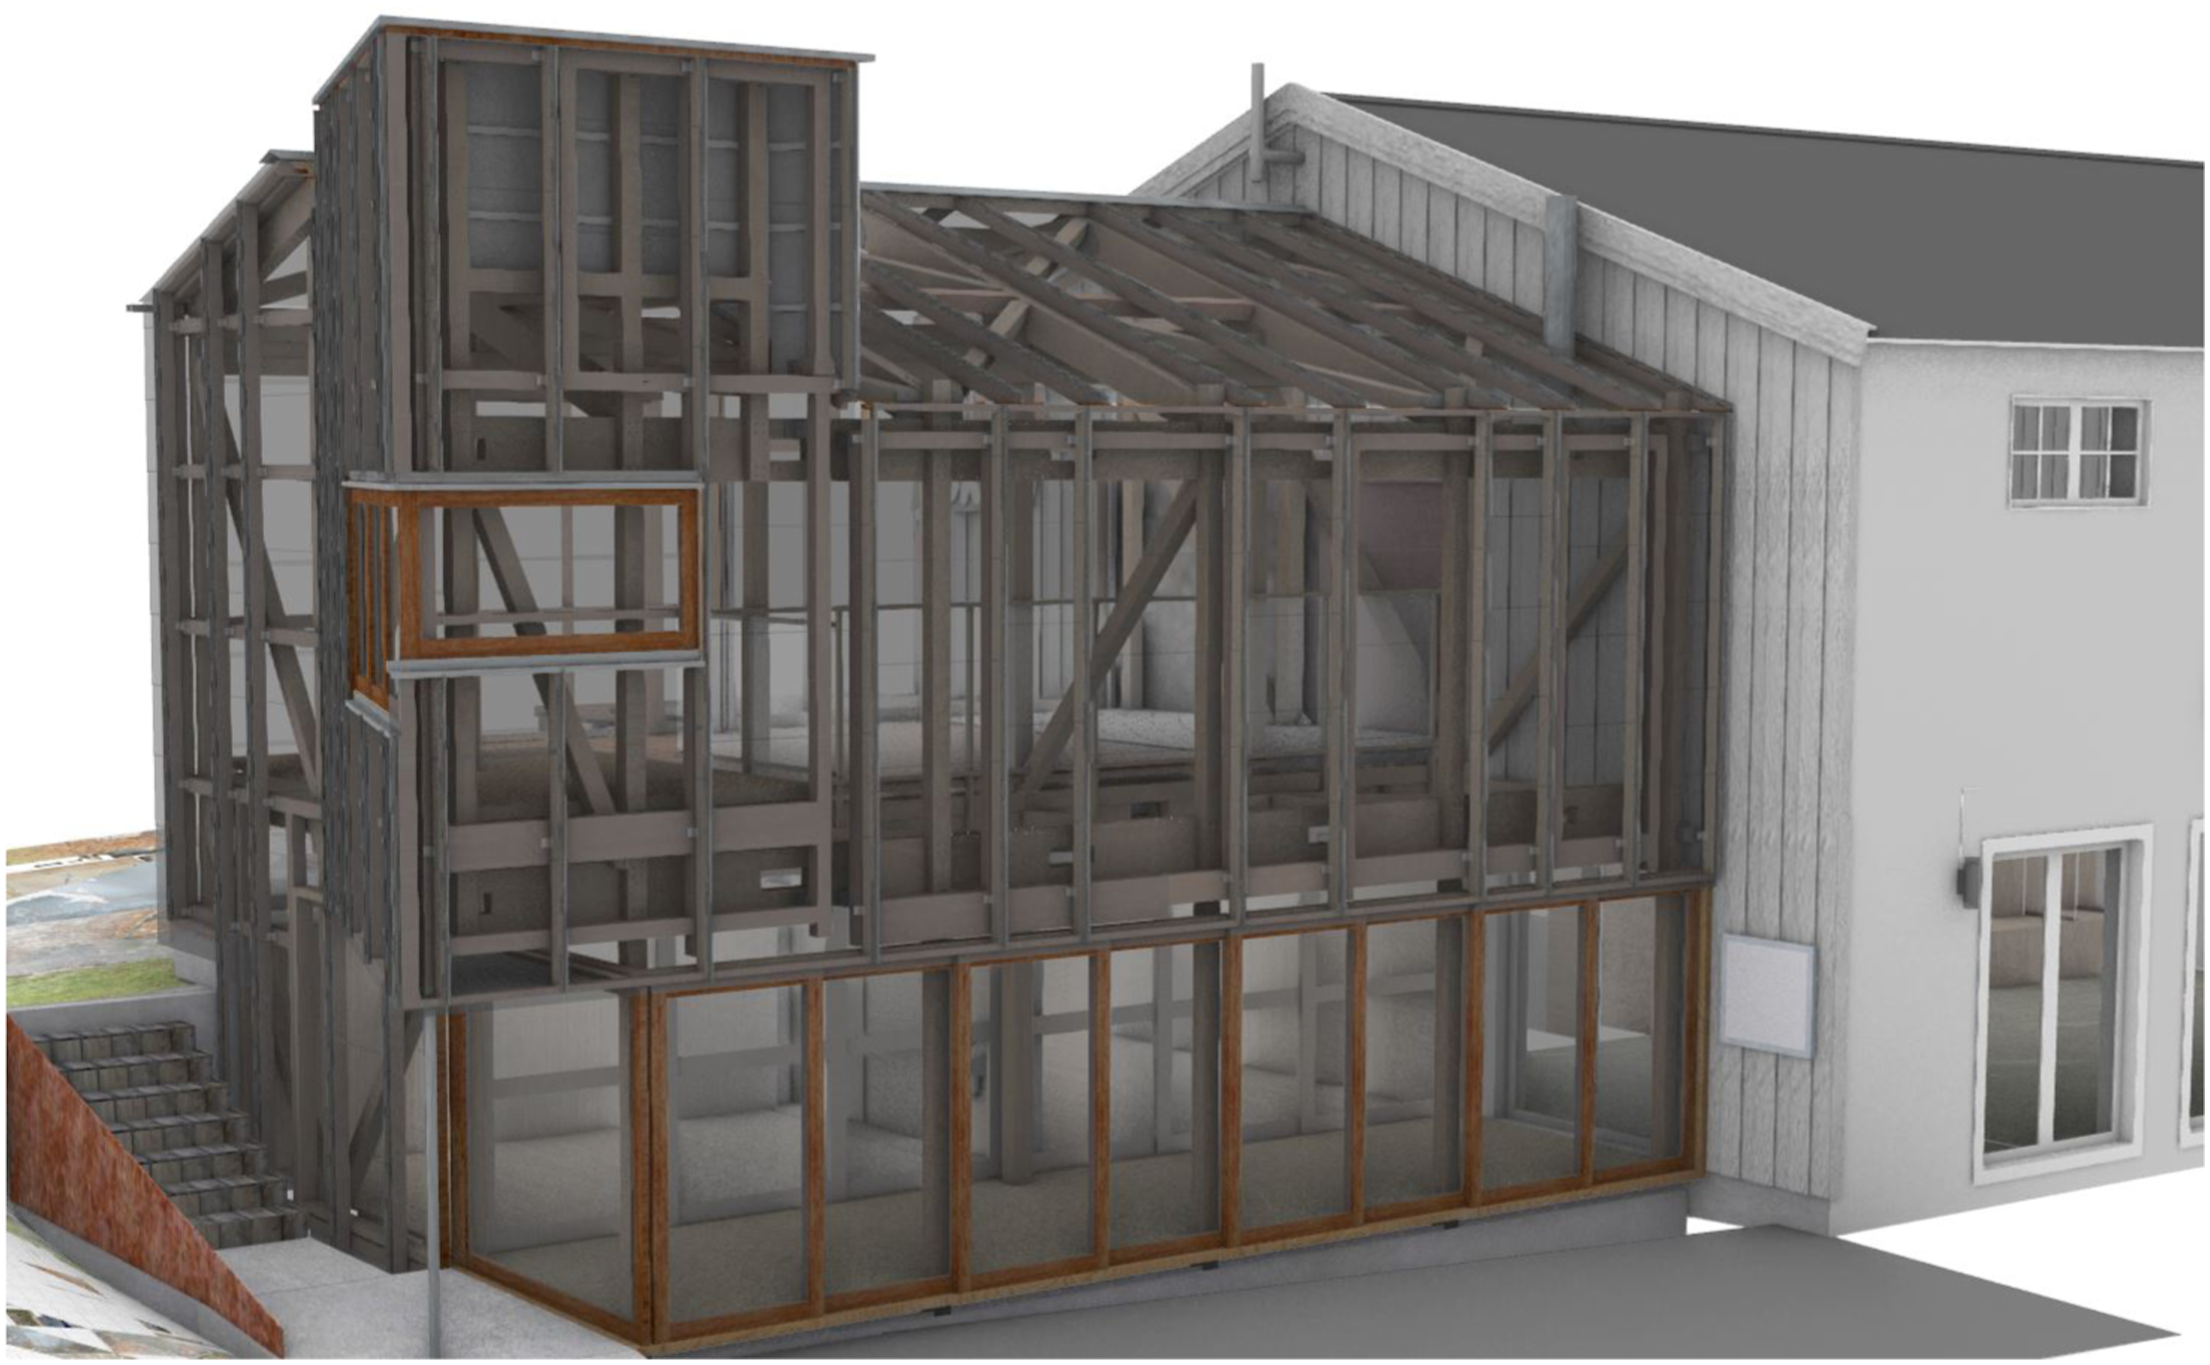
The designers also intend to use reclaimed elements for the load-bearing structure. To enable this, the structural grid is set up based on 205 cm spacing with structural consideration and available span lengths in mind. Because of the non-continuity of the second-floor slab due to the raised floor atrium, horizontal braces and perpendicular beams are provided to transmit lateral forces and support the south-facing façade. Continuous vertical braces are assumed on the west face of the building in the transverse direction as lateral resisting members. Due to the openings at the interface of new and old buildings, diagonal bracing elements were impossible in some locations, and the structure could not be designed as structurally independent of the existing building. The lateral and horizontal forces near the existing building are transmitted after assessing its load-bearing capacity.
All structural members are made of Norwegian pine. The experts indicated a grade of the material to be a minimum C30 by visual inspection. For safety reasons, a more conservative C24 grade was assumed in the structural design. The Japanese elements could not be assessed for structural performance, so for safety reasons, they were not applicable as a primary structure and will serve as a substructure for the façade members subject to wind pressure loads.
With a structural system set up, an initial analysis of the system was conducted to design approximate cross-sections for all elements. In the available stock, most elements have square sections of 15 cm. The primary beams in the longitudinal axis required larger cross-sections than were available. Instead of purchasing such new products, they were redesigned as composite sections with four connected pieces to increase the load-bearing capacity (see Figure 5). The long-span beams were designed by assessing their stiffness and strength as composite elements. For the other secondary beams and columns, where the dimensions of old elements exceeded the minimum requirements, designers decided to use them as is instead of cutting them into smaller sections to keep the elements’ original qualities and allow for additional reuse at the project’s end of life. Construction of the composite beam from elements with a small cross-section.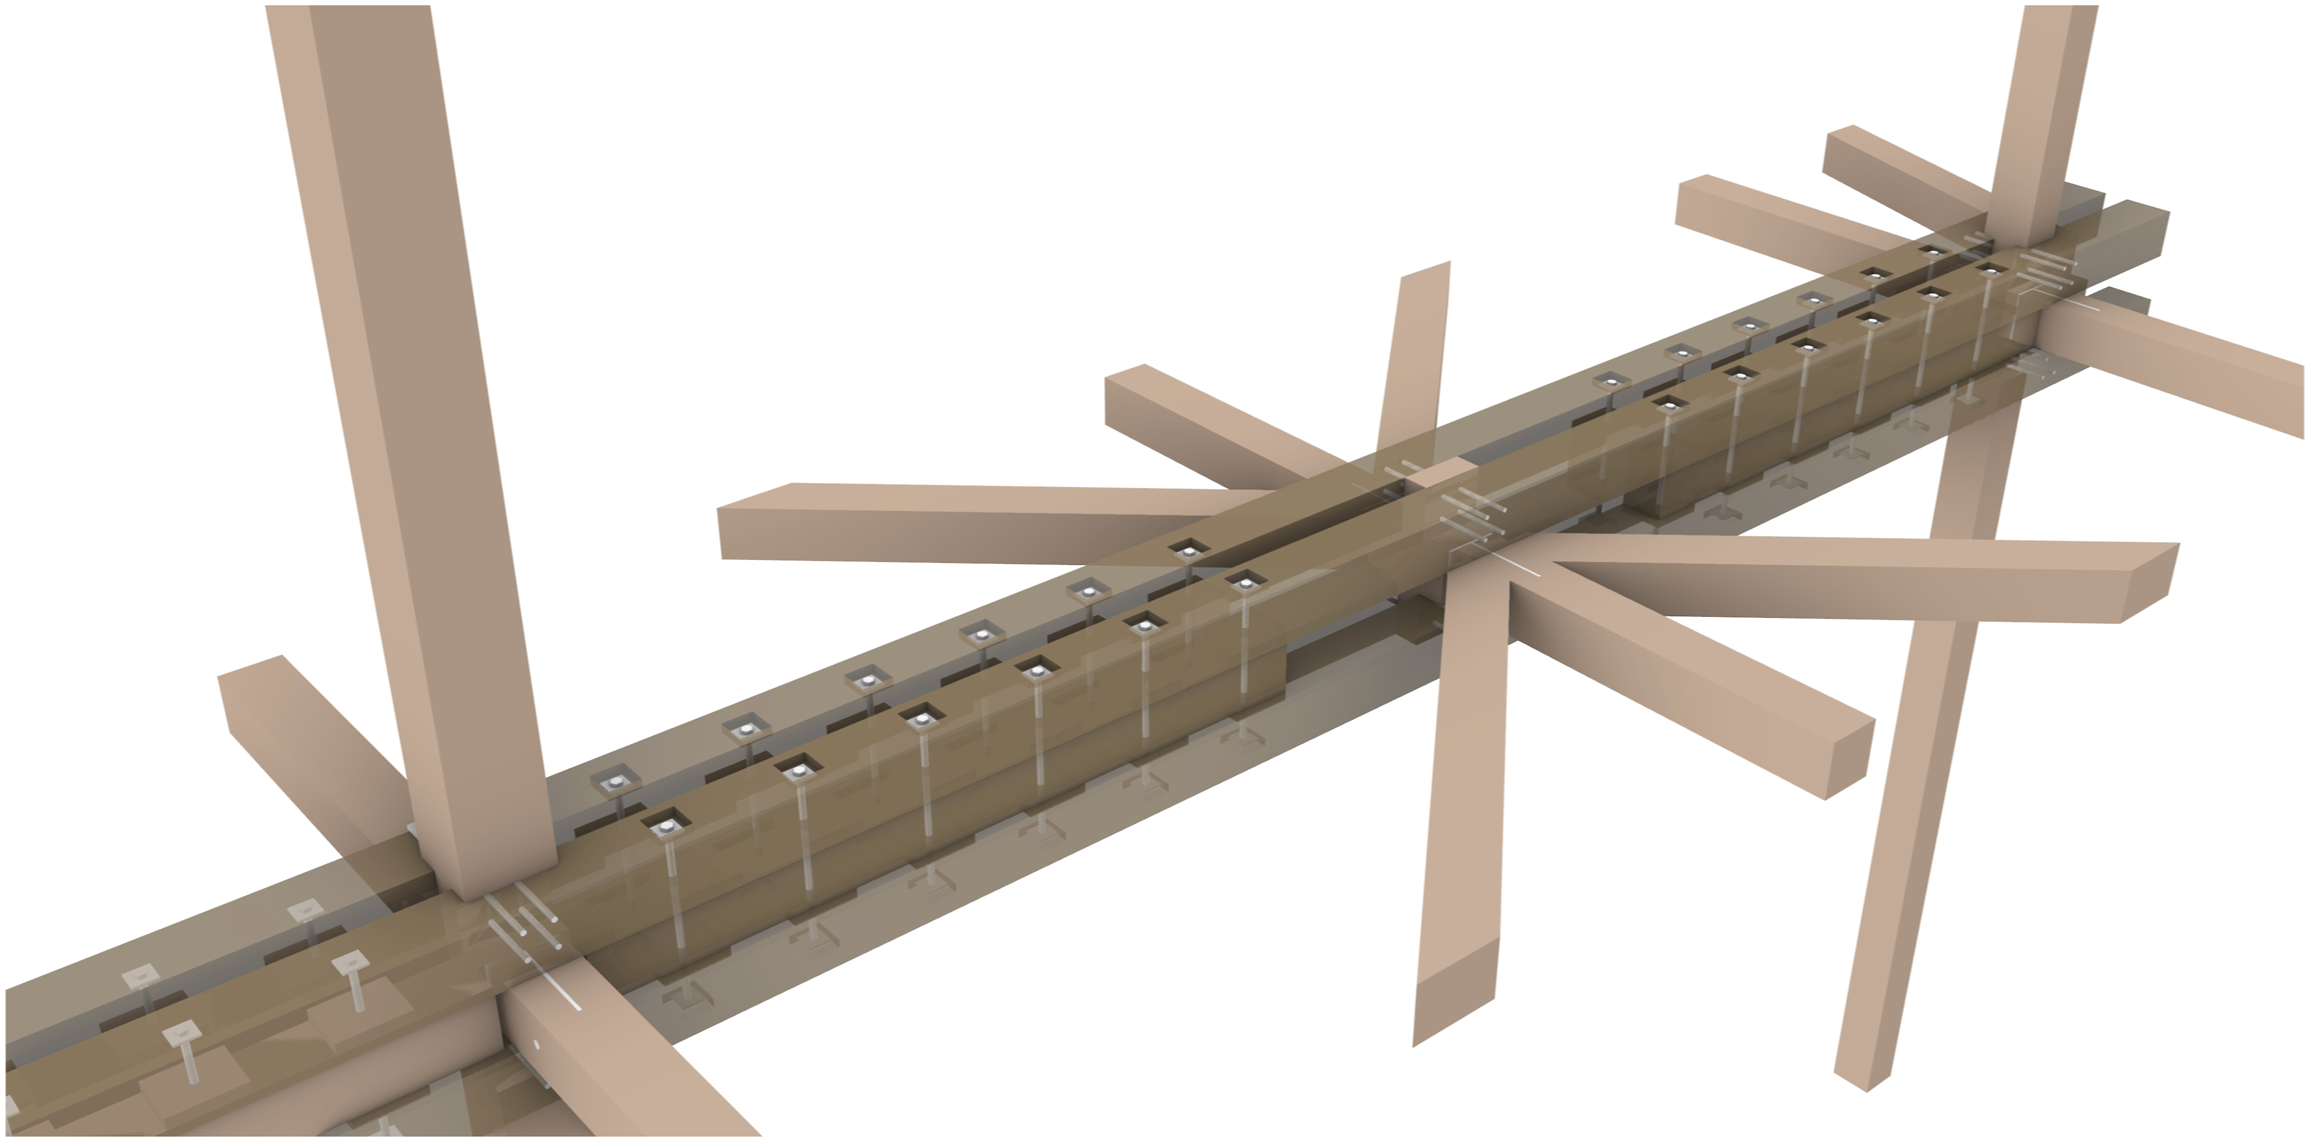
Demand elements
The architectural model illustrated in Figure 4 was prepared in Rhino software. The model consisted of several sub-parts, such as structural elements, the façade and the existing building with its surrounding environment. We extracted the structural system from the file and filtered out undesired elements, including metal connections. By employing the minimum bounding box method, as explained in the Method section, we created a DataTree with the Length, Area, and Moment of Inertia for each element. This process resulted in 182 elements, which we used to obtain essential numerical data.
Supply elements
When carrying out the work, the available supply elements were provided by OmTre, a company specialising in reusing timber materials located in Hønefoss, approximately 70 km from the building site in Oslo. After demolishing old barns, the load-bearing elements were set aside for the disposal of this project. Firstly, before creating the database of the material, we needed to sort out the unusable elements. After more than 100 years of operational time, some damage is inevitable. Some had mechanical damage, others from moisture, while biological damage occurred in some. Figure 6 pictures a log subjected to a termite attack along its edge. We used measuring tape and laser measuring tools to determine the length and cross-section of 158 supply elements. For elements that required rearrangement of the stock, we made conservative approximations due to limited on-site time and practical reasons. We also took photographic documentation of exposed elements that showed visible marks, possible signs of deformation, degradation or joinery. An example of an element where termites have damaged the timber along the edge.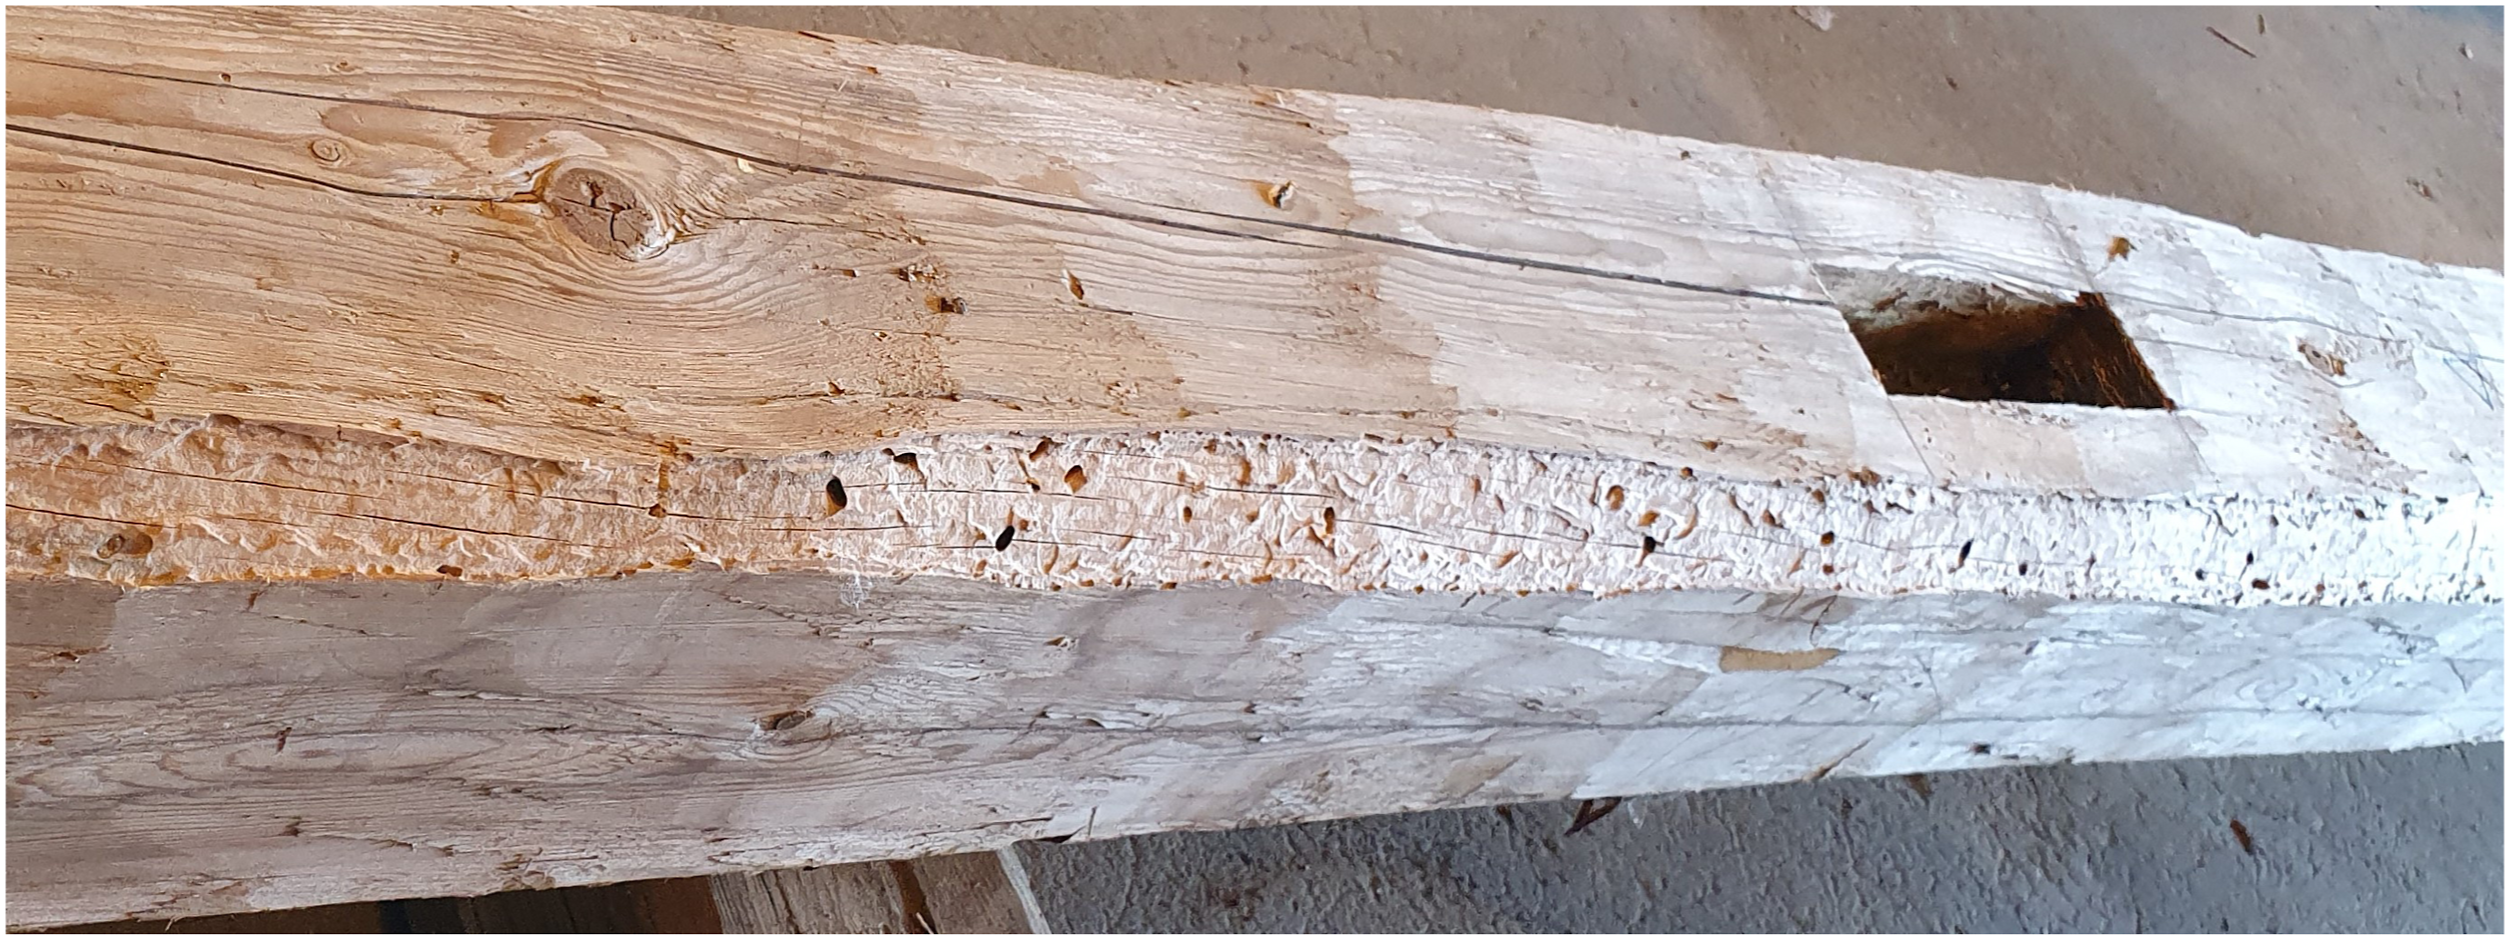
The spreadsheet included the parameters of beam identification number, measurement date, the longitudinal length excluding any end joinery, and length from the end to be cut out. The cross-section included the shape (square, rectangular, oval or round), width and height or diameter, depending on the shape. Moreover, the quality of the elements, ranging from 0.0 to 1.0, was documented. The type of end connection was also documented, with the possible options: flat, tenon or French joint. If there were connection pockets or holes throughout, such information was also documented with approximate location and depth. Additional comments, for example, ‘deep longitudinal crack’, ‘some saw marks’ and ‘red paint on the surface’, were also added to the spreadsheet.
Besides, we scanned 17 elements with a hand-held three-dimensional scanner to obtain more detailed data for designers. Although the intention was to scan all the elements, the time-consuming process of using a hand-held scanner and limited time on-site with them made scanning the remaining elements unfeasible. The post-processing of each scan took hours per mesh.
The final supply dataset of applicable elements ultimately consisted of 82 elements. Of these, 17 were obtained through hand-held scanning of point clouds, while the other 65 were created in Rhino using measurements from the spreadsheet. As a result, only a fifth of the supply set benefited from visualising the substitution in the demand model. The scanned supply mesh is depicted in Figure 7, which includes all the elements generated with a scanner. Mesh representations of the scanned elements in Rhino illustrate each element’s shape, colour and imperfections. (a) All the scanned elements, (b) Detail of a scanned mesh.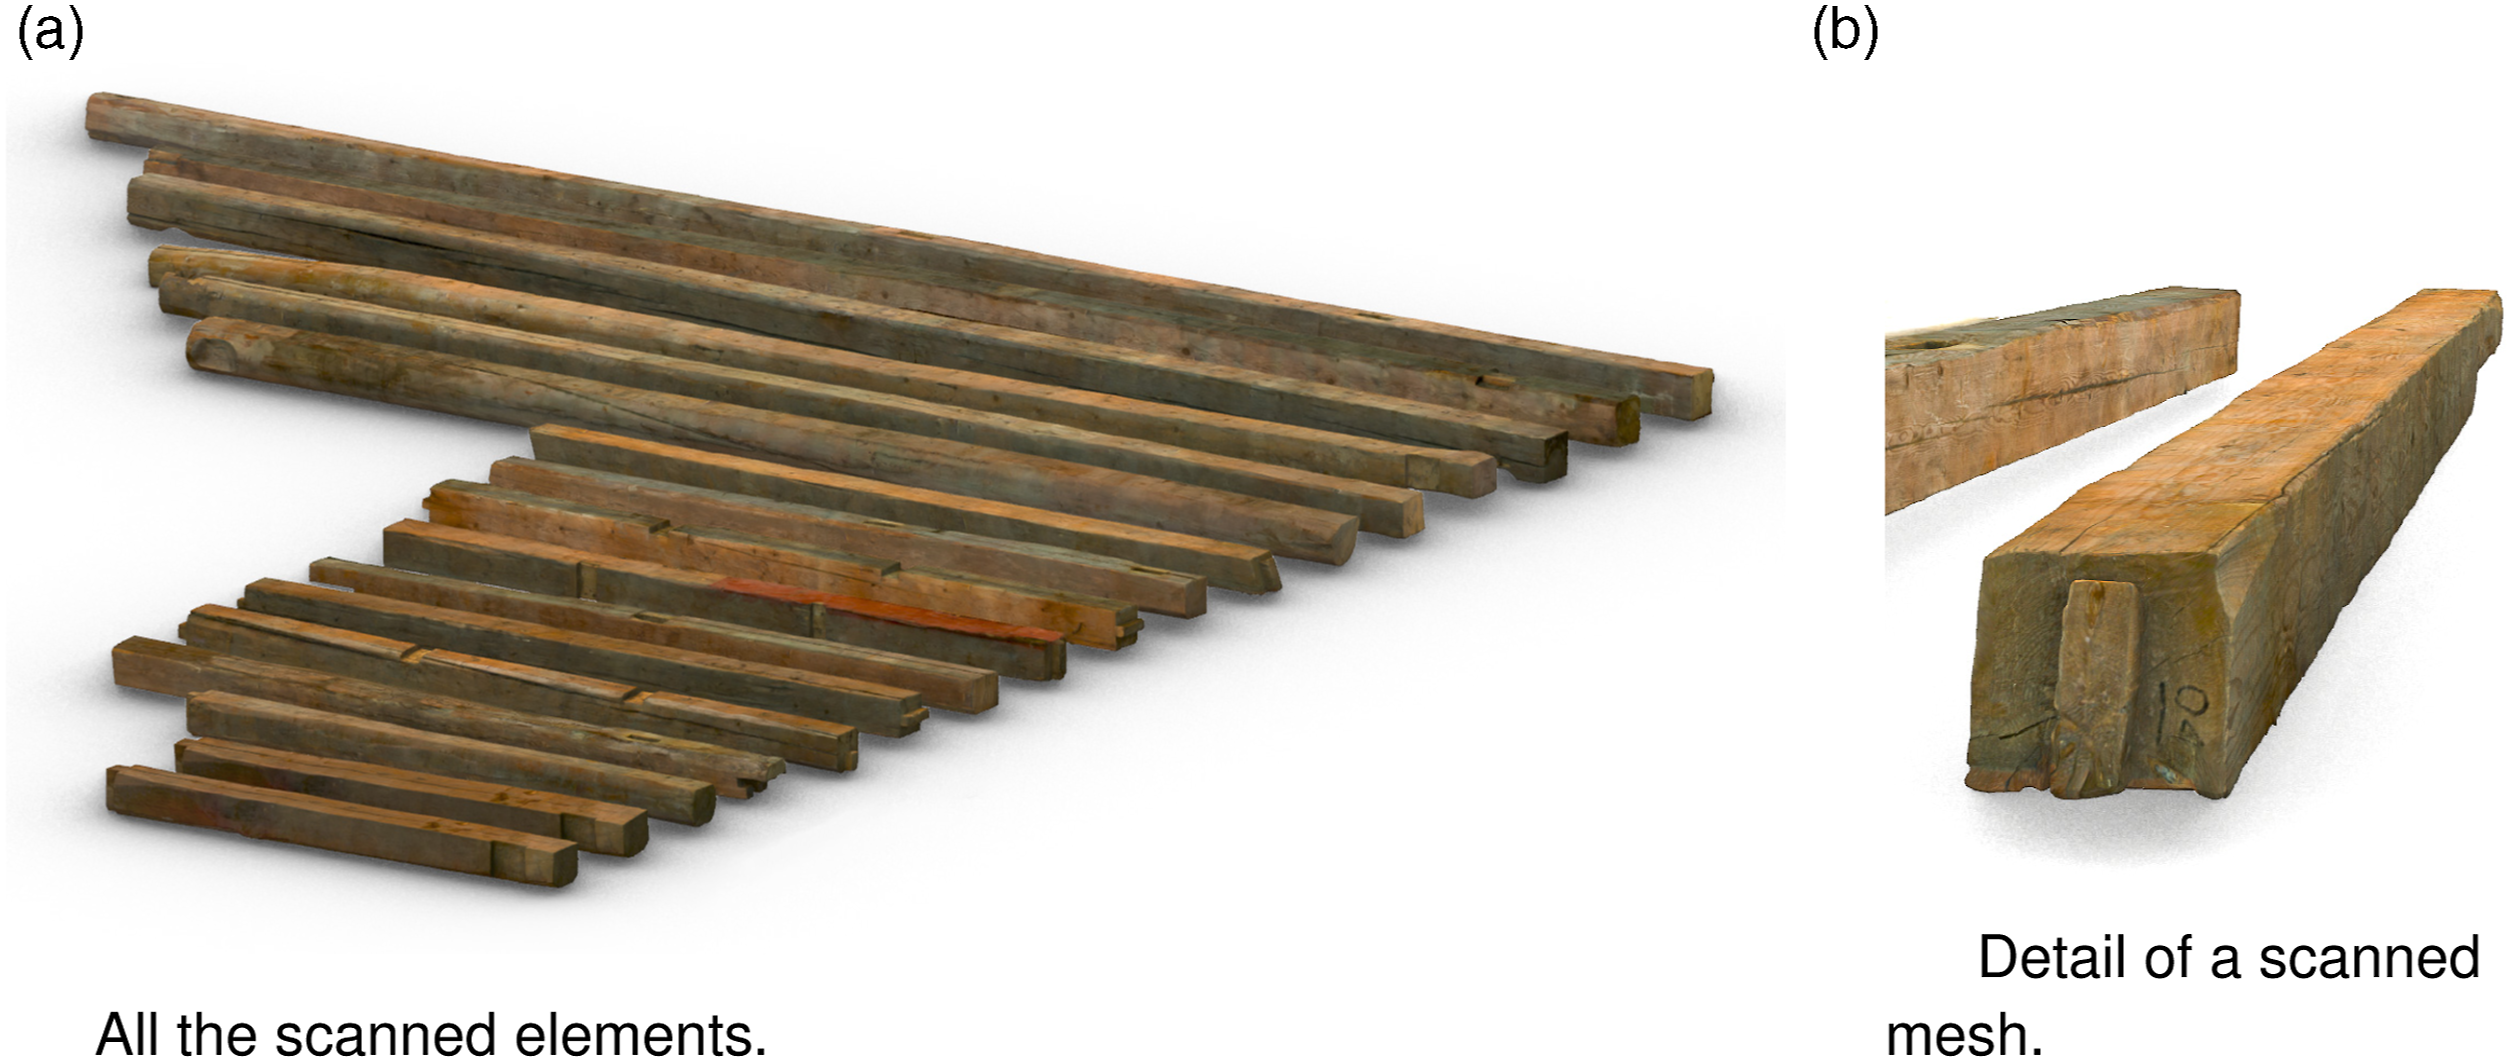
Transportation
We accounted for the additional environmental impact from transporting material between the storage elements by adding the columns Latitude and Longitude to the supply element set after extracting the cross-section details and element lengths from the meshes. The location of supply elements was OmTre’s storage in Hønefoss (60.185906, 10.241544), the desired site was Sletteløkka in Oslo (59.945865, 10.843823), and as the location of all new products, we assumed a local building supply store (59.930949, 10.827766). We assume that both new and reclaimed elements are transported by trucks from storage to the site, using 89.6
When running the matching algorithm, the driving distances, and corresponding environmental impact, for the two options, new or old elements, will be added to each element’s total score before the matching algorithm run.
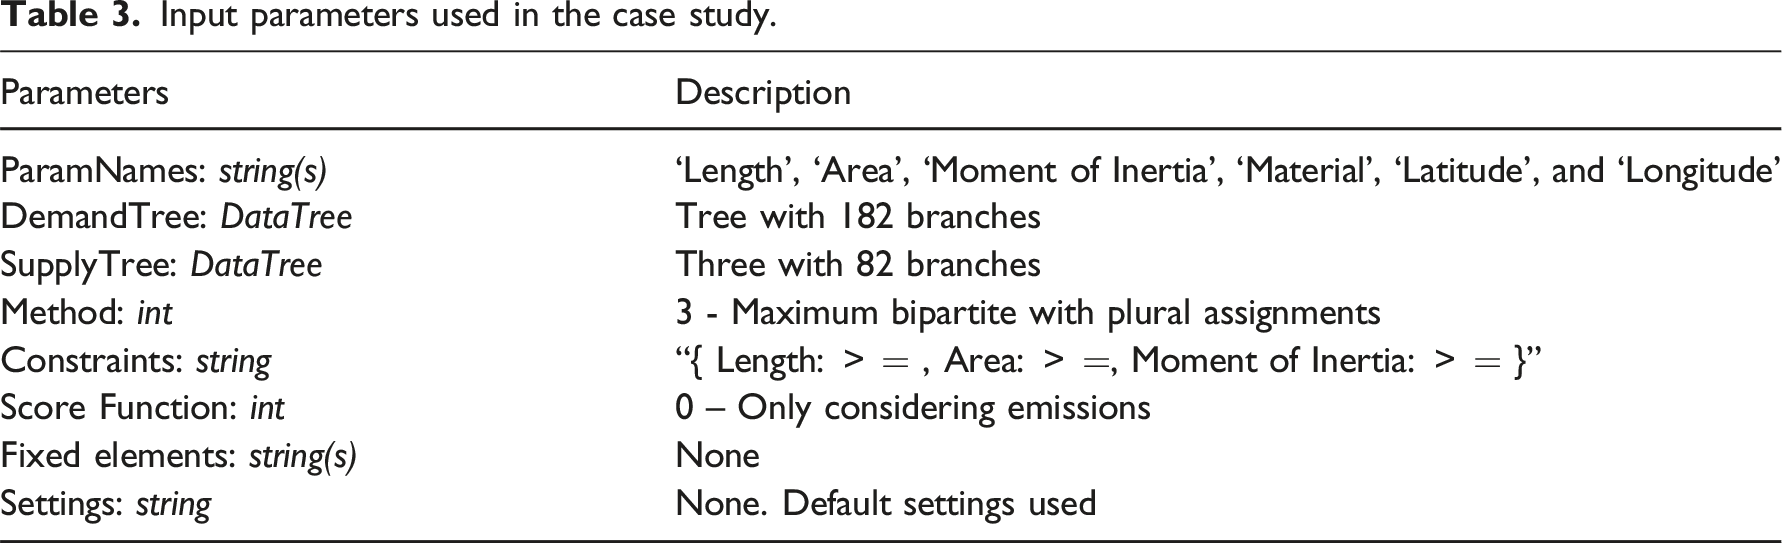
Running the matching algorithm
Input parameters used in the case study.
Matching Results
With the selected algorithm, 140 demand elements can be substituted with the 82 reclaimed elements. This results in a total score of 133.5 kg CO2 equivalents, or around a 40% reduction in GWP compared to only new materials. Of the total score, transporting the reclaimed elements, approximately 70 km contributes 46.07 kg CO2 equivalents, or a third of the total score. Allowing for plural assignment of the reclaimed elements, some elements could substitute five demand elements by cutting them.
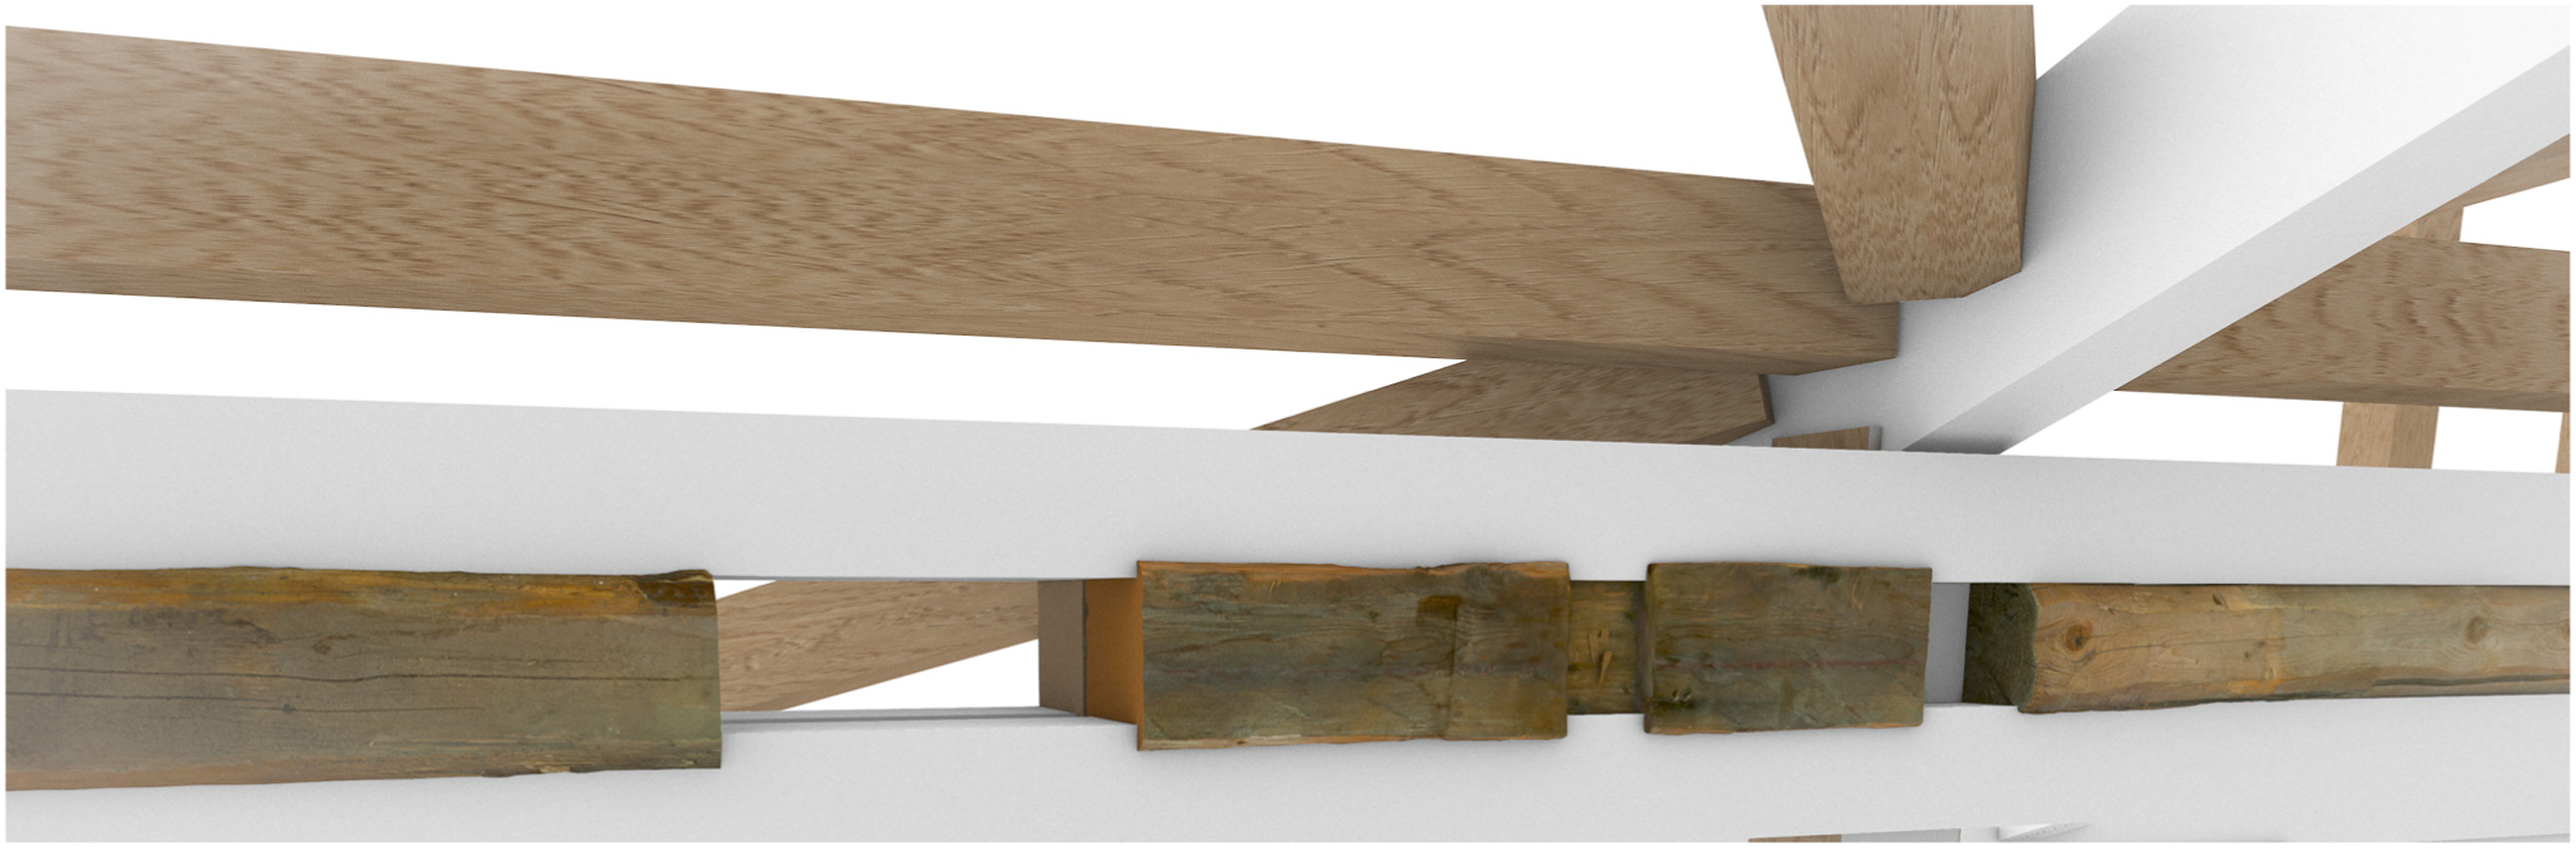
Finally, using the identifiers of the elements, we could split the meshes representing supply elements in Rhino according to the length of demand elements they can substitute. The split meshes are then reoriented to the demand structure to render the results in the architectural model. Figure 8 shows a view from the inside of the architectural model with scanned supply elements positioned according to the results of the matching algorithm. With this visualisation, the architect and other stakeholders can evaluate the effect of reclaimed elements on the design intent. If some elements are considered unwanted in certain positions, they can be restricted before re-running the algorithm. An example from this case study: one of the reclaimed elements was painted red. To avoid the red paint being visible in the final solution, it was assigned to one of the shear blocks in the composite beams out of sight for the user before recalculation, as illustrated in Figure 9. Columns and diagonals in the architectural model replaced by supply elements. The corner column and floor beams at the top are unscanned supply elements with generic textures, while the middle column and diagonals are scans of old barn elements. Detail of composite under roof with scanned supply elements assigned as shear blocks. The roof rafters with generic textures are unscanned supply elements, and the white elements are unmatched elements.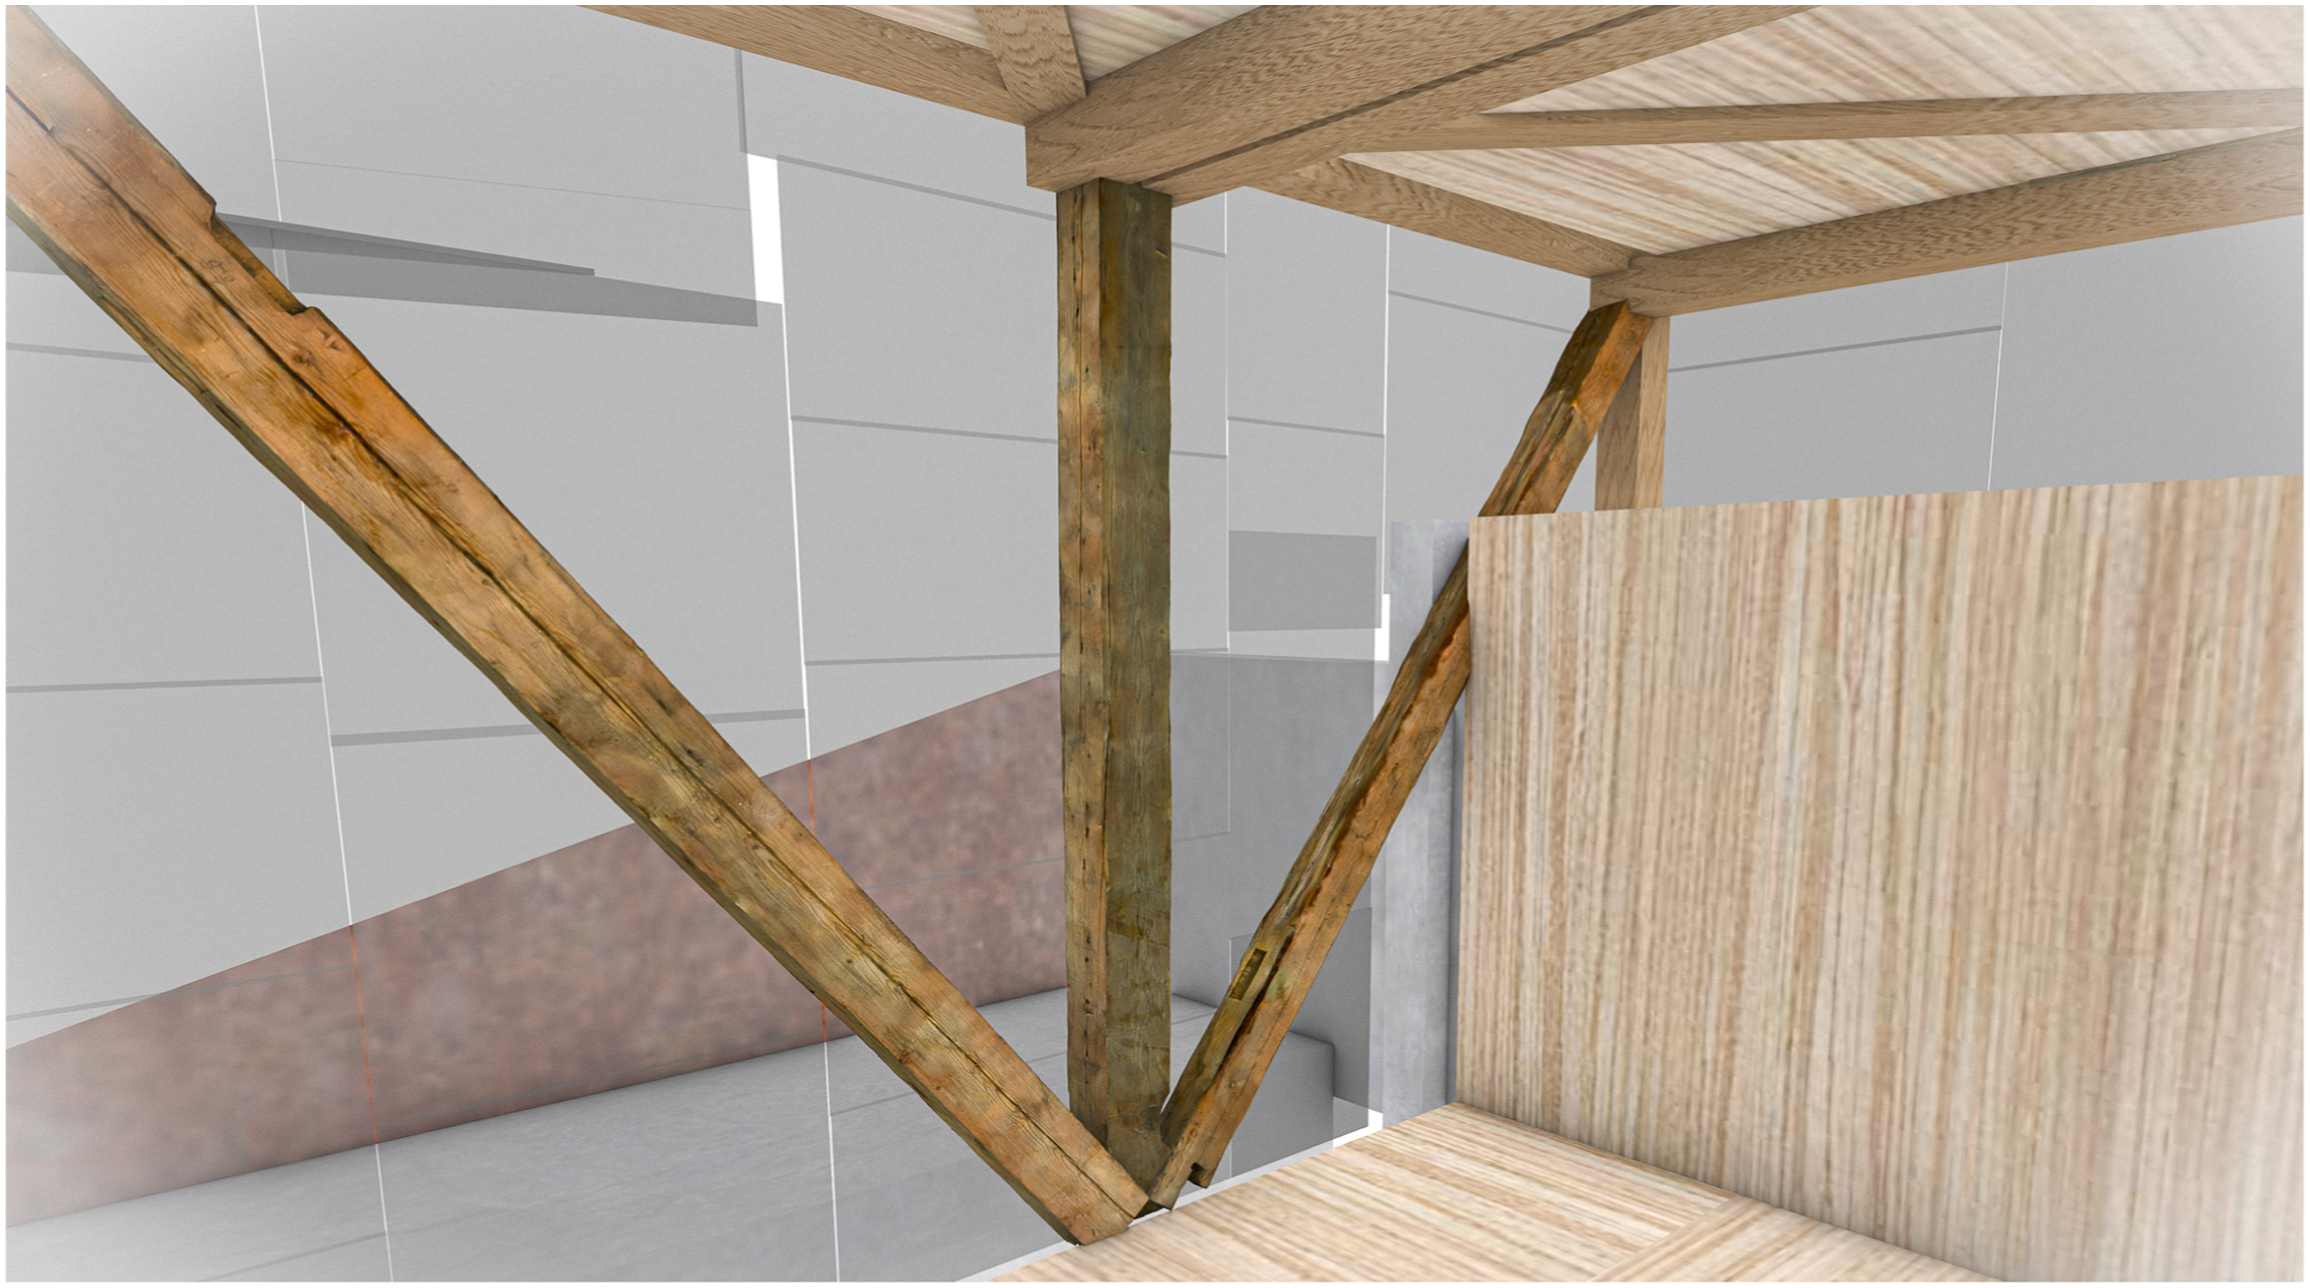
Discussion
Contribution
In this paper, our previously developed matching algorithm 21 was integrated into the interface of Rhino and Grasshopper. The integration remedies the barrier of users being familiar with text-based programming to use our algorithm for design with reclaimed elements, making it more accessible to a broader audience. The designers do not have to familiarise themselves with yet another software but can use their preferred design approach and software as before. Although Rhino was preferred, the same can be achieved in other software that uses the open-source library.
Moreover, the matching algorithm was extended with new methods, the impact of transportation, and cost functions. We introduced a matching algorithm, Maximum Bipartite Plural, giving the designer more options. This method allows supply elements to be used for multiple demand elements while significantly faster than the mixed-integer formulation, which, however, still provides a slightly better overall solution. Especially during the conceptual design phase, the faster algorithms allow for a broader design exploration through fast analysis. One example of application from this project was the varying supply stock. As the project owner is public, a tender process must be carried out, and different suppliers can deliver an offer for reclaimed material. Using our algorithm, we can run the matching problem for the supply elements from each contractor to find the stock which best fits the designed building, thereby increasing the knowledge basis even before selecting and paying for the material.
To include the impact of transportation, the user now adds the location of the different materials in the supply bank. As the results of the case study show, transportation plays a role when finding the best solutions, especially for timber, which is lightweight and has a low initial GWP even for new virgin material compared. About one-third of the total GWP for the best solution came from transporting the material over a 70 km distance. Consequently, new and locally sourced elements might be less pollutive in cases with large distances and materials such as timber with relatively low GWP, even as a new product, compared to the emissions from transportation. Although all reclaimed elements were located in the same facility for our study case, each element could, in theory, have a unique location. The factor used for adding costs and emissions from transport currently supports single global values, meaning that the matching algorithm does not account for some elements being transported by train and others by trucks. This is an intended update to allow more complexity.
In this study, we did not assume any economic advantage of reusing old elements due to the additional processing costs compared to virgin material. Hopefully, the market for reclaimed material will mature and make it easier to source reclaimed materials from different providers at a predictable price. Then, our algorithm accounts for this by integrating cost and emissions into the score function by setting a price on both. With prices of emissions expected to increase at some rate in the coming years, the designers can use our tool to run the matching problem with different scenarios to see how much the cost of emissions needs to be weighted for material reuse to become economically feasible.
We also scanned 17 of the supply elements using a hand-held scanner. These added significant value after the matching was run. By splitting and relocating the mesh, we could discuss the design impact of using old elements through visualisations in the architect’s original model. Reiterations can be done based on their subjective preferences, and the results become more descriptive compared to simply the matched element IDs’ and graphs with emissions and cost.
Challenges and limitations
The main challenge during this project was the accurate documentation of the supply elements. From this experience, the classification of connection types, timber damages or quality assessment should be better defined from the beginning to avoid uncertainties later in the project. Especially the scanning and post-processing of elements required a lot of time and resources. This led us to abort the process of scanning all the elements in this project to keep on schedule. Access to more advanced and automated equipment is necessary to scan all elements within a reasonable time. Something a more mature market for reused elements can help remedy. One opportunity is for the supplier to provide files with scanned elements from their supply to help the designers integrate their products into new projects.
To add the location of the new material, the user manually adds the coordinates of the coordinates and writes it to a CSV file. We intend to automate this further by using an online list of suppliers extracted automatically when the user sets up the project’s location.
The stability and capacity of the structural system are implicit considerations during the matching procedure. A structural engineer was present during the initial design development to ensure that cross-sections were sized according to design forces and applicable codes. Constraints are also placed on the matching process to ensure that the cross-section area of reclaimed elements is greater than or equal to the initial proposal. No explicit structural analysis is carried out on the system to keep the matching algorithm flexible and versatile. In this case study, some reclaimed elements had shape deformations expected to reduce the buckling capacity and stability, even though the cross-section had sufficient capacity. Formulating such considerations as a design constraint is the next step towards an even more accurate matching procedure. Future research with a group of users could look into the ease of use, time savings and learning outcomes of such enhanced matching compared to a typical design.
Conclusion
This paper showcases the successful integration of a matching algorithm for sustainable design into design software. 21 The framework was further developed to include transportation’s impact, new score functions for material costs, and new matching methods. Through a case study, the paper highlights how computational tools aided in designing a community house made from reclaimed materials. To achieve this, we created a wrapper for the package in Rhino and Grasshopper, making it easier to integrate into the project software. We identified suitable substitutions for 140 out of 182 demand elements, which reduced the building’s GWP by approximately 40%. Additionally, the matching process was integrated into Rhino, creating a parametric workflow that enabled recalculations whenever there were changes in the architectural model or available material. The workflow was further enhanced by incorporating scanned mesh representations of the reclaimed elements into the digital model, providing metrics and a visual impression of each element down to the level of knots and cracks. Overall, the digital tool significantly helped design the project using old elements, and we hope it inspires more initiatives to incorporate reclaimed components into new designs.
To sum up, the computational methodology presented in this paper allows architects and engineers to consider the possibilities and effects of designing with reclaimed elements using their preferred design tool while benefiting from automation. This feature is crucial in facilitating the design of new buildings with reclaimed elements. Traditional building projects always undergo changes in design, and when designing with reclaimed elements, changes in available materials over time add another layer of complexity. Therefore, tools like the one presented in this paper are necessary to manage the transition towards a circular economy while keeping processes time- and cost-efficient in the building industry.
Footnotes
Declaration of conflicting interests
The author(s) declared no potential conflicts of interest with respect to the research, authorship, and/or publication of this article.
Funding
The author(s) received no financial support for the research, authorship, and/or publication of this article.