
Abstract
This research established a comprehensive evaluation system for urban ecological assessment. Through research in the fields of urban planning, urban design, and cognitive psychology, this paper defines three ecological evaluation indexes correspondingly. They measure the vegetation coverage of land (planning green), the visibility of vegetation from the pedestrian’s viewpoint (visual green), and the psychological perception of greenery by human (perceived green). This study uses computerized parametric analysis, computerized deep learning, data visualization, and statistical methods to achieve an accurate description of the three evaluation indicators. This study assumes that the three green values may behave consistently or inconsistently at each point. Therefore, this study, on the one hand, tries to analyze the potential factors affecting each green indicator. On the other hand, by analysing the consistency or discrepancy of the three green values, this research revealed the potential link between urban spatial type and integrated ecological properties. Four areas of Brisbane dominated by different functions were selected for this study (Red Hill and Bardon for residential areas, Brisbane City for downtown CBD, and Woolloongabba for industrial areas). The results of the study demonstrate the credibility and applicability of the three green indicators in different areas, examine the various factors affecting ecology, and provide new design strategies and ideas for urban designers.
Introduction
With the process of urbanization, urban ecology has been receiving widespread attention. The theory conveys a broader ecological concept that urban ecology not only provides aesthetic experiences for residents but also greatly influences the culture of the city. 1 It is evident that the impact of urban ecology on the psychological and cultural aspects of residents is gaining attention. Urban designers have also been striving to enhance urban ecology in order to improve the health and well-being of urban residents.2,3 However, there is no consensus on the criteria for evaluating the ecological nature of cities. The planning department ensures the greening level by controlling the greening rate to guide urban construction. And the greening rate can be effectively obtained with the help of GIS. 4 However, Ma et al. 5 argue that planning-level metrics are not sufficient to accurately measure ecology at the street scale, and instead, Google Street View maps should be used to measure the visual greenness from the pedestrian perspective. Reid Ewing and Handy 6 asked experts to evaluate the subjective perceptions of 48 commercial streets in the United States, including enclosure, human scale, imageability, and so on, in order to develop a statistical model of physical urban properties and subjective perceptions. This is to establish a theoretical basis for predicting the subjective perception of pedestrians through the physical characteristics of streets in the future.
Summary of related works.
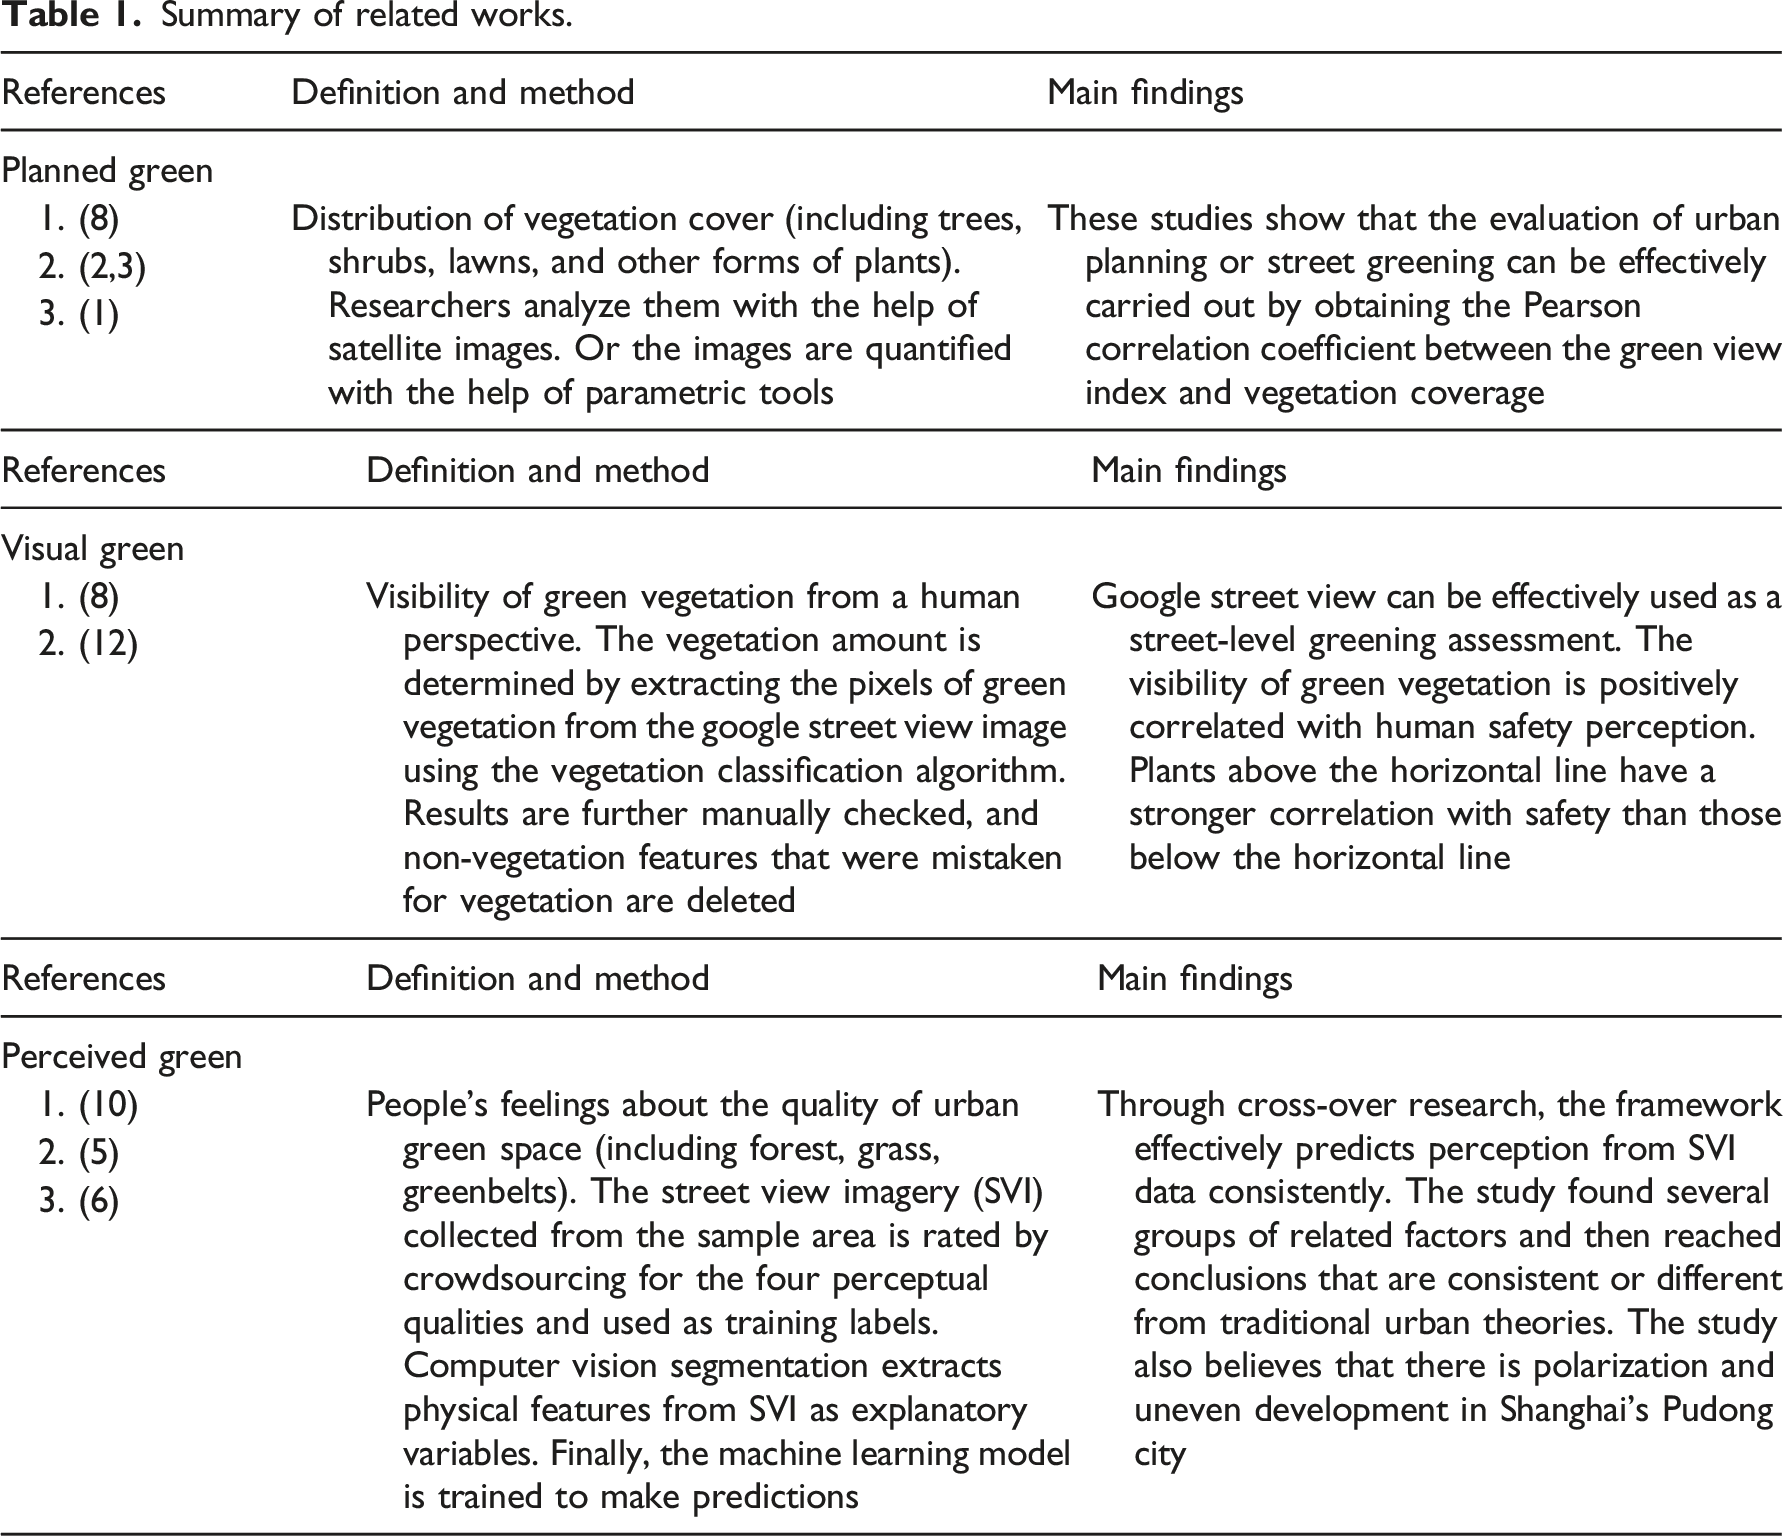
However, there are still some research gaps. In terms of research objectives, some studies have linked ecological levels with social and economic aspects. Using the green view index (GVI) to quantify the level of street greenery, Xiao et al. 7 established the correlation between the level of visual street greenery and housing prices, road network density, population density, and social vulnerability, and hoped to urge the government to work on improving urban planning and design, and social equity. Li et al. 8 attempted to link ecological levels with perceptions of safety. However, the connection between ecological level and physical space has rarely been discussed. This study hopes to introduce a discussion of spatial typology. Through the analysis and generalization of physical space, the reasons for the consistency and differences between different ecological indicators are explored, while its conclusions are expected to provide urban designers with more practical ideas and strategies to enhance ecological levels.
In terms of methodology, evaluation indicators for quantifying the level of greenery have been continuously proposed. Cimburova and Blumentrath 9 and Xiao et al. 7 used the proportion of vegetation visible from the human viewpoint as an evaluation indicator for street ecology, instead of choosing the normalized difference vegetation index (NDVI) and accessibility. Qiu et al. 10 introduced the consideration of human perception. However, the distribution and coherency of the three green indicators has not been comprehensively compared in existing studies. This study hypothesizes that there is an association between these three indicators and tries to discuss the consistency and difference of their values in the following three aspects. First, to find the association between planning green and visual green, and analyze the reasons for the inconsistency of their values; second, to find the association between perceived green and other subjective or objective indicators (such as orderliness and human scale), and analyze other factors that potentially affect the level of perceived green. Thirdly, we look for areas where the values of planned green, visual green and perceptual green are in high or low consistency, and analyze the causes of these features and the various urban space types represented by these features.
In addition, a large number of studies have continued to improve methods for quantifying greenness evaluation metrics. Xiao et al. 7 used green pixels within a specific color interval in street view images as a parameter for calculating greenness metrics, but this can result in non-plant green objects being incorrectly accounted for, thus reducing the reliability of the data. In addition to obtaining quantitative visual green values with the help of street view images, Cimburova and Blumentrath 9 provide a method for visual assessment of urban green based on the assistance of GIS tools. The researchers confirmed the feasibility of this approach and the reliability of the results, thus greatly improving the efficiency of the visual green analysis of the city. This method is to realize the simulation from 2.5D to 3D by function operation, so there will be errors compared with the direct analysis of street view images, but the advantage is that the sample points can be selected more flexibly, instead of being limited to the fixed view provided by the street view vehicle. Qiu et al. 10 used semantic segmentation of street photos with the help of AI deep learning to identify plants and other objects more accurately. The results of Yin and Wang 11 have shown that the information obtained by the algorithm has been reliable enough, especially in the sky with a computational accuracy of 90%. In this study, this method will also be used to obtain the values of visual and perceived green.
In terms of the selection of study areas, most researchers have not made a finer distinction between different types of areas in the city. Xiao et al. 7 and Qiu et al. 10 both chose Shanghai as the study area. The study focuses more on discussing the common characteristics of dozens of regions within Shanghai and weakens the effect of differences between regions on the results. While this study hopes to discuss the connection between different types of districts and ecological levels. Four different areas in Brisbane were selected for this study. These include Red Hill and Bardon, which are dominated by housing and share a similar spatial structure but also differ in some aspects, Brisbane City, which is located in the city center, and Woolloongabba, which is dominated by industry. By categorizing and discussing the different functional types of areas, this study addressed the above issues in a more comprehensive and systematic manner.
Urban ecology is an important topic for sustainable development. By defining and comparing the three indicators, this study hopes to provide urban designers with a new evaluation system and spatial research strategy, and to help establish an ecology-friendly pedestrian space.
Methodology
This study will start with obtaining the values of three ecological indicators. Subsequently, comparisons will be made between the relationship between planned green and visual green, relationship between related factors and perception of green, and quantification of consistency and difference between planning green, visual green, and perceived green.
Methods of obtaining planned green, visual green, and perceptual green value
Figure 1 depicts the method of obtaining each green indicator. Planned green and visual green are objective data obtained from satellite and street view maps, respectively, while perceived green is a prediction of people’s subjective perceptions. The coherence area refers to the area where different ecological evaluation indicators show high consistency at the same position, and the divergence area refers to the area where different ecological indicators show low consistency at the same position. Flow chart for obtaining three evaluation indicators.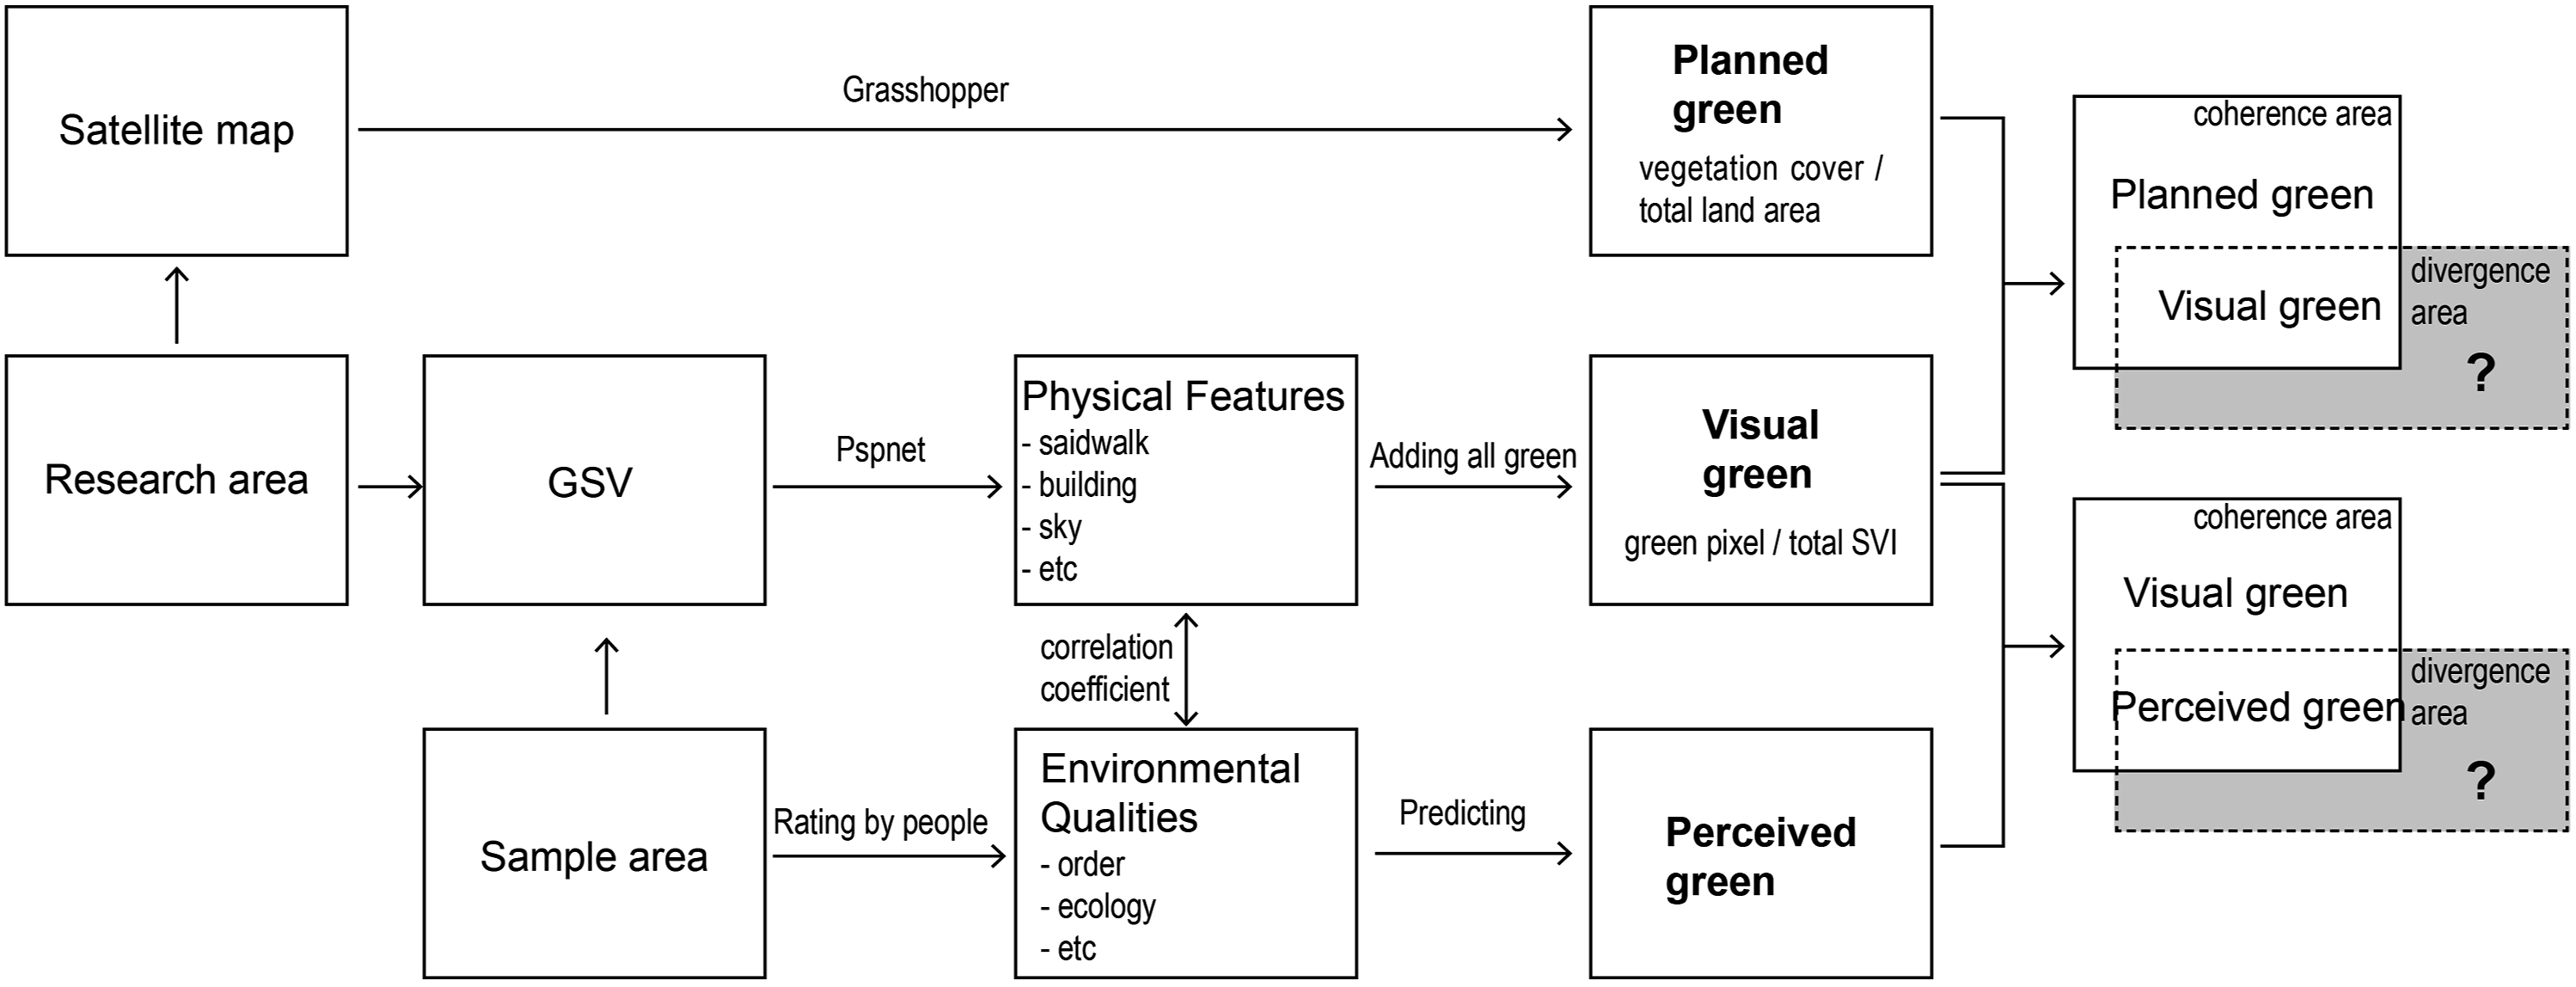
For planning green, the study defined the proportion of greenery within a 40 m radius of each coordinate point as its planning green value. Most blocks in Brisbane have a depth of 30–50 m. A 40 m radius circle covers the adjoining block and the potentially obscured greenery behind the building without covering another parallel street. To do this, firstly, process the satellite image in PS, painting all the greenery black and the rest white. Secondly, a 1 m by 1 m grid of points was generated using grasshopper to cover the study area and the image simpler command was used to assign a value of one to the points in the green area and 0 vice versa. Thirdly, the values of the points covered by the circle corresponding to each coordinate were added up and divided by the number of points in the circle to obtain the planning green value for each coordinate. Planned greenery is measured Objectively from an “overlook” perspective. The formula can be represented as the vertical projection area of the greenery/land area.
For visual green, this research utilizes the Pyramid Scene Resolution Network (PsPnet) algorithm to recognize objects in the street view images, such as roads, persons, and fences, and calculate the proportion or number of each element in the image. The percentage of pixels occupied by all plants in total (including trees, plants, grass, and shrubs) is used as the value of visual green. Visual green is an objective measure of greenery from the perspective of the human eye. The formula can be expressed as green pixels/total pixels.
Perceived green refers to the subjective evaluation of people’s ecological experience. In this study, 500 street photos of Berlin city streets were collected as training data. The researchers randomly divided the photos into pairs and placed them on an online questionnaire platform to obtain ratings. Invitees were asked to evaluate the photos based on seven spatial environmental qualities and to select the one they thought scored higher. (e.g., picking the one with the better ecology.) Then, with the help of the Microsoft TrueSkill algorithm, all photos were ranked according to their subjective scores. The resulting subjective scores were then correlated with the physical data of 38 streets obtained from PsPnet. (e.g., the correlation model shows that ecologically good pictures tend to correspond to more trees, lawns, shrubs, etc.) After that, with the help of computer deep learning, this study successfully predicted the spatial environmental quality of about 16,000 Google Street View maps in 22 areas of Brisbane, and selected four representative areas to focus on. The computing process of perceived green is described as a black box, but it simulates people’s real subjective perception of the image.
Data analysis method
The relationship between planned green and visual green
Most of the time, the planned green is consistent with the visual green. However, there are cases where the planned green level is significantly higher than the visual green. This is due to the fact that a large amount of green that is visible on the satellite map is not perceived by pedestrians due to occlusion in space. Figure 2 describes a method of analysis. First, the points with poor visual green are found, and then the ones with better planned green are filtered among them. If there is a significant difference between the two, it is considered that the green is obscured by improper spatial organization. Finally, the problem is then specifically analyzed with the help of Google Street View maps and summarized into different spatial types. Analysis method of planned green and perceptual green.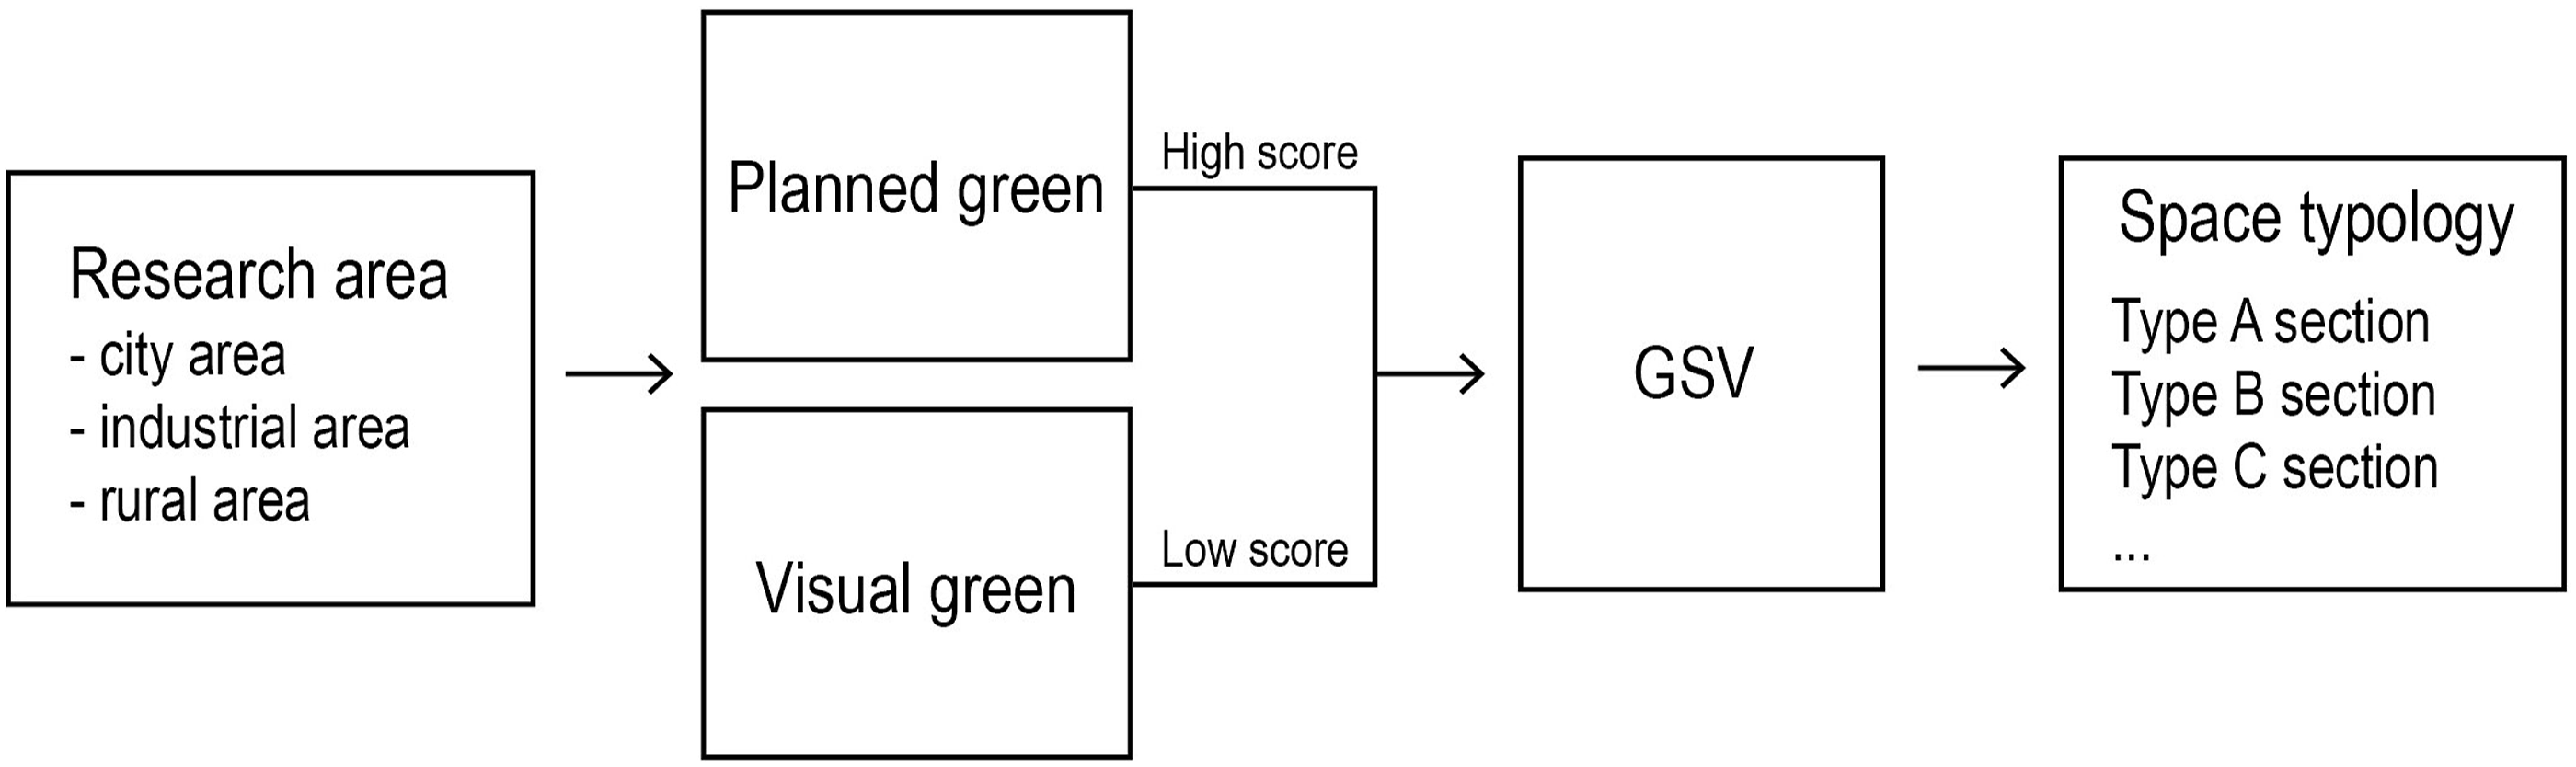
Relationship between visual green and other related factors and perception of green
Figure 3 depicts the analytical approach for this part of the study. The study hypothesized that there are other factors besides visual green that are related to the level of perceptual green. Therefore, it is necessary to find potential influencing factors by comparing the magnitude of the correlation coefficient between perceived green and each other factor. Ewing and Handy
6
mentioned 51 urban perceptual qualities and selected eight for detailed study according to their importance, including imageability, enclosure, human scale, transparency, complexity. Qiu et al.
10
selected four perceptual qualities and analyzed them with the help of a computer algorithm, including enclosure, human scale, complexity, and imageability. In this study, seven perceptual qualities were considered together, including order, access, aesthetic, enclosure, scale and richness, in addition to ecology. In addition, the study hypothesized that the correlations between perceived green and influencing factors differed in regions with different functions. Therefore, a classification discussion based on function and an analysis based on spatial type are also needed. Analysis of various factors and perceived green.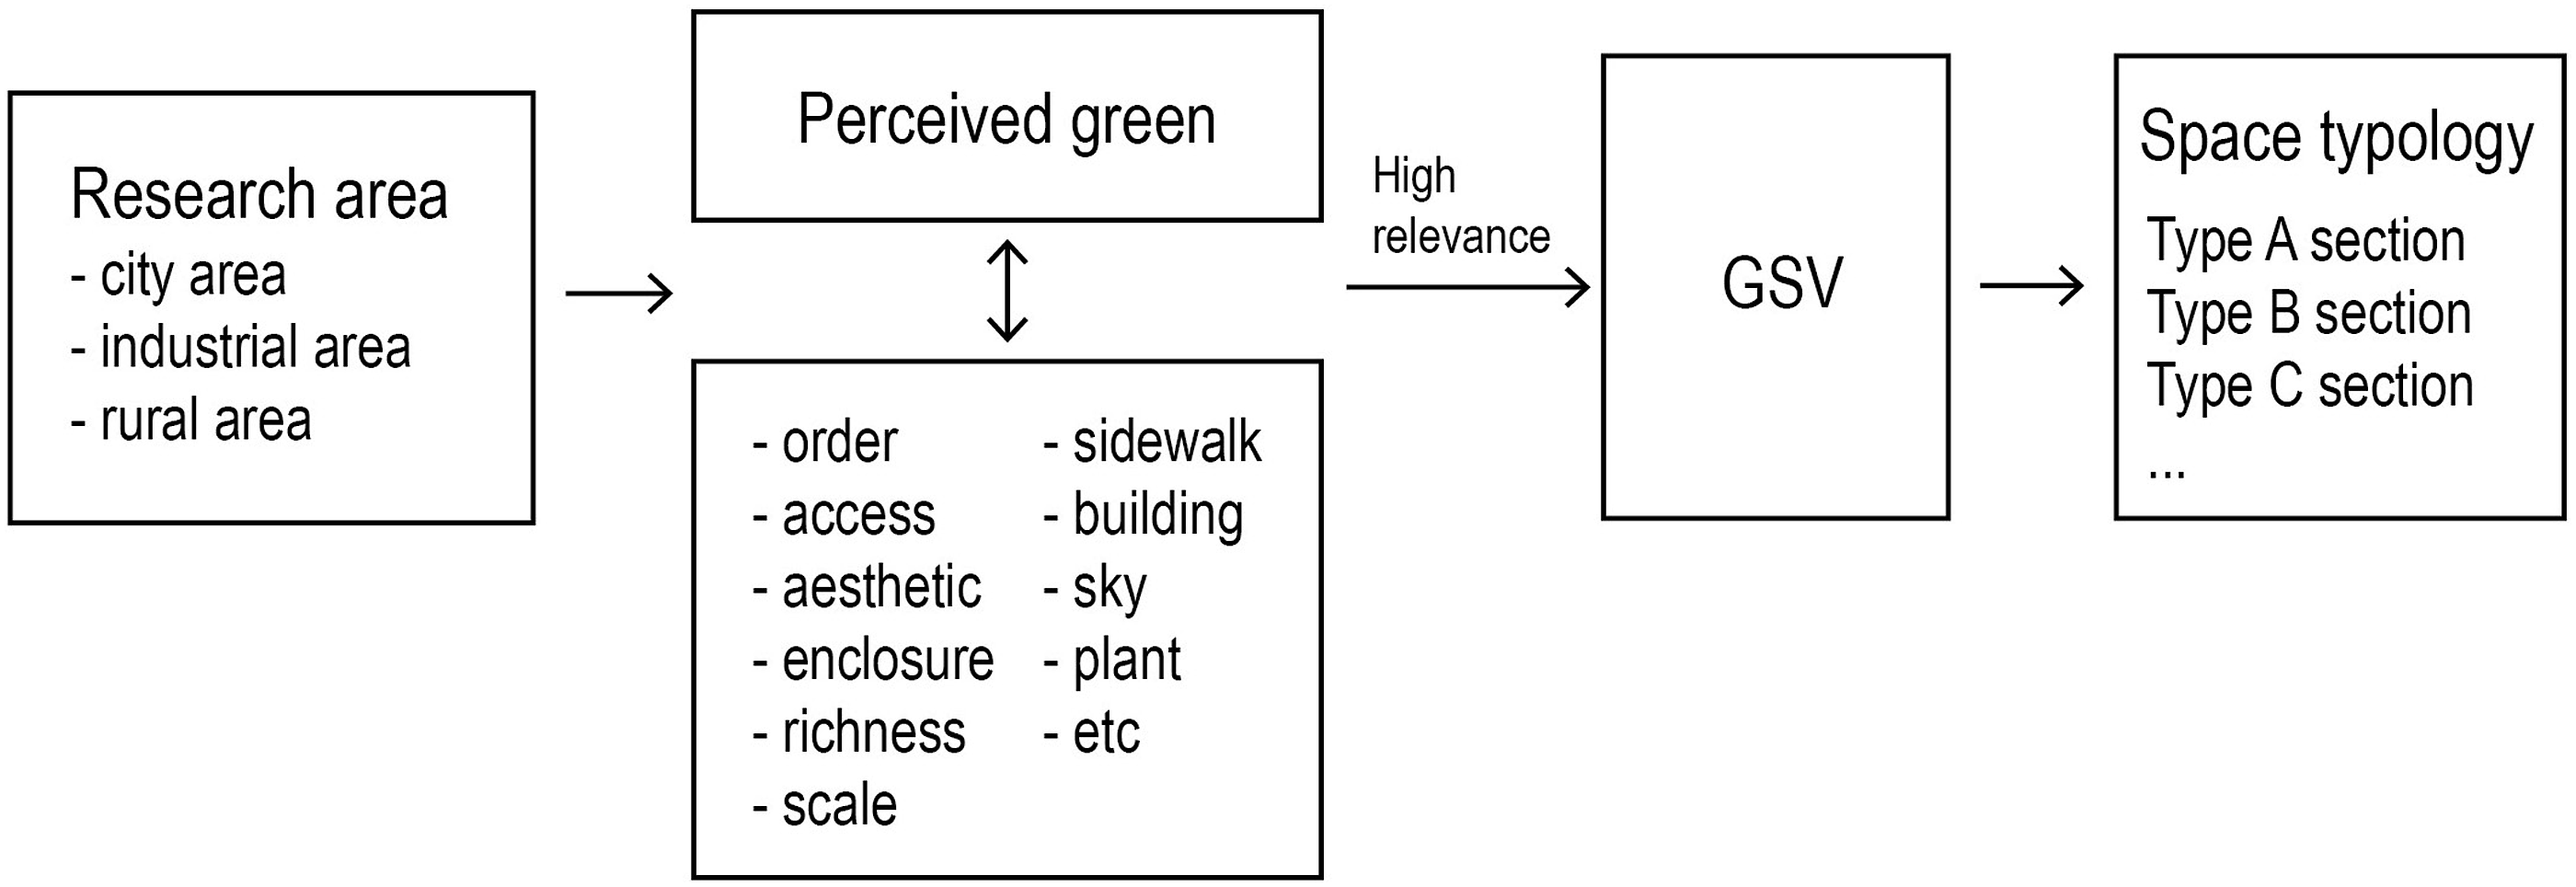
Quantification of consistency and difference between planning green, visual green, and perceived green
In this study, the difference between the three green values at the location indexed i is calculated by using the following formula, where Pl is the planning green value, Pe is the perceived green value and the Vi is the visual green value at the location i and the results are normalized to draw the distribution chart. In addition, the data is visualized with the help of MAPBOX website
Result
It is important to note that due to the way Google Street View maps are collected, most of the street view maps reflect the vehicle perspective. To ensure that the results of the study are more in line with the pedestrian perspective, this requires the researcher to manually filter the data. With the help of 3D software, the researcher will reflect the spatial relationship of the road as accurately as possible.
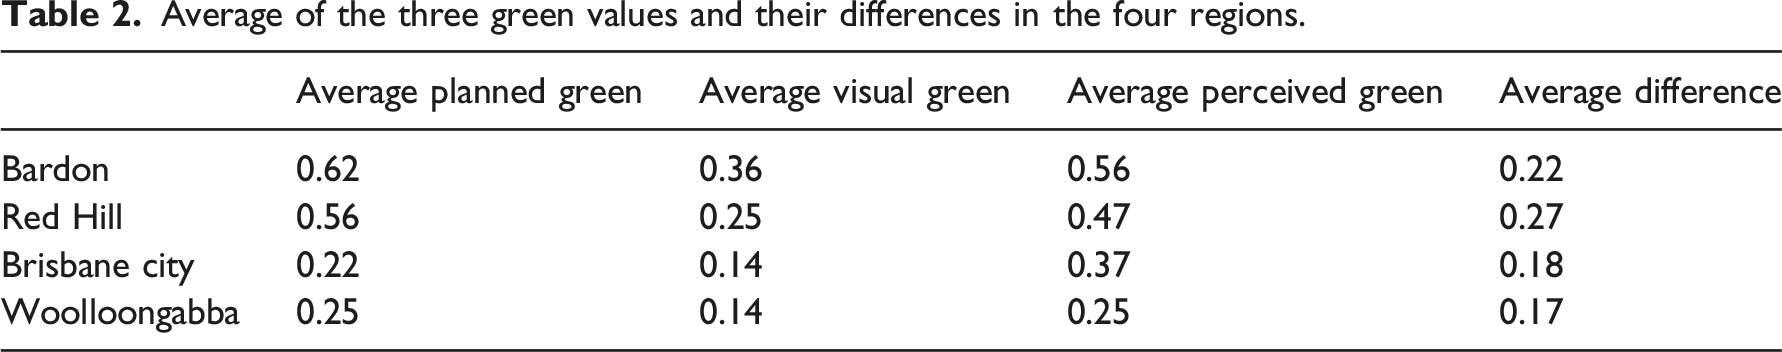
Four areas of Brisbane were selected for analysis in this study as shown in Figure 4, including Bardon, Red Hill, Brisbane City, and Woolloongabba. Bardon and Red Hill are two suburban residential areas with dense vegetation and low building density. The City is located in the center of Brisbane, facing the river on three sides, and has a grid of urban morphology and high building density. Finally, Woolloongabba is located on the south-eastern side of Brisbane City and is an industrial area. It is generally low in building density, with wide roads and large infrastructure, but lacks greenery. Table 2 depicts the average values of each evaluation indicator in the four regions. Location of the four districts in Brisbane. Average of the three green values and their differences in the four regions.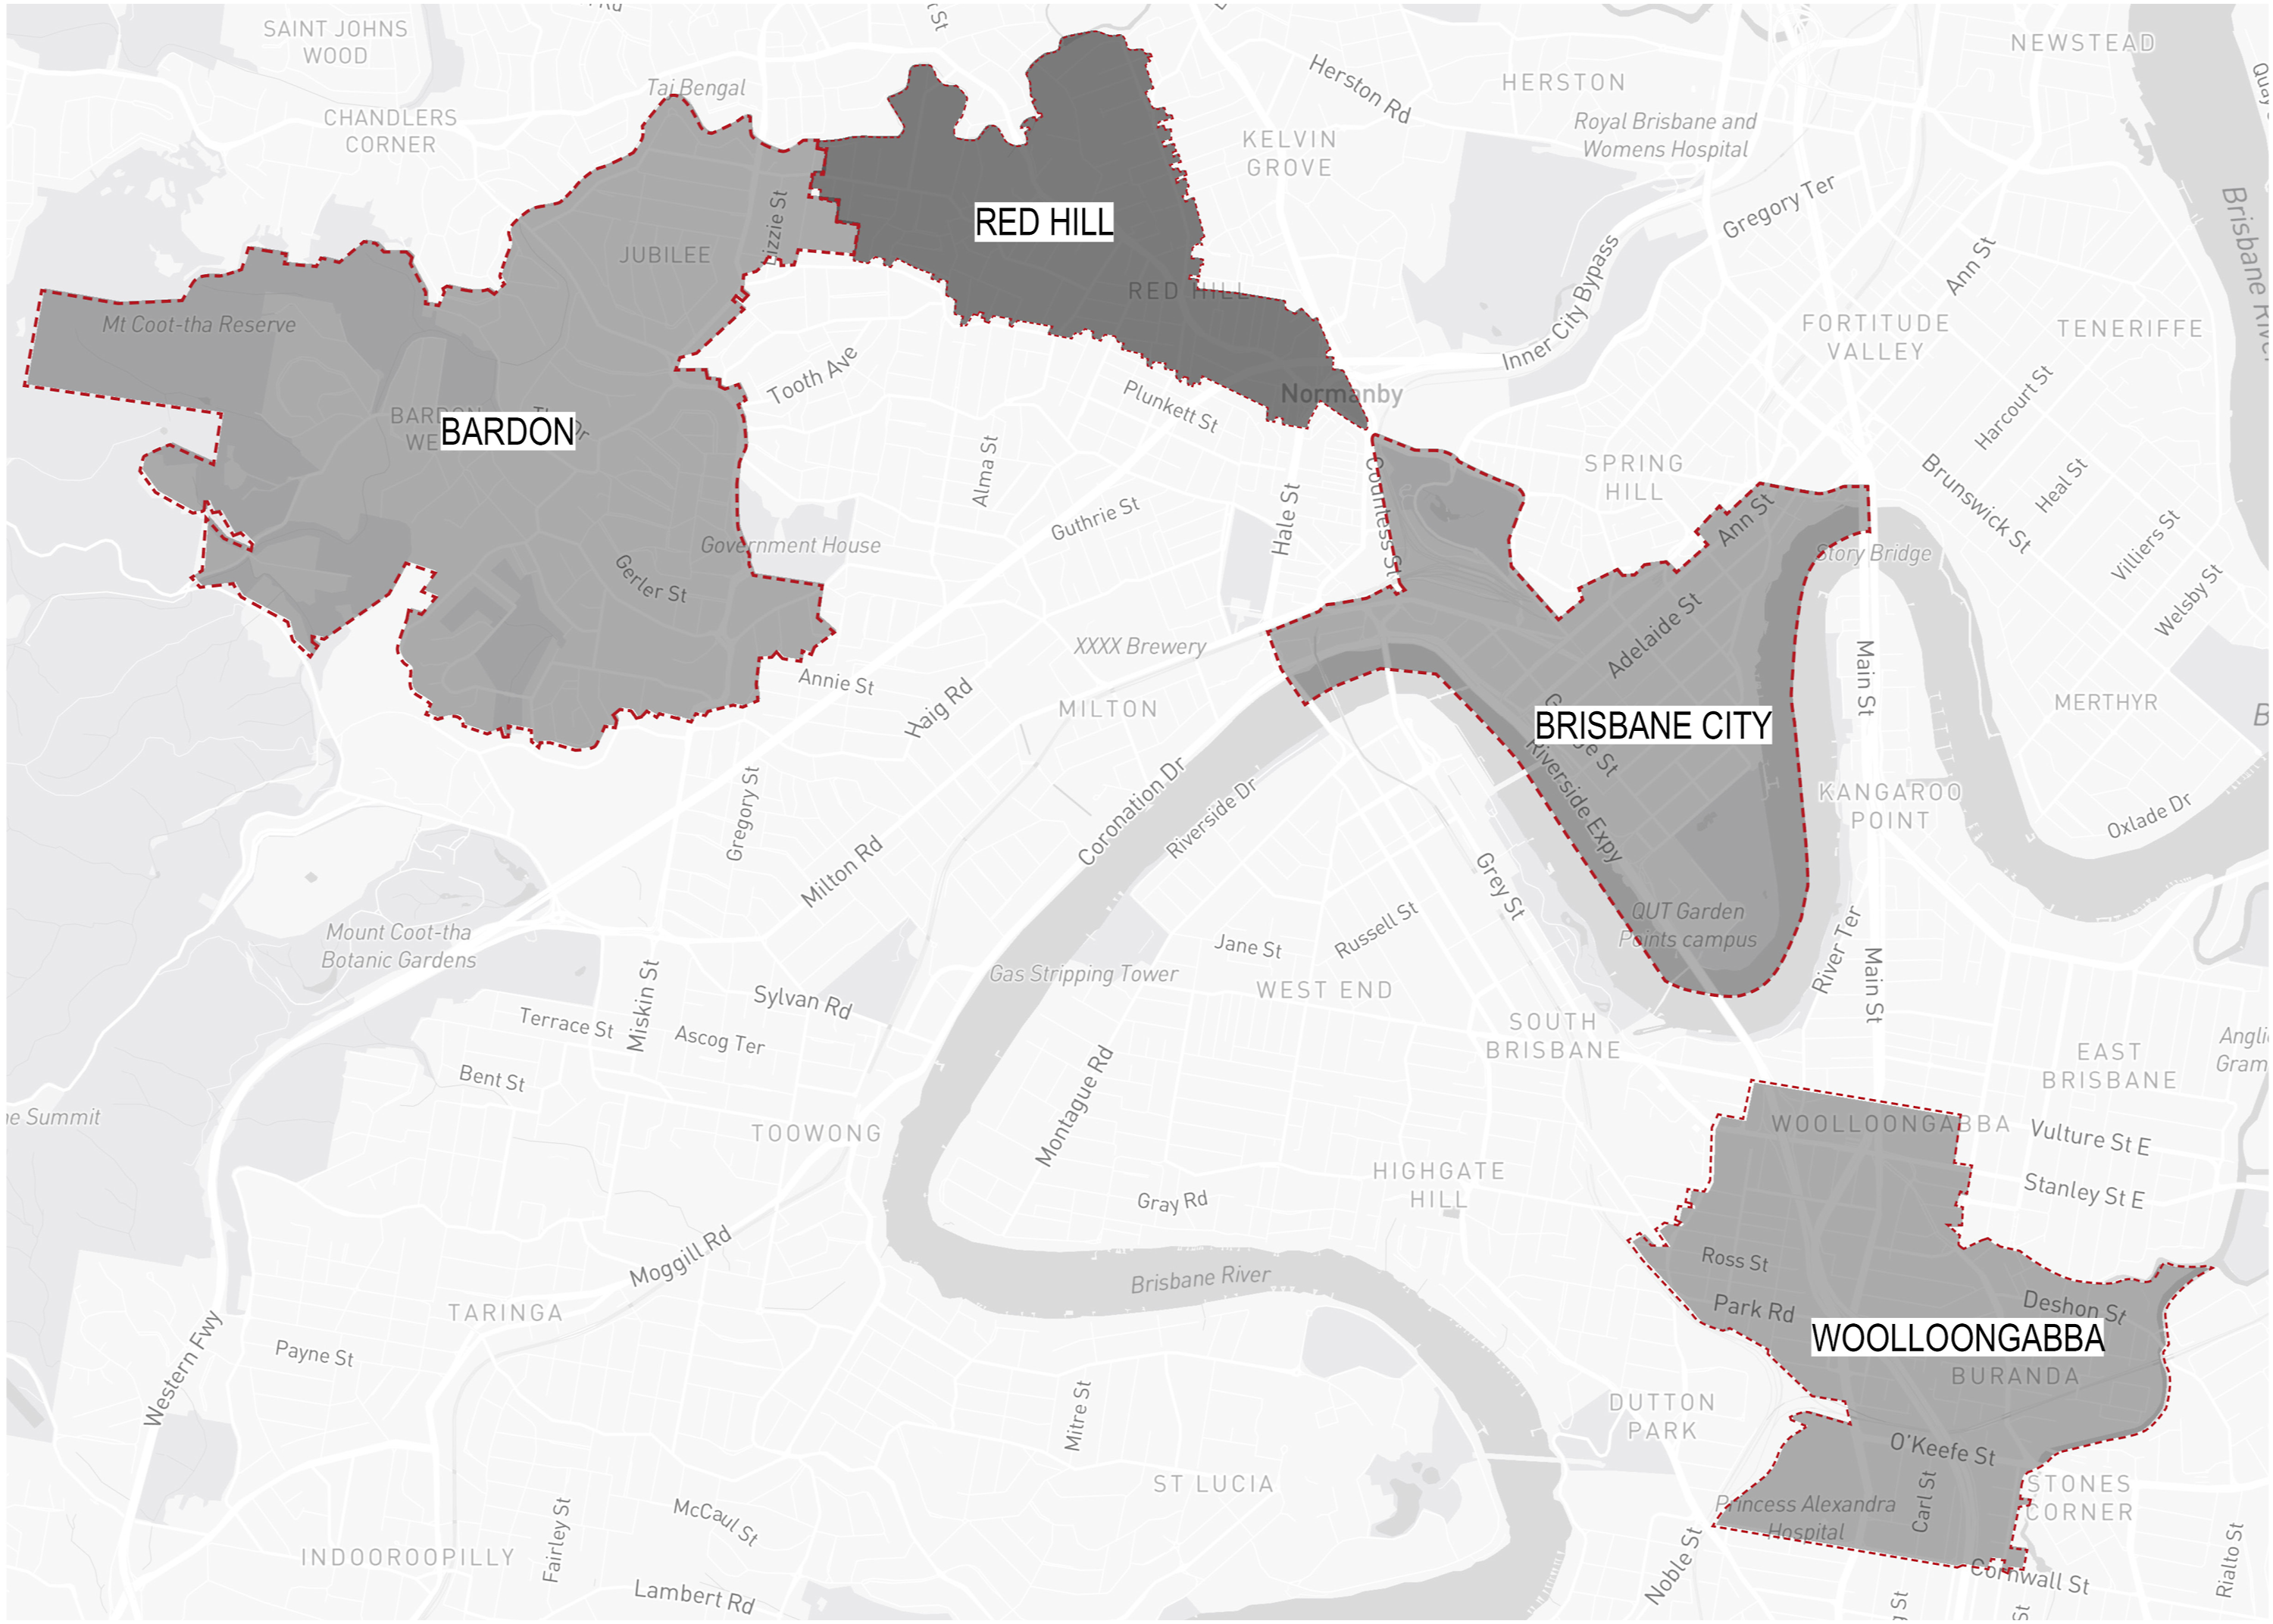
Comparing planned green and visual green
As shown in Figure 5, the distribution of planned green and visual green showed high consistency in all four areas, but some differences could still be found. By comparing the places where visual green is poor but planning green is good, the researcher found some cases where the green is not visible due to physical shading, and summarized four common types of spaces. Four types of spaces where planned green and visual green do not match.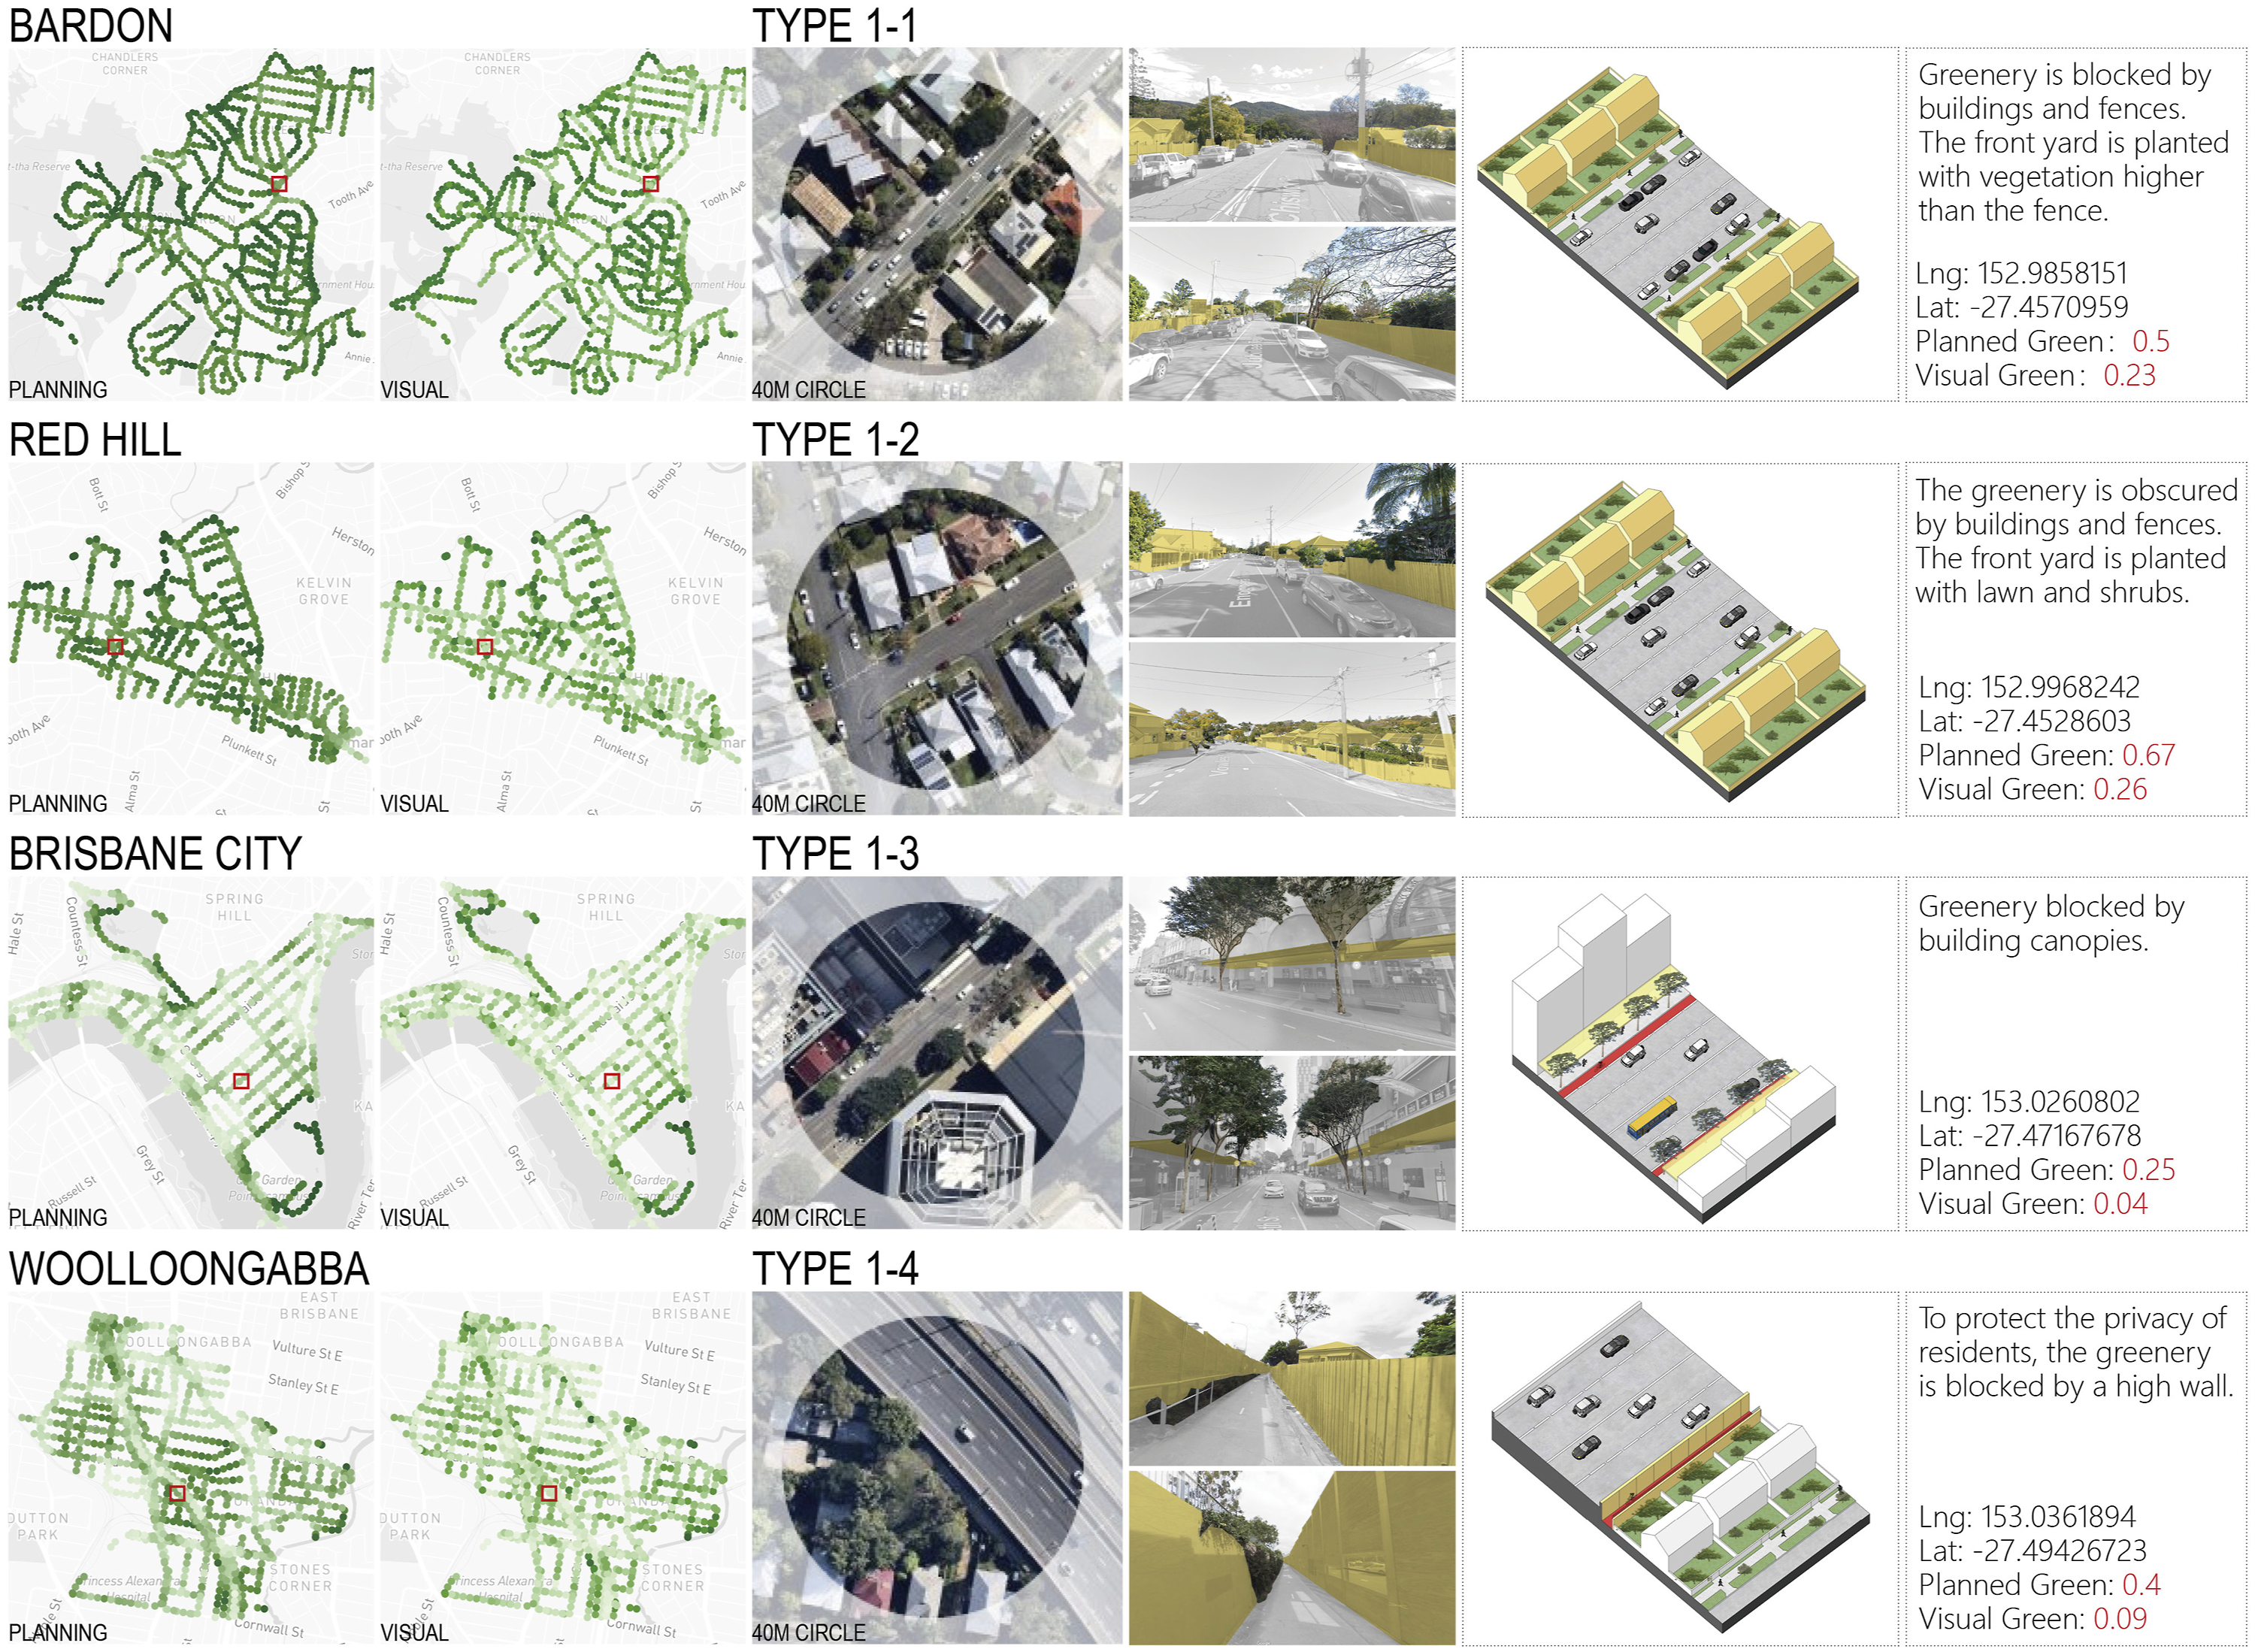
Red Hill and Bardon are predominantly residential areas located on the northwest side of downtown. As seen in type1–1, some of the greenery visible in the satellite map is either concentrated in private backyards or located in front yards that are hidden by walls and fences, making them invisible to pedestrians on the street. In contrast, Bardon’s residents tend to plant vegetation higher than the fence in their front yards, which somewhat alleviates this contradiction. As shown in type 1–2, Red Hill residents have more compact front yards, which in turn can only be planted with lawns or shrubs, making the shading problem more obvious.
Brisbane City, the busiest commercial district, has a very high building density. To accommodate the subtropical climate, buildings have overhanging sunshades on the ground floor. As shown in type1–3, street trees need to be trimmed thin and tall due to the limited width of the sidewalk. And once the canopy of street trees is too high, it will be obscured by the sunshade, resulting in pedestrians only seeing the trunk of the tree. If the width of the shade can be shortened and combined with the tree canopy for shading, it will enhance the ecological experience of pedestrians. Because people can see more greenery.
Woolloongabba is located on the south-eastern side of the city center and is a predominantly industrial area. It has a large number of low density factories, shops and is crossed by several wide roads. The study found that there is a large concentration of greenery along one of the main roads that run through the area, but because these roads overhang the city, only the tree canopy is visible. Another example is shown in type 1–3, where a fence had to be erected to block off a private backyard along one side of the road. These result in a large amount of greenery that is visible on the satellite map being obscured from the human view. The study concluded that placing greenery at the same height as the road, or increasing the buffer zone between public and private areas, could reduce the obscuration of greenery.
Compare perceived green and its related factors
This section focuses on the factors associated with perceived green within the four regions of Brisbane. Figure 6 shows the top six factors associated with perceived greenness. The data show that the proportion of trees is highly positively correlated with perceived green. This indicates that visual green effectively describes the ecological level of the city. However, in addition, factors such as sky, enclosure, and buildings also show high correlations. To further explore the significance of these data, two factors, order and human scale, were selected for analysis in this study to reveal how they are linked to perceived green in physical space. Street order refers to the degree of regularity of a street. It usually depends on whether the street buildings, public facilities, or landscaping are organized or arranged in a particular order, pattern, or arrangement. Humanscale refers to the relationship between the size of the environment and the user. This dimensional relationship brings different psychological feelings to people. Usually, a human scale environment is comfortable for people. The prediction of these two sets of subjective perception values is based on the correlation model between 60 physical characteristics of streets and subjective perceptions established by the questionnaire survey. Factors related to perceived green in the four areas.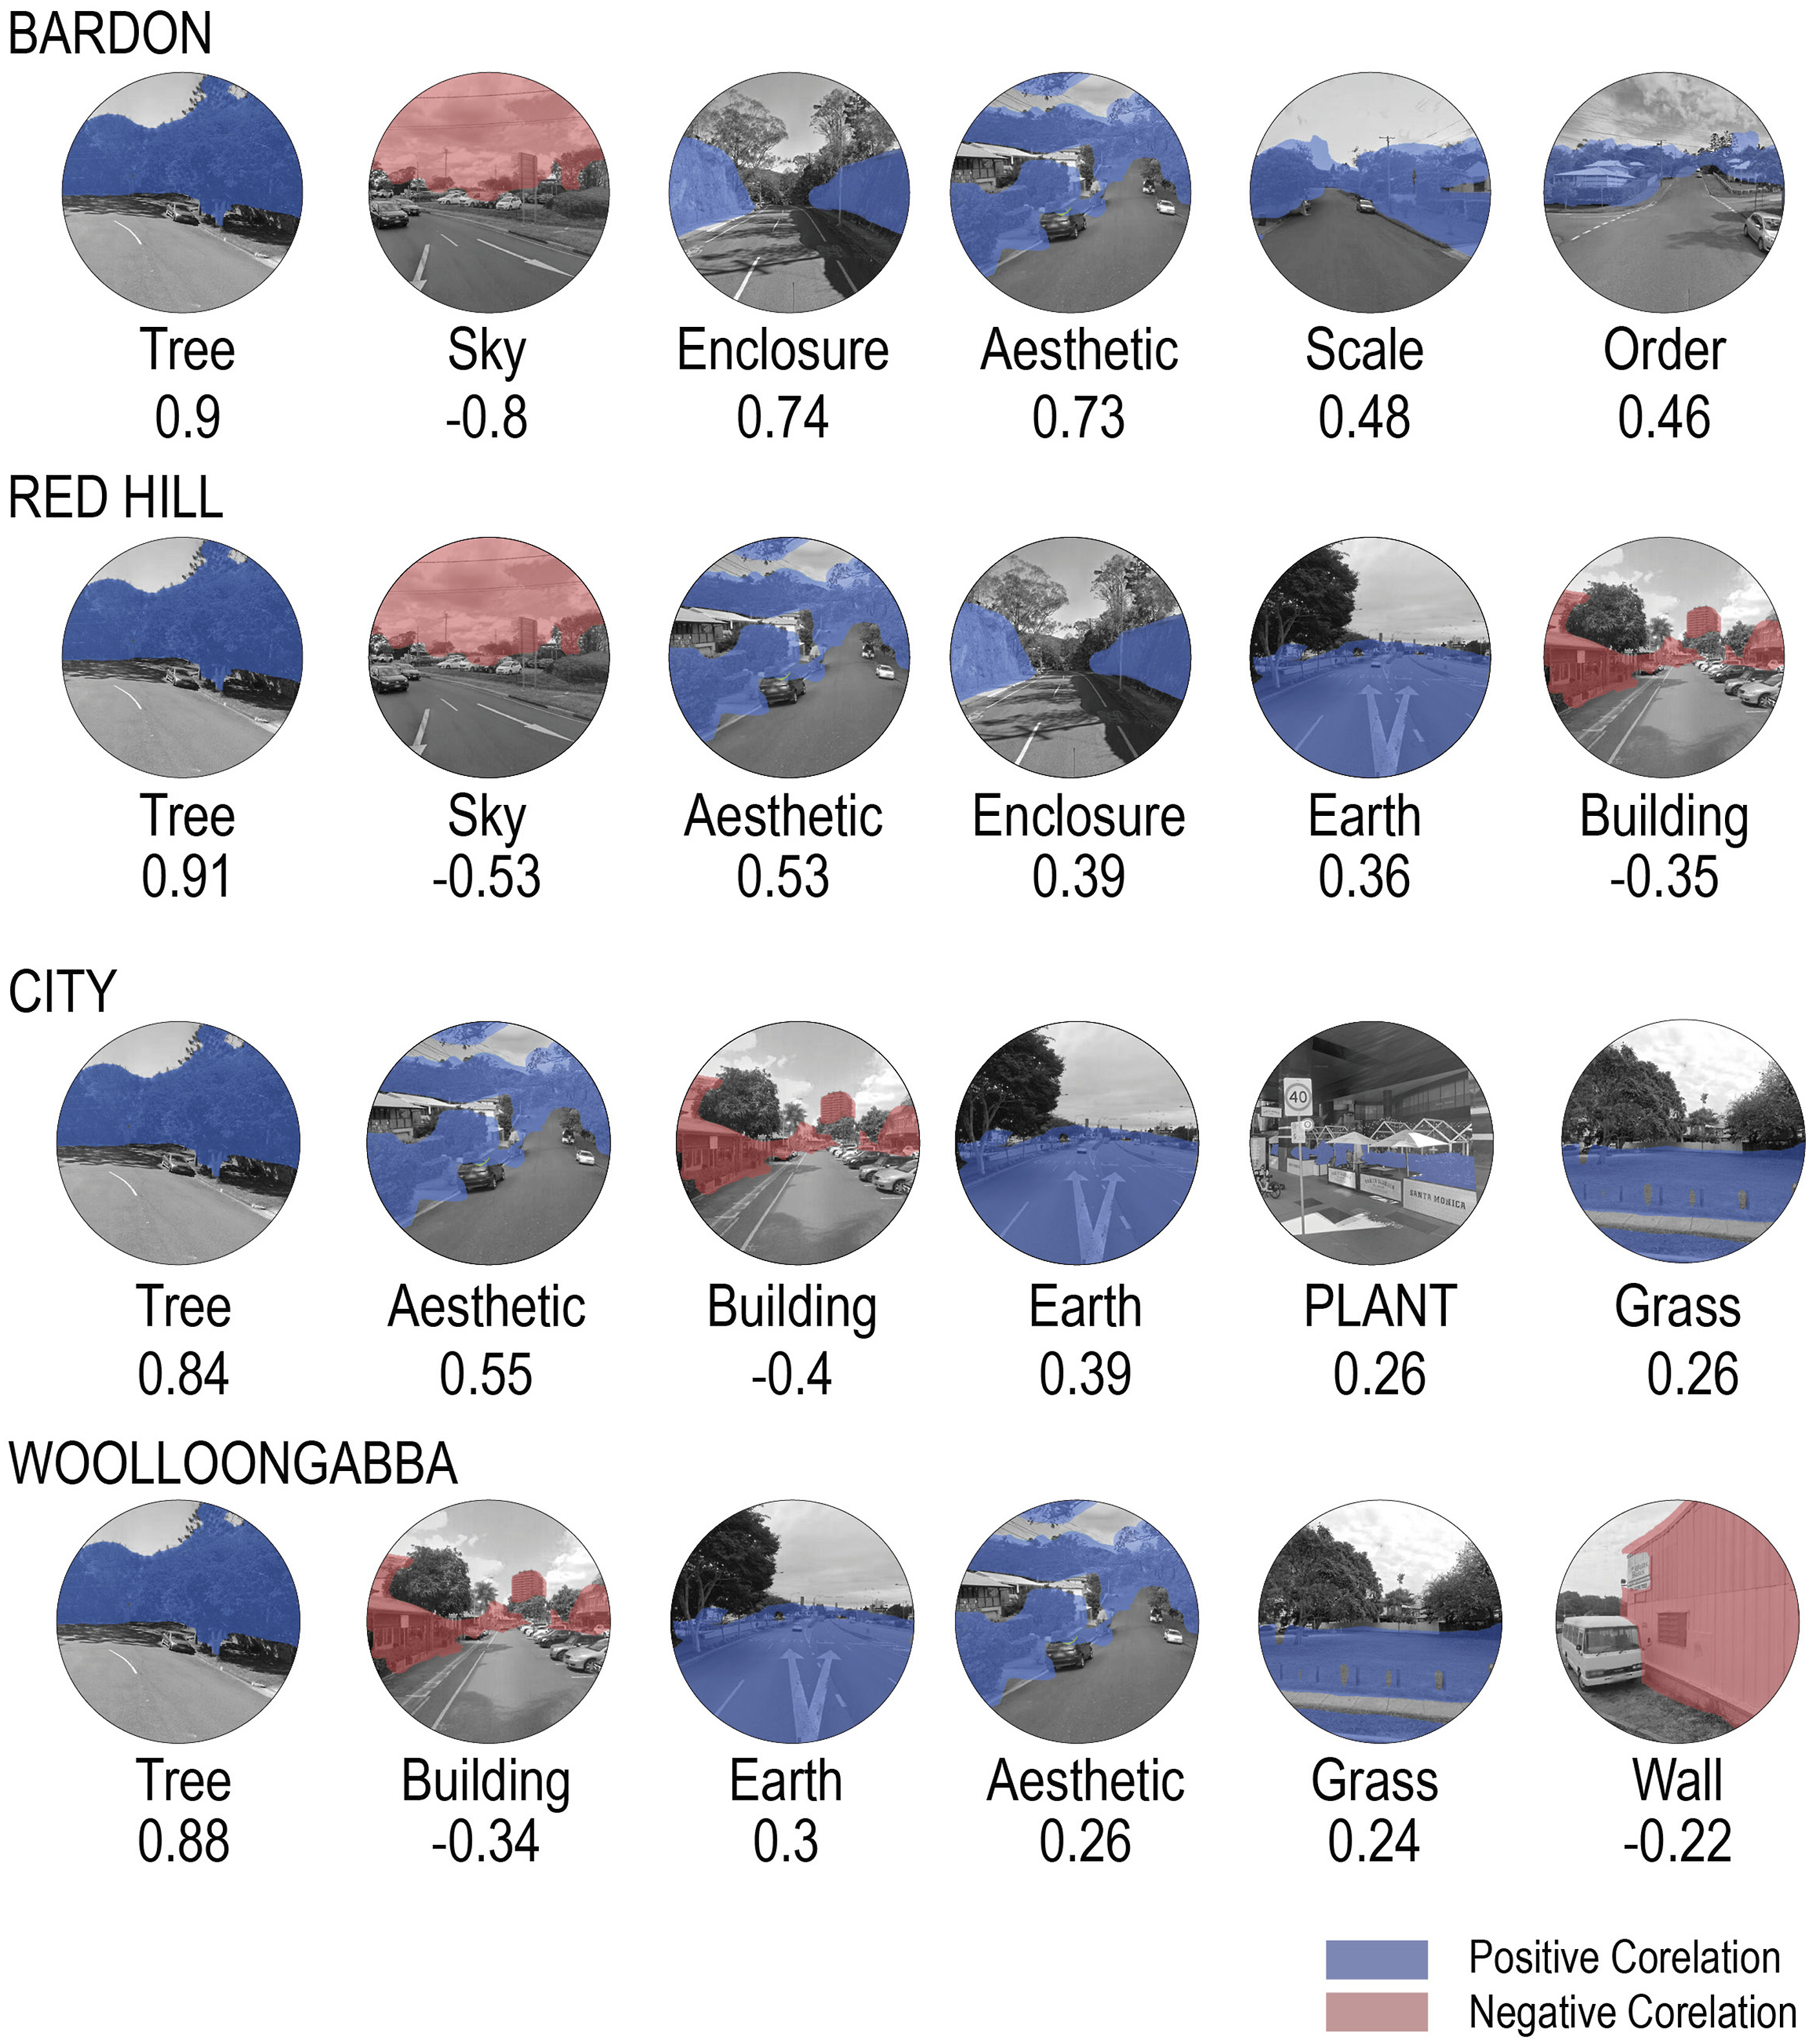
Order and perceived green
Figure 7 depicts the specific steps of the study: first finding the areas that match the characteristics in the data map, and then analysing them in physical space with the help of street views and spatial anaylsis. The data show that the perceived green of Bardon has a strong positive correlation with orderliness, with a correlation coefficient of 0.46. This indicates that if a place has a better perception of green, it tends to have a better spatial order. Conversely, where green perception is poor, spatial order is also more chaotic. In order to investigate the potential causal relationship behind perceived greenness and orderliness, it is necessary to further analyze the street scenes. In this study, several nodes with low perceived green and orderliness scores were selected and combined with Google Street View maps to discover how orderliness potentially affects ecology. It was found that these streets have some commonalities: 1. Randomly placed garbage cans along the street; 2. Vehicles being parked on the curb; 3. Poles or signs; 4. Patchy vegetation. Type2–1 shows some of the streets with similar characteristics. The study concludes that this spatial organization makes pedestrians feel a lack of order and potentially reduces their perception of greenery. Spatial analysis of order and perceived green.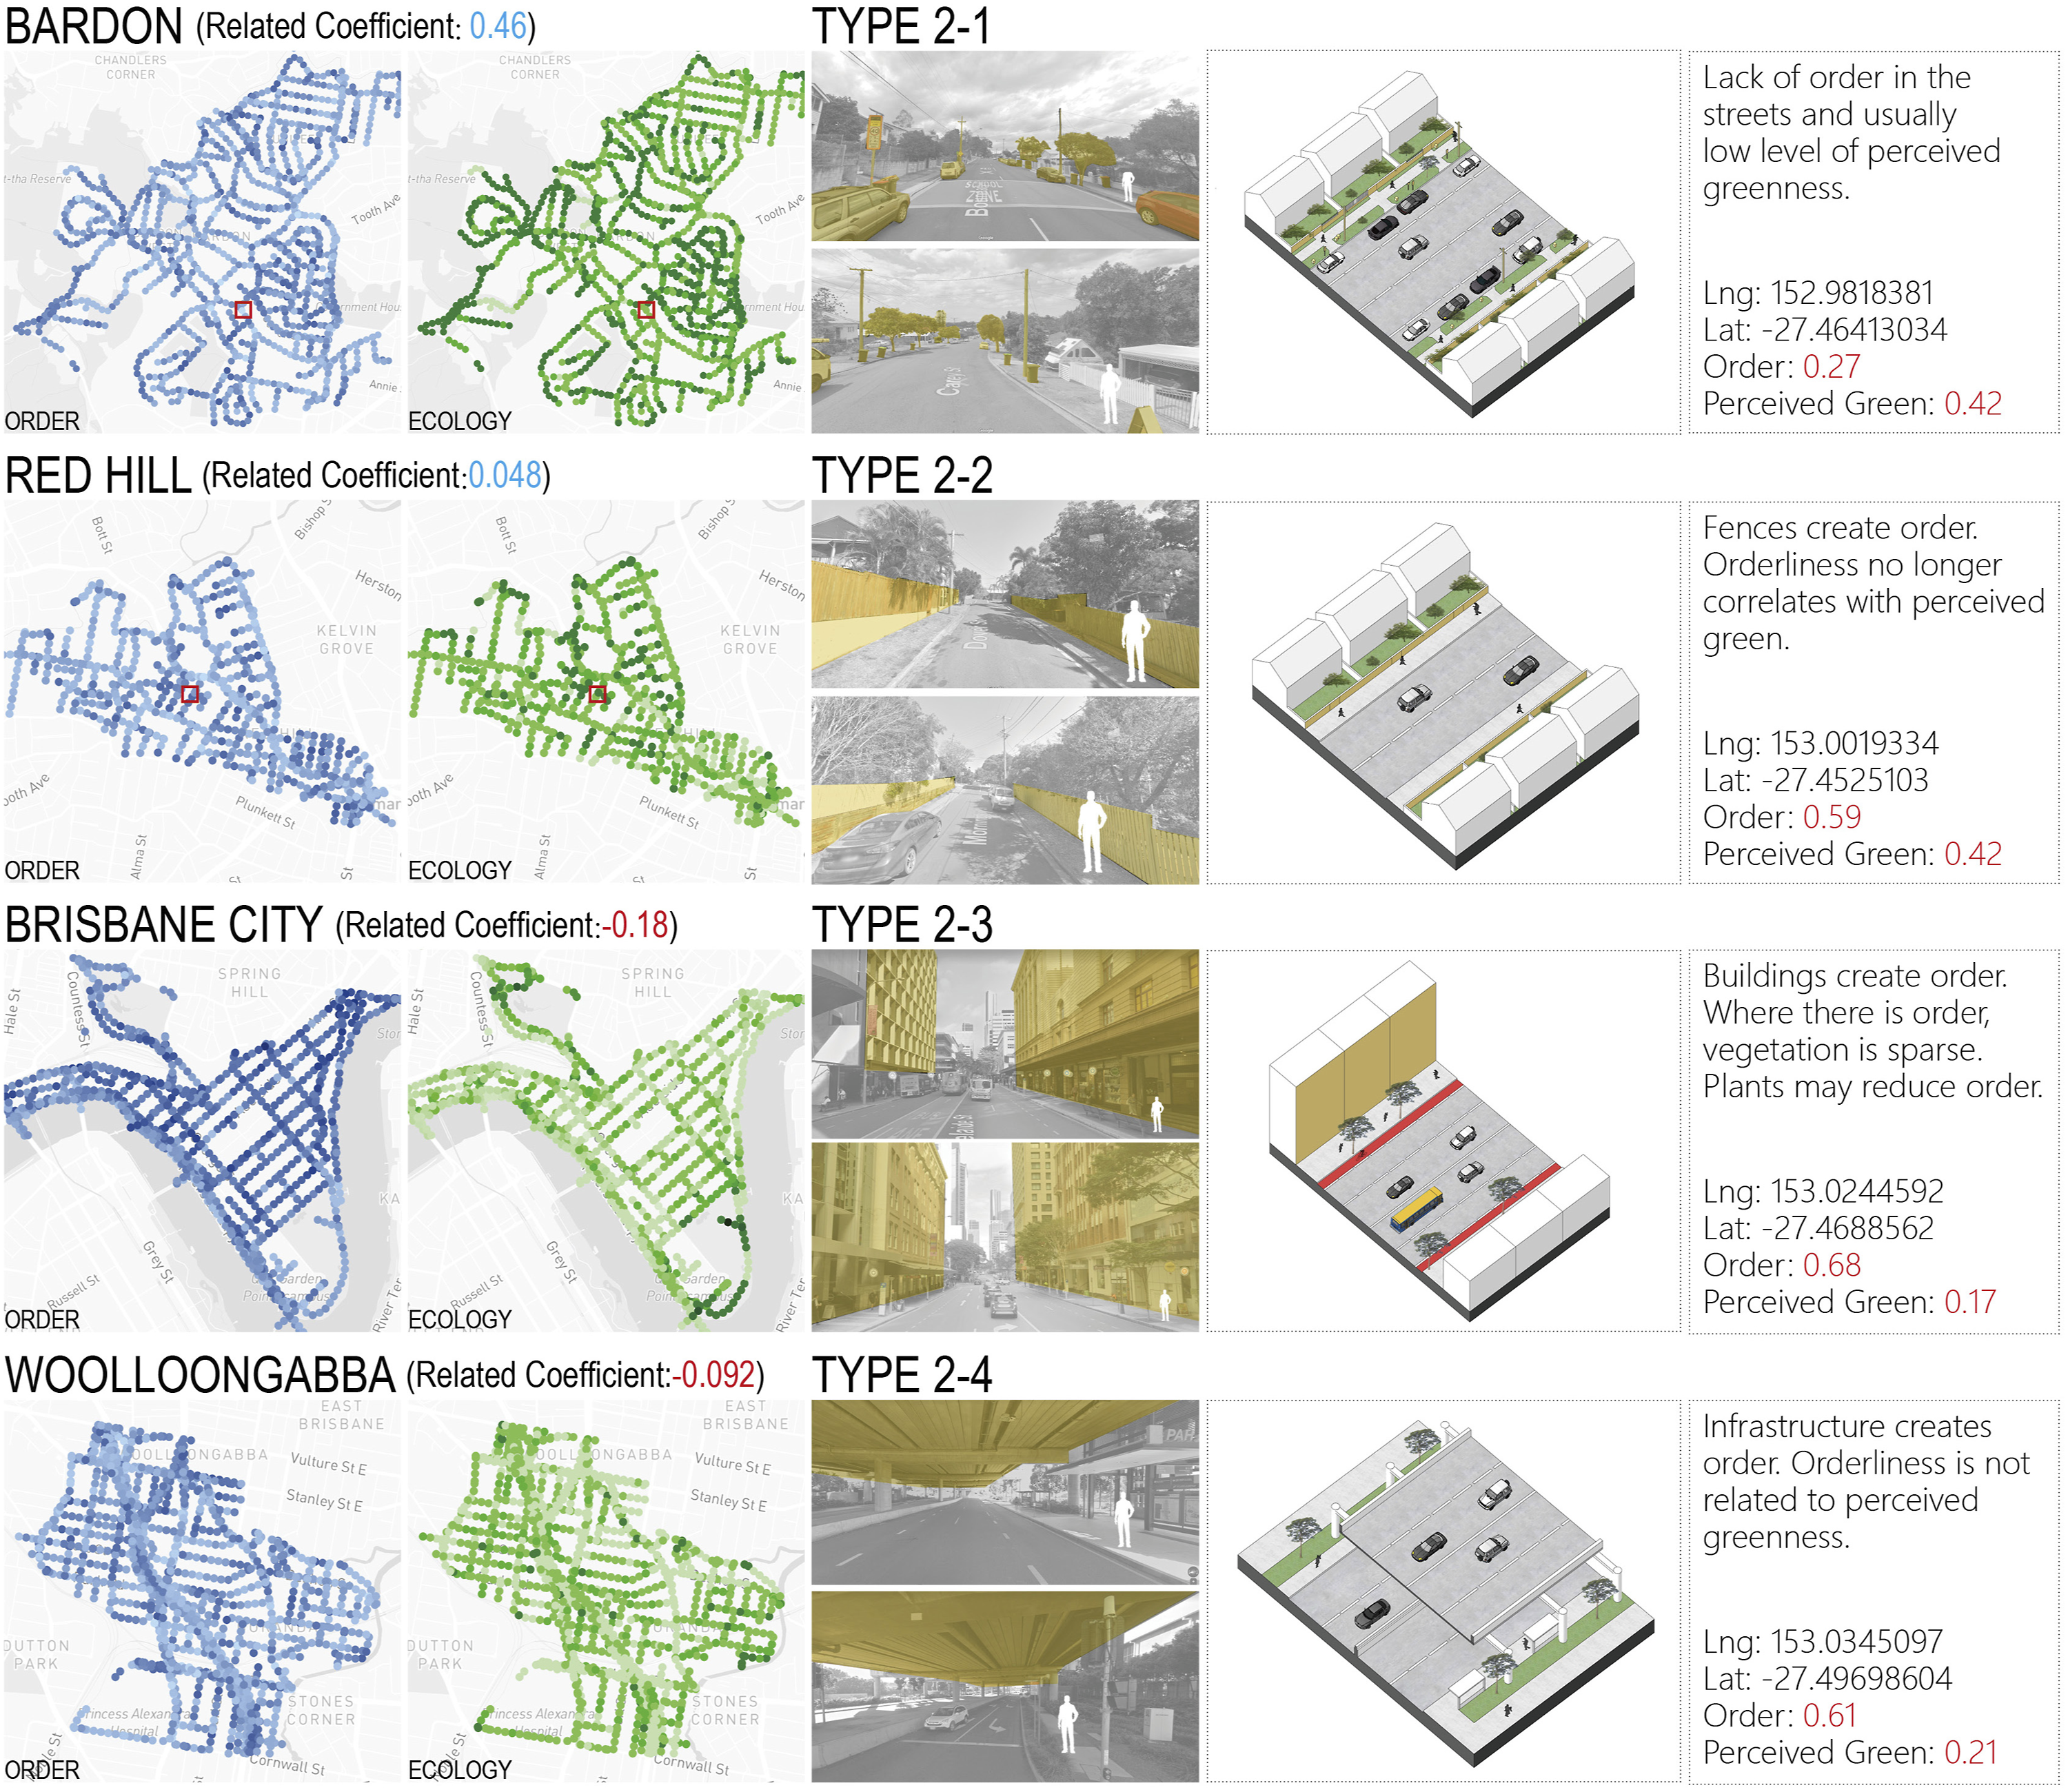
It is worth noting that the data for Red Hill, also a suburb, shows a very weak positive correlation between perceived green and orderliness compared to Bardon, with a correlation coefficient of 0.048. There is no clear pattern between perceived green and orderliness in the streets here. However, if Bardon’s analysis is accurate (there is a correlation between perceived green and orderliness), then it is possible that there are certain spatial types in Red Hill that influence the results. This study analyzed areas of the region with large differences in perceived green and order scores and explores why the two sets of data, which should tend to be similar, diverge. As shown in type2–2, these places have average perceived green scores, but higher orderliness scores. It was found that some orderly elements, such as continuous hedges, fences, or buildings, are present in the spaces here. This leads to a potentially high level of orderliness regardless of the level of greenery here. Therefore, these areas are no longer able to reflect the association between perceived greenness and orderliness.
A similar situation occurs in the predominantly industrial area of Woolloongabba, where the sense of order shows a weak negative correlation with perceived green, with a value of −0.092. The street shown in Type2–4 is located under the viaduct at Woolloongabba. This scene shows a similar feature to Red Hill, where the artifacts themselves form the order, but the plants are pushed to the side.
In contrast, Brisbane City, as a city center, shows a stronger negative correlation between order and perceptual green than Woolloongabba, with a value of −0.18. This is due to the fact that Brisbane City’s streets are somewhat orderly due to strict planning conditions. In this case, the street green, because of its form and spacing without a clear pattern, would instead reduce the sense of order in the street to some extent.
Research on these four areas suggests that orderliness will affect pedestrian perceptions of greenness. Where human design is lacking, orderliness shows a higher correlation with green perception; and the more human constraints, such as City, orderliness will possibly show no or even a negative correlation with green perception.
Human scale and perceived green
The definition of human scale is not consistent. In general, if the dimensions of various objects in an environment are close to human dimensions, we consider it to be a space close to human scale. Factors such as the width of a road and the height of a building affect the sense of scale. Some details, such as the complexity of architectural elements or decorative patterns, also affect the sense of human scale. In addition, even when surrounded by high-rise buildings, if the ground floor is designed with sufficient sophistication, it is possible to create a space that is close to human scale. According to Henry Arnold (1993), street trees reconcile the space beyond human scale created by tall buildings and wide streets. This is because the canopy formed by the leaves and branches of the trees allows people to experience smaller spaces within a larger volume.
Figure 8 depicts the correlation between human scale and perceived green. In Bardon, the correlation coefficient is 0.48. This indicates that the closer the street space in this area is to human scale, the better people’s perception of green. In this study, with the help of data visualization maps, we found places where both human scale and perceived green scores were high. It was found that most of the streets in these nodes are relatively narrow, and the vegetation further creates an envelope with smaller boundaries. The tree canopy on both sides shades the sky and distant views, thus creating a space close to human scale. The lush vegetation also provides a high perceived green score. As shown in type3–1, this space type is more common in Bardon. Spatial analysis of human scale and perceived green.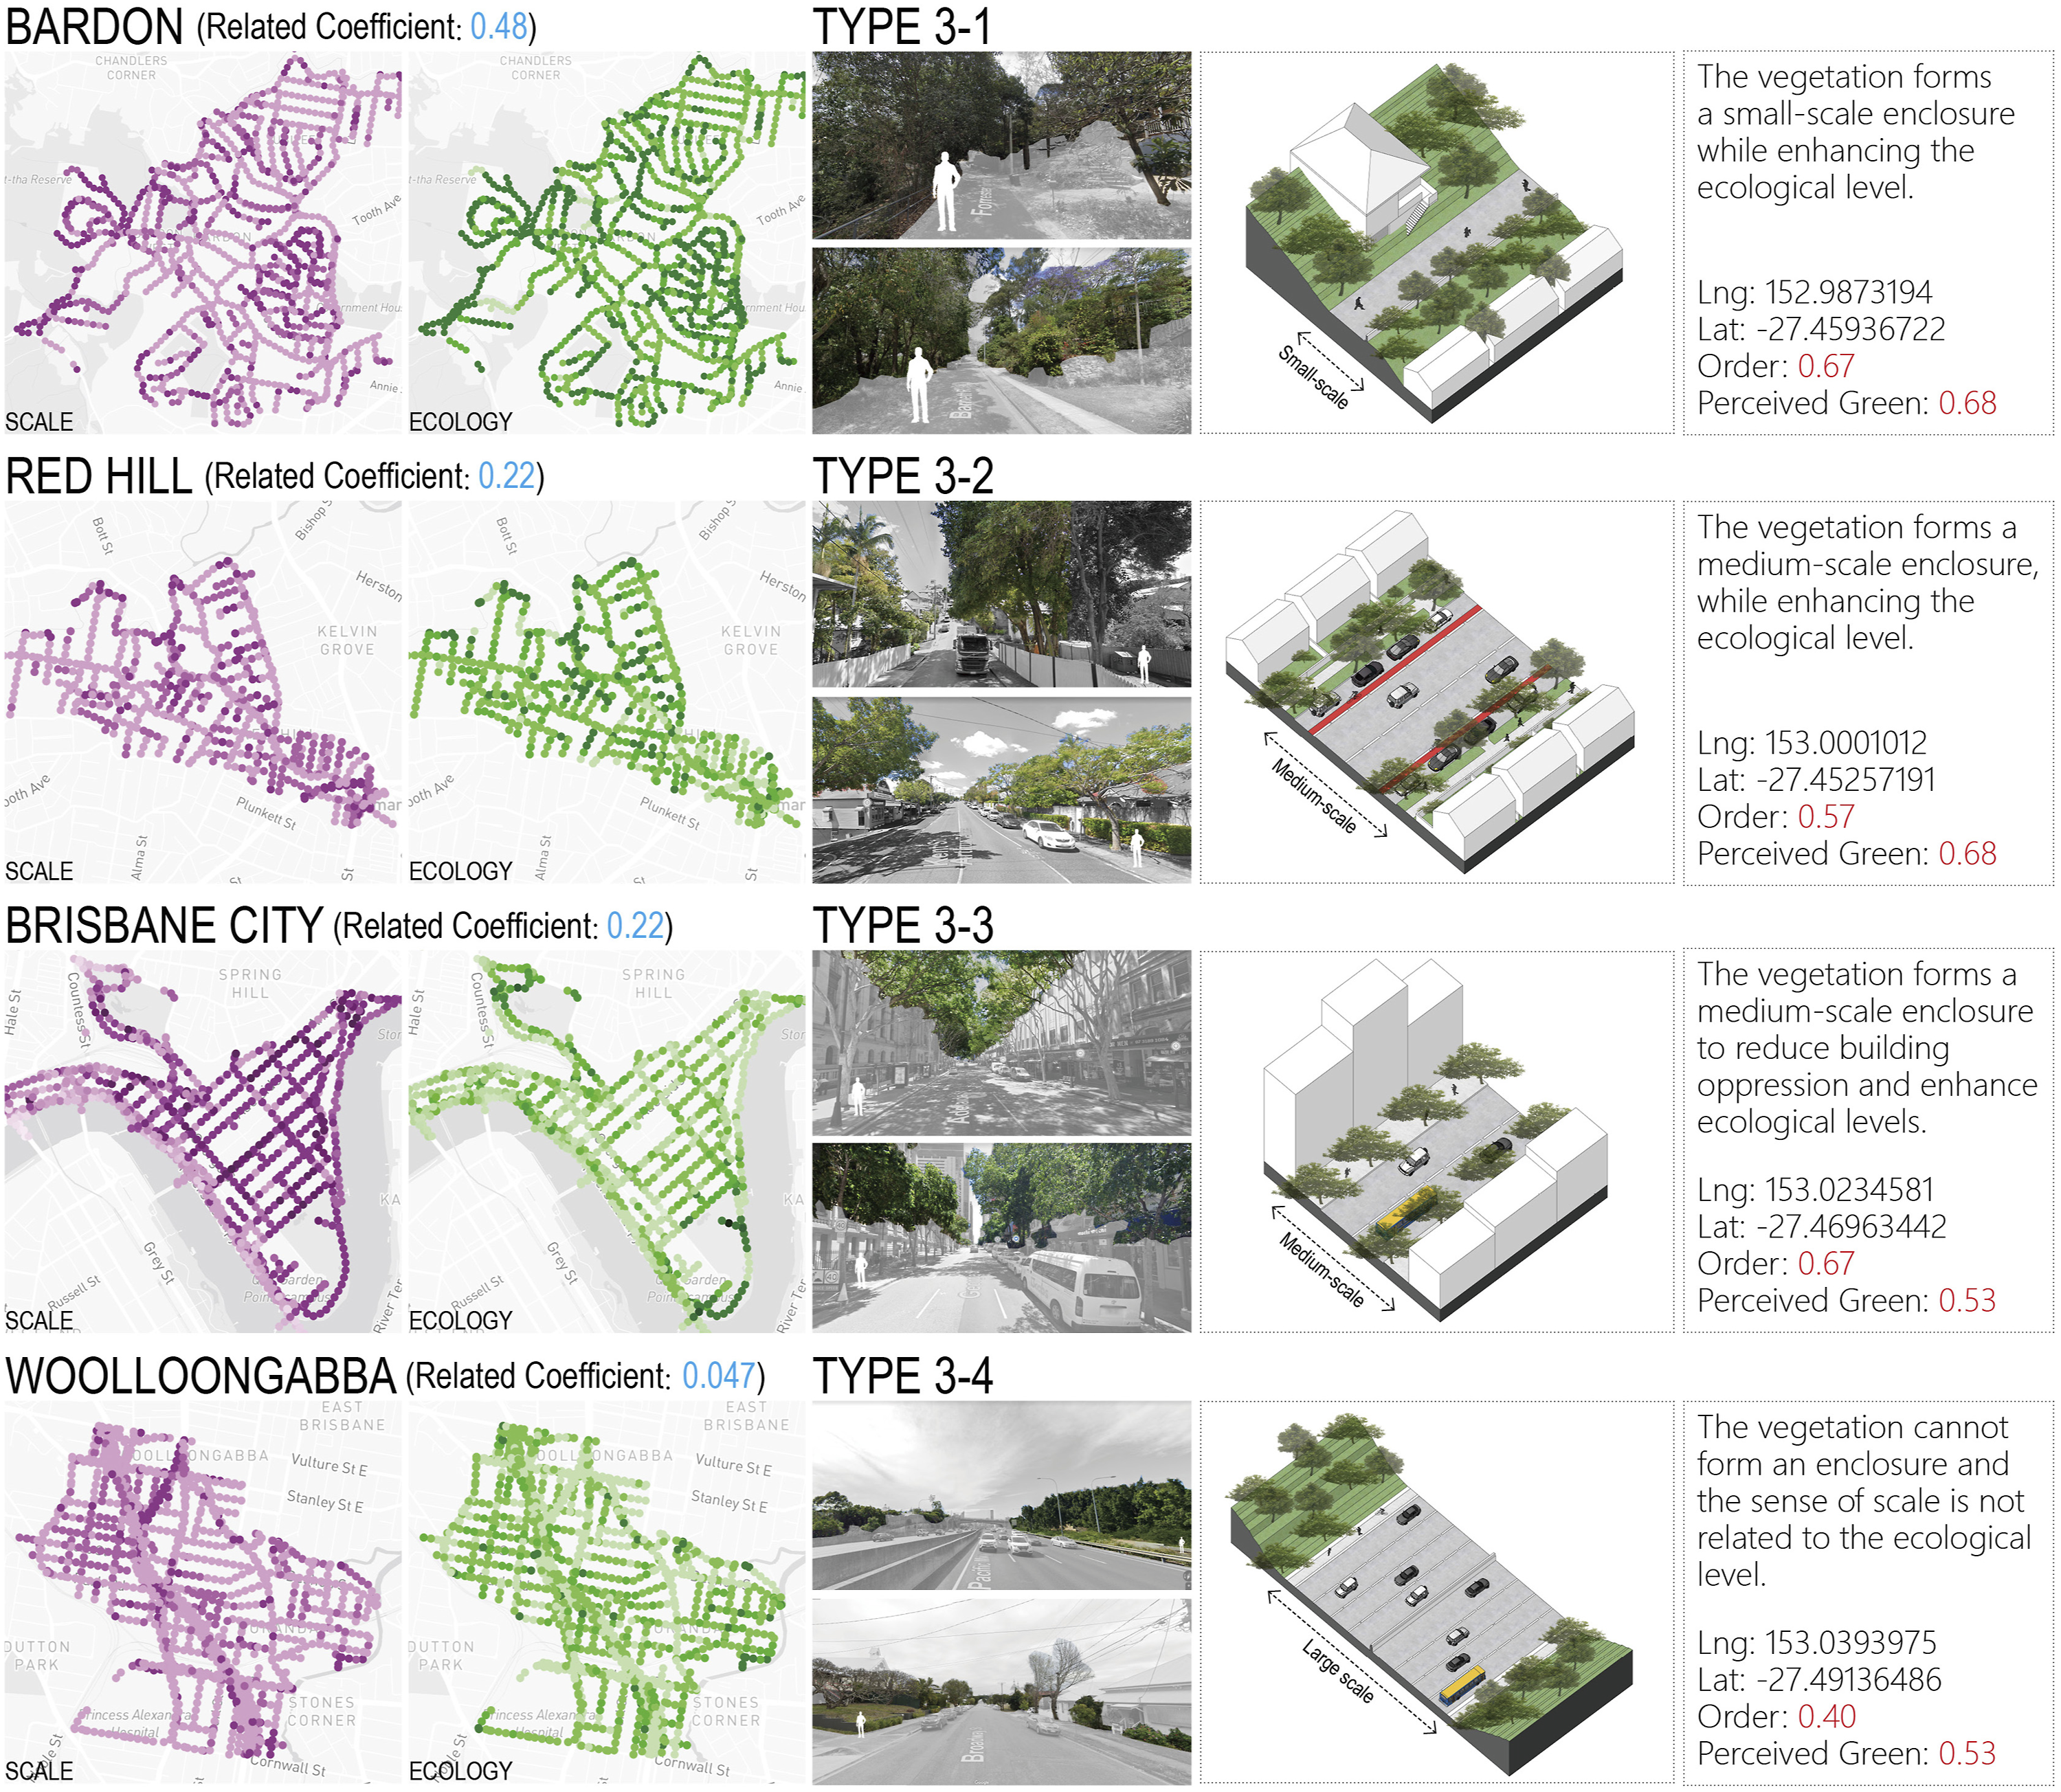
In Brisbane City, the correlation coefficient between human scale and perceived green was 0.22, with a weak positive correlation. It was found that, as shown in type3–3, although high-rise buildings create an oppressive street surface, the lush tree canopy on both sides of the street creates a smaller space, thus allowing these places to have a space closer to human scale. But this type of street space is not found everywhere.
The correlation between human scale and ecology in the Red Hill area is 0.24. This set of data is extremely close to that of the Brisbane City area. Although the two areas are commercial and residential, observations from the streetscape reveal that they both have streets of a similar scale. Unlike the character of Brisbane City, which relies on trees to create a smaller scale enclosure, the buildings in the Red Hill area are inherently small in scale. However, the tree canopy lining the road still serves to define the space while enriching the green experience.
It is worth noting that in Woolloongabba, the correlation coefficient between human scale and perceived green is only 0.047. By observation, it is found that most of the roads in this area are spacious, and vegetation is distributed farther on both sides of the road, as shown in type3–4. Unlike the previous three areas, the vegetation here is not enough to create small spaces that affect the perception of scale, but they still affect pedestrians' perception of green. This is why the perceived green is different even for roads of the same scale.
After analysing these four areas, the study concluded that when human scale showed a higher correlation with perceived green, it was because vegetation provided a space closer to human scale while creating a larger green interface. The study cannot yet determine whether the two are causal. However, the use of vegetation to define space, especially by increasing the density of the tree canopy, will be a two-fold move. These streets obtain both an appropriate perception of scale and an enhanced level of greenery.
Quantification of consistency and difference between planning green, visual green, and perceived green
For the sake of narrative organization, this section divides the space into those with high consistency and those with low consistency based on the magnitude of the differences of the three green values, and then classifies and summarizes the representative spatial types within each region in each subpart, while analysing them in the context of actual scenarios. Finally, this study tries to explore the connection with the green level by drawing the distribution of the three green difference values and combining them with the functional characteristics of different regions.
One point to note is that the correlation between visual green and perceived green within each of these four areas reached above 0.8, which means that the difference between the two is not too significant. Therefore, the study concluded that the consistency of the three greens depends mainly on the consistency of the planning green with the other two greens. This would lead to a partial overlap between the analysis in section 3.3 and that in section 3.1. However, it should be clear that the study in section 3.1 is intended to provide a methodology for exploring the issue of green invisibility due to physical occlusion. Section 3.3, on the other hand, takes a more comprehensive look at the consistency of the three green values: in addition to the three-dimensional spatial distribution of greenery in the study area, the potential relationship between different levels of greenery or planimetric distribution and visual or perceived greenery will be discussed at the planning level.
Spaces with high consistency between three green values
Figure 9 depicts the distribution of locations with high consistency of three green values via spatial analysis . Based on the distribution this study first focused on Bardon and Red Hill, which are both residential areas and therefore share similar spatial structure, but the consistency of the three types of green within Bardon is better. After comparison, it was found that these areas with better consistency share similar characteristics. They are located in residential areas with high building density, so they have more compact backyards than other plots, which makes the greenery within the plots more evenly distributed, rather than heavily concentrated in the backyards. In addition, occupants tend to choose tall trees to plant in the front yard so that the plants can be seen by pedestrians over the fence, enriching the street greenery and providing a better visual perception of greenery. This set of characteristics results in a balance between planned and visual green in these spaces, with both at a relatively average level, neither too high nor too low, and thus a high consistency. It is noteworthy that the greenery in the high-density residential areas in Red Hill does not show the same consistency as Bardon, which is due to the relative lack of greenery in the streets and the preference of the residents to plant lawns rather than trees in their front yards. Thus, with similar planned green distribution, the reduction in visual green increases the difference between the three green values, resulting in a failure to show high consistency in these areas. Spatial Analysis with high consistency of three green values.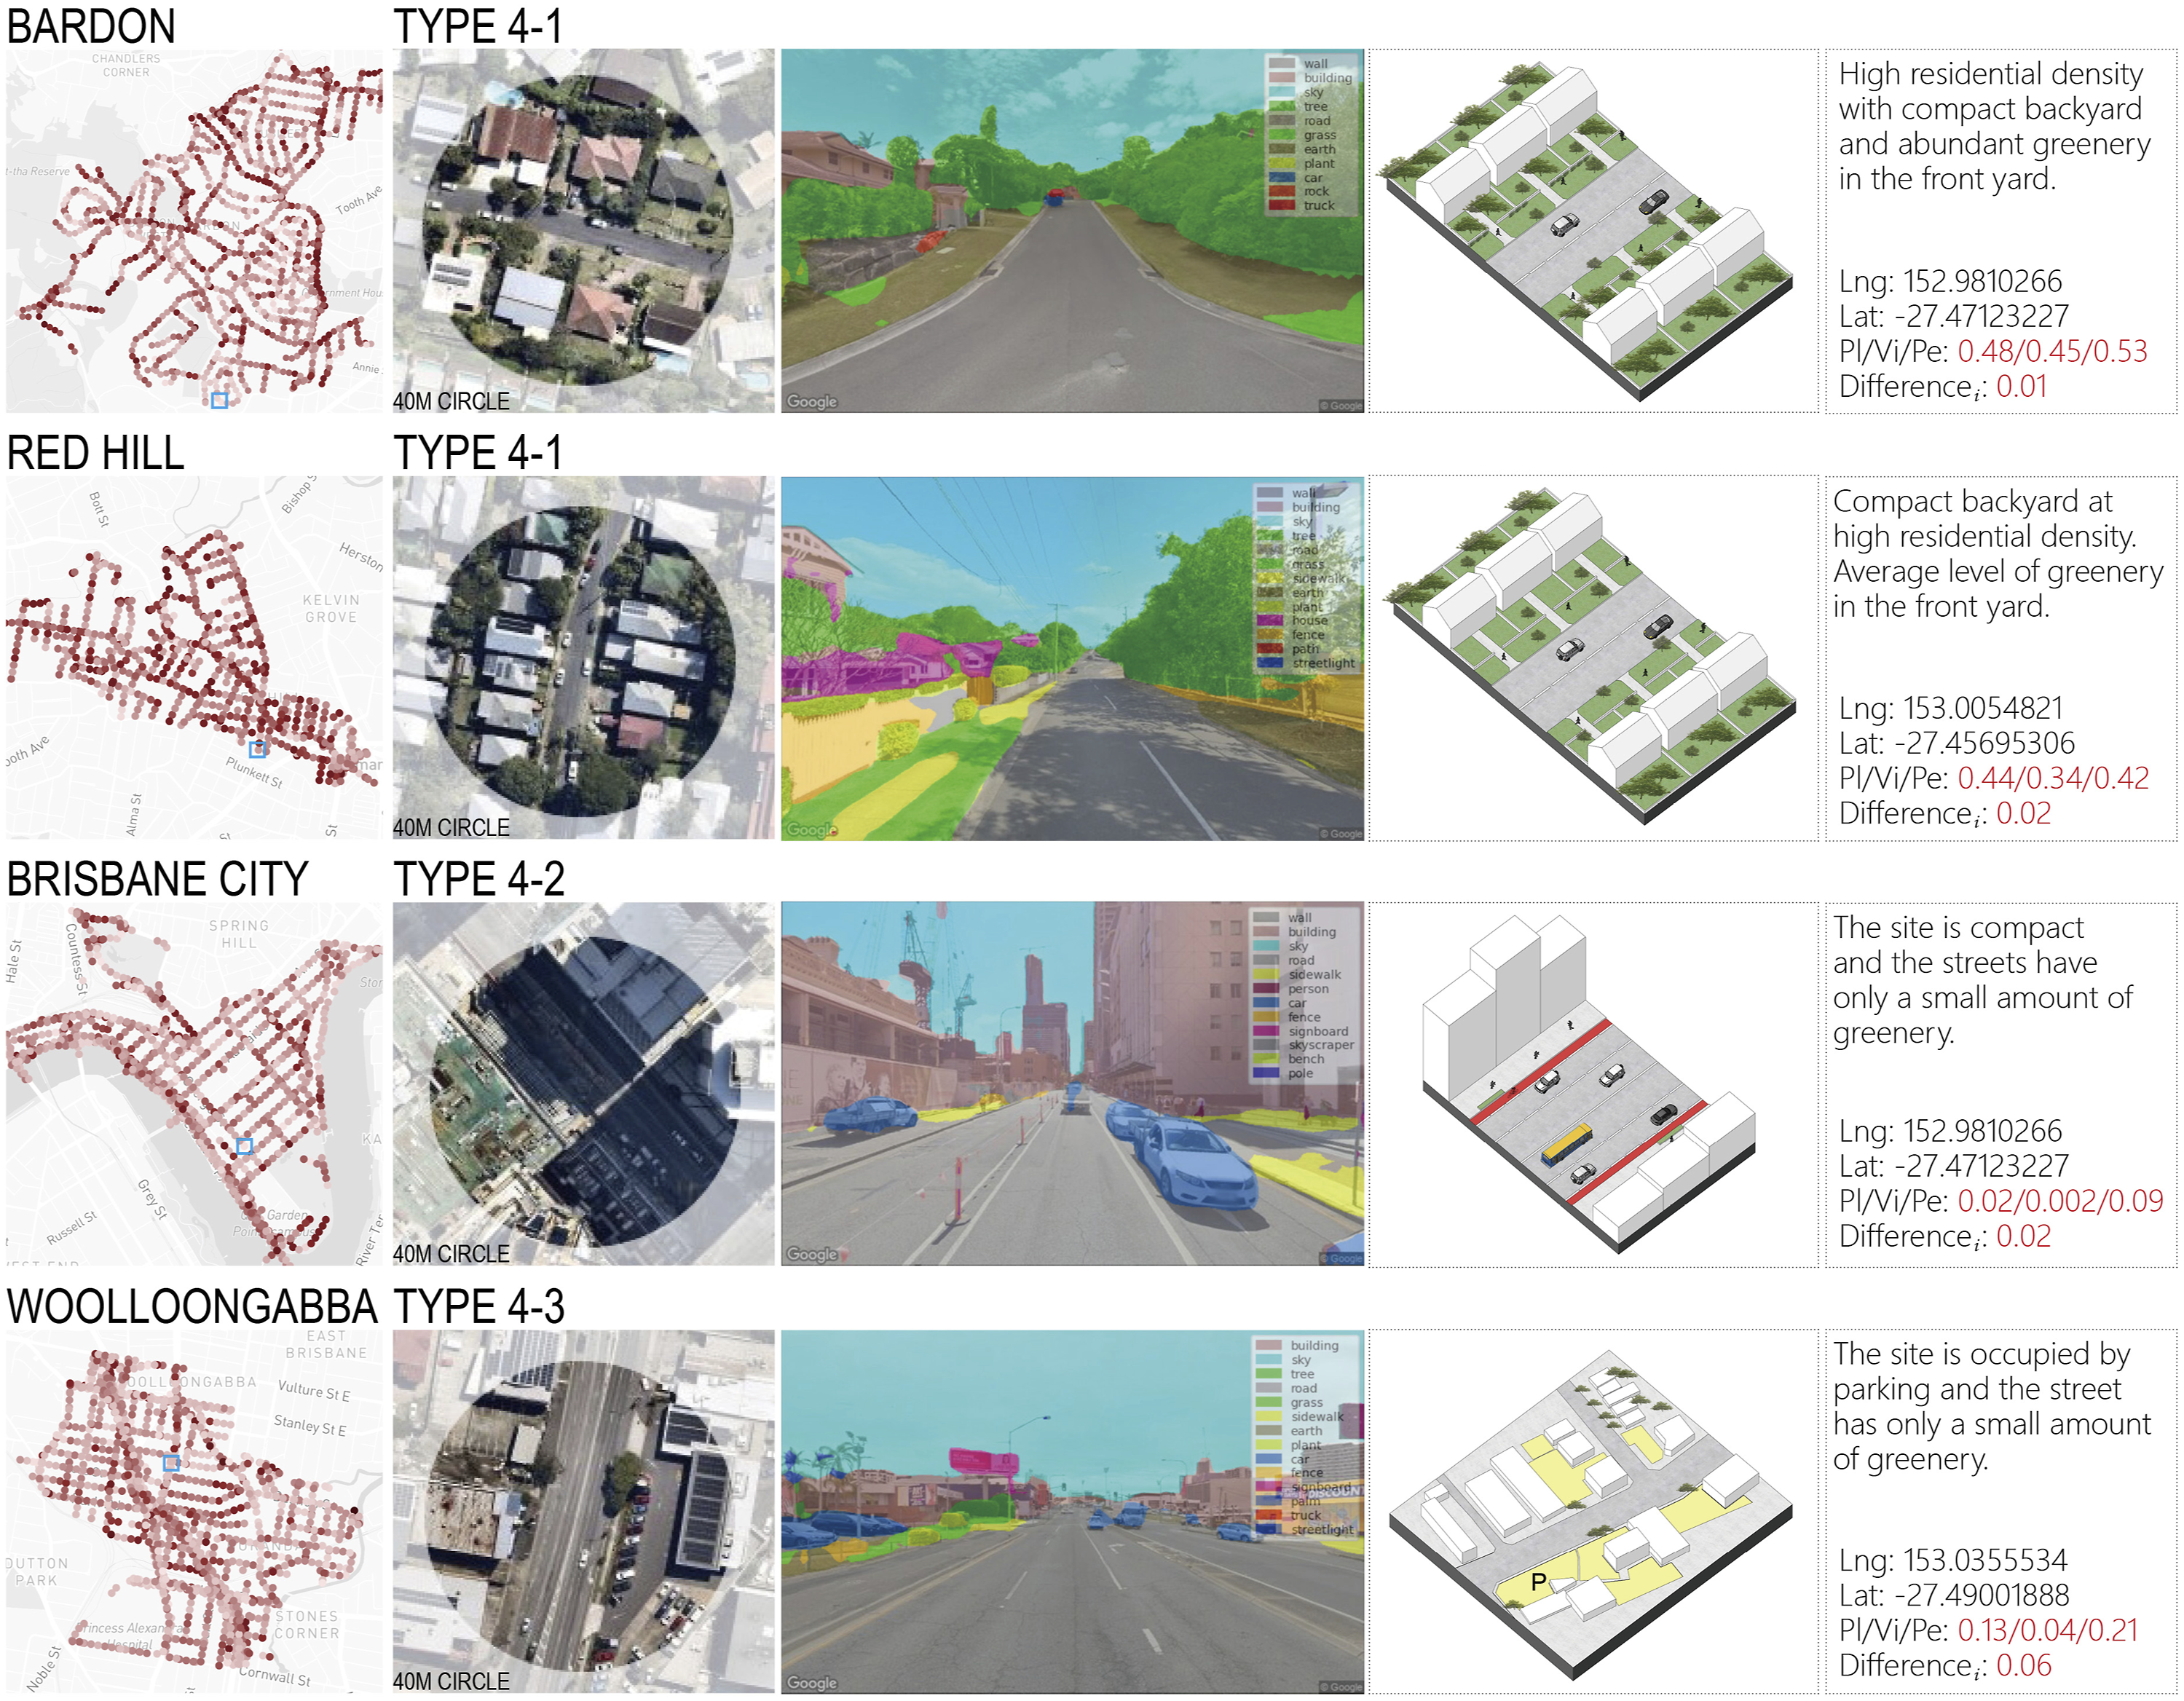
The areas within Brisbane City that have high consistency of the three green values have different characteristics. These spaces are surrounded by little or no greenery. The study found that City generally has a high building density, which means that the plots are filled with buildings as much as possible. Greenery here is unlikely to be as abundant as in residential areas, and is found almost exclusively on both sides of the street. Therefore, the planning green in the plots is generally kept at a low value. When the streets in an area have no greenery, or have less greenery, the lower planned green value is matched by a lower visual green, which in turn is reflected in a high degree of consistency in the three green values.
The space in Woolloongabba with high consistency of three greens also points to some areas with less greenery. However, unlike Brisbane City, most of the buildings in these areas are not higher than three stories. And unlike City, which fully develops underground space, the parking lot here almost occupies a lot of ground space. In addition, unlike City where the lack of greenery is due to the compactness of the site, Woolloongabba still has a lot of space that can be greened. The study speculates that this unsaturated greenery is due to the fact that Woolloongabba’s consideration of the necessity of walking is different from that of Brisbane City. After all, the large amount of parking means that people prefer to arrive by car than by foot, and therefore there is no need to focus on the walking experience as much as in Brisbane City. The current low level of greenery will further reduce the desire to walk, and if public transportation is not used effectively, greenery will be further replaced by parking in the future.
Spaces with low consistency bwtween the three green values
Figure 10 depicts the distribution of locations with low consistency of three green values via spatial analysis. Based on the distribution, this study found that the differences between the three green values within Red Hill and Bardon are more pronounced than in Brisbane City and Woolloongabba. The study suggests that this is due to a typology that is predominant in the residential areas. In contrast to the previously mentioned high density residential areas, this residential type has a more generous site. This allows for ampler space in the back yards of the plots to accommodate more greenery, thus greatly increasing the proportion of planning green. However, in contrast, the green area in the front yard does not change much as the buildings are set back the same distance from the road, which indirectly results in the values of visual or perceptual green not changing much. Ultimately, the relatively constant visual green values are matched by higher planned green values within these areas, leading to a reduction in the consistency of the three green values. As shown in satellite image N, there are a large number of green areas behind houses that contribute to the Planning Green values, but pedestrians are not able to detect their presence from the street. There is also a noteworthy phenomenon in Bardon. On roads close to large parks, there is a general noticeable drop in the consistency of the three green values. However, having actually observed the streetscape, it is clear that the street greenery in these areas is good and there is no shading from buildings. It would seem that a natural explanation could be given that this is a discrepancy due to the over-greening around the site, but the visual green is not significantly enhanced. However, the study further argues that this extreme difference leads to questions about the fairness of the perceived green collection. Typically, computers determine the value of visual green according to the proportion of pixels of plants in a photograph; however, they do not record the vastness of the vegetation. That is, a glance at a rolling, vast, dense forest, and a row of street trees, if they have the same pixel area of greenery, will result in similar visual green values, which in turn will greatly sway the perceptual green score. However, if the two scenarios bring different perceptions, the influence of this psychological factor will be underestimated in some cases. Spatial Analysis with low consistency of three green values.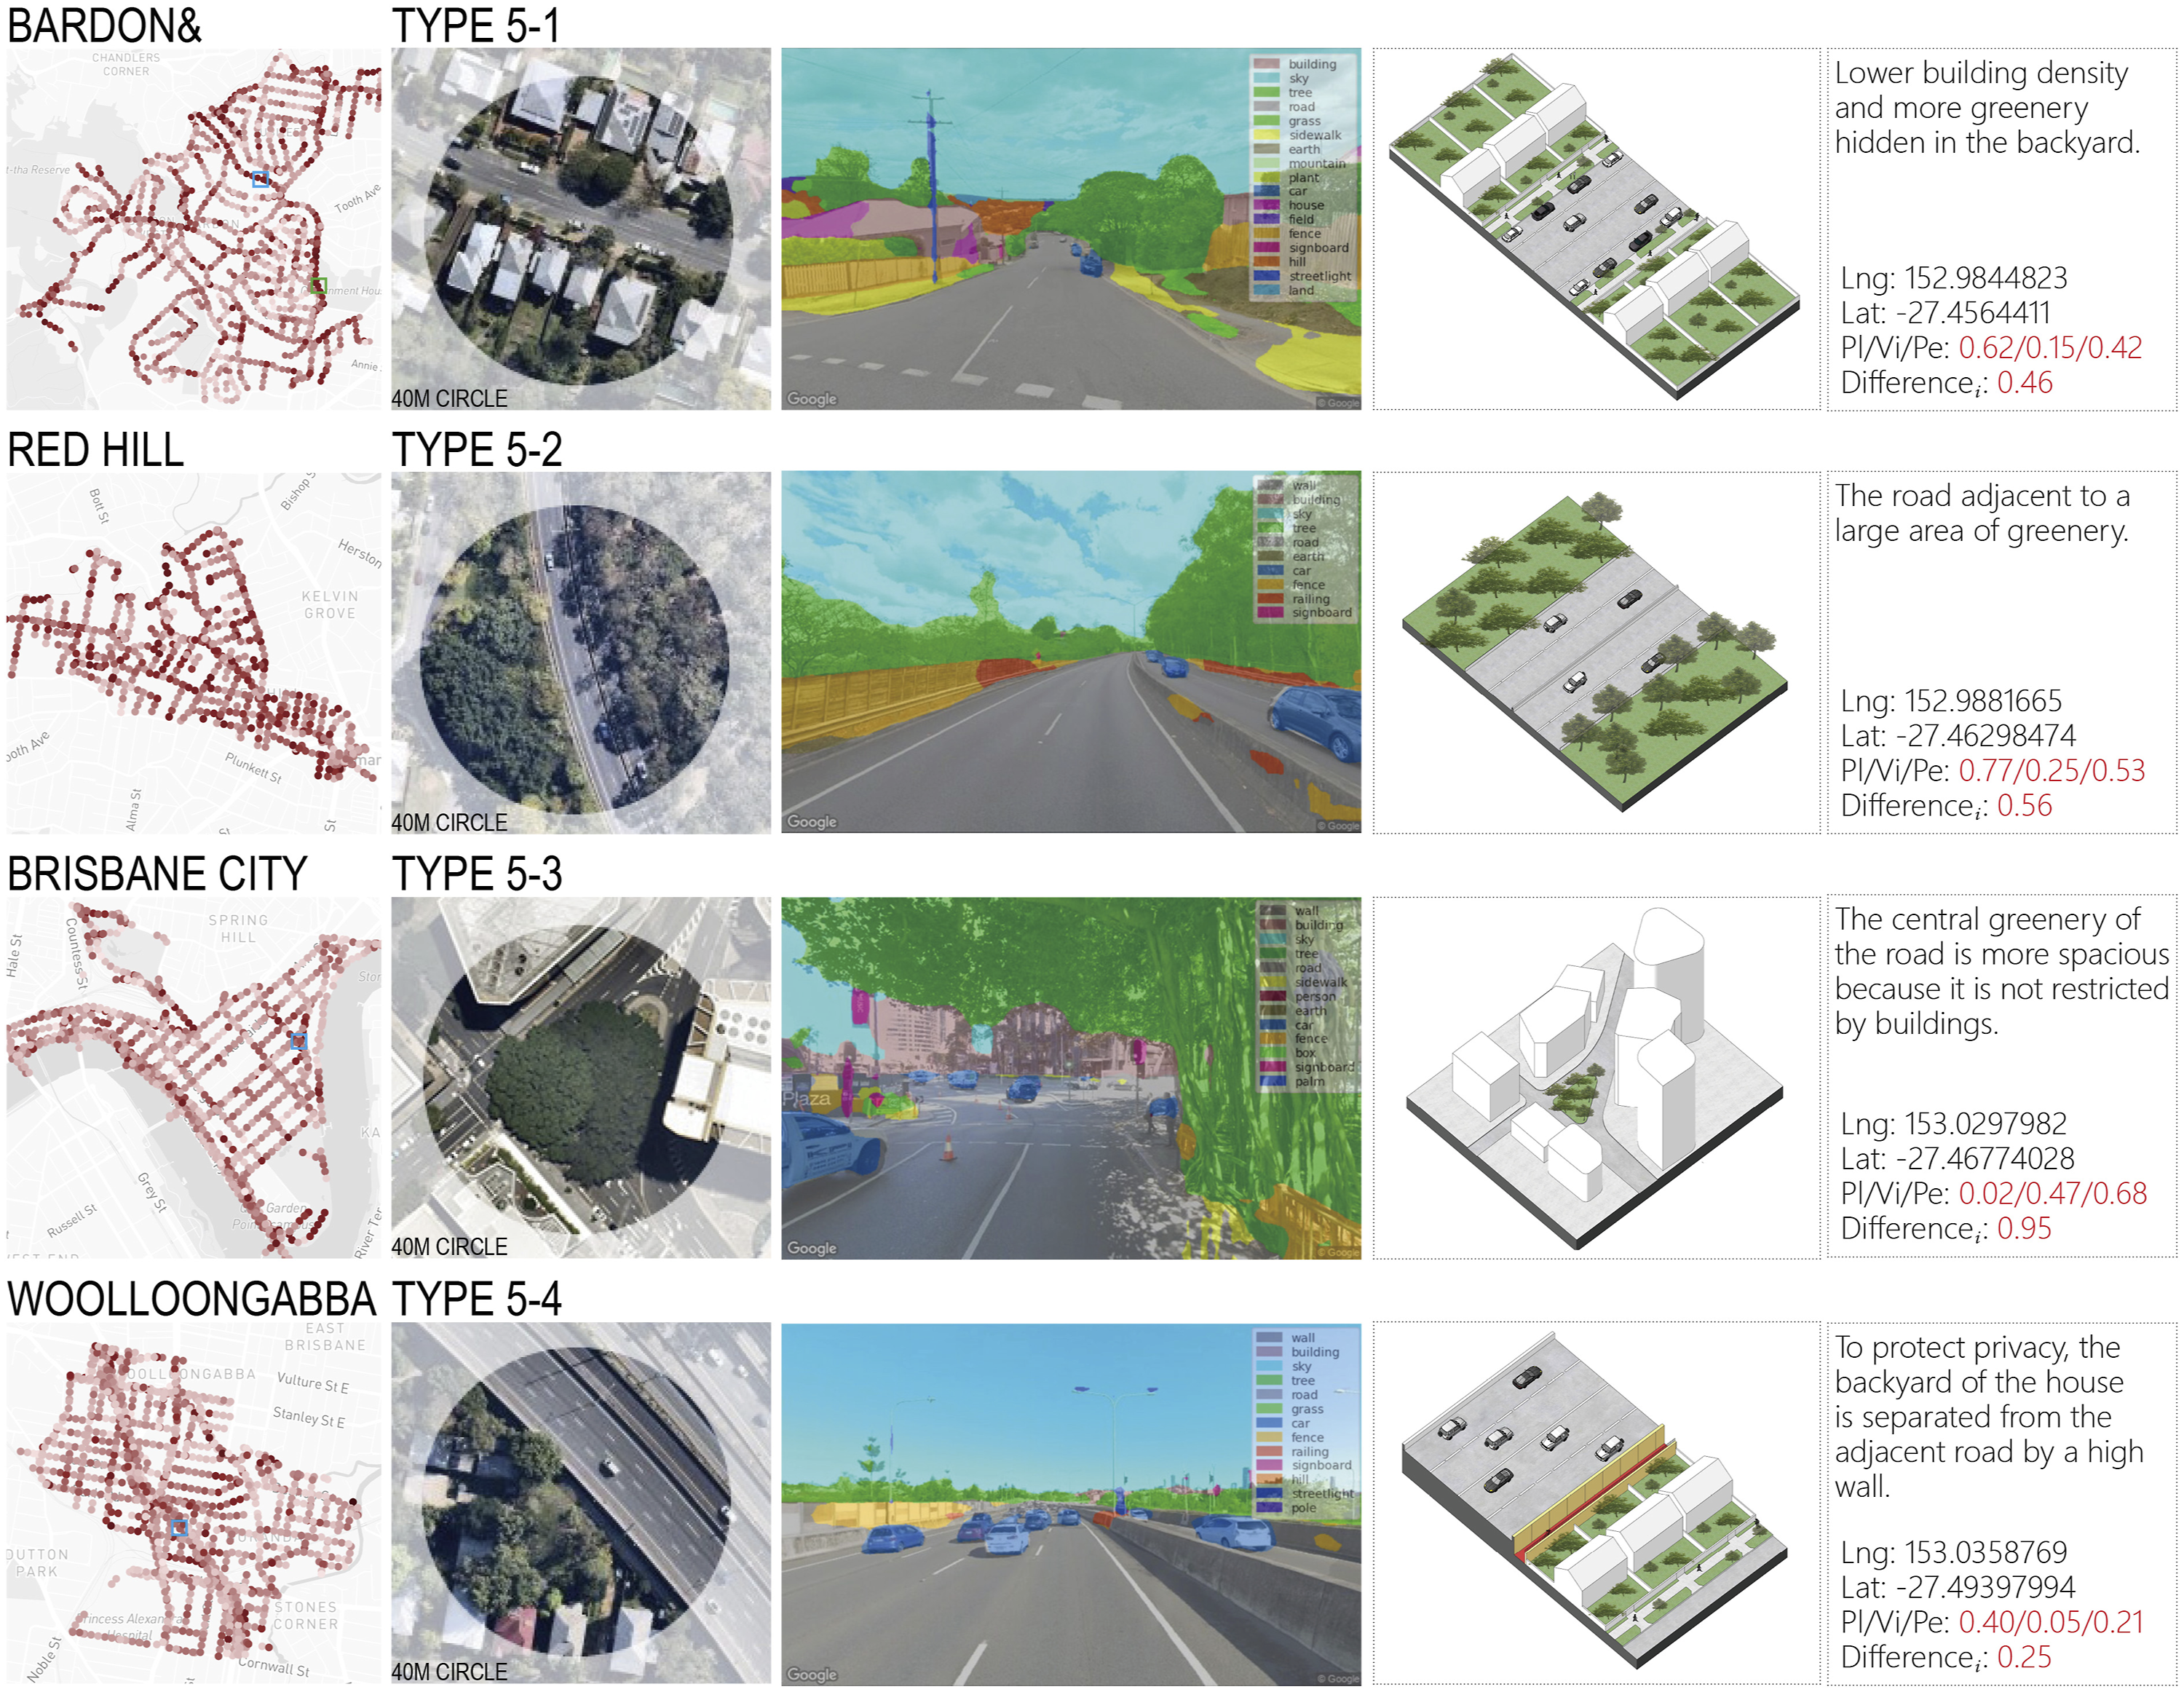
In Brisbane City, the areas where the three green values are less consistent tend to have a more satisfactory greenery. This is due to the fact that when the plot itself is occupied as much as possible by buildings, plants can only be concentrated in the streets. This distribution of greenery ensures that it is provided more effectively to pedestrians. However, when similar streets are compared, it becomes clear that not every street is so effectively greened. According to the analysis in chapter 3.1, the overly constricted road width limits the development of greenery horizontally, resulting in taller and potentially shaded street trees, which is still a detrimental factor to the green experience. The street spaces shown in TYPE 5–3 confirm this view. The greenery in the center of these road junctions is freed from the constraints of the buildings and is lower and more lush than the street trees, thus providing a higher visual green. This spatial feature ensures that the greenery is made available to pedestrians more effectively. Evidence of this lies in the fact that the three green values are more inconsistently expressed here compared to where the trees are on either side.
In Woolloongabba, the consistency of the three green values in the low-density industrial is more random than elsewhere, which is thought to be caused by the lack of coherent street trees and the large number of open car parks. The study concludes that these scattered highly differentiated sites are difficult to generalize to a uniform spatial type due to the lack of sufficient coherence. In addition to this, however, the study identified segregated cycle paths where the railings on one side were designed to block out road noise and the other to avoid peeking into other people’s backyards. But this measure also isolates the view from both sides and creates a road in a narrow gap. This is an uncommon situation, but reflects the general idea that not all greenery can be used for public purposes, and that a suitable buffer is needed between the public and private spheres.
Distribution of the consistency between the three green values within the four regions
As can be seen from the distribution shown in Figure 11, Red Hill (median 0.24) and Bardon (median 0.20) as residential areas show a low consistency of the three green values, followed by Brisbane City (median 0.16), while the area with the best consistency is Woolloongabba (median 0.14). The study also compared this to the distribution maps of visual and perceptual greens, however, no clear pattern was found between them. In other words, a high consistency of the three green values does not equal good greenness. This is because areas with the same consistency correspond to different spatial types, which have different levels of greenery. For example, sometimes the consistency is low because the greenery is overshadowed, or because it is concentrated in the middle of the road, or because there are large parks around the road. Therefore, a good urban environment does not necessarily need to reduce or increase the difference between the three green values. However, by analysing the consistency, the researcher makes feasible recommendations for the distribution of greenery in relation to various specific spatial types. Distribution of the consistency of the three green values within the four regions.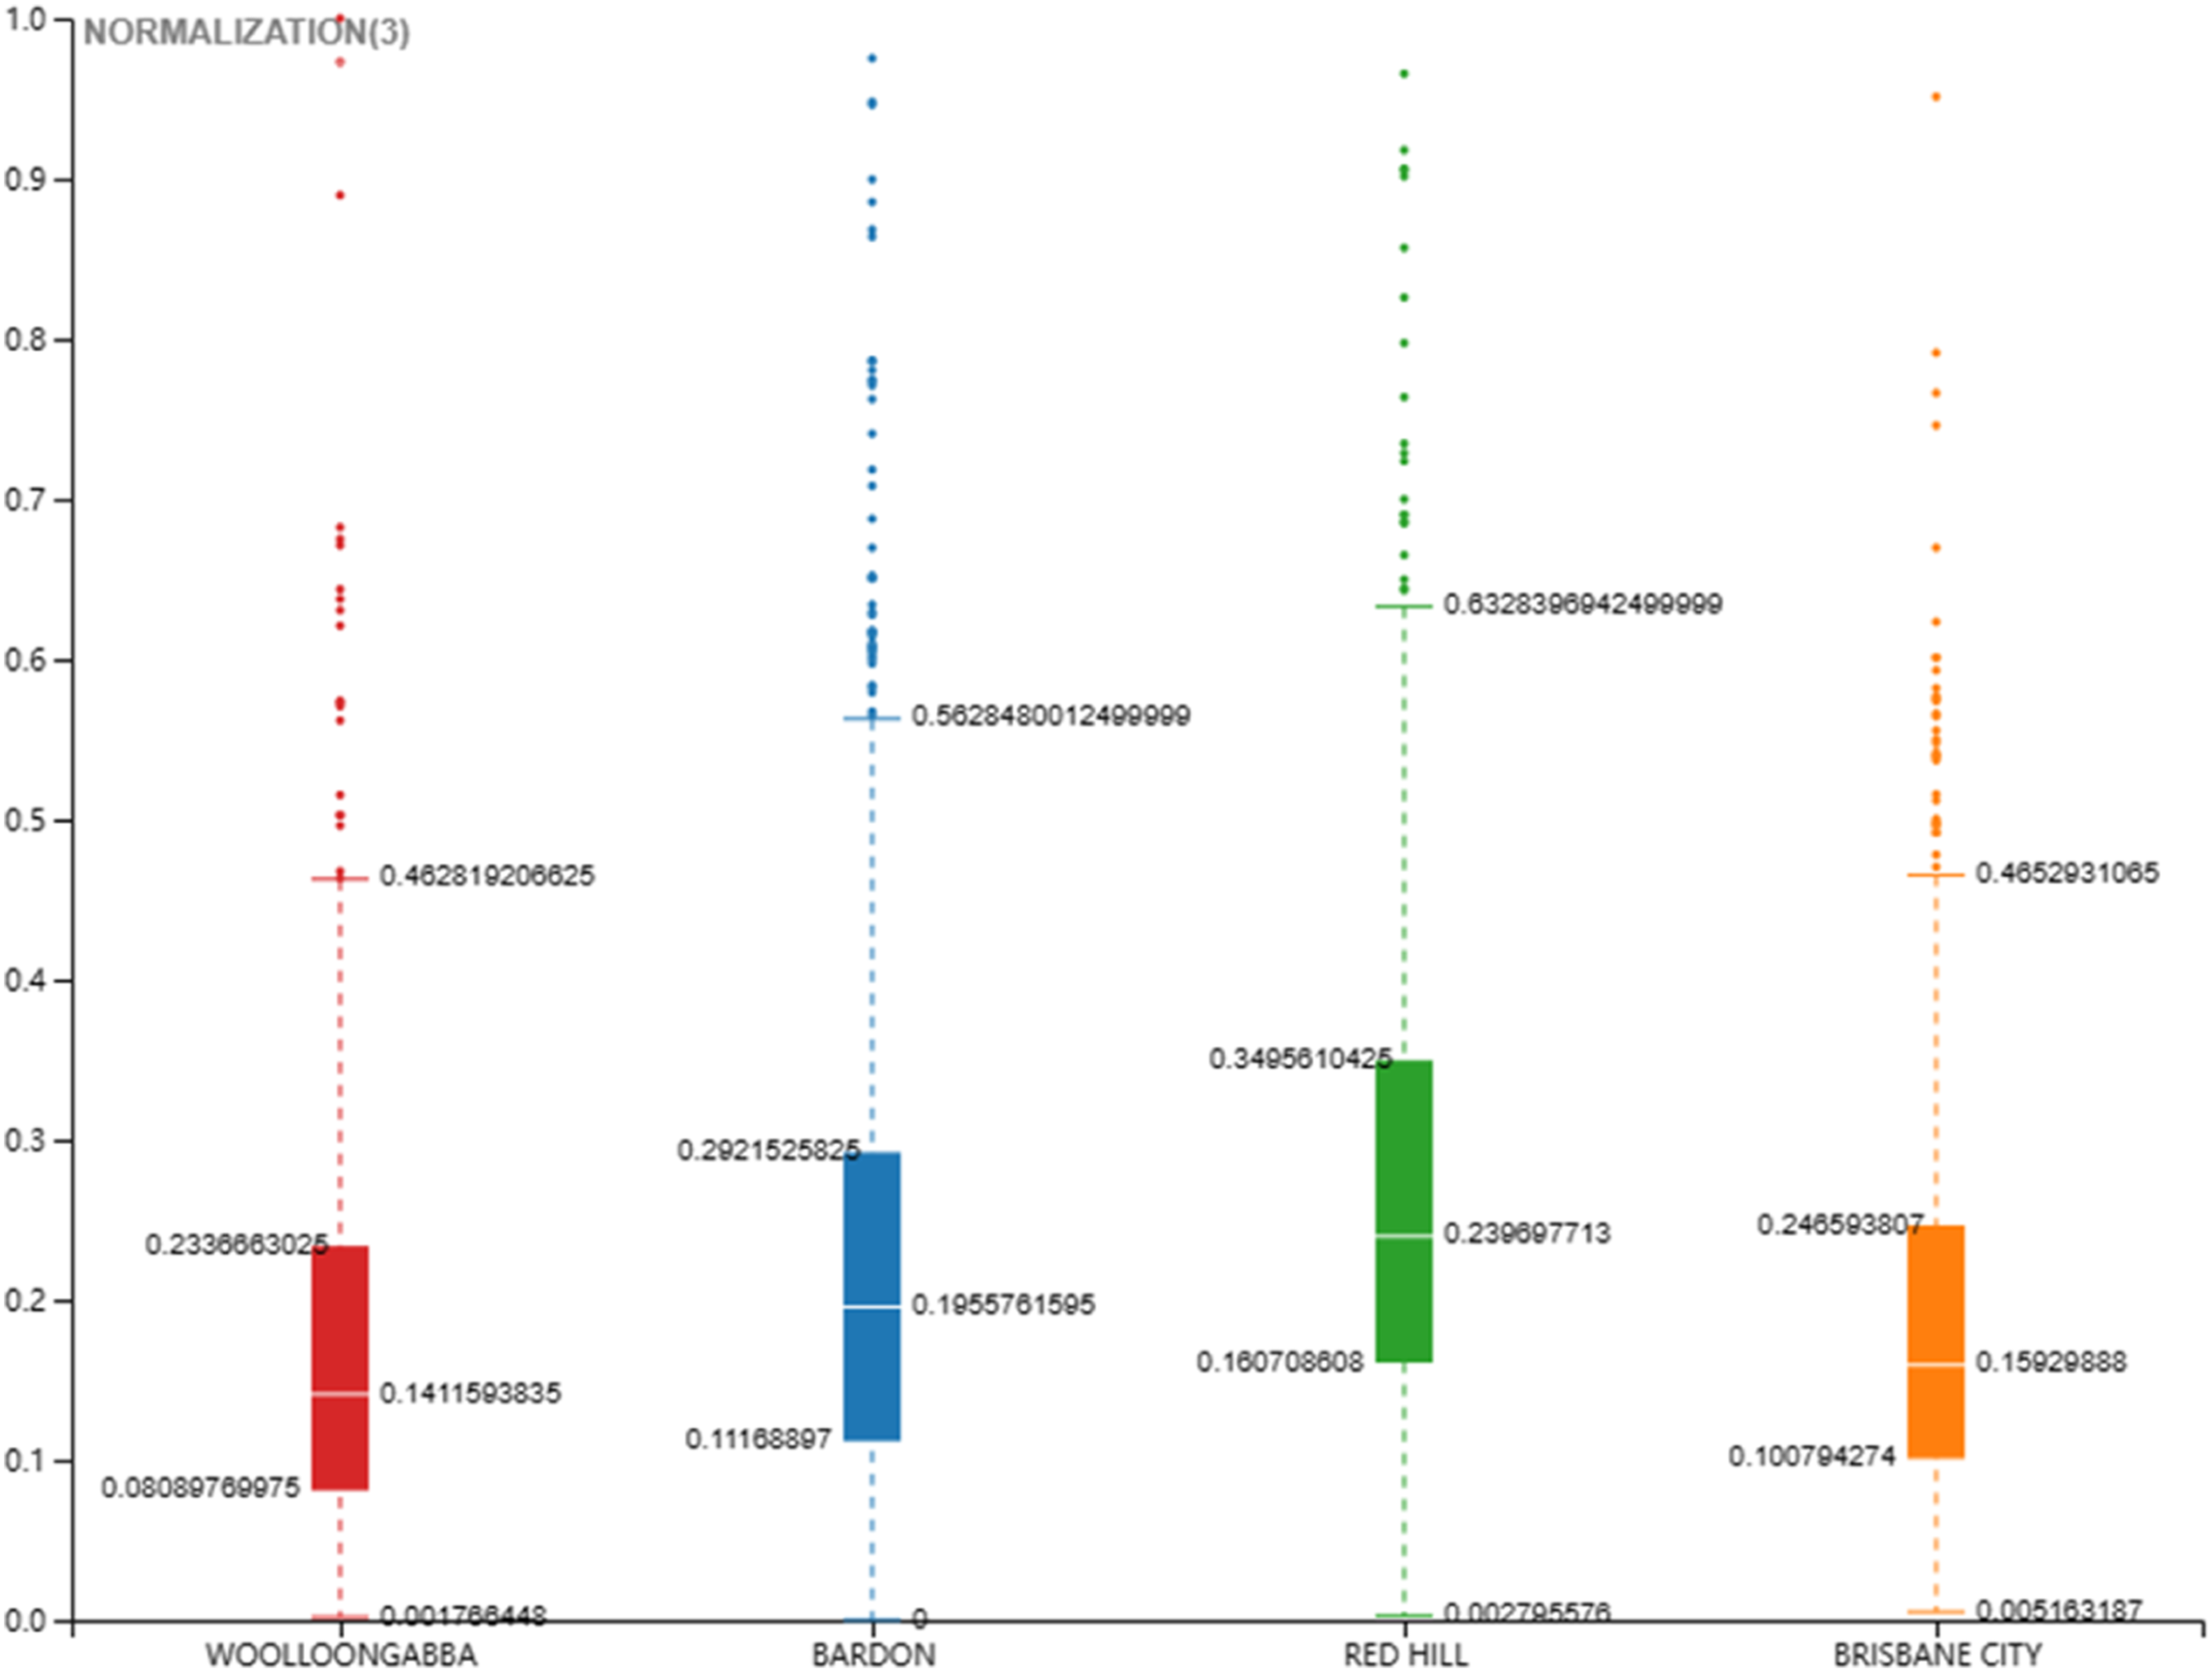
Discussion
In some cases, planned green, visual green, and perceived green show a large difference. Therefore, the study concluded that the amount of greenery is not necessarily equal to the level of ecology. Firstly, there are limitations in using planned green as an evaluation indicator of street ecology. This is because it ignores the shading in physical space. In addition, it is also limited to use only visual green as an ecological evaluation indicator. Because the ecological level also depends on factors other than greenery, for example, order and human scale both potentially affect people’s perception of ecology.
There are some limitations of our study, which are mainly about the prediction of perceptual green. The accuracy of predicting perceived green relies mainly on the reliability for the sample. The reliability of the sample is mainly attributed to three aspects: first, to have an adequate sample size; second, to match the urban function of the sample area with that of the study area; and third, to further enrich the physical variables needed for prediction. For example, the distinction between forests and street trees was mentioned in the study. Fourth, the time of day, season, and weather when GSV images were taken will affect the results. Brisbane is located in a subtropical coastal area, and the vegetation does not have distinct seasons. However, when choosing a region with higher latitude for the study, it is necessary to pay attention to the effect of season on plants. Therefore, in the future, we will continue to expand the sample size and also use functionally matched samples for prediction, and also improve the computer analysis technology so as to obtain richer physical information from the pictures for prediction.
Conclusion
This study defines three ecological evaluation metrics and quantifies them with the help of computer analysis of GSV. This study then analyzes the characteristics of the three types of green from three aspects. First, by analysing the points where visual green is low but planned green is high, the problem of greenery not being visible due to physical shading is identified. Second, by analysing the factors related to perceived green in addition to visual green, it was found that orderliness and human scale factors showed different degrees of correlation with perceived green in different regions, and further elucidated the spatial characteristics behind the data. Third, based on the statistics of the values of planning green, visual green, and perceived green, this study summarizes the areas with high and low consistency among the three, and attempts to clarify the reasons for the differences with the help of the study of spatial typology.
Footnotes
Declaration of conflicting interests
The author(s) declared no potential conflicts of interest with respect to the research, authorship, and/or publication of this article.
Funding
The author(s) received no financial support for the research, authorship, and/or publication of this article.