
Abstract
Prison climate surveys are uniquely positioned to identify how the quality of prison life differs both within and between institutions. However, much of this comparative potential remains unrealized, in part because of insufficient evidence that existing survey instruments are suitable for use in different contexts and that survey data can be reliably compared across contexts. In this paper, we explore the suitability of the Prison Climate Questionnaire (PCQ), originally developed in the Netherlands (NL), for use in the USA by assessing its factor structure, reliability, construct validity, and criterion validity using survey data from Pennsylvania (N = 632). We compare our findings with previously published psychometric results from the NL. Results of psychometric analyses show several striking similarities between the two countries, pointing to areas where the survey might be improved. While the PCQ shows potential for stand-alone use in the USA, further work would be required to use the tool in explicitly comparative research. We draw lessons from this collaboration to inform future efforts to develop standardized prison climate surveys more suitable for comparative analyses of prison climate in Europe and beyond.
Introduction
Correctional environments can vary greatly in terms of their quality of life. People who have spent time in prison can often provide vivid descriptions of the meaningful differences across and within institutions. Differences in what it means to ‘live’ in a prison are likely even greater between countries. How do correctional environments differ in the eyes of incarcerated individuals? Over the past 50 years, researchers have administered surveys designed to measure constructs such as the ‘quality of prison life’ (Liebling and Arnold, 2004), ‘prison climate’ (e.g., Bosma et al., 2020; Schalast et al., 2008; van der Helm et al., 2011), ‘correctional environments’ (Moos, 1974), and ‘prison performance’ (Camp et al., 2002) to shed light on this question. While the constructs measured by these surveys have been defined in different ways, these surveys all employ composite scales to measure dimensions of the social and/or physical prison environment as experienced by incarcerated people, such as safety, personal relationships, and access to support and meaningful activity. Hereafter, we will use the term ‘prison climate research’ to refer to the body of work that is based on these surveys. 1
Prison climate research has typically focused on three main empirical inquiries. First, researchers have sought to document and describe the first-hand experiences of people who live or work in prison. This type of inquiry has both theoretical and ethical underpinnings: the scientific study of the inner life of totalitarian institutions has inspired criminological inquiry for centuries, and international human rights bodies continually stress the importance of how people deprived of their liberty are treated (Bouloukos and Dammann, 2001; van Zyl Smit, 2010). Second, prison climate research has compared prison climates across institutions, places, and times. Researchers have used prison climate instruments to compare prisons either at the aggregate level (Auty and Liebling, 2020; Liebling and Arnold, 2004; van Ginneken and Nieuwbeerta, 2020) or along specific dimensions such as the prison size (Johnsen and Granheim, 2011), prison security level (Long et al., 2011), whether prisons are publicly or privately run (Armstrong and MacKenzie, 2003; Camp et al., 2002; Crewe et al., 2015), or whether they are therapeutically oriented (Day et al., 2012; Schalast and Laan, 2017). Researchers have also started to compare scores on climate survey measures between countries (Crewe et al., 2022; Mjåland et al., 2021; Neubacher et al., 2021; Ross et al., 2008). Third, prison climate research has sought to better understand how experiences of prison environments relate to in-prison and post-release outcomes. For instance, better institutional climates are thought to be related to the effectiveness of health and educational programs in prison and to affect both in-prison and post-release outcomes ranging from misconduct to well-being and recidivism (e.g., Auty and Liebling, 2020, 2024; Gonçalves et al., 2016; Harding, 2014; Schubert et al., 2012; van Ginneken and Palmen, 2022).
Prison climate research relies on the fundamental assumption that the survey scales we use are valid and reliable measures of the underlying latent constructs they intend to capture. In technical terms, this implies that data obtained when administering a given survey to different groups of respondents—in different contexts or at different times—demonstrate sound psychometric properties across administrations (i.e., internal consistency, factor structure, construct validity, and reliability). Such psychometric properties are best established through an iterative process, where items in an instrument are tested, adapted, and retested until the instrument properties are stable (Fauskanger et al., 2012; Smith, 2005). In practice, most existing prison climate surveys have undergone limited psychometric testing (Tonkin, 2016). If we wish to compare scores across contexts or groups, we also need formal evidence of measurement invariance. That is, we want to make sure that a comparison of scores across groups of respondents reflects true differences rather than measurement differences (Leitgöb et al., 2023). Like much comparative research in the social sciences, prison climate studies routinely compare scores across groups yet rarely formally test for measurement invariance (Leitgöb et al., 2023). 2 The fact that prison climate surveys tend to be designed for one context and then adapted to others—instead of being explicitly designed for comparative purposes—also means that they are less likely to achieve measurement invariance in practice (Fitzgerald and Jowell, 2010; Harkness, 2011; Leitgöb et al., 2023).
In this study, we add to the still nascent evidence on the psychometric properties of the Prison Climate Questionnaire (PCQ), a relatively new prison climate survey that was first used in the Netherlands (NL) in 2016 (Beijersbergen, 2016). The instrument has since been administered repeatedly to the full Dutch prison population, 3 and several groups of researchers have started to administer it to prison populations in other countries in Europe and beyond (Johnsen et al., 2023; Maes et al., 2023; Ouaknine, 2023). To date, however, the psychometric properties of the PCQ have only been tested once, using data from the PCQ's first administration in the NL in 2017 (Bosma et al., 2020). We aim to make three main contributions to the literature. First, we conduct a psychometric analysis of the PCQ using data collected in one prison in Pennsylvania (PA) (USA) (N = 632) and assess the instrument's suitability for use in this context. Second, we compare the results from PA to previously published psychometric results from the NL and draw on both shared and divergent psychometric patterns in the two countries to identify areas where the instrument can be improved. Third and finally, we link specific observations from this exercise to general guidance on survey design from the comparative survey literature. We hope that these insights might be used to inform the future development of standardized prison climate surveys more suitable for comparative analyses of prison climate in Europe and beyond.
Prison climate instruments, psychometric properties, and the PCQ
In the 1970s and 1980s, amidst early enthusiasm for the study of the human organizational environment (Schneider et al., 2013), researchers developed measures to assess the ‘climate’ in prisons through surveys administered to incarcerated individuals (Moos, 1974; Saylor, 1984; Wright, 1985). One of the pioneering prison climate instruments, the Correctional Institutions Environment Scale (CIES) (Moos, 1974), was widely used until the early 2000s but has been largely abandoned in recent years after researchers flagged concerns about its psychometric properties (Liebling and Arnold, 2004; Tonkin, 2016).
In the half century that has passed since the first prison climate instrument was developed, researchers have developed several closely related survey instruments. 4 Among all available instruments, the Measuring Quality of Prison Life (MQPL) instrument (Liebling et al., 2012) is one of the most widely used. Importantly, the MQPL was not conceptualized as a psychometric instrument, and research using or drawing on the MQPL has typically emphasized ‘fused’ approaches in which psychometric analysis is used as a supportive tool alongside qualitative approaches (Crewe et al., 2022; Neubacher et al., 2021). The instrument has been revised and adapted to suit the countries and prisons in which it is used (Neubacher et al., 2021). This makes the MQPL well positioned to capture local processes and meanings but reduces comparability across survey administrations.
In 2016, a review article by Matthew Tonkin identified 12 questionnaire-based measures of social climate, including the CIES, the MQPL, and 10 others. Tonkin highlighted that while prison climate instruments were routinely used by both researchers and practitioners, the psychometric properties of most of these prison climate instruments had not been sufficiently tested to ‘justify their routine use’ (Tonkin, 2016: 1376). Tonkin's (2016) review identified the Essen Climate Evaluation Schema (EssenCES) (Schalast et al., 2008) as the instrument with the most consistent empirical support for its psychometric qualities. 5 As a short instrument of 15 items, the EssenCES assesses the social climate in prison: the instrument's three scales measure whether the climate is perceived as safe, supportive, and cohesive. Its items have been adjusted following psychometric testing and revised versions of the instrument have been retested in subsequent studies in a range of countries and populations (Day et al., 2011, 2012; Howells et al., 2009; Schalast and Laan, 2017; Siess and Schalast, 2017; Tonkin et al., 2012). The EssenCES was originally designed for forensic psychiatric wards, but it has been adapted for general prison populations, and there is evidence to suggest that the instrument's psychometric properties are stable across both these settings (Tonkin et al., 2012).
The PCQ was designed in 2016 after an extensive review of the literature on prison climate, including Tonkin's then-recent review (Beijersbergen, 2016), before it was further developed in 2017 (Bosma et al., 2020). The survey forms part of the Dutch Life in Custody (LIC) study, which is led by researchers at Leiden University with support from the Dutch Custodial Institutions Agency (in Dutch, the Dienst Justitiële Inrichtingen). The survey's official aim is to help the prison service monitor prison performance as well as to facilitate academic research on prison climate (Bosma et al., 2020). Three of the scales in the PCQ—prisoner relationships, prisoner–staff relationships, and safety—are closely related to the EssenCES’ social climate dimensions. In addition, the PCQ also captures incarcerated people's perceptions and experience of other conditions in which they are confined, including individuals’ access to and satisfaction with food, visits, healthcare, and rehabilitative and recreation activities. The scope of the PCQ more closely resembles that of the MQPL. Unlike the MQPL, however, it is explicitly designed to be a psychometric instrument and uses little local, context-specific vernacular. 6
The PCQ covers six primary domains of prison climate that are measured using 64 items in 14 scales. Each of the scales is composed of 3–8 items that are rated on a five-point Likert scale, with responses ranging from ‘strongly disagree’ to ‘strongly agree’. The conceptual background to the six domains in the survey—relationships in prison, safety and order, contact with the outside world, facilities (cell, shop, complaints), meaningful activities, and autonomy—is described in detail in van Ginneken et al. (2018). 7 Scale items are presented in blocks to limit the demand the survey places on an individual's reading capacity. A full list of scales and associated items in the prison climate scales of the original PCQ are provided in the second column of Table A1. 8
Prison environments in the NL and PA
Before we address the two survey administrations in the NL and PA in more detail, we discuss some of the broader differences in prison conditions and correctional policy in the NL and PA that pertain most directly to our discussion of prison climate.
With 17.5 million inhabitants, the population of the NL is only slightly larger than that of the American state of PA, which has a population of 13 million. 9 With an incarceration rate of 53.9 per 100,000 individuals in 2021, the NL had one of the lowest incarceration rates in Western Europe (Aebi et al., 2022). While annual estimates of PA's jail, prison, and federal populations are harder to obtain, available data suggest that PA's incarceration rate is at least 10 times that of the NL. 10
Not only does the NL send fewer individuals to prison, but the country also imprisons people for shorter periods of time. In PA's state prisons, 5336 individuals, or 16.8% of the total prison population, are serving a sentence of natural life (Kuba, 2021). The NL currently has about 43 life-sentenced incarcerated individuals, which corresponds to far less than 1% of its total prison population. In the NL, less than 10% of convicted individuals leaving prison have spent more than a year inside, and less than 5% have spent more than 2 years incarcerated. In contrast, it is the norm for individuals leaving a State Prison in PA to have spent more than 2 years behind bars. 11
Prison conditions in the NL and PA differ in numerous ways. PA's 23 State Correctional Institutions (SCIs) have an official capacity of 43,957 beds, varying from around 1000 to over 3000 beds per institution. 12 In total, the NL’s 26 penitentiary institutions have around 8000 beds, varying from around 200 to 1000 beds per institution. Living units in PA's SCIs are generally also much larger than in the NL, with some housing almost 300 individuals. 13 The ratio of staff to incarcerated people varies but having one officer supervising 120 people on a single housing unit is not uncommon. In the NL, most units hold no more than 30 individuals and are staffed by at least two penitentiary workers.
In PA SCIs, double celling is the default among the general population; only individuals with select health conditions or security needs are allocated single cells. In contrast, most people in Dutch prisons live in their own cell. 14 Where incarcerated individuals in the NL can wear their own clothes, correctional uniforms must be worn in PA. In both the NL and PA, incarcerated individuals are generally allowed four in-person visits a month for a minimum of 1 hour each, with physical contact limited to a brief hug at the start and conclusion of the visit. Virtual visits are generally available when facility-wide scheduling permits. On average, incarcerated individuals in PA are allowed more time out of their cells, with many incarcerated people locked in their cells only at night and for the twice-daily headcount, whereas individuals in the NL are routinely locked up from 5 p.m. to 7:30 a.m. 15 Furthermore, the resocialization programming in both PA and Dutch detention institutions includes drug and alcohol rehabilitation programming, education, work, cognitive behavioral therapy, and vocational training, but the specifics of these programs differ for different groups of detainees and across both countries.
While prisons in the two countries share many of the fundamental features of prison life, the substantial differences in correctional contexts mean that it is far from given that a survey instrument designed for the NL would have good psychometric properties in PA.
Administrations of the PCQ in the NL and PA
Administration in the NL (2017)
The PCQ was first used in the LIC study in the NL in 2017, when the survey was administered to the full Dutch prison population, including both men and women, pretrial detainees and convicted individuals, and regimes at all security levels, housed in 28 prisons and remand centers. 16 Incarcerated individuals were handed a paper and pencil version of the questionnaire, and research assistants were available to help fill out the questionnaire where requested. 17 A sample of 4538 respondents were surveyed, amounting to 64% of the Dutch prison population.
Bosma et al. (2020) published results from a psychometric analysis of the prison climate scales based on the LIC study held in 2017. They concluded that the PCQ's factor structure, reliability, and validity were satisfactory and mostly exceeded minimum expectations. The prison climate scales correlated in a theoretically conceivable manner, which provided evidence of construct validity. 18 The analyses also verified that the data were, for the most part, structured as expected. In three cases, the factor structure differed from the originally envisioned scale structure: the procedural justice and staff–prisoner scales loaded on the same factor, items from the reintegration and meaningful activities scales loaded onto the same factor, and two items (‘I enjoy receiving visits’ and ‘after receiving a visit, I feel good’) split off from other items on the visits scale. In an analysis of criterion validity, the authors show that the prison climate scales explain a substantial share of the variation in overall satisfaction with the institution. Notably, however, the prison climate scales explained remarkably little variation in experienced sentence severity. It is an open empirical question whether the psychometric patterns observed in the Dutch analyses are particular to the 2017 data collection in the NL or whether similar psychometric patterns would be observed in different contexts or at different times. To shed light on this question, we now turn our attention to a 2022 administration of the PCQ in PA.
Administration in PA, USA (2022)
In early 2022, a PA-based research team adapted the PCQ for use in a PA SCI: a medium-security institution for men. The facility was built in the 1990s, has the capacity to house just over 1100 individuals, and is generally known for its relatively extensive program offering. At the time of survey administration, the institution held just under 1000 individuals, spread across 14 housing units which differed in terms of staffing, target population, and structural layout. ‘General population’ units had two men living in each cell, typically in units of 128 beds. ‘Therapeutic communities’ provided residents with specialized drug programming in smaller units of 64 beds (Welsh, 2007). The ‘recovery unit’ housed men who had chosen to continue with a voluntary self-help program after completing their mandatory drug programming. Residents on the ‘transitional housing unit’ were to receive reentry-focused support. Men housed on the ‘honor block’ had earned access to additional privileges through good behavior, whereas privileges were reigned in on the ‘restrictive housing unit’ that was used for disciplinary purposes and for security-focused segregation. This prison, therefore, provided a diverse set of environments in which to test the psychometric properties of the PCQ within one American correctional facility.
The PA research team aimed to keep changes to the prison climate scales in the PCQ to a minimum in the interest of comparability. This, overall, was relatively straightforward: because the PCQ had previously been translated to English for non-Dutch speakers incarcerated in the NL, no translation from Dutch was necessary; the PCQ's items were all relevant to prison climate in the PA context; and the short and simple wording of the items meant that few changes were needed to fit local vernacular. Nevertheless, a few minor changes were made to ensure relevance to the PA context and to meet the wider research needs of the PA research team. First, in the original PCQ, items on the scales for staff–prisoner relationships and procedural justice focus on a resident's unit, whereas other items focus on the institution more generally. In the PA version of the survey, three additional scales were adapted to focus on an individual's living unit. 19 Second, some items were repositioned to facilitate survey readability. Third, the ‘settlement of complaints’ scale was replaced with a new set of items reflecting the functioning of the PA grievance system. 20 Note that because the complaints scale was substantively changed, this scale is left out of the analysis in this paper. This article thus focuses on 13 out of the 14 original prison climate scales in the PCQ. 21
A draft version of the adapted PCQ was tested with 12 incarcerated people residing on one unit in the prison. Based on feedback from these individuals, words were changed in a few places without altering the item's substantive meaning, for example, by changing ‘pastoral care’ to ‘religious services’. Most notably, the term ‘prisoners’ was replaced with ‘incarcerated people’. A full list of items in the original PCQ, alongside the adapted items and item positions, is provided in Table A1.
In the spring of 2022, researchers went to each unit in the late afternoon, while the majority of incarcerated people were in their cells to be counted. Every individual on the unit at that time was given a copy of the pen-and-paper instrument to complete while in their cell. For the small number of individuals who were working or at a visit during count time, surveys were left with cellmates, and their surveys were collected the next day. Participation was voluntary, and nominal compensation was provided to all respondents for their time, irrespective of survey completeness. Individuals provided their ID number on the survey to enable the payment of compensation and to facilitate administrative data linking. 22
Data and methods
Data sample (PA, USA 2022)
A total of 641 respondents completed a survey in the PA SCI, amounting to a 66% response rate. 23 Three respondents left all prison climate items on the survey blank. Another seven individuals had more than 10 missing answers. We drop these 10 individuals from all analyses, leaving us with a sample of 631 respondents. On 23 out of the 64 items in the PCQ, incarcerated individuals were provided with the option to indicate that they had ‘no opinion’, 24 for example, if they had no experience (yet) with the services the items pertained to. Forty-six percent of respondents used a ‘no opinion’ answer at least once. 25 Less than 1% of the data is missing in the sense that respondents provided no answer. Table A2 provides an overview of both missing data and ‘no opinion’ answers for each item on the questionnaire.
Survey data were linked to administrative data for all but 12 individuals who chose to participate anonymously. Table 1 lists sample characteristics from the PA respondents for whom administrative data were obtained, alongside comparable characteristics for the Dutch sample, where available. 26 Respondents in the PA sample differed from those of the Dutch sample on almost all characteristics except age. Most notably, but unsurprisingly given the differences in the criminal justice systems described above, respondents in PA had, on average, served much more time in prison at the time of completing the survey (7.81 years) than individuals in the NL (0.99 years). Even after excluding life-sentenced individuals from the PA sample, the disparity in time served remains large, at 5 years. The types of offenses for which individuals were detained differ in several ways. PA respondents were, for example, less likely to be in prison for property offenses than Dutch respondents (11% vs. 30%), and more likely to be in prison for violent offenses (53% vs. 42%). These differences at least in part reflect the fact that the Dutch population includes individuals in pretrial detention. PA respondents are also much more likely to be native-born (94% vs. 65%).
Survey respondent and population characteristics.
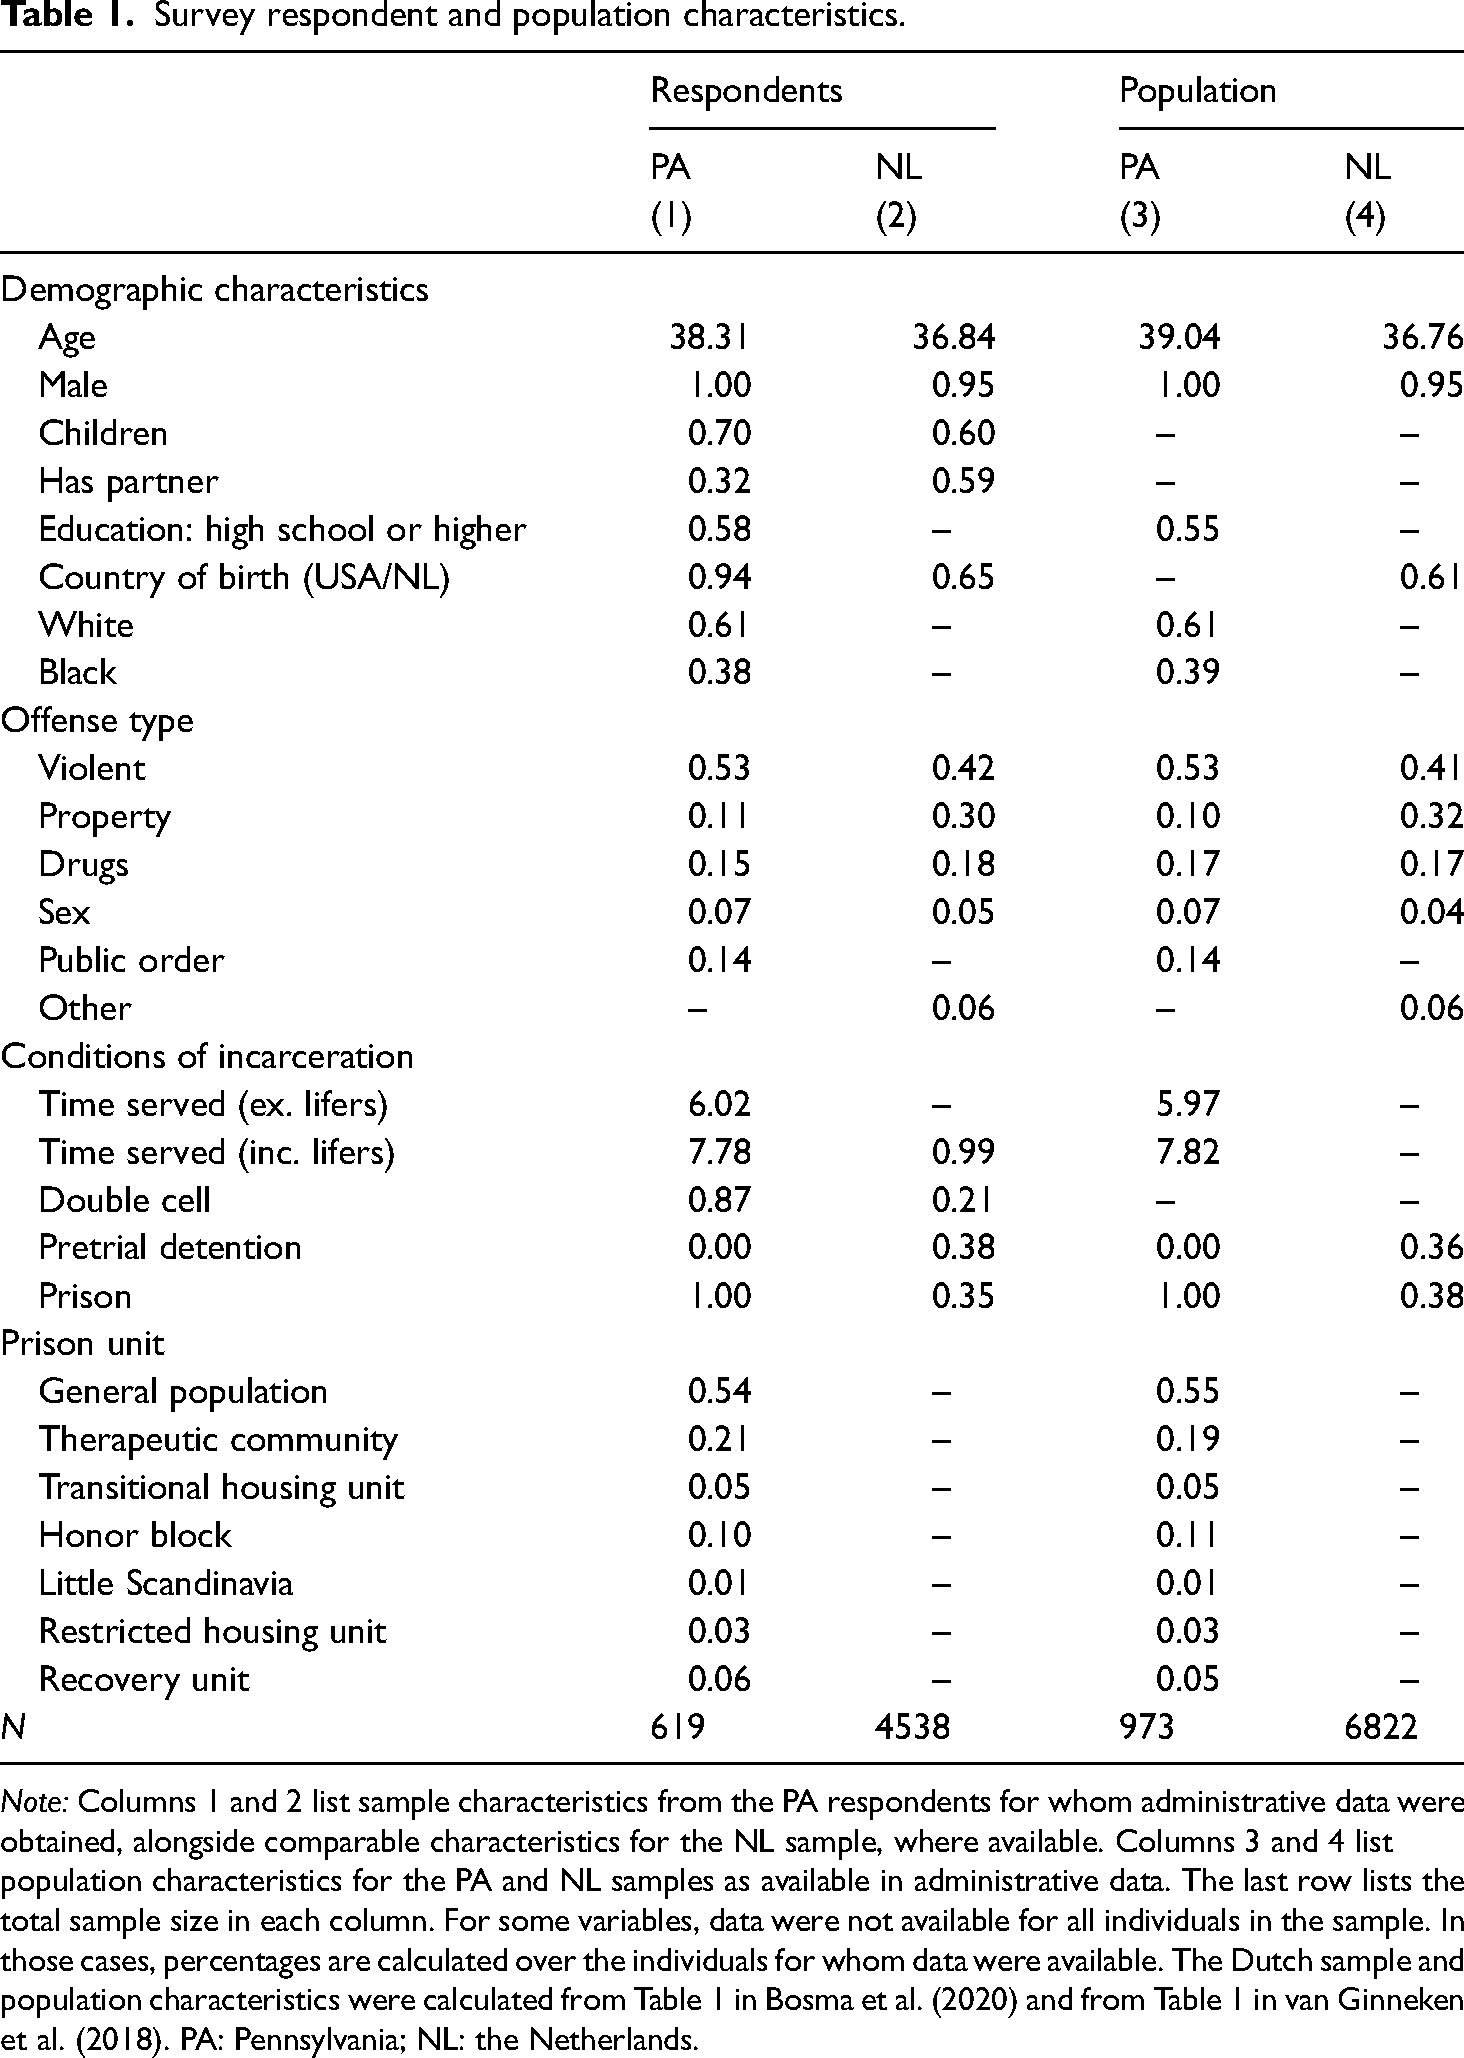
Note: Columns 1 and 2 list sample characteristics from the PA respondents for whom administrative data were obtained, alongside comparable characteristics for the NL sample, where available. Columns 3 and 4 list population characteristics for the PA and NL samples as available in administrative data. The last row lists the total sample size in each column. For some variables, data were not available for all individuals in the sample. In those cases, percentages are calculated over the individuals for whom data were available. The Dutch sample and population characteristics were calculated from Table 1 in Bosma et al. (2020) and from Table 1 in van Ginneken et al. (2018). PA: Pennsylvania; NL: the Netherlands.
Statistical analyses
We conduct a reliability analysis, construct validity analysis, criterion validity analysis, and exploratory factor analysis on the PCQ data from PA. Our psychometric analyses mirror the analyses conducted in Bosma et al. (2020) wherever possible to facilitate comparisons across the two contexts. 27
The reliability of an instrument refers to its measurement precision and is generally thought of as a ratio of true score variance to observed score variance (Furr, 2017). One way to examine test reliability is by examining whether the items within a scale that are expected to measure the same construct in fact produce similar scores. The reliability of a test is then measured as the correlation between two parallel tests. When dealing with data from a single survey wave, researchers tend to think of scores on half the items of the scale as ‘parallel’ to the items on the other half of the scale. The intuition is that if both halves of the scale measure the same construct, then scores on one-half of the items should correlate highly with scores on the other half (De Vet et al., 2017). We report 95% confidence intervals for Spearman–Brown (SB) corrected split-half reliability estimates based on all possible such splits for all scales consisting of four or more items (Revelle and Condon, 2018). We also report Cronbach's alpha (CA), which estimates a lower-bound estimate of reliability based on characteristics of the covariances of the items in a scale. 28
Construct validity refers to the extent to which a measure adequately assesses the construct it purports to assess (Nunnally and Bernstein, 1994). 29 We assess the extent to which associations between scales in the PCQ match theoretical predictions about their expected associations. To do so, we estimate an interscale correlation matrix based on the correlations of scales formed from the covariance matrix of items, which we correct for attenuation. In addition, we analyze construct validity by examining differences in mean scale scores between various types of prison units.
Concurrent criterion validity refers to the extent to which a measure is empirically associated with relevant criterion variables that are assessed at the same time (Western and Rosenthal, 2003). We assess the concurrent criterion validity of the PCQ by conducting a series of linear regression analyses that examine to what extent prison climate scale scores vary with respondents’ overall satisfaction with the institution as well as with how painful they experience their current sentence to be. The latter is measured on a scale composed of three items (‘I experience my sentence as painful’, ‘My time here feels a lot like punishment’, and ‘This sentence is more painful than I anticipated’), with higher scores indicating sentences that are experienced as more painful. Overall satisfaction with the institution is measured with a single item, ‘I am satisfied with this institution’, where higher scores indicate higher satisfaction. The linear regression analyses include the prison climate scales and a range of control variables. 30
Finally, the exploratory factor analysis aims to uncover the underlying factors in the survey data. Exploratory factor analysis partitions item variance into common variance, which is accounted for by underlying latent factors, and unique variance, which is a combination of item-specific variance and random error. Mirroring Bosma et al. (2020), we use principal axis factoring and a direct OBLIMIN rotation method. Exploratory factor analyses require the researchers to specify the number of factors in the data. We obtain an estimate of the number of factors in the data through a parallel analysis procedure, which extracts factors until the eigenvalues of the real data are less than the corresponding eigenvalues of a random dataset of the same size (Hayton et al., 2004).
As discussed previously, 23 out of the 64 items in the PCQ provided respondents with a ‘no opinion’ answer option. Consequently, for the scales constructed on these items, this resulted in a relatively large proportion of ‘missing’ data. While ‘no opinion’ answer options accommodate individuals who recently arrived or have not used certain services, they can complicate psychometric analyses (Riegel et al., 2000). We use three strategies to deal with ‘missing’ data (including items where respondents chose ‘no opinion’ and items that respondents left blank). 31 First, we impute missing data based on responses to the prison climate scales and 14 supplementary items on individual service use, 32 using a random forest-based approach. Specifically, we use the MissForest algorithm, which outperforms most other imputation methods on datasets with mixed data types (Stekhoven and Buhlmann, 2012). This approach has the benefit of providing one dataset that can be used for all analyses. Second, because imputing missing data may affect results, we also run all analyses on complete cases only (N = 280), for which no data are missing. Results from this smaller subsample can, however, not necessarily be generalized to the full population (Allison, 2010). Third, we report results from a pairwise deletion approach to missing data to ensure comparability with results reported in Bosma et al. (2020). Only in the exploratory factor analysis did results differ meaningfully across these three approaches, and we therefore display them in the main text. For all other analyses, we display results based on data in which missing data were imputed. 33
Results of psychometric analyses
We discuss the results from each of the psychometric analyses discussed above in turn. We pay particular attention to similarities and divergences with the findings of Bosma et al. (2020). Where appropriate, published results from Bosma et al. (2020) are reprinted here to facilitate comparisons between the two psychometric analyses.
Reliability analyses
The results of the reliability analyses are presented in Table 2, alongside the overall mean and standard deviation for each of the scales. 34 The last column in Table 2 shows 95% confidence intervals for the SB-corrected reliability estimates. A score above 0.70 is commonly seen as acceptable reliability, and scores generally easily exceeded this threshold, although the lower-bound estimate for the satisfaction with visits scale is substantially below this at 0.54. This result is in line with observations made by Bosma et al. (2020) and likely reflects the fact that two items on the visits scale (‘I enjoy receiving visits’ and ‘after receiving a visit, I feel good’) load onto a separate factor in both analyses (see Exploratory Factor Analysis, below). The values for the CA for almost all scales used in the PA survey are good, although the high values of α (>.90) on some scales suggest that some items may be redundant and thus that the number of items on these scales could be reduced (Tavakol and Dennick, 2011).
Descriptive statistics for prison climate scales and reliability analysis.
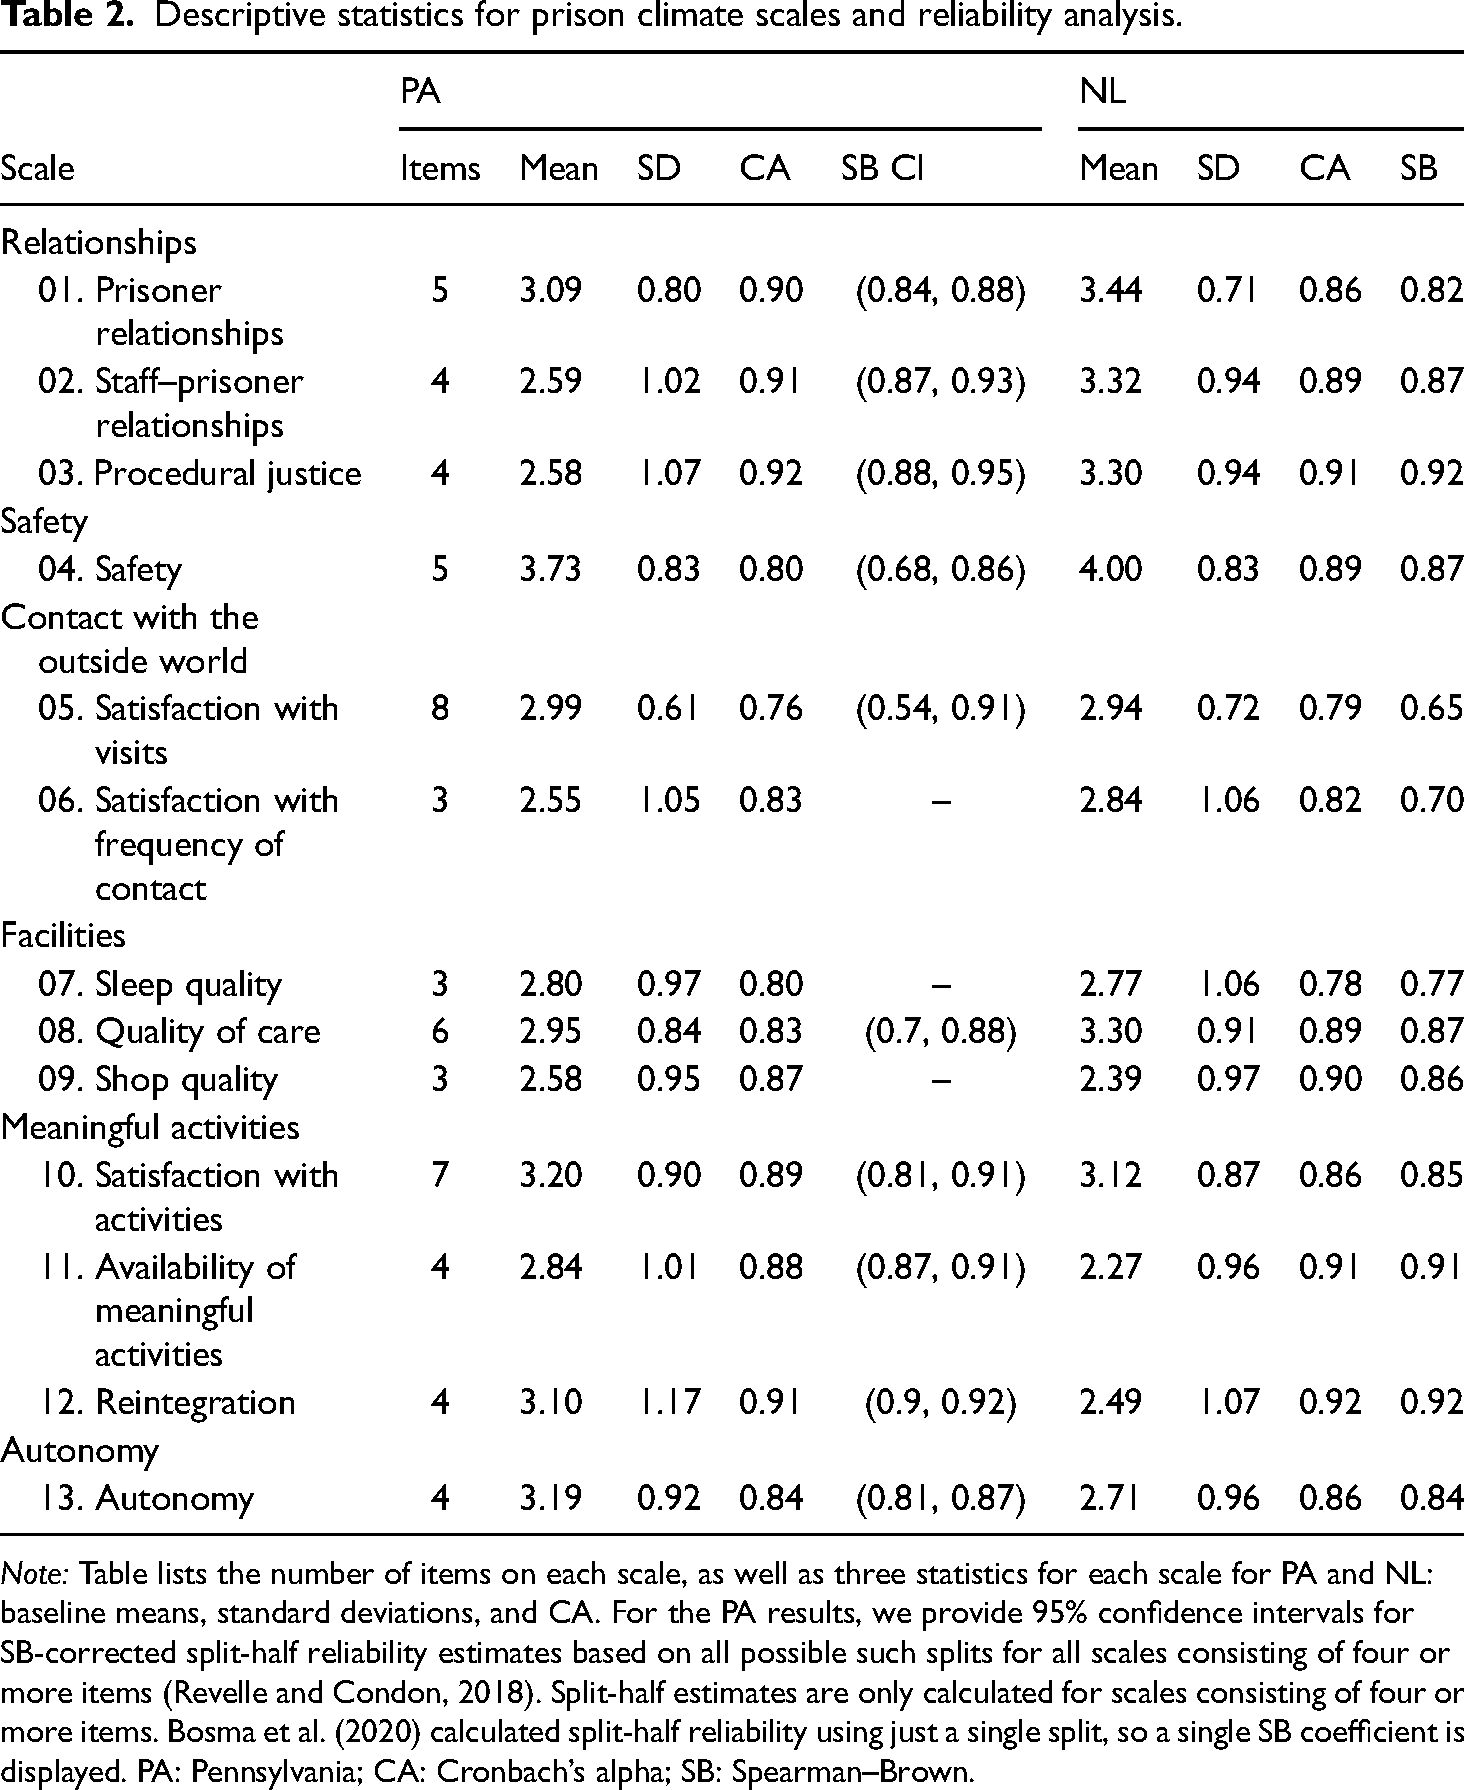
Note: Table lists the number of items on each scale, as well as three statistics for each scale for PA and NL: baseline means, standard deviations, and CA. For the PA results, we provide 95% confidence intervals for SB-corrected split-half reliability estimates based on all possible such splits for all scales consisting of four or more items (Revelle and Condon, 2018). Split-half estimates are only calculated for scales consisting of four or more items. Bosma et al. (2020) calculated split-half reliability using just a single split, so a single SB coefficient is displayed. PA: Pennsylvania; CA: Cronbach’s alpha; SB: Spearman–Brown.
Construct validity analyses
Results of the construct validity analyses show that the observed associations between the prison climate scales are largely in line with theoretical expectations. The interscale correlation matrix, as presented in Table 3, 35 shows that all scales correlate positively. The scales on staff–prisoner relationships, procedural justice, the availability of meaningful activities, reintegration, and autonomy all correlate highly with each other. We note that the staff–prisoner relationships and procedural justice scales are nearly perfectly correlated, a finding that is in line with the fact that items on this scale map onto the same factor (see Explanatory factor analysis, below). Notably, the safety scale is not strongly correlated with any other scale, including scales with which one would theoretically expect a correlation, such as prisoner relationships and staff–prisoner relationships. Overall, these results closely mirror the relative magnitude of the associations found by Bosma et al. (2020).
Interscale correlation matrix.
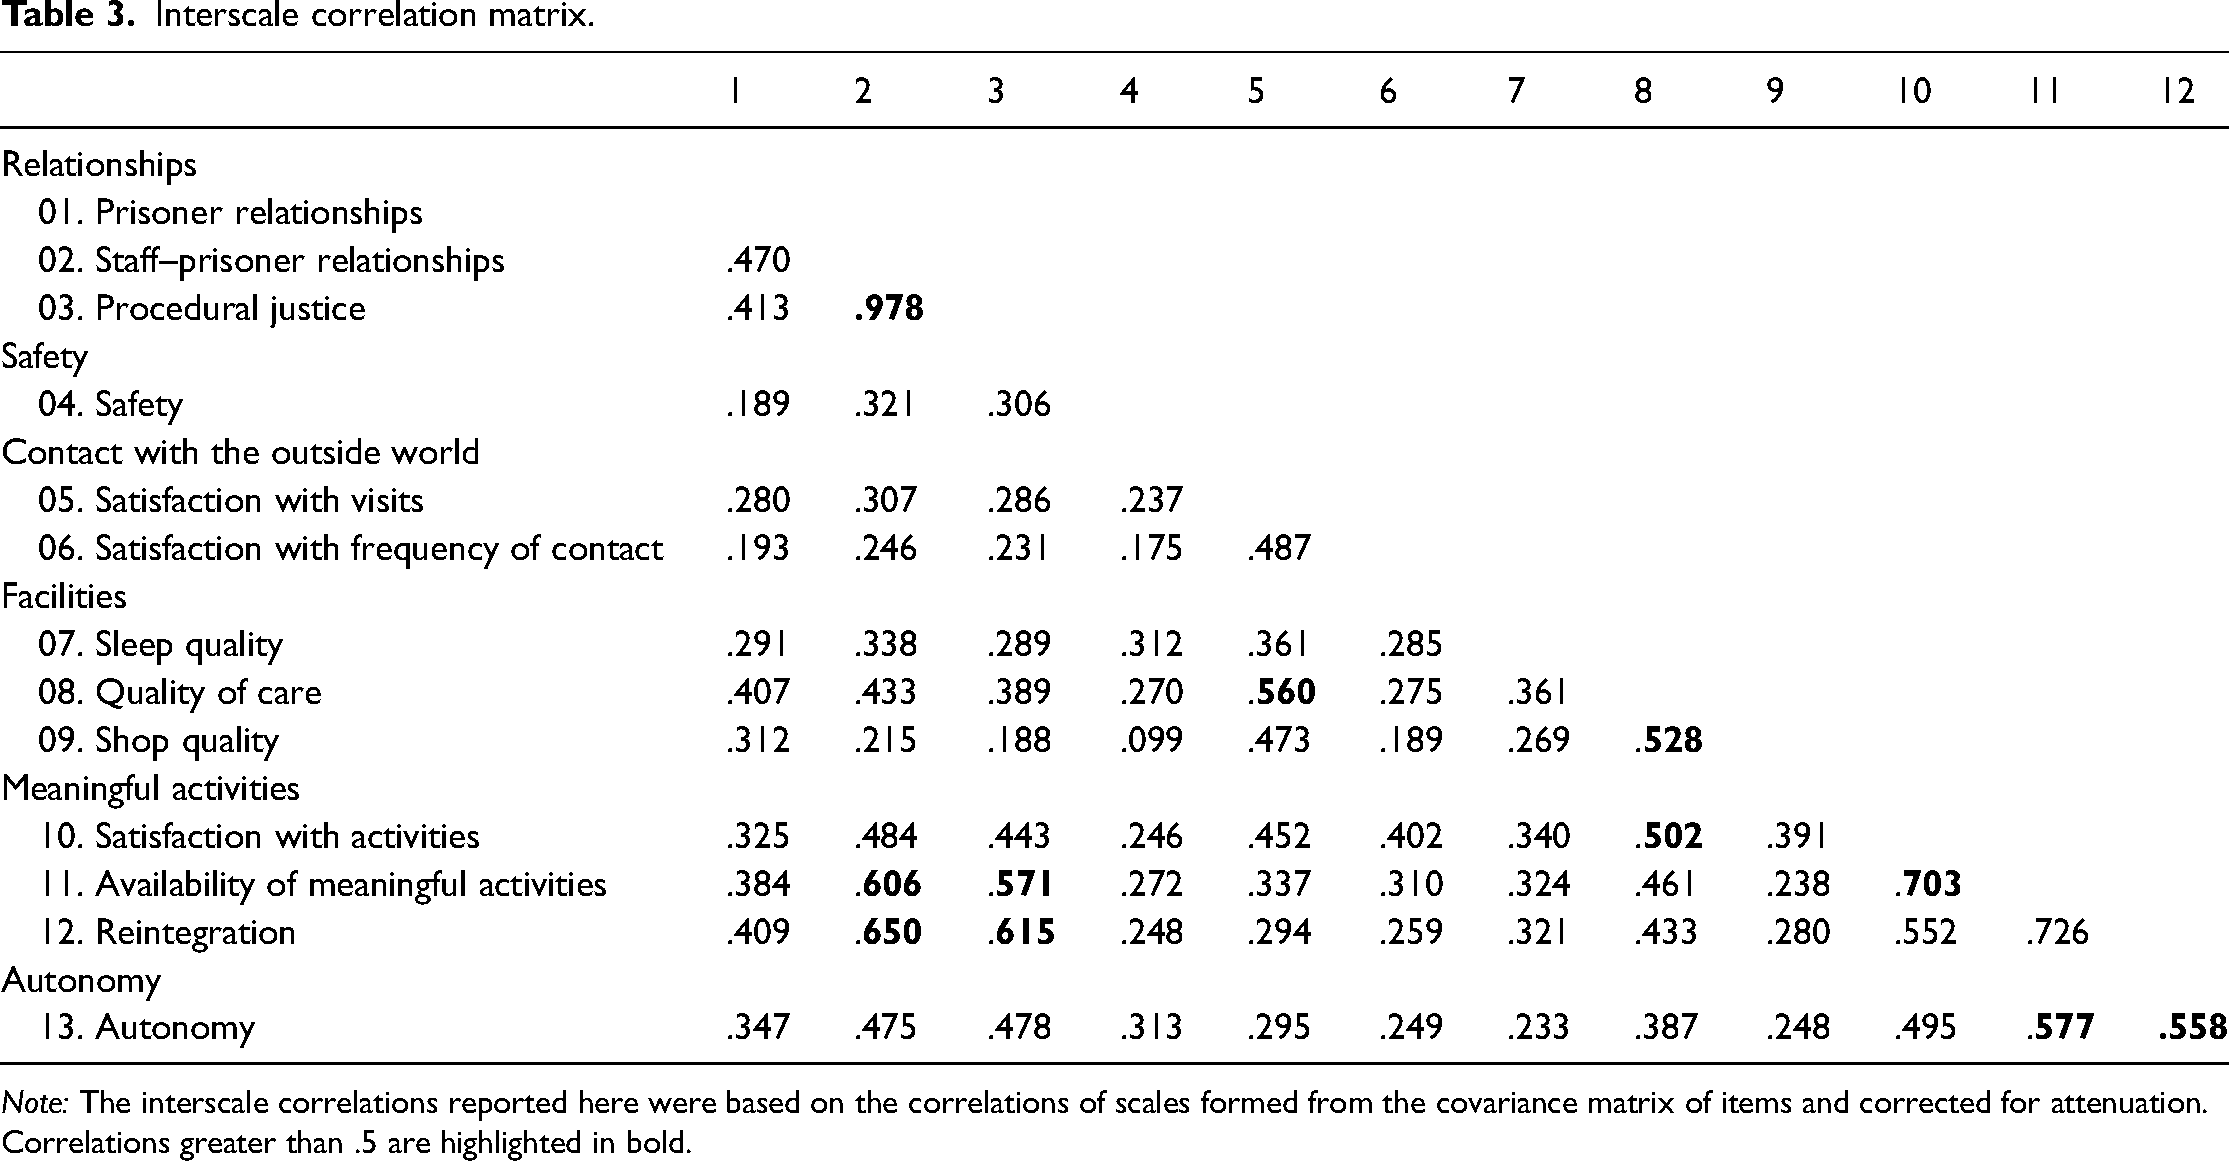
Note: The interscale correlations reported here were based on the correlations of scales formed from the covariance matrix of items and corrected for attenuation. Correlations greater than .5 are highlighted in bold.
Differences in mean PCQ scale scores between various types of prison units, presented in Table 4, provide further evidence of construct validity. As expected, mean scale scores tend to vary positively with the level of privileges afforded on a unit. 36 Overall, the lowest scores are found for the restrictive housing unit, where individuals are housed in relative isolation as a sanction or during an active investigation for serious rule violations. Scores are highest for the honor block, which houses residents who have earned additional privileges. The greatest differences between units are found in the autonomy, relationships, and activities domains. We observe less variation across units in the facilities domain and the domain that concerns contact with the outside world. This too is in line with expectations because scales in these domains concern centralized services, such as visits and medical care, which are the same for residents across housing units. It is notable that, like in the Dutch results, there is little variation in feelings of safety across units. 37
Differences in mean scores across units.
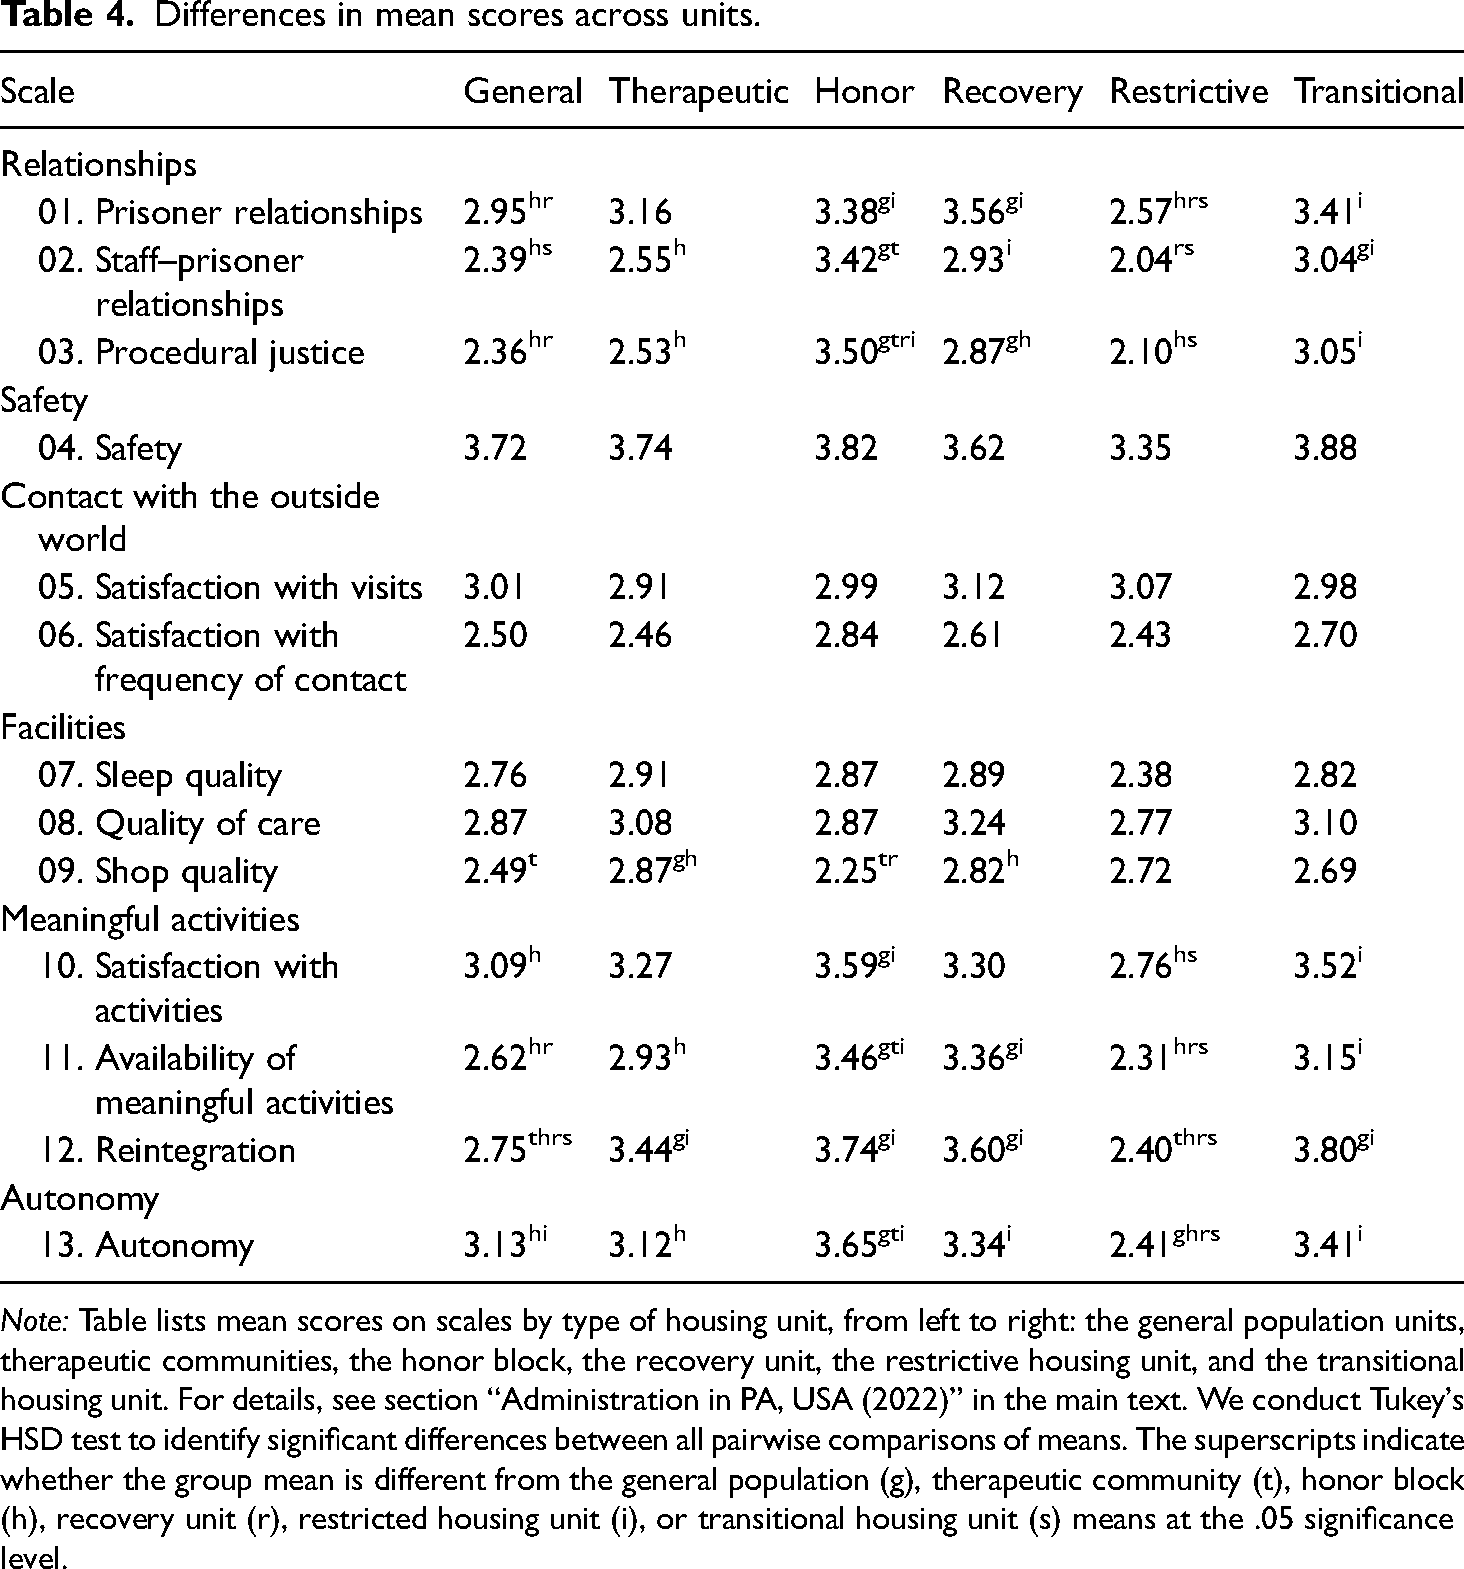
Note: Table lists mean scores on scales by type of housing unit, from left to right: the general population units, therapeutic communities, the honor block, the recovery unit, the restrictive housing unit, and the transitional housing unit. For details, see section “Administration in PA, USA (2022)” in the main text. We conduct Tukey's HSD test to identify significant differences between all pairwise comparisons of means. The superscripts indicate whether the group mean is different from the general population (g), therapeutic community (t), honor block (h), recovery unit (r), restricted housing unit (i), or transitional housing unit (s) means at the .05 significance level.
Criterion validity analyses
Results of tests of the PCQ's criterion validity are displayed in Table 5. 38 The dependent variables in columns 1 and 2 are an individual's overall satisfaction rating with the institution and their experienced sentence severity, respectively. Overall satisfaction with the institution is predicted by staff–prisoner relationships and the availability of activities. These two factors also predict overall satisfaction with the institution in the NL, although more factors are statistically significant in the Dutch context. Note that, in both contexts, staff–prisoner relationships emerge as a key predictor of satisfaction with the institution in the regression analyses, reinforcing the established notion that staff–prisoner relationships are particularly salient for the quality of prison life (Liebling and Arnold, 2004). Like in the Dutch results, demographics and sentence characteristics of respondents incarcerated in the PA facility are largely unrelated to overall satisfaction with the institution. 39
Criterion validity.
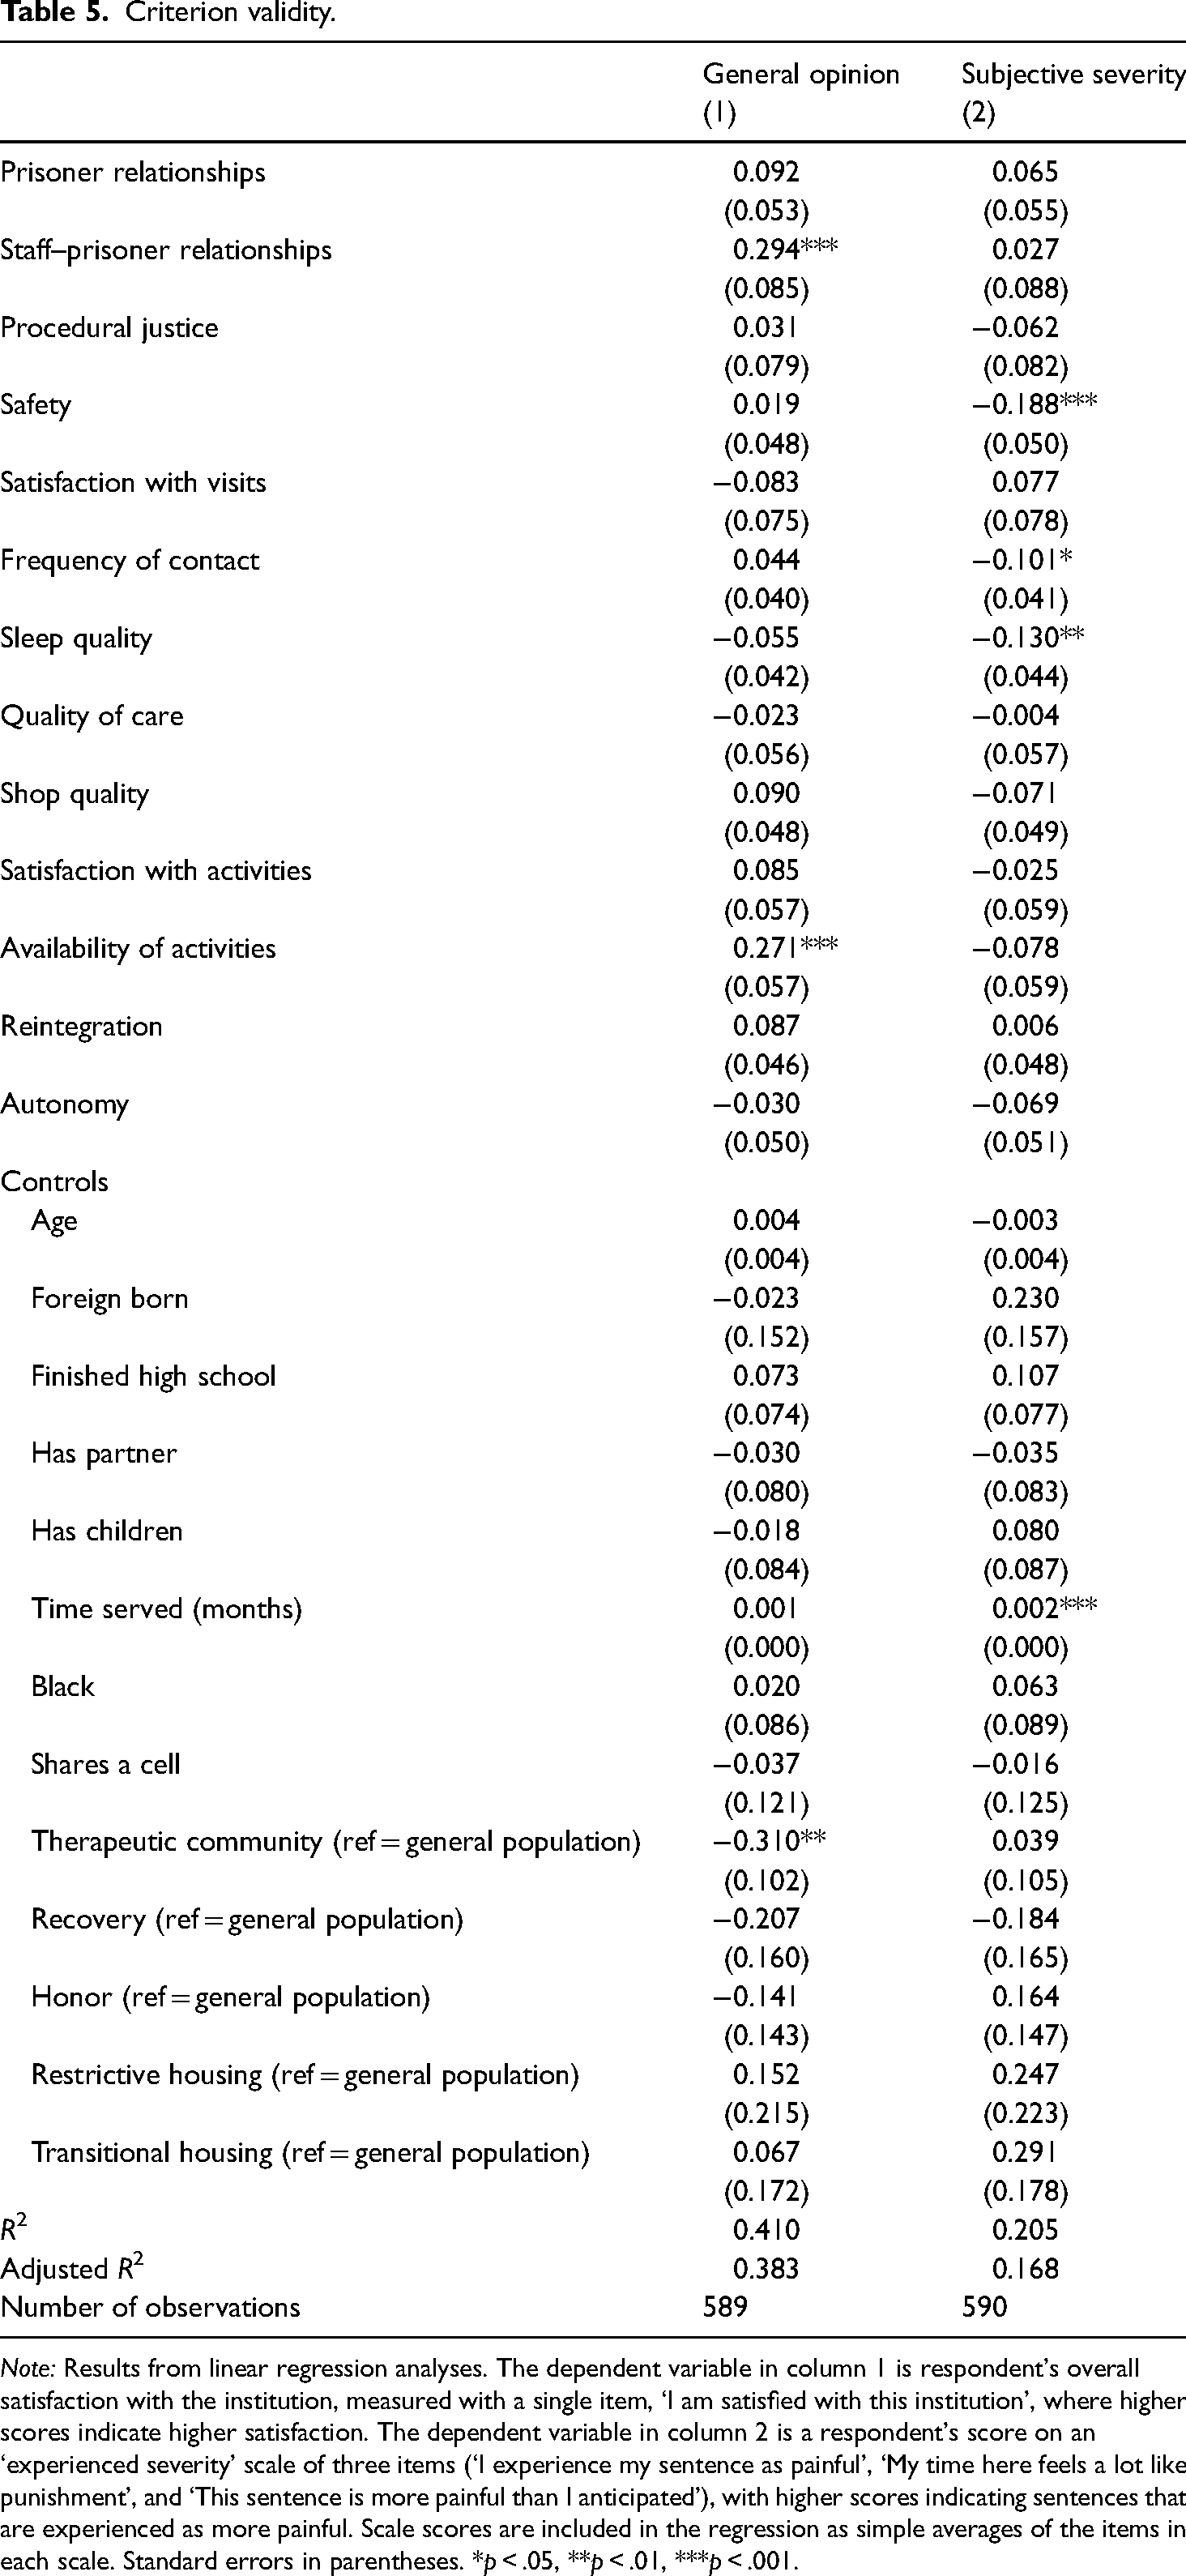
Note: Results from linear regression analyses. The dependent variable in column 1 is respondent's overall satisfaction with the institution, measured with a single item, ‘I am satisfied with this institution’, where higher scores indicate higher satisfaction. The dependent variable in column 2 is a respondent's score on an ‘experienced severity’ scale of three items (‘I experience my sentence as painful’, ‘My time here feels a lot like punishment’, and ‘This sentence is more painful than I anticipated’), with higher scores indicating sentences that are experienced as more painful. Scale scores are included in the regression as simple averages of the items in each scale. Standard errors in parentheses. *p < .05, **p < .01, ***p < .001.
Notably, the scales that predict experienced sentence severity are different from the scales predicting an individual's overall opinion of the institution, with people who feel less safe and who report poorer quality of sleep experiencing their sentence as more severe in both contexts, while staff–prisoner relationships and the availability of activities, which most strongly predict individuals’ overall opinion of the institution, are not significant predictors of experienced sentence severity. Time served significantly predicts experienced sentence severity in PA but not in the NL, which likely reflects the fact that Dutch sentences are much shorter. It is notable that the prison climate scales explain only a relatively small share of the variance in experienced sentence severity, with the prison climate scales increasing the adjusted R2 from .07 to .17 (PA) and .05 to .12 (NL) compared with models that include control variables only. In contrast, adding the prison climate scales to a model that included just control variables increased the adjusted R2 of the model on overall satisfaction with the institution from .07 to .38 (PA) and from .06 to .54 (NL). These results confirm that the prison climate scales capture an ‘overall institution rating’ but cast doubt on the idea that the pains of imprisonment vary directly with conditions of confinement, at least as measured in this survey.
Exploratory factor analysis
Finally, the results from the exploratory factor analysis are shown in Table 6. The leftmost column of this table lists the preassumed structure of the survey, specifying which scale the authors of the original PCQ hypothesized an item belonged to. Columns 1–6 present the factor that the item loaded onto alongside its associated factor loading, for three datasets—a dataset in which missing data has been imputed (columns 1 and 2), a dataset with complete cases only (columns 3 and 4), and a dataset in which we delete missing data pairwise (columns 5 and 6), which are most comparable with the results previously published in Bosma et al. (2020) (columns 7 and 8). To ensure that the reader can compare results with those previously published in Bosma et al. (2020), we display factor loadings for all items. Items with factor loadings lower than .40 are grayed out. Where items double-load on multiple scales, we retain the highest factor loading, listing the factor on which an item double-loaded in the superscript.
Exploratory factor analysis.
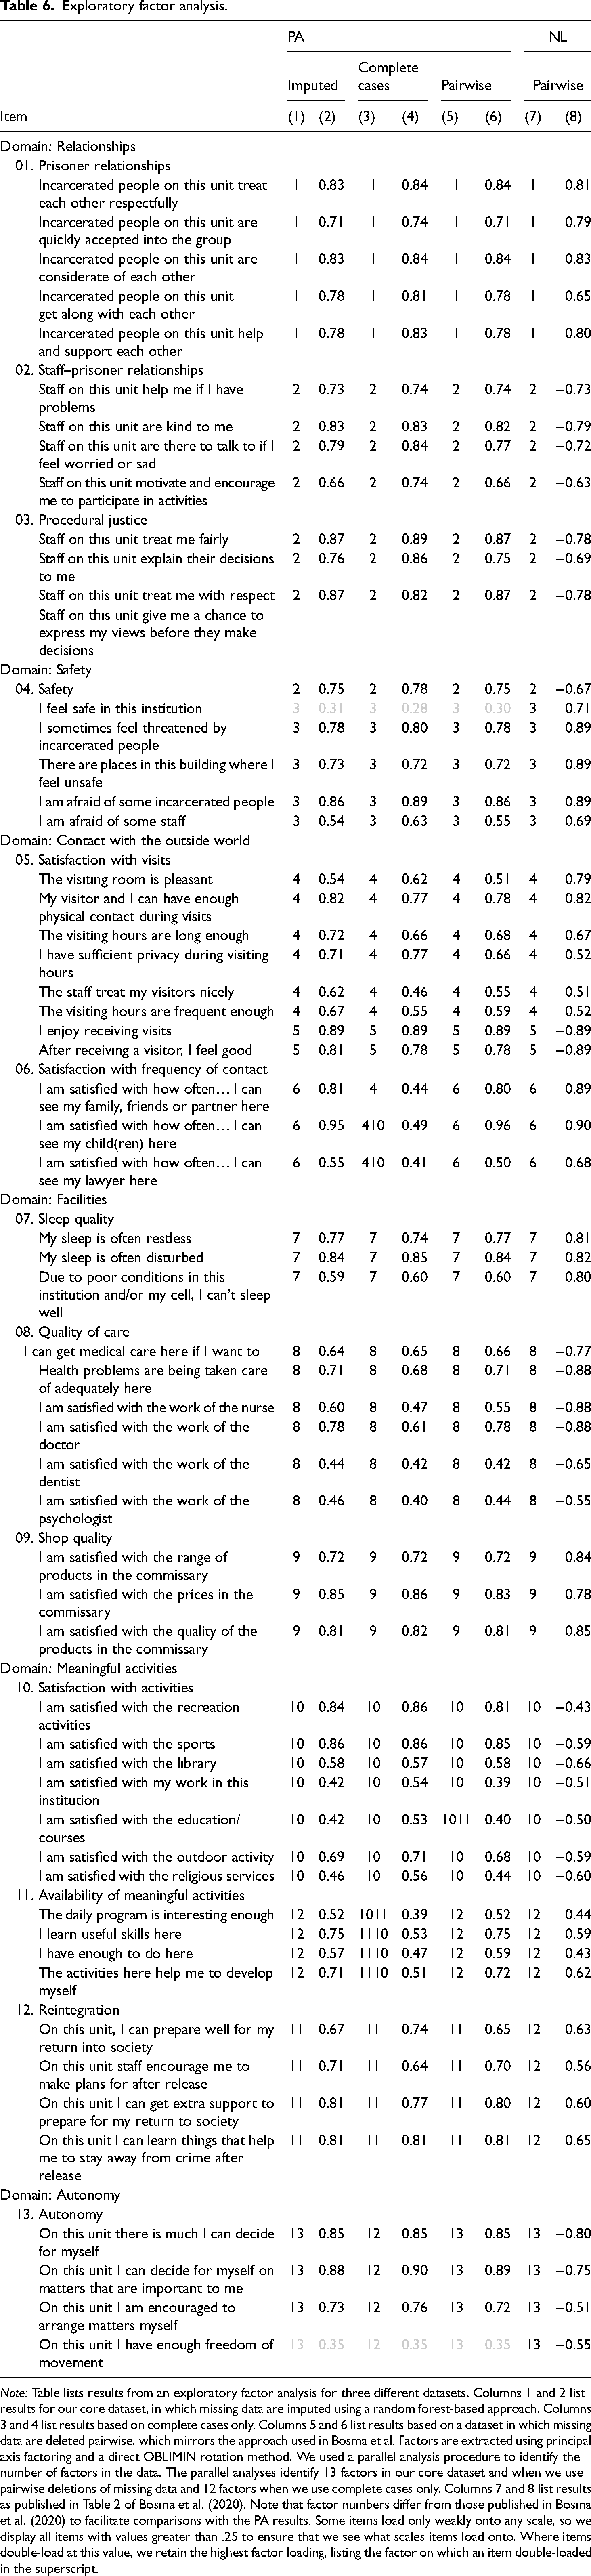
Note: Table lists results from an exploratory factor analysis for three different datasets. Columns 1 and 2 list results for our core dataset, in which missing data are imputed using a random forest-based approach. Columns 3 and 4 list results based on complete cases only. Columns 5 and 6 list results based on a dataset in which missing data are deleted pairwise, which mirrors the approach used in Bosma et al. Factors are extracted using principal axis factoring and a direct OBLIMIN rotation method. We used a parallel analysis procedure to identify the number of factors in the data. The parallel analyses identify 13 factors in our core dataset and when we use pairwise deletions of missing data and 12 factors when we use complete cases only. Columns 7 and 8 list results as published in Table 2 of Bosma et al. (2020). Note that factor numbers differ from those published in Bosma et al. (2020) to facilitate comparisons with the PA results. Some items load only weakly onto any scale, so we display all items with values greater than .25 to ensure that we see what scales items load onto. Where items double-load at this value, we retain the highest factor loading, listing the factor on which an item double-loaded in the superscript.
Table 6 shows that the factor mapping aligns with the originally envisioned scale structure for 9 out of the 13 scales in the PA data. Notably, it shows that all three scales that showed unexpected factor mappings in the Dutch survey (discussed in section “Administration in the NL (2017)” above), ‘rebel’ in almost identical ways in the PA results. First, like in the Dutch results, the satisfaction with procedural justice and staff–prisoner relationships items load on the same factor in all three datasets. Second, the same two items (‘I enjoy receiving visits’ and ‘after receiving a visit, I feel good’) that split off from the satisfaction with visits scale in the NL also consistently split off from this scale in the PA results. The PA results also point toward some overlap between the satisfaction with visits scale and the frequency of contact scale in the dataset that includes only complete cases. Third, the ‘availability of meaningful activities’ items and the reintegration scale overlap largely in the factor analysis based on complete cases (see columns 3 and 4). 40 This mirrors the Dutch results, in which these two scales also mapped onto the same factor. In the PA data, we further observe some overlap between the availability of meaningful activities scale and the satisfaction with activities scale, with the items about work and education double-loading onto both of these scales in two out of the three datasets. The fact that unexpected factor mappings in the Dutch survey appeared in almost identical ways in the PA results clearly points to areas where the factor structure of the PCQ could be improved.
Results differed depending on whether missing data was imputed (columns 1 and 2), deleted pairwise (columns 5 and 6), or restricted to complete cases (columns 3 and 4). This suggests that there are systematic differences between individuals who do and do not answer all questions. 41 We will discuss this issue further in the section ‘Lessons for Comparative Prison Research: Towards Standardized Prison Climate Scales?’
Taken together, the results of these psychometric analyses show that the PCQ appears no less suitable for use in PA than it is in the NL. This is remarkable given the substantial differences in correctional contexts across the two countries and suggests that the survey captures an underlying essence of prison climate that many contexts share. Perhaps more strikingly, notable patterns in the Dutch psychometric analyses were consistently replicated in the analyses reported here. These shared patterns clearly point to areas where the structure of the survey can be improved. For example, items that did not load onto the correct scale in both surveys should be substantially revised or dropped altogether from future iterations of the survey.
Lessons for comparative prison research: Toward standardized prison climate scales?
This study adds to a small but growing literature that tests the psychometric properties of prison climate surveys outside of contexts for which they were originally designed. 42 That the PCQ, administered with minimal adaptations, demonstrates good psychometric properties in the USA, where correctional environments are notably different from those in the NL, is perhaps testament to the essential similarities of custodial environments across the Western world. Our findings are meaningful because they suggest that the PCQ is likely to be suitable for use in much of the USA as well as in Europe, where correctional environments generally differ less from those in the NL. These observations almost inevitably lead to questions about the potential for comparative research on prison climate that uses these surveys. To conduct meaningful comparisons, however, we need evidence of measurement invariance across contexts in addition to evidence of a survey's psychometric properties in those contexts. While researchers have started to compare prison climates across institutions, places, and times, they have generally done so without demonstrating formal evidence of measurement invariance. This is problematic because it means that we do not know whether a comparison of scores across groups of respondents reflects true differences or measurement differences (Leitgöb et al., 2023). The literature's foundation for comparative prison climate research, then, is much weaker.
Measurement invariance across contexts is much easier to achieve with surveys that are explicitly designed for comparative use, using items that maximize comparability (Fitzgerald and Jowell, 2010; Harkness, 2011; Leitgöb et al., 2023). Existing prison climate surveys—including the PCQ—were originally designed for use in a specific national context. While they have later been used in or adapted to other contexts, none have been explicitly designed and standardized for comparative use. Given that the three most prominent prison climate surveys have all been developed in Europe—the EssenCES was originally developed in Germany, the MQPL in the UK, and the PCQ in the NL—there seems to be much potential to learn from the existing literature to develop a pan-European prison climate survey with standardized scales intended for comparative use.
With this ambitious long-term goal in mind, we limit ourselves here to a modest contribution. In this section, we briefly discuss three lessons from the Dutch/PA collaboration that could inform efforts to design new prison climate instruments or adapt existing ones for use in comparative prison climate research. In doing so, we link specific observations about the PCQ to general guidance from the comparative survey literature as well as to broader literatures on survey measures of organizational climate.
First, items of differential relevance to different subgroups within and across contexts can reduce the comparability of items and scales. The PCQ includes items that are relevant only to subgroups who have used specific services or who have participated in certain activities, alongside more generic items that can be answered independently of prior service use. While everyone can answer the question ‘I can get medical care here if I want to’, only some people can answer the question ‘I am satisfied with the work of the psychologist’. The PCQ accommodates respondents who had no experience with specific services or activities (yet) by providing a ‘not applicable’ answer option. We have already discussed how the choice of method for dealing with such and other missing data can meaningfully affect study conclusions. In comparative contexts, these issues deepen. Different prisons offer different services, and the institutional and cultural barriers to accessing commonly offered services also differ across settings. By implication, a much larger share of people will have something to say about the work of the psychologist where psychology services are routinely provided than in settings where such services are much harder to access. What appears to be much stronger or more diverse opinions about psychology services can, in such instances, reflect differences in access rather than opinions. In other cases, issues of differential relevance arise in more subtle ways. An item like ‘staff encourage me to make plans for after release’ is much more likely to invoke a ‘no opinion’ option in PA than in NL because there are many more people who have no prospect of being released (ever or in the near future). Differential relevance can thus lead to differential non-response levels, which in turn can introduce bias (Couper and de Leeuw, 2002). Importantly, these issues are particularly difficult to deal with when items with differential relevance to different subgroups are combined within the same scale. To resolve this problem, comparative survey researchers sometimes combine a common ‘core’ of items that are assumed to be universally relevant (regardless of individual characteristics, prior service use, or national context), with items in optional modules that are relevant to specific subgroups only or are only used for a country-specific population (Harkness, 2011).
Second, what parts of prison life happen at the level of the housing unit varies across contexts, creating difficulties with items that explicitly refer to a respondent's housing unit. Some items/scales in the original PCQ specifically ask about elements of climate at the institutional level, whereas others refer explicitly to the unit on which a respondent resides. Researchers have long recognized the importance of housing units (or treatment groups) within prisons (Saylor, 1984; van der Helm et al., 2011), and differences between institution- and unit-level provisions are what prompted item-level references to ‘the prison’ or ‘your unit’ in the PCQ. While such distinctions are also salient in PA, what is primarily provided at the level of a housing unit, and what is organized centrally for all individuals housed in the facility, varies between the two countries. As discussed in section “Administration in PA, USA (2022)” above, these differences prompted the PA research team to adapt three further scales to focus on the unit, thus introducing differences in the two surveys. We note that the appropriateness of asking questions at the unit versus the prison level may also vary both across and within prisons within the same country. Items included in standardized prison climate scales intended for comparative use should thus avoid such context-specific leveling distinctions. As above, where unit-level provisions are of particular interest, they could be included in optional modules.
Third, our exercise highlighted a lack of clarity about the level of analysis in the PCQ. Researchers of organizational climate in other institutions like schools and hospitals distinguish between psychological climate and organizational climate as two conceptually distinct areas of study (Schneider et al., 2013). Researchers interested in the former typically study individual experiences of climate 43 ; researchers studying climate as an attribute of an organization, however, are typically interested in aggregating climate features to the organizational level and therefore use items that refer to the level of aggregation (Schneider et al., 2013). The PCQ mixes items that refer to attributes of the prison with items that tap into individual-level perceptual and psychological variation. For example, the items ‘I enjoy receiving visits’ and ‘After receiving a visitor, I feel good’ concern how individuals feel about visits, whereas the remaining six items focus on the quality of the visiting facilities and the nature of visit policies. This may explain why these items split off from the other items on visitation in both the NL and PA. While correctional managers can ensure that visiting environments are pleasant and that visiting policies are accommodating, visits are highly emotionally charged events in prison (Cochran and Mears, 2013; de Jong et al., 2022; Siennick et al., 2013; Turanovic and Tasca, 2019), and how one feels after a visit is likely to depend on many personal factors—not least because the nature of an incarcerated person's relationship to their visitors will vary. The use of items that tap into individual-level variation may also explain why the safety scale correlated so weakly with other scales and why safety scores hardly varied across units. By asking respondents whether they are ‘afraid’ or ‘feel threatened’, the items on the safety scale tap into feelings of vulnerability and fear, which research has documented may vary as much with individuals’ past experiences as with facility-level measures of safety (Edgar et al., 2003; Mulvey et al., 2010). Thus, when scales mix items that tap into individual-level variation with items that tap into facility-level variation, observed differences may reflect both differences in organizational functioning and population differences that are outside of the control of prison management.
Discussion
In this article, we have discussed the lessons learned from using the PCQ in one PA SCI. We showed that the PCQ's factor structure, reliability, and validity were good in this context and that the survey appears no less suitable for the PA context than for the Dutch one. We also showed that the psychometric properties of the survey were remarkably similar in the NL and PA. Specifically, the fact that all three scales that showed unexpected factor mappings in the Dutch survey ‘rebelled’ in almost identical ways in the PA results, clearly points to areas where the factor structure of the PCQ could be improved. The close replication of psychometric patterns in the two contexts adds weight to suggestions in Bosma et al. that select survey items should be revised or deleted. Future iterations of the PCQ should be revised in accordance with the findings in this article, and future research should continue to test the psychometric properties of the PCQ in other settings.
A key limitation of this study is that, because of formal restrictions on data sharing with members outside of the core research teams, we have been unable to pool the datasets from NL and PA to conduct a direct empirical comparison of the two sets of psychometric results. Instead, we have compared the psychometric analysis conducted on the PA data to results from a previously published study (Bosma et al., 2020). This has prevented us from conducting a formal test for measurement invariance across the two contexts. We note, however, that given our discussion in the section ‘Lessons for Comparative Prison Research: Towards Standardized Prison Climate Scales?’, such measurement invariance is more likely when surveys are explicitly designed for comparative use. Future research should intend to pool datasets, which would enable the calculation of statistical point estimates on differences between two sets of results.
This research has contributed to a small but growing literature that suggests that prison climate surveys are well positioned to measure prison climates in a range of contexts. Given the sizeable differences between the Dutch and PA correctional contexts, the findings presented here suggest that the PCQ is likely suitable for stand-alone use in most prison environments in Europe, which tend to more closely resemble the Dutch context. These observations also buttress a more general point: that two prisons that at first instance look very different still share a distinct identity as prisons, ‘a prison is a prison and feels like a prison according to most prisoners’ (Neubacher et al., 2021: 5). Life within many prison facilities in Europe, the USA, and other developed countries follows the cadence of a daily regime that offers some mix of work, education, treatment, care, and recreation within a framework in which both the control of movement and maintenance of safety takes center stage. Nevertheless, prisons that are very similar in terms of population, architecture, resourcing, and functions can differ meaningfully in their quality of life (Liebling, 2011). Prison climate surveys, then, have the potential to shed light on both what prisons share and what differences between them meaningfully affect life inside them.
To realize the comparative value of prison climate instruments, however, we need more than psychometric tests alone; we would ideally use a survey that is explicitly designed and standardized for comparative use. Given that the three prison climate surveys that are most actively used—the MQPL, the EssenCES, and the PCQ—all originated in Europe, the prospect of developing a pan-European prison climate survey that draws on lessons from the existing literature seems particularly promising. 44 Drawing on our experience of administering this survey in two contexts, we have discussed some general lessons that we hope will be useful for researchers intending to design such comparative survey instruments of prison climate. Specifically, we highlighted examples of differential item relevance across contexts and technical issues in scale construction arising from the level-of-analysis issues. A thoroughly tested European prison climate survey suitable for comparative analyses would create myriad opportunities for future research. Much can be learned, for example, from simply comparing the relative positioning of scale scores across contexts. Comparing the effects of similar interventions and policy changes across contexts with different ‘baseline’ climates could also help answer long-standing questions about the environmental requirements for such interventions to thrive.
Supplemental Material
sj-docx-1-euc-10.1177_14773708241290036 - Supplemental material for Measuring prison climate across contexts: Lessons from administering the Prison Climate Questionnaire in the USA
Supplemental material, sj-docx-1-euc-10.1177_14773708241290036 for Measuring prison climate across contexts: Lessons from administering the Prison Climate Questionnaire in the USA by Britte van Tiem, Paul Nieuwbeerta, Synøve N. Andersen, Jordan M. Hyatt and Hanneke Palmen in European Journal of Criminology
Footnotes
Declaration of conflicting interests
The author(s) declared no potential conflicts of interest with respect to the research, authorship, and/or publication of this article.
Funding
The author(s) disclosed receipt of the following financial support for the research, authorship, and/or publication of this article: Time spent by Britte van Tiem, Jordan M. Hyatt, and Synøve N. Andersen on this research was supported by a grant from Arnold Ventures.
Supplemental material
Supplemental material for this article is available online.
Notes
References
Supplementary Material
Please find the following supplemental material available below.
For Open Access articles published under a Creative Commons License, all supplemental material carries the same license as the article it is associated with.
For non-Open Access articles published, all supplemental material carries a non-exclusive license, and permission requests for re-use of supplemental material or any part of supplemental material shall be sent directly to the copyright owner as specified in the copyright notice associated with the article.